Nutrition and food habits & Urban Agriculture in Cape Town
←
→
Page content transcription
If your browser does not render page correctly, please read the page content below
www.UFISAMO.org

                  Nutrition and food habits & Urban
                  Agriculture in Cape Town
                  A desktop study for the Urban Agriculture for Food Security
                  and Income Generation in South Africa and Mozambique
                  (UFISAMO)

                         This project is financially supported by the German
                         Federal Ministry of Food and Agriculture (L) based on a
                         decision of the Parliament of the Federal Republic of
                         Germany through the Federal Office for Agriculture and
                         Food (BLE)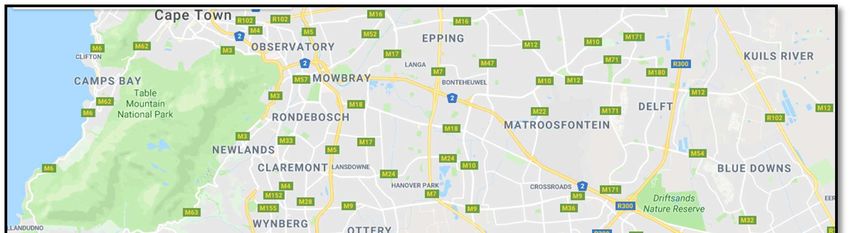
UFISAMO
Urban Agriculture for Food Security and Income Generation in South Africa and
Mozambique

UFISAMO is a research project financed by the Federal Ministry for Food and
Agriculture. It is an international and interdisciplinary cooperation between:

                  Humboldt-Universität zu Berlin, Centre for Rural Development,
                  Berlin, Germany
                  Humboldt-Universität zu Berlin, Thaer-Institute of Agricultural
                  and Horticultural Sciences, Berlin, Germany

                  Freie Universität Berlin, FAO Reference Centre for Veterinary
                  Public Health,
                  Department of Veterinary Medicine, Berlin, Germany

                  University Eduardo Mondlane, Faculty of Arts and Social
                  Sciences, Maputo, Mozambique
                  University Eduardo Mondlane, Department of Veterinary
                  Medicine, Maputo, Mozambique

                  University of the Western Cape, Institute for Social Development,
                  Bellville, South Africa
                  University of the Western Cape, Department of Geography,
                  Environmental Studies & Tourism, Bellville, South Africa

                  Frankenförder Forschungsgesellschaft mbH, Luckenwalde,
                  Germany

                  Technical Secretariat for Food Security and Nutrition, Maputo,
                  Mozambique

                  Abalimi Bezekhaya, Cape Town, South Africa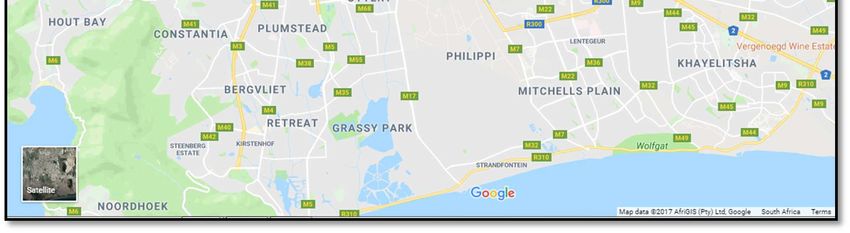
Haidee Swanby

Nutrition and food habits & Urban
Agriculture in Cape Town

 A desktop study for UFISAMO

 April 2018

  haidee@polka.co.za
  www.UFISAMO.org
Preface   i
Preface
   Since March 2016, the Federal Ministry of Food and Agriculture (BMEL)
supports a project on urban agriculture in Cape Town and Maputo: „UFISAMO-
Urban Agriculture for Food Security and Income Generation in South Africa and
Mozambique”. The objectives of the project are to contribute to improved food
and nutrition security of segments of the poor urban population and to increased
income generation by optimizing production, processing and marketing of
agricultural and livestock products.
   Applicability of research results is in the foreground: all components of the
project are expected to generate information that can be “translated” into good
practice examples, extension material, demo-plots, capacity development etc. The
project conducts research on a broad variety of topics:
      Urban agriculture value chains
      Opportunities and challenges of urban agriculture
      Urban agriculture research and education network
      Local capacity development and knowledge exchange through transferring
      research results into policies and practices
   Research is being conducted by PhD students of HU and UEM as well as students
from all concerned universities and complemented by short expertise by
consultants.
   The present study focuses on food and nutrition security, food habits and the
connection to urban agriculture in Cape Town.

Dr. Karin Fiege                        Erik Engel
Project Leader                         Project Coordinator
Centre for Rural Development (SLE)     Frankenförder Forschungsgesellschaft
Humboldt-Universität zu Berlin         Berlin / Luckenwalde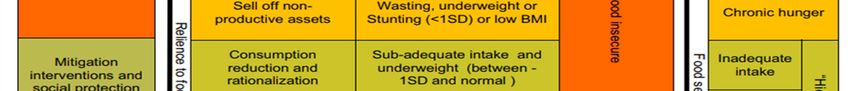
Executive summary   iii
Executive summary
   Measurement of food and nutritional security is complex and political with on-
going debates about the causes and potential solutions to these problems.
Coherent, detailed and comparable statistics on the nutritional status of the South
African population are currently lacking.
    Despite South Africa’s status as a middle-income country that is nationally food
secure, hunger, under-nutrition and obesity are prevalent and growing issues. For
example, a quarter of South African children are stunted due to malnutrition and
54% of households are categorised as food insecure, while rates of obesity,
particularly amongst women, rank amongst the highest in the world. Incidence of
obesity in women in the Western Cape is above the national average. Diseases
related to obesity include diabetes and hypertension. In 2017 the primary cause of
death in South Africa for women was diabetes, which has now surpassed
tuberculosis.
    Some of the reasons for hunger and obesity include high urbanisation rates
associated with a “nutrition transition” to calorie dense but nutritionally deficient
foods, high levels of poverty and unemployment characteristic of the most unequal
society in the world, the proliferation of informal settlements and the structure of
South Africa’s food system, which operates on economies of scale, is intensely
concentrated, locks out small producers and entrepreneurs from economic activity
while producing and marketing nutritionally deficient foods. In Cape Town in
particular, spatial segregation, a hangover from the apartheid regime, plays a
powerful role in shaping access to income and the types of food that are available
and convenient. The locations of UFISAMO’s research focus, Khayelitsha and
Mitchell’s Plain, rank amongst the most impoverished, far flung and under-serviced
communities in Cape Town. The incidence of hunger and mal-nutrition (which can
also include obesity) in these communities is extremely high. Factors that play a
role in the food and nutrition security of households in Cape Town include
unemployment, informal housing, access to social grants, and dietary diversity.
“Hungry seasons” also occur when employment opportunities dip due to seasonal
availability. Migrants are particularly vulnerable to hunger due to higher levels of
exploitation and no access to social protection. Households cope with hunger in a
number of ways, including cutting back on size and number of meals, eating cheap
calorie dense foods and relying on credit for groceries.
  The Western Cape government is supportive of urban agriculture (UA) as a
mechanism to ameliorate hunger and under nutrition in the Province. It is the only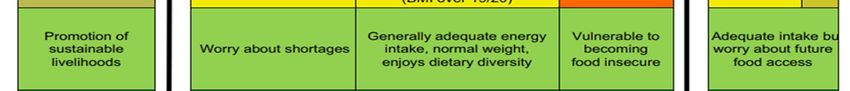
Executive summary   iv
province that has developed policy specifically to nurture urban agriculture.
However, the Urban Agriculture Unit is not currently operating due to a lack of staff.
A plethora of non-governmental organisations provide technical support to
community-based projects focused on urban agriculture. It has been found that at
least 2% of food insecure households engage in the production of their own food.
Those with access to a state pension are particularly prone to produce their own
food. While the rationale from government, NGOs and donors for promoting urban
agriculture is to contribute to livelihoods, it has been found that income generation
tends to be small/negligible. Instead, urban agriculture is valued for increase of
nutritional diversity and an array of social benefits including social cohesion and
well-being associated with working in nature.
   Recommendations for urban agriculture work to promote food and nutritional
security in low income areas of Cape Town include:
   1. Acknowledging low income generation from urban agriculture in Cape Town
      and shift project goals accordingly;
   2. Locating UA activities within the context of Cape Town’s agro-food system
      and the spatial reality of communities to create resilient projects;
   3. Contributing to local economies and local nutrition instead of selling fresh
      and nutritious product out into affluent communities;
   4. Targeting youth and building political awareness about structural causes of
      hunger and malnutrition;
   5. Planning for hungry seasons;
   6. Assessing key gaps in the UA support community that UFISAMO can fill; and
   7. Addressing high level of donor dependency and low level of community
      ownership of UA projects.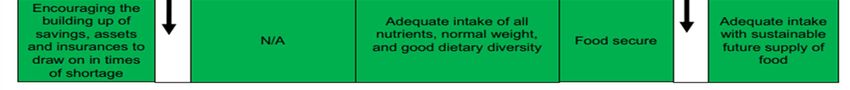
Table of contents      v
Table of contents

Preface .............................................................................................. i

Executive summary ........................................................................... iii

Table of contents ............................................................................... v

List of tables .................................................................................... vii

List of figures...................................................................................viii

Acronyms ......................................................................................... ix

1 Introduction ................................................................................. 1
    1.1 Structure of this paper .............................................................................3

2 Background – the South African agro-food system ........................... 5

3 Poverty, hunger and under-nutrition in South Africa ........................ 9
    3.1 Urban hunger and nutrition transition .................................................... 10
    3.2 HIV/Aids ................................................................................................14

4 The Western Cape ....................................................................... 17
    4.1 Cape Town ............................................................................................ 18
    4.2 Mitchell’s Plain and Khayelitsha ............................................................ 20

5 Food Security and Nutrition in Cape Town and particularly low-income
  areas .......................................................................................... 23
    5.1 Unemployment and income in Cape Town .............................................25
    5.2 Housing type and access to food ............................................................ 27
    5.3 Social protection ...................................................................................30
    5.4 Dietary Diversity ....................................................................................30
    5.5 Hungry seasons ..................................................................................... 32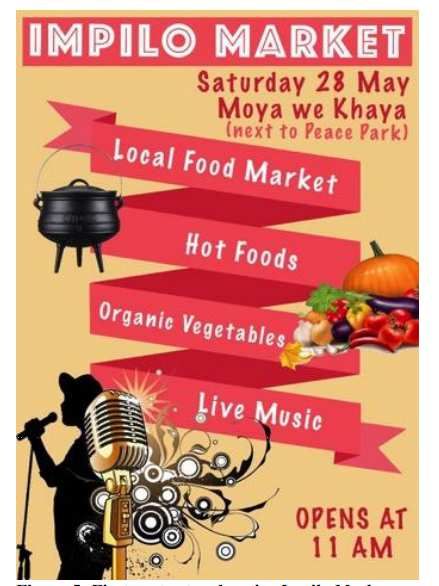
Table of contents      vi
    5.6 Coping Strategies .................................................................................. 33
    5.7 Migrants ................................................................................................ 33

6 Western Cape Policy environment ................................................ 34
    6.1 Western Cape Household Food and Nutrition Security Strategy .............34
    6.2 Provincial policies impacting on food and nutrition security.................... 37
    6.3 National and regional strategies and policies impacting on food and
        nutrition security ...................................................................................38
    6.4 Urban Agriculture Policy ........................................................................39

7 Urban agriculture in Cape Town .................................................... 43
    7.1 Introduction ..........................................................................................43
    7.2 Good Practice in Urban Agriculture in Cape Town ................................. 46
          7.2.1 Abalimi Bezekhaya ......................................................... 47
          7.2.2 Impilo Health Market ...................................................... 49

8 Recommendations ...................................................................... 53

Bibliography .................................................................................... 57

Annex 1: The continuum of food security to food insecurity ................. 60

Annex 2: Urban Agriculture Policy: type of assistance per category ...... 61
List of tablesvii
List of tables
Table 1: Snapshot of hunger and nutrition indicators in South Africa ................... 10
Table 2: Pros and cons of retail outlets in poorer income areas ........................... 28
Table 3: Overview of provincial policies impacting FNS ....................................... 37
Table 4: Classification of benefits of urban agriculture ....................................... 40
Table 5: Cost analysis for vendors at Impilo market ............................................. 51
List of figures viii
List of figures
Figure 1: Levels of food insecurity in South Africa ................................................ 9
Figure 2: Poverty headcount by settlement type (UBPL) 2006, 2009, 2011 and 2015
............................................................................................................ 11
Figure 3: Food insecurity in urban and rural areas in South Africa ........................ 12
Figure 4: Comparative nutrition statistics - South Africa and Western Cape.........14
Figure 5: HIV prevalence across age groups 2009 – 2016 ..................................... 15
Figure 6: Western Cape overview map ................................................................ 17
Figure 7: Map showing Mitchell’s Plain and Khayelitsha relative to the economic
centre in Cape Town ............................................................................ 20
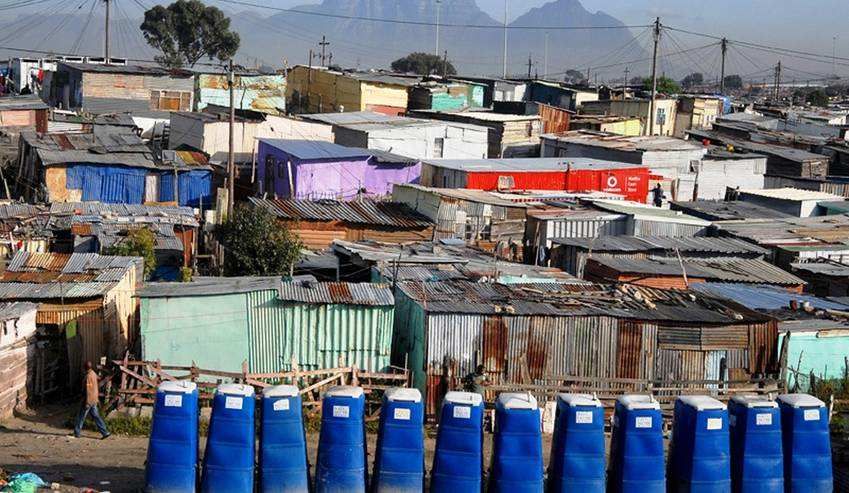
Figure 8: Shared chemical toilets in Khayelitsha ................................................. 21
Figure 9 Key demographic statistics in Mitchell's Plain and Khayelitsha ............. 22
Figure 10: Prevalence of food insecurity by income in Cape Town ...................... 24
Figure 11: Rates of unemployment in Cape Town by race (2012) .........................25
Figure 12: Household income and household structure in three low income areas of
Cape Town ........................................................................................... 27
Figure 13: Food security in low income areas by housing ................................... 28
Figure 14: Types of food sold by surveyed traders in Mitchell’s Plain and Khayelitsha
........................................................................................................... 29
Figure 15: Foods eaten by low-income households in Cape Town the previous 24
hours.................................................................................................... 32
Figure 16: Western Cape food governance structure ...........................................36
Figure 17: View of a garden ................................................................................. 47
Figure 18: The sustainable development continuum for organic micro-farming
projects ............................................................................................... 48
Figure 19: Advertising for the Impilo health market ........................................... 50Acronyms ix
Acronyms
AFSUN African Food Security Urban Network
ANC African National Congress
CFS Committee on World Food Security
BFAP Bureau for Food and Agricultural Policy
EPWP Extended Public Works Programme
GWC Government of the Western Cape
HDDS Household Dietary Diversity Score
NCD Non-communicable diseases
NGO Non-governmental organisations
SADC Southern African Development Community
SAFSC South African Food Sovereignty Campaign
SANHANES South African National Health and Nutrition Examination
Survey
SDECD Social Development and Early Childhood Directorate
SJC Social Justice Coalition
UA Urban Agriculture
UAU Urban Agriculture Unit
UFISAMO Urban Agriculture for Food Security and Income Generation in
South Africa and Mozambique
URP Urban Regeneration ProgrammeIntroduction 1
1 Introduction
Urban Agriculture for Food Security and Income Generation in South Africa and
Mozambique (UFISAMO) is investigating how improved production and marketing
methods for urban agriculture can increase nutrition, food security and incomes in
Mozambique and South Africa. Research in this project is geared toward identifying
good practices and contributing towards the implementation of such practices, for
example, through the production of extension material, demo-plots, capacity
development and vocational training of farmers (UFISAMO).
UFISAMO has commissioned a study toward achieving the objectives of its
activities in Cape Town, South Africa, to further understand food and nutrition
habits - including hunger and nutrition statistics, food habits, changes, trends, key
challenges, good practices and key stakeholders. UFISAMO’s research is focused in
the districts of Khayelitsha and Mitchell’s Plain.
The Committee on World Food Security (CFS), describes “Food Security” as a
situation where all people, at all times, have physical and economic access to
sufficient, safe and nutritious food to meet their dietary needs and food
preferences for an active healthy life”. (CFS 2012 as per the FAO 1996 definition).
(Hendriks, S. H. 2015) However, the underlying causes of food insecurity and how
to achieve food security is contested and highly politicised terrain. Hendriks
maintains that “there is a lack of consensus on the relationships between hunger,
malnutrition and food insecurity” (Hendriks, S. H. 2015:609), which frustrates
efforts to design policies and programmes to address this multi-faceted and
complex problem.
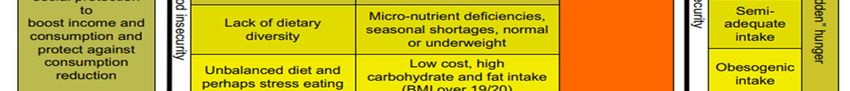
In their Strategic Framework for Household Food and Nutrition Security, the
Government of the Western Cape (GWC) has adopted a matrix that sets out levels
of food security/insecurity and the concomitant consequences and responses on a
continuum. This approach, developed by Sheryl Hendriks, can be an effective a
diagnostic tool that picks up early indicators of food insecurity that might otherwise
be missed. It is based on recognition that our understanding of food insecurity is
incremental and developing as “new research in a variety of food-deprived and
nutrition-deprived contexts reveals causes, experiences and consequences and
how they are interlinked”. (Hendriks, S. H. 2015:609) Hendriks’ food insecurity
framework, which is set out in Annex 1, lists the stages of food security to insecurity
as follows:
• Adequate intake with sustainable future supply of food;
• Adequate intake but worry about future food access;Introduction 2 • Hidden hunger (including inadequate and obesogenic intake of food); • Chronic hunger; • Acute hanger; and • Starvation. Each stage has its own indicators and potential response strategies. A wide variety of interventions are necessary by the state across these complex stages of food insecurity, for example improving social safety nets, promoting breast feeding, enabling easier access to land, reigning in corporate anti-competitive behaviour in the food sector or creating enabling environments for own food production. These interventions also require other actors in society, such as NGO’s, business, health professionals and others, to contribute appropriately. The WCG has historically supported urban agriculture as its major, almost sole, response to urban food insecurity. As a result, it is the only province in the country that has specific policy and programmes dedicated to promoting and nurturing urban agriculture. However, in recent times there is a growing recognition from government of the need to take a more holistic view of urban food insecurity and radically broaden its scope of interventions beyond urban agriculture to embrace a “whole society approach) that acknowledges the complexity of the urban food system. (Government of Western Cape 2016) Nonetheless, urban agriculture remains a vital strategy within government to mitigate against urban food and nutrition insecurity and is well supported by a plethora of NGOs as well as government. To add to the complexity of designing effective interventions to combat food insecurity in the Western Cape and South Africa as a whole, fine grained and comprehensive data on nutritional status and habits is sorely lacking. A study which reviewed dietary surveys of the adult South African population between 2000 and 2015 found no national study conducted on adults. (Mchiza, Z.J., et al. 2015) The only national survey to date - the National Food Consumption Survey (NFCS), was conducted in 1999 and looked at children between the ages of 1 and 9 years old. According to Mchiza et al, due to this dearth of published data, “local, isolated and fragmented dietary intake studies have been used by nutrition professionals and decision-makers in an effort to understand the nutrient intake of adult South Africans”. (Mchiza, Z.J., et al. 2015:8228) A further frustration is that these studies use vastly different sample sizes and a variety of different measurements to assess nutrition. Their key recommendation was that there is need for a national nutrition
Introduction   3
monitoring system to identify dietary deficiencies in specific population groups as
this important data is currently lacking. (Mchiza, Z.J., et al. 2015)
    The African Food Security Urban Network1 (AFSUN) has been making welcome
contributions to this body of knowledge of the nutritional status of particular
populations since 2008. A major source of information for this research paper is
derived from the body of work generated by AFSUN, which is a research collective
that was established “to improve the knowledge base of the dimensions and causes
of urban food insecurity in Africa and to develop and advocate for international,
national and local policies to enhance food and nutrition security“. (AFSUN)
Unfortunately their research on nutritional status and habits covers Khayelitsha
and not UFISAMO’s other area of interest, Mitchell’s Plain. AFSUN’s research
includes a 2008 food security baseline survey carried out in Khayelitsha, Phillipi and
Ocean View and a follow up survey on the broader population of Cape Town in 2013,
a study on Cape Town’s food system commissioned by the city of Cape Town, as
well as further studies looking at food insecurity across various cities in the
Southern African Development Community (SADC) region.

1.1          Structure of this paper
   Section two gives a background on key features of South Africa‘s agrofood
system which was indelibly shaped by the apartheid regime and the neoliberal
policies of post-apartheid South Africa. The power dynamics that shape the formal
and informal food system has a profound impact on food and nutrition in south
Africa as well as implictions for emerging farmers
    Section three explores poverty, hunger and under-nutrition in South Africa and
compares the South African scenario with the Western Cape where possible, It also
touches on the largely ignored phenomenon of urban hunger and the nutrition
transition. It highlights the HIV/Aids epidemic in South Africa, which effects many
of the same poverty stricken communities also burdened with food insecurity. A
snaphshot of hunger and nutrition indicators in South Africa is given.
  Section four briefly introduces the demographics of the Western Cape, Cape
Town and two of UFISAMO’s focus areas, Khayelitsha and Mitchell’s Plain.
   Section five goes on to explore food and nutrition insecurity in low-income areas
of the Western Cape through the lense of several determinants, namely

1
    http://www.afsun.org
Introduction 4
unemployment and income, housing and food access, social protection, dietary
diversity and hungry seasons.
Section six gives an overview of the Western Cape Policy environment related
to food security and urban agriculture.
Section seven provides insight into two cases of urban agriculture in Cape Town
– Abalimi Bezekhaya and the Imphilo Health Market.
Finally, section eight provides recommendations.Background – the South African agro-food system 5
2 Background – the South African agro-food system
When considering urban agriculture, particularly practiced by resource poor
people on marginal lands, it is important to place it within the context of South
Africa’s agrofood system2. Given that there is an overwhelming expectation from
government institutions, donors and NGOs that urban agriculture should
contribute to livelihoods and alleviate poverty, it is necessary to understand the
harsh reality of this sector that is undeniably skewed towards economies of scale
and those who are able to participate at that level.
South Africa’s agricultural production system is inextricably tied to apartheid
roots. It is unique on the continent in that it is dominated by a highly capitalised
large-scale industrial agricultural system that was nurtured in the apartheid era
through protectionist policies and subsidies, large scale land dispossession and
cheap labour (Helliker, K. 2013). The wholehearted adoption of neoliberal policies
by the democratic government has unfortunately entrenched the inequities that
were inherent in the old system rather than dismantled them (Greenberg, S. 2014).
The agriculture sector was liberalised post 1994 after many decades of
protection and support by the apartheid regime. In a bid to be globally competitive
(predominantly white) commercial farmers and corporate farms have intensified
industrial agricultural practices, for example, through increased mechanization and
adoption of agricultural technologies such as precision farming or genetically
modified (GM) crops (Haysom, G. 2014). Post-apartheid agricultural and trade
policy has led to a reduction in the number of farms and a consolidation of the
agricultural sector. Between 1990 and 2008 there was a 76% reduction in the
number of farmers in South Africa, practicing on increasingly bigger farms. It has
also led to a shift in production focus, with a marked increase in the production of
horticultural crops for export, most notably a massive growth in grape production
(Battersby, 2014).
Farm labourers remain the most marginalized group in South Africa and have
unionization levels below 4%. Since 2012 the ongoing appalling living and working
conditions, particularly in the Western Cape, have led to a number of militant
strikes. Key demands from farm workers have included permanent instead of piece
work, an increase of the minimum daily wage from R69 to R150, paid maternity
2
The totality of activities and institutions involved in the production and consumption of food. These
systems are complex, operating simultaneously at multiple levels of scale (from global to local) and time
(particularly with respect to the timing of outcomes). (Ledger, T. 2016)Background – the South African agro-food system 6
leave, an end to labour brokers and police brutality, as well as rent-free housing and
a moratorium on evictions (TCOE, 2016).
Despite the lack of transformation of the sector, this market-oriented
agricultural economy is highly diversified and includes the production of all the
major grains (except rice), oilseeds, deciduous and subtropical fruits, sugar, citrus,
wine and most vegetables. Livestock production includes cattle, dairy, pigs, sheep,
and a well-developed poultry and egg industry. Value-added activities in the sector
include slaughtering, processing and preserving of meat; processing and preserving
of fruit and vegetables; dairy products; grain mill products; crushing of oilseeds;
prepared animal feeds; sugar refining and cocoa, chocolate and sugar
confectionery, amongst other food products (Foreign Agricultural Service. 2017). In
2016 the agricultural sector contributed around 12% to South Africa’s total export
earnings valued at about $9.2 billion. The major contributors by value were citrus,
wine, table grapes and apples. South Africa is usually a net exporter of maize, but
severe drought in 2015/16 halved production and necessitated the import of more
than 3 million tonnes of maize.
As already mentioned, there has been a growing trend in production toward
horticultural crops for export and a greater dependency on imports of several top
food sources, creating a vulnerability to international price fluctuations in food
(Battersby, J. et al. 2016). These foods include soybean oil, rice and wheat. An
example of this vulnerability is reflected in the March 2014 Consumer Price Index
published by StatsSA, which reported an inflation rate of 9.2% for bread and
cereals, and a 12.8% inflation for vegetables - with tomatoes and onions both
having annual rates of over 20% (Battersby et al 2016). These increases have a
dramatic effect on low income households, which is compounded by rising costs of
electricity, transport and other basic costs.
Looking to the rest of the food value chain, we find radically concentrated
ownership, just as we do in the production sector. For example, in the retail sector,
a tight oligarchy rules; in 2010 the four largest retailers (Shoprite Checkers, Pick n
Pay, Woolworths and SPAR) accounted for 97% of food sold within the formal retail
sector (Planting 2010 cited in Haysom 2014). These supermarket chain stores are
growing in number and market share and are also collaborating with other sectors
(e.g. partnering with petrol stations to set up grocery and snack shops on the
premises) as well as expanding out of their traditional middle and upper class
income markets into lower income areas in major metropoles, small towns and
rural areas (Battersby, Marshak & Mngqobisi. 2016). There is also increased verticalBackground – the South African agro-food system 7
integration within the food system, with large companies (both supermarkets and
large processors) controlling all aspects of the food value chain.
Running in parallel to this powerful food system is a sub-ordinate “informal”
food system, which operates unregulated and on a small scale on the peripheries of
the formal system (Greenberg. 2015). Small food producers and entrepreneurs in
South Africa’s food system find themselves in a hostile and difficult environment.
For example, one of the leading supermarket chains has stated that it now procures
80% of its fresh produce from just ten agribusinesses (Pienaar cited in Haysom
2014). Efforts to incorporate smallholders into supermarket supply chains have
been largely unsuccessful (van der Heijden & Vink cited in Haysom 2014). Similarly,
government policies and programmes – such as the Department of Trade and
Industry’s Industrial Policy Action Plan (IPAP) and the Department of Agriculture’s
Agro-Processing Strategy – have tried to enable the participation of small and
medium agro-processors in agro-food value chains to little effect, due to the sheer
power of large corporate players, horizontal and vertical integration in the food
sector and anti-competitive behaviour such as price-fixing (Battersby, Marshak &
Mnqibisi 2017).
However, the informal sector plays a vital role in South Africa’s food system –
contributing as much as 8-10% to the GDP. Rogan and Skinner found that 67% of
street traders sell food, accounting for as much as 30% of national food retail sales
(Battersby, Marshak & Mnqibisi 2017). While the formal and informal systems are
generally thought of as two separate systems, Battersby et al note that they in fact
intersect and shape one another. For example, the expansion of supermarkets has
in some instances negatively impacted on small family businesses such as spaza3
shops, which cannot compete with low supermarket prices. In other instances,
supermarkets have become a nearby and easy source for spazas to restock and to
remain viable by tailoring their business to local residents in ways that
supermarkets cannot, for example, with long opening hours, selling loose items and
offering credit. (Battersby, Marshak & Mngqobisi 2016). Supermarkets and
informal markets both provide important and regular sources of food for poor
urban households. Daily ad hoc purchases are generally made from the informal
sector, with less frequent but larger purchases being made from supermarkets
(Frayne et al, 2010).
Much of the policy around urban agriculture, as well as impetus from donors and
NGOs, is to promote livelihood activities, which would need to find their place in
3
A spaza is an informal convenience shop selling everyday small household items. They are often run from
homes8 this complex agrofood system. Urban agriculture is also seen as a strategy to alleviate nutrition insecurity, which emerges in part from the structure of our current agrofood system.
9
                                     Poverty, hunger and under-nutrition in South Africa

3    Poverty, hunger and under-nutrition in South Africa
    South Africa is a middle income country that is deemed food secure, i.e. there is
enough food in the country from own production or import to adequately feed its
population of 54 million people. It is also ranked as one of the most unequal
societies in the world, with a Gini Coefficient of around 6.7. According to the World
Bank, in 2014 the poorest 20% of the South African population consumed less than
3% of total expenditure, while the wealthiest 20% consumed 65% (World Bank.
2017). There is a high level of household food insecurity reflected in the persistence
of income poverty, a high prevalence of child malnourishment, a high prevalence
of micronutrient deficiency together with an increasing share of the population
being overweight or obese, and associated increases in the prevalence of non-
communicable diseases (NCDs) such as diabetes, hypertension and heart disease.
(Battersby, J. et al. 2014)

         Figure 1: Levels of food insecurity in South Africa
          Source: Shisana, O. et al 2013

   In 2013 the South African National Health and Nutrition Examination Survey
(SANHANES_1) revealed that more than half of South African households are food
insecure (26% experiencing hunger and 28.3% at risk of hunger). South Africa is
rated as one of the top 20 countries in the world in terms of the negative effects on
human wellbeing of under-nutrition (Altman et al, cited in Ledger, T. 2015).
   Hunger in Cape Town reflects the statistics found in the rest of the country; at
least 31% of households are struggling to manage hunger on a daily basis and
coping by cutting down on the size and number of meals and/or eating cheap
“empty calorie” foods to feel full, resulting in malnourished individuals who may
also be obese with a greater risk of diabetes and hypertension (Western Cape
Government. 2017). Almost 7% of households in the Western Cape experience
Poverty, hunger and under-nutrition in South Africa 10
extreme hunger, often going without any food at all for more than 24 hours and
20.7% of children are identified as stunted, i.e. they are too short for their age due
to lack of nutrition, which may also cause a lack of social and cognitive development
that will handicap them for life. The Western Cape has the highest incidence of
obesity and overweight in the country, and this problem is particularly prevalent in
urbanized areas.
Table 1: Snapshot of hunger and nutrition indicators in South Africa
Indicator Description
Low birth- South Africa has the third worst score for low-birth weight in the Southern African
weight region, an indicator of deficient fetal and maternal nutritional status (Crush, J. et
al. 2011).
Micronutrient Vitamin A, iron and zinc deficiencies and anaemia among almost a third of women
deficiencies and children (Shisana O, et al. 2013)
low level of 40% of the population has LDD, one of the causes of low weight and stunted
dietary growth. The typical South African monotonous diets, based mainly on industrially
diversity (LDD) produced starches such as maize, rice and bread, have been closely associated
with food insecurity (Rah, Akhter, Semba et al. cited in Shisana O, et al. 2013)
Stunting 26.9% of boys between the ages of 0-3 years and 25.9% of girls in the same age
group in South Africa are stunted (Shisana O, et al. 2013). While there has been a
modest decrease of severe stunting and wasting in rural areas, these problems
have increased in urban areas, possibly due to continuing urbanisation and related
poverty (Crush, J. et al. 2011).
Obesity The incidence of obesity is becoming an epidemic in South Africa, with 40.1% of
women classified as obese compared to 11.6% of men. The highest prevalence
was seen among urban women at 42%. Obesity is also rising amongst children -
18.1% of children in the age group of 2–5 years old is obese (Shisana O, et al. 2013).
Nutrition Participants in SANHANES-1 reflects the picture of a country in the nutrition
transition transition and urbanisation. Almost one out of five participants consumed a diet
with a high fat score (18.3%) and high sugar score (19.7%), and one out of four
consumed a diet with a low fruit and vegetable score (25.6%).
3.1 Urban hunger and nutrition transition
South Africa is already highly urbanized and rapidly urbanizing further. About
64% of the population is residing in urban areas. This figure is projected to reach
77% by 2050 (UN 2014). Urban hunger is often overlooked as hunger is historically
conceived of as a rural problem and research, funding and interventions are most
often focused on rural areas (Crush, J. & Frayne, B. 2010).11
Poverty, hunger and under-nutrition in South Africa
Poverty is one of the key indicators of food insecurity and the prevalence of rural
poverty, when using broad national statistics, may give the impression that this is
where they greatest hunger and under-nutrition problem lies. According to
statistics released by StatsSA in 2017, 55,5%, (or 30,4 million) citizens, were living
in poverty in 2015, with 13.8 million people living in extreme poverty – i.e. on less
than R441 per person per month (StatsSA 2017). Rural poverty remains high, with
81.3% of rural citizens living below the breadline in 2015, compared to 40.6% in
urban areas. However, a 2012 survey carried out by the Bureau for Food and
Agricultural Policy (BFAP) indicated that the cost of basic nutrition was beyond the
reach of the majority of South African households, both rural and urban. (Ledger,
T.M. 2015).
Figure 2: Poverty headcount by settlement type (UBPL) 2006, 2009, 2011 and 2015
In 2006, 87.6% of people residing in rural areas were living below the upper-bound
poverty line (UBPL) compared to 52.0% in urban areas. For rural areas, the headcount
increased slightly in 2009, reaching a high of 88.0% before dropping to 77.0% in 2011.
Unfortunately, the headcount increased to 81.3% in 2015. Urban areas experienced a
healthy decline between 2006 and 2011, followed by a small increase in 2015. The
UPBL was set at R575 per person per month in 2006 and R992 in 2015.
Despite these large differences in statistics on rural and urban poverty,
SANHANES_1 found that the greatest number of people at risk of tipping into food
insecurity are in urban informal areas. 36.1% of urban informal residents are rated
as at risk of hunger, followed closely by informal rural areas at 30.2%. The largest12
Poverty, hunger and under-nutrition in South Africa
percentages of participants who experience hunger are in rural informal localities
(37.0%), followed by urban informal (32.4%). A 2008 survey carried out by AFSUN
in the informal urban area of Khayelitsha revealed even more severe statistics than
SANHANES_1, where the majority (89%) of households surveyed were found to be
food insecure (Battersby, J. 2008). This shows a clear need to reassess urban hunger
and further our understanding of its causes and potential interventions. Battersby
suggests that beyond assessing poverty lines and expenditure there is a need to
“connect household food security to extra household factors such as the spatial
organization of the city and the location of different kinds of retail outlet. This
requires a shift not just in scale of analysis, but in the conceptualization of food
insecurity. Food insecurity is not simply a problem of household poverty, but a
matter of structural inequality that has spatial Manifestations” (Battersby, J.
2014:15).
Figure 3: Food insecurity in urban and rural areas in South Africa
Source: Compiled from Shisana, O. et al 2013
“Hidden hunger” is also a key feature of urban food insecurity. As already
mentioned, South Africa displays the typical characteristics of an urbanising nation
in the “final stage of nutrition transition” (Shisana O, et al. 2013). This is evidenced
by relatively moderate levels of underweight in children and men, high levels of
obesity/overweight in women and a trend of high intakes of energy-dense foods
and beverages (Shisana O, et al. 2013).13
Poverty, hunger and under-nutrition in South Africa
Rates of obesity in South Africa are particularly high, with women showing the
highest rates in the Southern African region at 40.1%. Meanwhile 11.6% of men are
obese. Between 2005 and 2012 the rate of obese South African children rose from
5% to 8% while the rate of overweight children shot up from 10% to 30%.
SANHANES revealed that the highest fat and
sugar scores were found in the youngest age Obesity and overweight
groups, in formal urban areas in those
Overweight and obesity are
provinces that were largely urbanised, such as defined as abnormal or excessive
Gauteng. It has also been reported that fat accumulation that may impair
resource poor people tend to buy cheap, health.
energy-dense foods that are high in fat sugar Body mass index (BMI) is a simple
and/or starch as opposed to low-energy dense index of weight-for-height that is
foods, which are higher in fibre and commonly used to classify
micronutrients, such as fruit and vegetables. overweight and obesity in adults.
(Basiotis & Lino 2002). The intake of fruit and It is defined as a person's weight
in kilograms divided by the square
vegetables by South Africans is around 200 g
of his height in meters (kg/m2).
per person per day (Nel & Steyn 2002), which is
roughly half of the recommendation made by The World Health Organisation
(WHO) definition is:
the WHO (WHO 2003).
• a BMI greater than or equal to 25
The rate of obesity amongst girls in the is overweight
Western Province is reported as the highest in
• a BMI greater than or equal to 30
the nation at 7.25%, while the prevalence of
is obesity
overweight and obesity in adults is estimated
Common non-communicable
to be 10% higher than the national mean.
diseases associated with obesity
Older children and girls are more affected, and include cardiovascular diseases
among teenagers, 27.9% of girls are (mainly heart disease and stroke),
overweight compared to only 4.7% of boys. diabetes; hypertension,
musculoskeletal disorders and
Overweight and obesity have been
some cancers (endometrial,
associated with the increasing incidence of breast, and colon).
non-communicable diseases (NCDs), which
Overweight and obesity are
account for 40% of all deaths in South Africa.
linked to more deaths worldwide
These diseases include non-infectious diseases than underweight.
such as cardiovascular disease, cancer,
WHO Fact Sheet available on line:
diabetes, osteoarthritis and chronic kidney http://www.wpro.who.int/mediac
disease. StatsSA reports that in 2015, diabetes entre/factsheets/obesity/en/
was the leading underlying cause of death in
South African women, while tuberculosis was
the leading cause of death for men. (When menPoverty, hunger and under-nutrition in South Africa 14
and women are taken together, tuberculosis remains the leading cause of death in
South Africa with diabetes ranking second.) StatsSA reports a steady decline in
tuberculosis related deaths and a steady incline in diabetes related deaths over the
past decade. In 2015 diabetes was the leading cause of death in the Western Cape,
accounting for 7.2% deaths, followed by HIV at 6.1% (StatsSA 2017).
Figure 4: Comparative nutrition statistics - South Africa and Western Cape
Source: compiled from Shisana, O. et al. 2014
A comparative statistic for obese boys was not available
3.2 HIV/Aids
Access to adequate food and nutrition is
especially vital in a country rated as having
the largest HIV/Aids epidemic in the world,
as well as the sixth largest tuberculosis
epidemic. Good nutrition is essential for
those with compromised immune systems
and it is also important for treatments to be
taken with meals.
In 2016 an estimated 7.1 million South
Africans were living with HIV. HIV prevalence among young women in South Africa15
Poverty, hunger and under-nutrition in South Africa
is nearly four times greater than that of men their age, with young women between
the ages of 15 and 24 making up 37% of new infections in South Africa (SANAC
2017), In 2016 there were 270,000 new HIV infections and 110,000 South Africans
died from AIDS-related illnesses. South Africa also has the biggest anti-retroval
treatment programme in the world, currently servicing just over 3.7 million people
at a cost of $1.3 billion annually.
The Western Cape has the lowest HIV prevalence in the country however there
are significant variations at district and sub-district level. For example, Khayelitsha
has one of the highest burdens of both HIV and tuberculosis (TB) in South Africa. In
2011 it was reported that 20.5% of City of Cape Town’s HIV+ population was in
Khayelitsha. In 2013 the prevalence of HIV in Khayelitsha was estimated to be 34%.
In Mitchells Plain it was estimated at 9% (SANAC 2014).
In 2012 the estimated HIV prevalence in the age group 15-49 years for the
Western Cape was 5% (HSRC 2012). The highest HIV prevalence estimates were
found amongst the 25-29 and 30-34 year age group. (Western Cape Provincial
Strategic Plan 2012 – 2016) The chance of being infected by HIV was higher among
young women aged 15-24 years, compared to young men in the same age group.
While increasing prevalence rates can be attributed to the impact and scale-up of
HIV treatment resulting in less HIV-related deaths, this is not the case among young
people aged 15-24 years, where prevalence would be largely attributed to new
infections as opposed to the impact of the scale-up of HIV treatment.
Figure 5: HIV prevalence across age groups 2009 – 2016
Source: http://sanac.org.za/wp-content/uploads/2017/06/Western-Cape.pdfPoverty, hunger and under-nutrition in South Africa16
Total new infections in the WC Province declined from 26,718 in 2009 to 19,396
in 2015/2016. HIV prevalence in all age categories showed a decrease in 2015,
except for women under 20 years.
Research consistently shows that black Africans have the highest HIV
prevalence compared with other racial groups across South Africa. There is a clear
correlation between the high prevalence of HIV in black African populations and the
fact that the majority of black South Africans live in the informal areas of the
country (57.6%). A significant proportion of black Africans (48%) compared to all
other groups live in rural informal areas and an additional 9.6% live in urban
informal areas (Shisana, O. et al. 2014). It is in urban informal areas that the highest
prevalence of HIV is found.
In Cape Town, many households live in inadequate housing and depressed
physical environments, including informal settlements. These areas are
characterised by severe social and economic conditions, which manifest in high
levels of poverty, unemployment, illiteracy, alcoholism, low health status and
deviant behaviour such as crime and delinquency. Substance abuse is a significant
social determinant of HIV, especially among the youth (City of Cape Town 2007a).The Western Cape 17
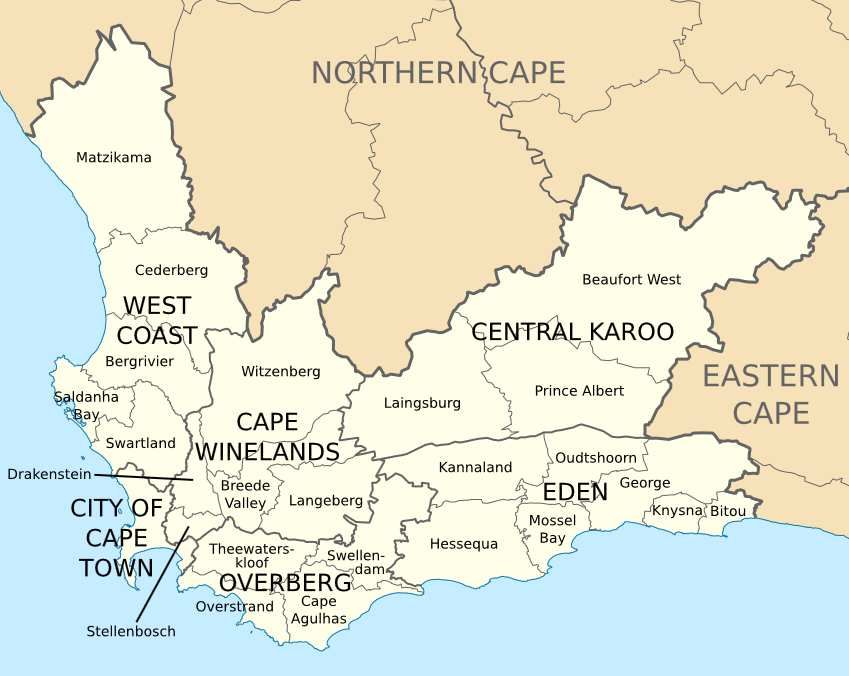
4 The Western Cape
Figure 6: Western Cape overview map
Source: Htonl - Own work, GFDL, https://commons.wikimedia.org/w/index.php?curid=51323796
UFISAMO’s research focus is in the districts of Mitchell’s Plain and Khayelitsha,
in the Cape Town Metropolitan of the Western Cape Province. The province
comprises about 10.6% of the country’s total land and extends north and east from
the Cape of Good Hope, in the south-western corner of South Africa. The 400km
stretch up north is flanked by the Atlantic Ocean, while the 500km stretch to the
East is mostly situated on the Southern Indian Ocean, having a powerful influence
on the incredibly diverse weather, microclimates and topography found in the
province. Unlike the rest of the country, most of the province has a Mediterranean
climate with cold and blustery wet winters and long hot dry summers. The
agricultural sector accounts for almost 21% of the country’s agricultural
production and 45% of the country’s agricultural exports. The Province is a
major contributor to national primary agricultural employment, and upstream
and downstream employment.
The Western Cape is the only province, out of nine, that is governed by an
opposition party to the ruling African National Congress (ANC) The DemocraticThe Western Cape 18
Alliance (DA) won the provincial election in 2009. The Province is therefore subject
to both the constitution of South Africa and the Constitution of the Western Cape.
In terms of policy and advocacy, there are benefits and difficulties arising from this
unique situation. Of benefit is the fact that there are good opportunities to engage
with government officials and the potential for innovative and experimental
programmes and projects. The Government of the Western Cape’s (GWC’s) Urban
Agriculture Policy and their Household Food and Nutrition Strategy, which takes a
systemic approach to hunger and nutrition in the province, are good examples.
However, there are limitations in that many hunger and nutrition issues fall within
the ambit of national policy, where the GWC has limited influence.
4.1 Cape Town
UFISAMO’s research focus is within the Cape Town metropolitan area,
governed by the City of Cape Town metropolitan municipality. The 2011 census
recorded Cape Town’s population at 3.7 million people, accounting for two-thirds
of the province's population. In 2012 it was estimated that there were 141,765
informal dwellings located in 378 informal settlements in Cape Town (HDA 2013).
About 8% of children under the age of 18 live in Cape Town’s informal settlements
(HDA 2013). Serious developmental challenges include rising poverty, a housing
backlog and extensive urban sprawl (Battersby, J. 2008). In addition, the national
energy crisis4 and regional water scarcity may constrain future economic
development. Indeed, the City of Cape Town is currently estimating mid-March
2018 as “Day Zero” for water, where water supplies will run dry in the city due to
ongoing drought.
There are productive agricultural areas around Cape Town which produce staple
vegetables and livestock for local consumption. This local production, which
provides for up to 30% of Cape Town’s vegetable consumption, has a positive effect
on prices in both formal and informal markets and contributes to better nutrition
for the poor. However, these agricultural peri-urban areas are under extreme stress
as other pressing housing and developmental needs compete for land. Cape Town
4
South Africa‘s electricity utility, ESKOM has been mired in corruption and maladministration scandals for
a decade that have resulted in lack of crucial maintenance resulting in blackouts across the country between
2008 and 2015. Corruption regarding adoption of more nuclear energy has hindered the development of
clear and efficient energy policy and stalled adoption of renewables. The poor have paid the dearest price,
with deep impacts on household food security as electricity prices increased by 354% over 10 years.
Pietermaritzburg based NGO – PACSA – has done excellent work on the impact of inflated electricity prices
and how it has eaten into household nutrition budgets. In February 2018 ESKOM is on the brink of financial
collapse thereby threatening the economy of the country and has received a R5 billion bailout.The Western Cape 19
is also a vital hub for food processing, with about 70% of South Africa’s food
processing and packaging passing through the city (Battersby, J. 2011). There are
over 600 registered food processors in the city, making the food sector a critical
source of employment. There is also a vibrant informal food economy in the city,
however due to its informal status, entrepreneurs face a multitude of challenges,
including food spoilage, theft and vandalism, and environmental health problems
(Battersby, J. 2011).
The complex history and characteristics of Cape Town are beyond the scope of
this paper, however there is a need to point out that the historic spatial segregation
that was engineered in the apartheid regime continues to hinder transformation
and plays a key role in enduring hunger and nutrition problems in the metropolis.
When the Group Areas Act was declared in the city in 1957 it was arguably
implemented in Cape Town with more enthusiasm than any other major city,
making it one of the most segregated cities in the country by the mid-1980s. This
legacy remains in the infrastructure and spatial set up of the metropole and distinct
white affluent areas and low income black areas remain intact. Suburbs
surrounding Cape Town and all the way down the Peninsula remain predominantly
white and affluent, with some exceptions, while black communities continue to
remain stuck on the peripheries. (See map below).
In order to participate in the formal economy, travel from Khayelitsha and
Mitchell’s Plain can take several hours each way, usually by public train or bus or
private “minibus“-taxi. The public train service is notoriously inefficient and
dangerous, with commuters facing high levels of vandalism and crime as well as
loss of income and jobs due to arriving at work late or sometimes not at all. Barriers
to the economy and services caused by continued spatial segregation contribute
heavily to the poverty cycle endured by these far-flung communities and thus have
a profound effect on what food can be accessed and afforded. Another interesting
thing to note about this spatial set-up is that informal food traders are heavily
concentrated along these commuter routes, thereby contributing to shaping food
habits by what they make available.The Western Cape 20
Figure 7: Map showing Mitchell’s Plain and Khayelitsha relative to the economic
centre in Cape Town
Source: Google Maps
4.2 Mitchell’s Plain and Khayelitsha
Mitchell’s Plain is a township that was built in the early 1970’s to accommodate
the Group Areas Act, which enabled the government to forcibly remove coloured
families from their homes in Cape Town, from areas such as District Six and others.
This traumatic dislocation, which dumped communities on the peripheries of the
city and shattered family and community bonds, has rippled through time and
remains impactful today.
Mitchell’s Plain is located about 32 kilometres from the city of Cape Town. It has
a population of 310 485 people, at a density of 7 096 persons/km2. There are 67 993
households with an average of 4.5 people per household. 37% of households are
female headed. 10.4% of households have no income5.
Khayelitsha (meaning “new home“), is a much younger settlement, established
in 1983 to accommodate mainly Xhosa migrants from the Eastern Cape. It
neighbours Mitchell’s Plain to the east. 62% of the population is reportedly a rural
5
Household income in the census is defined as all receipts by all members of a household, in cash or in kind,
in exchange for employment, or in return for capital investment, or receipts obtained from other sources
such as social grants and pension. Some households may well have no source of income, while others may
misunderstand the question or be unwilling to divulge this information.The Western Cape 21
to urban migrant (Battersby). Khayelitsha has a population of 391 741 people at a
population density of 10,120 persons/km2 (living in 118 810 households). 42% of
households are headed by females. While 70.2% of the population in Khayelitsha is
of working age (15-64yrs), 53% are unemployed. 18.8% of households have no
income, while a further 5.7% have an income of R4 800 pm or below. (Average
household size is 3.2). Only 34.6% of households have piped water in their houses,
which impacts on health and sanitation as well as cooking habits. The struggle for
decent sanitation in Khayelitsha has been ongoing, resulting in the Social Justice
Coalition (SJC) taking the City of Cape Town to the High Court and the Equality
Court in 2016 for failing to respect “the right of access to sanitation of poor, black
and marginalised residents of informal settlements” (Molander, J. & Bejoy, R.
2016). The case is still to be settled. Lack of water, sanitation and food storage
capacity in informal settlements exacerbates food insecurity and impacts on food
safety.
Figure 8: Shared chemical toilets in Khayelitsha
Source: Masixole Feni, in GroundUp
Khayelitsha and Mitchell’s plain occur in Cape Town’s top 10 precincts for
incidences of murder, assault, robbery and sexual offenses. The Mitchells Plain
police precinct consistently recorded the highest number of drug related crime in
the metropole between 2012 and 2015. In 2015 141 murders were reported in
Mitchell’s plain and 146 in Khayelitsha.You can also read