Post-COVID City: Driving Economic Recovery and Growth - Foundation research report prepared for the Capital City Committee
←
→
Page content transcription
If your browser does not render page correctly, please read the page content below
Post-COVID City: Driving Economic Recovery and Growth

Post-COVID City: Driving Economic Recovery and
Growth
Foundation research report prepared for the Capital City Committee
May 2021

      1
Post-COVID City: Driving Economic Recovery and Growth
Contents
List of acronyms i
Key facts and figures i
Executive summary i
1 Introduction 1
1.1 Purpose of this report 3
1.2 COVID-19 in the context of the economy 4
2 The impact of COVID-19 on the Adelaide City Centre 7
2.1 The headline impacts of COVID-19 8
2.2 Shifts in movement during COVID-19 12
2.3 Shifts in movement within main street areas during COVID-19 13
2.4 Impacts on sub-sectors within the Adelaide City Centre economy 17
2.5 Potential responses in addressing the observed impacts of the pandemic 35
3 Trends impacting cities 37
3.1 The ways people use cities 38
3.2 Changes in how cities look, feel and function 45
3.3 Changes in the ways people move about cities 48
3.4 Shifting calculations in where people choose to live 49
4 Current recovery planning activities 52
4.1 Current and planned activities by industry associations and main street
organising functions 52
4.2 Activities by state and local government 54
Appendix 1 – Economic impact of COVID-19 more broadly 56
A1.1 Global economy 56
A1.2 National economy 57
A1.3 South Australian economy 58
Appendix 2 – Alignment of sub-sectors 62
Limitation of our work 63
General use restriction 63
Deloitte Access Economics is Australia’s pre-eminent economics advisory practice and a member of Deloitte's global economics group. For more information, please visit
our website: www.deloitte.com/au/deloitte-access-economics
Deloitte refers to one or more of Deloitte Touche Tohmatsu Limited (“DTTL”), its global network of member firms, and their related entities. DTTL (also referred to as
“Deloitte Global”) and each of its member firms and their affiliated entities are legally separate and independent entities. DTTL does not provide services to clients.
Please see www.deloitte.com/about to learn more.
Liability limited by a scheme approved under Professional Standards Legislation.
Member of Deloitte Asia Pacific Limited and the Deloitte Network.
©2021 Deloitte Access Economics. Deloitte Touche TohmatsuPost-COVID City: Driving Economic Recovery and Growth Charts Chart 1.1: Pre-COVID and current COVID forecasts of South Australian gross state product 5 Chart 1.2: Forecast South Australian GSP growth, 2020 –2021 6 Chart 2.1: Weekly vehicle detections, intersection of King William, Grenfell and Currie streets 13 Chart 2.2: Monthly detections within the Adelaide LGA, January 2019 – March 2021, all sensors 13 Chart 2.3: Monthly unique device detections, Hutt Street zone, January 2019 – March 2021 14 Chart 2.4: Monthly unique device detections, Hindley Street zone, January 2019 – March 2021 15 Chart 2.5: Monthly unique device detections within the East End zone, January 2019 – March 2021 15 Chart 2.6: Monthly unique device detections, Market District zone, January 2019 – March 2021 16 Chart 2.7: Monthly unique device detections, O’Connell Street zone, January 2019 – March 2021 16 Chart 2.8: Expenditure in the Adelaide City Centre area, yearly comparison 18 Chart 2.9: Mobility trends, grocery and pharmacy and residential, 2020-2021 18 Chart 2.10: Mobility trends, workplaces and transit, 2020-2021 19 Chart 2.11: Mobility trends, retail and recreation and parks, 2020-2021 19 Chart 2.12: Accommodation occupancy rates for the year end December 2020, Greater Adelaide 20 Chart 2.13:Monthly expenditure in the hospitality sector, Adelaide City Centre 21 Chart 2.14:Monthly expenditure in retail categories, Adelaide City Centre 23 Chart 2.15: Monthly expenditure in the personal services sector, Adelaide City Centre 24 Chart 2.16: Change in monthly expenditure in department and clothing stores (2019 = 100) 24 Chart 2.17: Change in monthly expenditure on grocery items (2019 = 100) 25 Chart 2.18: Index of the value of non-residential building approvals (2014-15=100) 31 Chart 2.19: Residential vacancy rate, Adelaide CBD and North Adelaide 32 Chart 2.20: Residential building approval value index (2014-15=100) 32 Chart 2.21: Expenditure in the professional services sub-sector, Adelaide City Centre 34 Chart 3.1: McKinsey analysis of remote working effectiveness by industry 39 Chart 3.2: Online sales as a proportion of total, Australia, February 2018 to February 2021 41 Tables Table 2.1: Industry value added by industry in the Adelaide City Centre, 2019-20 9 Table 2.2: Employment by industry in the Adelaide City Centre, 2019-20 11 Table 2.3: Expenditure in the Adelaide City Centre before and during COVID-19 17 Table 2.4: Accommodation performance indicators (annual averages), Greater Adelaide 21 Table 2.5: Change in ticket sales pre-COVID and post-COVID for Adelaide’s major festivals 26 Table 2.6: Adelaide CBD office vacancy rates by grade 29 Table 4.1: Activities being undertaken by industry associations and main street organising functions 53
Post-COVID City: Driving Economic Recovery and Growth

Acknowledgements
Deloitte Access Economics acknowledges that the principal subject of this report – the City of
Adelaide – and both of our offices in South Australia are located on the traditional Country of the
Kaurna people of the Adelaide Plains and pays respect to Elders past and present. We recognise
and respect their cultural heritage, beliefs and relationship with the land. We acknowledge that
they are of continuing importance to the Kaurna people living today. We also extend that respect
to other Aboriginal Language Groups and other First Nations.

Deloitte Access Economics gratefully acknowledges the contributions made by the following groups
of stakeholders in preparing this research report:

    •    Adelaide Economic Development Authority
    •    Adelaide West End Association
    •    Arts Industry Council of South Australia
    •    Business SA
    •    City of Adelaide
    •    Committee for Adelaide
    •    Department of the Premier and Cabinet
    •    Office for Data Analytics
    •    Department for Trade and Investment
    •    Department of Treasury and Finance
    •    East End Coordination Group
    •    Festivals Adelaide
    •    Gouger Street Traders Association
    •    Hutt Street Traders Association
    •    Property Council of Australia (SA Division)
    •    Restaurant and Catering Australia
    •    South Australian Tourism Commission
    •    Study Adelaide
Post-COVID City: Driving Economic Recovery and Growth
List of acronyms
Acronym Full term
A$ Australian dollars
CBD Central business district
CED Central entertainment district
CoA City of Adelaide
DPC Department of the Premier and Cabinet
ELICOS English Language Intensive Courses for Overseas Students
FY Financial year
FYTD Financial year to date
GDP Gross domestic product
GRP Gross regional product
GSP Gross state product
GVA Gross value added
IMF International Monetary Fund
MaaS Mobility as a Service
NER Net effective rent
RevPAR Revenue per available room
WHO World Health Organisation
UK United Kingdom
UNWTO United Nations World Tourism Organisation
US United States
VET Vocational education and training
Y.o.Y Year on year
iPost-COVID City: Driving Economic Recovery and Growth
Key facts and figures
18.2% Contribution of Adelaide City Centre’s $20.2 billion economy to South
Australia’s gross state product in (financial year) 2019-20 as
Adelaide City Centre’s measured by the National Institute for Economic and Industry
share of GSP Research.
Source: NIEIR
-1.6% Contraction in South Australia’s gross state product in the (calendar)
year to December 2020, covering the substantive period of the
South Australian GSP in pandemic in which social distancing measures in force.
2020
Source: Deloitte Access Economics
+4.6 % Forecast growth in South Australia’s gross state product in the
(calendar) year to December 2021, as the state’s economy continues
Forecast growth in South its recovery from COVID-19.
Australian GSP in 2021
Source: Deloitte Access Economics
+0.8% Growth in gross regional product in the Adelaide City Centre regional
economy in (financial year) 2019-20, which has outperformed the
Adelaide City Centre GRP state as a whole.
growth in 2019-20
Source: NIEIR
-8.2% Reduction in unique devices detected within the device detection
network located throughout the Adelaide City Centre between the
Decline in detections in March quarter in 2020 (before stay-at-home requirements came into
the March quarter force) and same period in 2021.
between
Source: CoA
2020 and 2021
-78% Decline in the number of international visitors to South Australia in
2020, compared with 2019
Decline in international
Source: Tourism Australia
visitation in 2020
-33.4% Decline in the number of international student commencements
(year-to-date) in South Australia between March 2020 and March
Decline in international 2021.
student commencements
Source: Department of Education, Skills and Employment.
71% Occupancy rate (inclusive of vacancies and under—utilised leased
properties) for office buildings in the Adelaide CBD as at March 2021,
Occupancy rate versus a long-term average of 86 per cent.
Source: Property Council of Australia
iPost-COVID City: Driving Economic Recovery and Growth
Executive summary
The COVID-19 pandemic has reshaped Adelaide. It has caused disruption by inhibiting
movement between places and preventing shared experiences within the city.
The changes made in response to these circumstances have been difficult and have resulted in
tough times for many businesses, especially those which rely on in-person interaction, such as
hospitality and retail. However, after the pandemic, it is likely that many of these changes will
be with us for the long term – and the parts of the current times that we choose to keep will be
those which make people’s lives better or easier, or which are better for business.
This longer term shift is expected to have a greater impact on those areas of the Adelaide City
Centre that rely more heavily on footfall driven by visitors (from outside the state and outside
the city), necessitating a greater level of adjustment.
Future planning around how to integrate the lessons from COVID-19 with lasting changes in
behaviour requires understandings of disruption, movement and experiences to enable
people to continue working with greater flexibility while also giving them reasons and
experiences that will encourage them to choose to spend time in the city.
Activities to support activation and improve experiences will become increasingly important in
this regard, with people choosing between a broader range of options in terms of how to
work/consume/experience needing to be convinced that these offerings are compelling.
The spread of the SARS-CoV-2 virus and subsequent COVID-19 pandemic has wrought
disruption and damage on communities and economies in a way unparalleled in almost a
century. The harrowing human costs and severe economic damage are intrinsically linked, and so
far, nations which have done better at controlling the virus have performed stronger in economic
terms.
South Australia has done remarkably well in managing the COVID-19 pandemic, with the number
of infections kept relatively low to date at 741 cases (to 12 May 2021)1, and the economy forecast
to grow strongly at 4.6 per cent in (calendar year) 2021.2
Efforts to contain the pandemic have involved public authorities keeping people physically
distant to prevent the spread of the virus between people, households, workplaces, communities
and cities through public health measures including stay-at-home requirements and social
distancing measures.
The impact of the pandemic has been particularly acute on cities, where the concentration of
people from different places is higher, meaning they are more susceptible these types of social
distancing measures.
This translates into the reduction in movement in the Adelaide City Centre area (measured through
unique device detections), with detections declining by 59 per cent in the month of April 2020
compared with April 2019.3 This reduced visitation and footfall has continued in 2021, with total
unique detections for the first quarter of 2021 (to March) down 8.2 per cent compared with 2020.
1
Government of South Australia, COVID-19 dashboard, Wednesday 12 May 2021, SA Health, accessed 13 May
2021
2
Deloitte Access Economics, Business Outlook, March 2021, subscription publication
3
Based on analysis of device detection network data provided by the City of Adelaide
iPost-COVID City: Driving Economic Recovery and Growth
These effects have been more evident in those parts of the Adelaide City Centre where activity
relies on visitors to the Adelaide City Centre from outside the state (i.e. international and
interstate visitors) and outside the area (i.e. city workers), with Hindley Street, O’Connell Street
and the Market Precinct all recording significant falls in visitation during 2020, and slower
recoveries through 2021.
The consequence of this has been that people have been unable to physically come together
to share experiences and ideas in ways that foster collaboration, community and shared
experiences. This has prevented people from working and consuming in the ways they have
previously, creating challenging trading conditions for businesses in the Adelaide City Centre area.
These challenging trading conditions have included:
• Accommodation occupancy in the rates declining 47 per cent in the year ending
December 2020, compared with the previous year.4
• Expenditure on dining, entertainment and travel falling by 66 per cent in the period
March – April 2020 compared with the same period in 2019.5 Expenditure on dining and
entertainment has subsequently (largely) recovered, with expenditure in January 2021
exceeding that recorded in January 2019. Travel expenditure continues to struggle, with
expenditure in January 2021 being 28 per cent lower than January 2019.
• Expenditure in department and clothing stores within the Adelaide City Centre declining
39.7 per cent in April 2020, compared to the monthly average in 2019.6
o Conversely, expenditure in the same categories across South Australia rose 14.3
per cent over the same period.7
• Expenditure in the Adelaide City Centre area, modelled by Spenmapp.com.au across all
categories, was 6 per cent higher in January 2021 than January 2019.8
• Commencements by international students declining 33.4 comparing year-to-date figures
for March 2021 and March 2020with further declines expected in 2021 as continuing
students conclude their studies and fewer enrolling students commence their degrees.9
• Occupancy levels in commercial (office) buildings sitting at 71 per cent in March 2021,
compared to the long-term average of 86 per cent.10
Going forward, trading conditions are steadily improving in most sectors while continuing to
struggle in others. Consultation with stakeholders for this project revealed the following examples:
• Domestic tourism is rebounding strongly, spurred by government stimulus and re-opened
domestic borders.
• Closed international borders mean that onshore international education commencements
are expected to continue to fall well into 2021, and that would likely have a lasting effect
on enrolments for several years.
• Uncertainty regarding borders continues to present issues and a drain on confidence for
event promoters and hospitality businesses, leading to a reluctance by some to stage
events and increase trading capacity.
4
South Australian Tourism Commission, South Australian Accommodation, 2020, accessed
.
5
Spendmapp.com.au, Modelled expenditure data series, City of Adelaide, provided by the City of Adelaide,
unpublished
6
Ibid.
7
Australian Bureau of Statistics, Retail Trade, Australia, February 2021, accessed
8
Spendmapp.com.au, Modelled expenditure data series, City of Adelaide, provided by the City of Adelaide,
unpublished
9
Department of Education, Skills and Employment, International Student Data 2021, accessed
10
Property Council of Australia (2021) Office Market Report, March 2021
iiPost-COVID City: Driving Economic Recovery and Growth
• Activation events targeting increased footfall are proving useful for main street organising
functions and property managers to support hospitality businesses in precincts around the
Adelaide City Centre area.
• Live music venues continue to struggle with reduced capacity and the COVID-19 public
health requirements; stakeholders did note that recent support measures provided by
governments had been highly beneficial.
Some sectors have done well during the pandemic, with financial and insurance services,
professional, scientific and technical services, public administration and safety and health and
biomedical sectors all growing in terms of their industry value added. Growth across these
sectors that were largely able to continue (even grow) during the pandemic was sufficiently
strong enough to support marginal growth of 0.8 per cent in the Adelaide City Centre
economy in 2019-20 (this being the latest data publicly available for gross regional
product).11
Although this figure is encouraging, it is important to note the timing of figure captures the
initial period of stay-at-home requirements only, and may not be representative of the full
impact of the pandemic on the economy of the Adelaide City Centre. Reduced footfall and
visitation remained a drag on the economy through 2020 and into the first quarter of 2021.
The currency of publicly available modelling of the Adelaide City Centre’s gross regional
product (to which the 0.8 per cent figure refers) needs to be considered in this context, as
does the currency of the information considered elsewhere throughout this report.
The lived experience of many (but not all) people during the pandemic in terms of greater flexible
work means that some of this separation is likely to continue after the public health measures
implemented in response to COVID-19 are eased and the immediate threat to health and safety
(hopefully) fades. This is particularly true for those service sectors that did comparatively well
during 2020.
The most likely future is one that may be characterised as a post-COVID pandemic one, rather
than a post-COVID one. Infections are likely to continue, in different places and rates, going
forwards, with the rest of the world coming to manage this fact through different changes and
situations going forwards.
Many individuals, businesses and communities have been able to respond to the changing situation
during COVID-19 by innovating and changing in ways that have allowed them to make the best of
the circumstances. Many of these changes will support more robust, flexible and innovative
practices going forwards.
Greater use of flexible work (where tasks can be performed effectively remotely), adoption of
e-commerce platforms, efforts to drive visitation through activation, and changes in
operating models to allow for greater flexibility have all been common occurrences in business
which have been able to effectively manage the disruption caused by the pandemic.
These changes – which are expected to become embedded in successful business models going
forwards – are reflective of broader trends affecting cities beyond COVID-19, as new technology
and shifts in consumer preferences continue to drive broader change in the way cities are used
and function.
These trends include:
• Remote work will remain at levels higher than before the pandemic in those
sectors, business and occupations where tasks can be performed effectively remotely. This
appears to be stabilising at a level where hybrid work – a few days in the office, a couple
at home – is a common model. This shift is likely to be particularly pronounced in the high-
11
National Institute of Economic and Industry Research (NIEIR), City of Adelaide economic profile, 2021,
accessed
iiiPost-COVID City: Driving Economic Recovery and Growth
value white-collar services sectors, which have grown faster than the economy generally
and becoming more central to CBD (and national) economies.
• Businesses shifting towards omni-channel commerce, with greater use of e-
commerce platforms such as delivery services, video streaming services and online
support.
• Experiences becoming central to consumers’ and workers’ decision-making regarding
how and what they purchase, and where they base themselves for work, with the quality
of experiences becoming pivotal in motivating people to attend in cities rather than staying
online, at home or in the suburbs.
• Changes in the way people move in, out and within cities, driven by emerging
technology, shifts in consumer preferences and the need to respond to growing challenges
in the environmental and social impacts of transport decisions.
• Broader considerations for where people choose to live, with the COVID-19
pandemic creating opportunities for people to reconsider their longer-term preferences,
without necessarily shifting the fundamentals for how they make these decisions.
• Redefining public space outdoors, as precincts around the Adelaide City Centre
implement place-based events by expanding out into the streets to try and attract visitors
back to those precincts.
In considering these future trends, it is important context to understand where the Adelaide City
Centre is positioned in the progression of the pandemic (in May 2021 when this report was
written). In the language of Deloitte’s COVID-19 framework, the Adelaide City Centre is considered
to be in the ‘recovery’ phase of the ‘Response, Recovery, Thrive’ pandemic cycle, with
developments globally, nationally and locally requiring a watching brief in terms of the immediate
responses required to respond to circumstances that continue to change.
This positioning is critical in understanding the impact of the pandemic on the Adelaide City Centre
observed to date, and in considering the recovery planning efforts underway. Various stakeholder
groups are undertaking a range of activities to support their members and other stakeholders in
responding the immediate challenges of COVID-19 while also considering how to prepare for the
recovery phase. Much of this activity have been focused on the immediate challenge in responding
to and managing the disruption caused by the pandemic and subsequent public health measures
adopted.
Stakeholder groups will need support to shift their activities towards assisting members and
sectors to for the recovery phase, including how to respond and take advantage of these longer-
term trends in order to secure economic growth which is cognisant of longer term change, and
responsive to short-term challenges.
Greater visibility and communication of activation efforts will be crucial to ensure efforts can be
coordinated effectively (reinforcing one another rather than competing or duplicating effort),
alongside consideration of how physical environments within the Adelaide City Centre need to
change to encourage people to spend time in the area.
ivPost-COVID City: Driving Economic Recovery and Growth
1 Introduction
The scale of disruption and cost imposed by COVID-19 is unparalleled in modern times, affecting
societies and economies across the globe in different ways and degrees. The disruption caused
by the pandemic will have ongoing ramifications for confidence, mobility, investment, and
humanity.
South Australia has had considerable success in managing the pandemic, achieving enviably low
rates of infections and deaths. This success has saved lives and allowed the South Australian
economy to reopen faster than in most places around the world.
Activity across the South Australian economy is strengthening, with growth forecast to return
(calendar year) 2021 at 4.6 per cent. The pace of recovery has quickened since December 2020
but remains variable across sectors.
Despite preventative health measures being less far less costly than an uncontrolled pandemic,
physical distancing has still created significant costs, with lockdowns and other public health
measures affecting confidence, consumption, exports and investment.
The rate at which the global economy recovers and grows after the most severe effects of the
pandemic will be affected by the effectiveness and speed of vaccination programs but will not
move in lock-step. Countries will continue to evaluate the trade-offs between rates of infection
and economic growth, changing public health measures and border closures accordingly.
Key statistics
18.2% Contribution of Adelaide City Centre’s $20.2 billion economy to South
Australia’s gross state product in (financial year) 2019-20 as measured by
Adelaide City the National Institute for Economic and Industry Research.
Centre’s share Source: NIEIR
of GSP
-1.6% Contraction in South Australia’s gross state product in the (calendar) year
to December 2020, covering the substantive period of the pandemic in
South
which social distancing measures in force.
Australian GSP
in 2020 Source: Deloitte Access Economics
+4.6 % Forecast growth in South Australia’s gross state product in the (calendar)
year to December 2021, as the state’s economy continues its recovery from
Forecast COVID-19.
growth in South Source: Deloitte Access Economics
Australian GSP
in 2021
Key areas for further research
• Understanding conditions and confidence in South Australia’s key trading partners,
particularly attitudes towards travel, will influence South Australia’s economic
performance. Continued market intelligence will be important to enable local businesses
to respond to emerging opportunities and changes.
1Post-COVID City: Driving Economic Recovery and Growth
• Contemporary quantitative and qualitative research is also required to understand how
experiences during COVID-19 have affected people’s considerations on where to live and
work.
The COVID-19 pandemic was central to almost everything in 2020. The scale and severity of the
virus required an unprecedented response from governments to keep communities safe. But the
public health measures taken to contain and manage the pandemic had a significant impact on
society, with subsequent economic challenges. These challenges have been particularly
pronounced in places that rely on people coming together in greater densities, and have
consequentially hit cities hard.
The reason cities have been hit harder than societies generally is the same reason people are
attracted to cities in the first place. Modern economies provide the impetus and settings for people
to come together to share ideas, knowledge and experiences. As knowledge and experiences
become increasingly specialised, the importance of cities is expected to grow as they provide
deeper markets for specialised services, and drawcards for talented people looking for unique
experiences and opportunities.
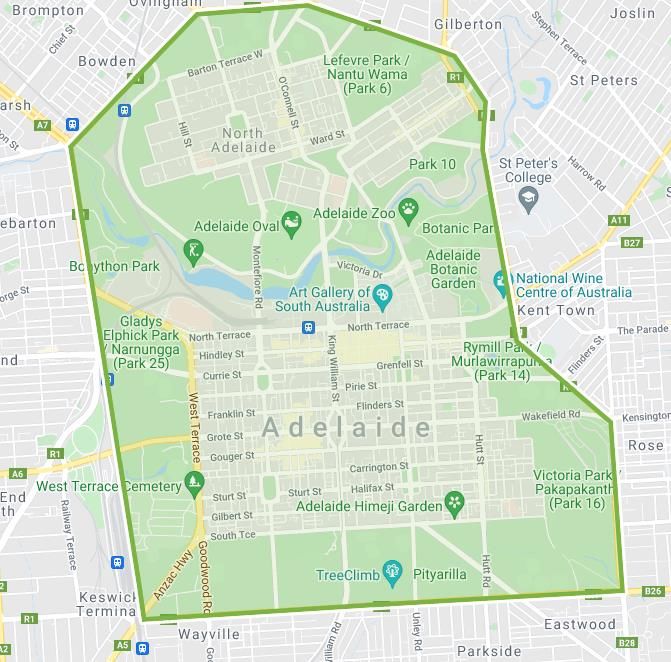
The Adelaide City Centre (defined for the purpose of this research as the geographic area
comprising the Adelaide central business district (CBD) and North Adelaide), has not been immune
to these challenges. The Adelaide City Centre area in question for the focus report is highlighted in
Figure 1.1.
Figure 1.1: Adelaide City Centre (Adelaide CBD and North Adelaide)
Source: CoA, Google
2Post-COVID City: Driving Economic Recovery and Growth
While stay-at-home requirements limited the ability of workers and tourists to spend time in the
city in 2020, COVID-19 is likely to have an ongoing impact on the Adelaide City Centre economy.
Increasing take-up of remote work, as well as continued hard international and uncertain state
borders, is expected to continue affecting the level of visitation (and hence activity) in the Adelaide
City Centre for some time. The extent to which these changes affect worker and visitor foot traffic
may lead to longer-lasting impacts on some service sectors.
The significance of this change relates to the role of the Adelaide City Centre in hosting a
significant proportion of South Australia’s services economy, as well as a range of activities and
attractions that drive economic growth for the state as a whole.
The latest modelling of the Adelaide City Centre regional economy by the National Institute of
Economic and Industry Research (NIEIR) estimated the Adelaide City Centre’s gross regional
product (GRP) at $20.16 billion in 2019-20, equal to 18.2 per cent of South Australia’s gross state
product (GSP). 12
1.1 Purpose of this report
Even as governments, businesses and individuals emerge from the immediate aftermath of
COVID-19, the pandemic – and its impacts – remain at our doorstep. However, the reprieve
afforded by the sacrifices of 2020 provide an opportunity to consider these impacts and their
implications into the future.
The impact on cities around the world has been especially pronounced in comparison to other
areas as people have been encouraged or required to stay away from what are typically areas with
highly dense people movements. In the context of Adelaide City Centre, it is a hub for industries
such as financial and insurance services, public administration and safety, and professional,
scientific and technical services. City of Adelaide LGA also makes the largest contribution to gross
state product of any LGA in South Australia.13
In this context, the Department of the Premier and Cabinet (DPC) (on behalf of the Capital City
Committee) engaged Deloitte Access Economics to develop and collate evidence and insights on
the following:
• the impact of COVID-19 on the economy of the Adelaide City Centre
• the trends impacting cities internationally, particularly as a result of the COVID-19 pandemic,
and implications for Adelaide City Centre.
• existing and emerging best practice for responding to medium and longer-term change for the
Adelaide City Centre.
• a stocktake of COVID-19 recovery plans across key industry sub-sectors and seven main
streets.
This analysis will inform recovery planning and activity to deliver stronger growth in the Adelaide
City Centre economy, while contributing to other strategic objectives. The report is intended to
inform planning, recovery and growth efforts for the Adelaide City Centre economy, taking into
consideration current activity and planning by the city’s business community and the immediate
impact of COVID-19, as well as broader trends affecting cities globally.
The Capital City Committee (CCC) is a partnership between the South Australian Government and
City of Adelaide (CoA), providing strategic leadership and coordination in support of activities
driving the growth and development of the Adelaide City Centre area. The Committee and its
activities are funded jointly by the South Australian Government and the CoA.
12
National Institute of Economic and Industry Research (NIEIR), City of Adelaide economic profile, 2021,
accessed .
13
Ibid.
3Post-COVID City: Driving Economic Recovery and Growth
1.2 COVID-19 in the context of the economy
The restrictions put in place led to a significant contraction in the global economy – estimated to
be 3.5 per cent smaller in 2020 compared to the prior year. 14
(Greater detail on the impact of the COVID-19 pandemic on Australia’s key trading partners, and
their governments’ responses, are included at Appendix 1.)
Changes in economic and trading conditions for key trading partners have affected Australia and
South Australia’s economy performance during the pandemic. These in-market conditions will
continue to have important implications for domestic economic activity, with changes in disposable
income, confidence and mobility restrictions all affecting consumers’ ability to buy exports.
Table 1.1 details Deloitte Access Economics’ current economic forecasts for Australia. Actual
figures for (calendar year) 2020 show the economic damage inflicted during the midst of the worst
of the pandemic, with unemployment rising to 6.4 per cent and consumption and investment
falling sharply. Higher rates of household savings and pent up demand (for both consumption and
investment) are subsequently expected to drive a strong rebound sooner than many parts of the
globe where lockdowns have lingered longer.
Table 1.1: Key macroeconomic forecasts, Australia, March 2021
Economic variable Actual Forecast
2019 2020 2021(f) 2022(f) 2023(f) 2024(f)
GDP (% change) 1.9 -2.4 4.9 3.3 3.1 2.4
Unemployment rate (%) 5.1 6.4 5.7 5.3 5.2 5
Private consumption (% change) 1.2 -5.8 5.8 1.5 3.4 3.6
Saving – household (ratio to income %) 4.9 15.2 6.8 6 5.3 4.7
General gov’t consumption (% change) 5.8 7.3 1.9 1.2 -1.2 0.4
General gov’t fixed investment (% change) 5.9 1.4 41.9 -2.2 -2.9 -3
Private business fixed investment (% change) -1.4 -4.9 6 13.3 9 5.4
Source: Deloitte Access Economics.
1.2.1 Economic outlook for South Australia during the COVID-19 pandemic
Just as South Australia avoided the worst of the COVID-19 outbreak, it has been able to start its
re-opening and recovery sooner. Notwithstanding this (relatively) early opening, South Australia
has still borne the economic cost of the pandemic, with GSP contracting 1.6 per cent in year to
December 2020.15
Business confidence had been significantly affected by the uncertainties and disruption caused by
COVID-19, with the ANZ/Property Council Survey confidence index (where 100 indicates a neutral
level of confidence) falling to 60 in in March 2020.16
The ability to remove stay-at-home requirements and relax COVID-control measures relatively
early in 2020 (compared with other states) has since supported significant improvements in
confidence, the same index improving to a net score of 142 in March 2021.
14
International Monetary Fund, World Economic Outlook, January 2021
.
15
Deloitte Access Economics, Op. cite.
16
Property Council of Australia, ANZ/Property Council Survey 2021 Chartbook, March 2021, 2021, provided by
Property Council of Australia
4Post-COVID City: Driving Economic Recovery and Growth
This improvement in business confidence has been critical in supporting increases in the level of
economic activity across the Adelaide City Centre, with many sectors trending towards pre-COVID
levels of activity.
Deloitte Access Economics is forecasting the South Australian economy to grow by 4.6 per cent in
year to December 2021, following the 1.6 per cent contraction the previous (calendar) year.
From 2020-21 to 2023-24, South Australia’s GSP is forecast to grow at an average of 2.8 per cent
per annum, which is well above the historical average over the last two decades (Chart 1.1).17
Chart 1.1: Pre-COVID and current COVID forecasts of South Australian gross state product
4.3
3.3
GSP Growth (%)
2.3
1.3
0.3
-0.7
-1.7
2017 2018 2019(f) 2020(f) 2021(f) 2022(f) 2023(f) 2024(f)
Pre-COVID (December 2019) Post-COVID (March 2021)
Source: Deloitte Access Economics.
Commonwealth, state and local governments have acted quickly and decisively in responding to
flagging demand during the pandemic, injecting billions in direct and indirect stimulus. The effect
of these programs is evident in the improvement in forecasts for economic growth.
Chart 1.2 plots Deloitte Access Economics’ forecasts for South Australian GSP growth for 2019-20,
2020-21 and 2021-22. These forecasts have strengthened since September 2020, reflecting the
growing evidence that the various COVID-19 support measures have been increasingly effective in
supporting growth in the South Australian economy.
17
Deloitte Access Economics, Business Outlook, March 2021, accessed
5Post-COVID City: Driving Economic Recovery and Growth
Chart 1.2: Forecast South Australian GSP growth, 2020 –2021
6
4
2
GSP growth (%)
0
-2
-4
-6
-8
Mar-2020 Jun-2020 Sep-2020 Dec-2020 Mar-2021
2019-20 2020-21 2021-22
Source: Deloitte Access Economics
The aggregate effect of the unwinding of these programs (outside the continuing effects from
committed stimulus that is still washing through the economy) is evident in these forecasts, which
predict demand will continue to strengthen as mobility, investment and confidence continue to
recover.
It is important to note that this aggregate effect will not be representative of the experience in
every sector, with those more heavily reliant on JobKeeper at April 2021 likely to experience
greater disruption. For reference, there were 17,987 applications lodged for JobKeeper by
organisations in South Australia in January 2021, with 1,413 applications lodged by organisations
reporting postcodes in the Adelaide CBD and North Adelaide.18
These 1,413 organisations (accounting for 7.9 per cent of total organisations lodging applications
in the state) are expected to be concentrated in the hospitality sector (on food and beverage and
travel components) given the expenditure patterns and feedback from stakeholders which is
discussed in the next chapter.
18
Australian Tax Office, JobKeeper postcode data, 2021, accessed
6Post-COVID City: Driving Economic Recovery and Growth
2 The impact of COVID-19
on the Adelaide City
Centre
The Adelaide City Centre, like all CBDs, has been hit hard by COVID-19, with service sectors
that rely heavily on in-person interactions being affected by the reduction in footfall and
visitation driven by stay-at-home requirements, increasing use of remote work and border
restrictions.
High-end white-collar services sectors (particular those servicing other businesses) have
performed better than others due to their ability to their greater ability to continue working
remotely and smaller exposure to parts of the economy that have suffered from reduced
footfall.
Considerable efforts are being made to drive visitation through activation events. These efforts
have had positive impacts, and will continue to be important given increased use of flexible work
arrangements and continuing challenges with borders.
Following the same pattern as the broader Greater Adelaide metropolitan area as a whole, areas
within the Adelaide City Centre that have higher concentrations of residential activity have
experienced less volatility, while those relying more heavily on workers, visitors and students
have been impacted more severely.
Businesses that have responded to change flexibly have performed better during the pandemic
than those that did not. Businesses that have changed operating models and product offerings
to suit circumstances and consumer behaviour are better positioned for growth going forwards.
In considering these future paths, it is important context to understand where the Adelaide City
Centre is currently positioned in the progression of the pandemic (in May 2021 when this report
was written). In the language of Deloitte’s COVID-19 framework, the Adelaide City Centre is
considered to be the ‘recovery’ phase of ‘Response, Recovery, Thrive’ pandemic cycle, with
developments globally, nationally and locally requiring a watching brief in terms of the
immediate responses required to respond to circumstances that continue to change.
This positioning is critical in understanding the impact of the pandemic on the Adelaide City
Centre observed to date, and in considering the future trends and current recovery efforts
discussed in chapters 3 and 4.
Key statistics
+0.8% Growth in gross regional product in the Adelaide City Centre
regional economy in (financial year) 2019-20, which has
Adelaide City Centre outperformed the state as a whole.
GRP growth in 2019-
Source: NIEIR
20
7Post-COVID City: Driving Economic Recovery and Growth
-8.2% Reduction in unique devices detected within the device detection
network located throughout the Adelaide City Centre between the
Decline in detections March quarter in 2020 (before stay-at-home requirements came
in the March quarter into force) and same period in 2021.
between
Source: CoA
2020 and 2021
-78% Decline in the number of international visitors to South Australia in
2020, compared with 2019.
Decline in international
Source: Tourism Australia
visitation in 2020
-33.4% Decline in the number of international student commencements
(year-to-date) in South Australia between March 2020 and March
Decline in international 2021.
student
Source: Department of Education, Skills and Employment.
commencements
71% Occupancy rate (inclusive of vacancies and under—utilised leased
properties) for office buildings in the Adelaide CBD as at March
Occupancy rate 2021, versus a long-term average of 86 per cent.
Source: Property Council of Australia
Key areas for further research
• Published data available at the time this report was prepared provides useful insights
into the impact of the pandemic during the midst of the pandemic and the beginning of
the recovery. Further data needs to be captured on an ongoing basis to understand how
the pace of recovery differs between sectors and places.
• Understanding the influences on remote workers’ decision to work remotely and
centrally will enable efforts to drive visitation by targeting the factors which motivate
people to travel to the city.
• The reduction in the level of construction activity may be explained by a range of
factors, with further research required to inform a more detailed understanding of what
has driven this change.
2.1 The headline impacts of COVID-19
The composition of the Adelaide City Centre economy meant that the extent of impacts of the
pandemic differed between sectors. The relatively high concentration of service sectors (e.g.
health care, public administration, and professional services) provided ballast to the regional
economy, as much of their activities could continue (some remotely, some in-person) during
periods of lockdown and uncertainty.
This continuity, coupled with the increase in public spending in responding to and managing the
pandemic, actually drove economic growth in the Adelaide City Centre economy during the initial
phase of the pandemic, with the regional economy growing 0.8 per cent in (financial year) 2019-
20. 19
19
National Institute of Economic and Industry Research, National Economics (NIEIR) Modelled series, City of
Adelaide, 2021, accessed http://economy.id.com.au/adelaide/industry-sector-
analysis?IndkeyNieir=23402&sEndYear=2019
8Post-COVID City: Driving Economic Recovery and Growth
Table 2.1 shows the relative performance of different industries in the Adelaide City Centre
economic in terms of industry value added (IVA) during the financial year 2019-20 (this being the
latest data available based on modelling that has been publicly released by the NIEIR).
This illustrates the different experiences had by industries. Those industries where demand for
services in responding to and managing the pandemic grew, with public administration and
healthcare and social assistance growing significantly.
Conversely, the sectors that relied on people physically being in the city struggled with reduced
visitation, with accommodation and food services, transport and arts and recreation services all
falling significantly. While employment in the retail sector fell, the size of the retail sector grew,
which is likely an indication of the changing behaviour of consumers.
Table 2.1: Industry value added by industry in the Adelaide City Centre, 2019-20
Industry Industry Value Added Y.o.Y change
2019-20 (2018-19 to 2019-20)
(% total) ($m) (%)
Construction 3.2 615.5 -25.3
Transport, Postal and Warehousing 1.7 325.9 -13.7
Accommodation and Food Services 2.8 544.1 -10.1
Arts and Recreation Services 1.3 255.8 -9.5
Administrative and Support Services 3.8 733.1 -2.4
Other Services 1.1 207.5 -1.8
Electricity, Gas, Water and Waste Services 5.8 1,130.90 -0.9
Wholesale Trade 2.0 395.3 -0.9
Manufacturing 0.6 120.1 -0.2
Retail Trade 2.6 497.3 0.7
Financial and Insurance Services 20.8 4,034.60 1.1
Information Media and Telecommunications 5.4 1,046.00 1.6
Professional, Scientific and Technical Services 11.6 2,250.70 2.4
Education and Training 7.6 1,480.40 2.4
Agriculture, Forestry and Fishing 0.1 14.3 2.9
Mining 2.5 483.9 4.7
Rental, Hiring and Real Estate Services 3.4 666.8 6.6
Health Care and Social Assistance 10.8 2,085.90 6.9
Public Administration and Safety 12.8 2,486.30 9.3
Total 100.0 19,374.40 0.9
Source: NIEIR
It should be noted that aggregated industry value added (IVA) will not be equal to the total level
of GRP as indirect taxes will not be captured by the IVA data.
9Post-COVID City: Driving Economic Recovery and Growth
Sub-sectors considered in this report
The original scope of this report considered nine sub-sectors reflecting different industries within
the Adelaide City Centre. This scope was subsequently refined to focus on the six sub-sectors
most significantly affected by changes resulting from the pandemic
The alignment between these sub-sectors and the categorisation of activities in various data
sources analysed for this report is summarised in Appendix 2 for reference.
The six sub-sectors focused on in this analysis include:
• Tourism and hospitality –broadly comprising restaurants, bars, pubs, cafes,
accommodation, travel agents, tour operators and related travel services.
• Retail and personal services –grocery, clothing, departmental stores, convenience
retail, pharmacies, hairdressing, beauty, massage, and other retail businesses.
• Creative industries –art, film, music, performance, theatre, advertising, design,
architecture, game development, TV and radio production and other craft and related
niche services.
• Education – tertiary education, high school and primary school, TAFE, private training
providers servicing both domestic and international students.
• Property – comprising the commercial and residential property sectors.
• Finance, insurance and professional services – which incorporates banks, businesses
in the finance industry, insurance companies, professional advisory services and related
services.
In addition to these six sub-sectors of focus, Health and Medical, Technology and Mining and
Energy were also included in the original scope of research. Differences in the nature of the
activities undertaken within the Adelaide City Centre by these sub-sectors and the manner in
which data for these sectors is captured does not support comparable analysis with the other sub-
sectors of focus in this study.
The experiences of these other sub-sectors in the Adelaide City Centre during the COVID-19
pandemic are considered at a higher level at the end of this chapter.
Changes in employment showed similar patterns to industry value added, with a marginal
reduction in total employment of 0.5 per cent in 2019-20 reflecting a weaker labour market as
businesses consolidated costs. 20
Table 2.2 shows how employment in the same sectors exposed to declines in visitation has fallen,
particularly in the arts and recreation, accommodation and food service and transport sectors.
Employment in financial and insurance services also fell, with some consolidation of bank branches
identified as a contributing factor during consultations.
20
Ibid
10Post-COVID City: Driving Economic Recovery and Growth
Table 2.2: Employment by industry in the Adelaide City Centre, 2019-20
Employment Y.o.Y change
2019-20 2019-20
Industry
(% total) (no.) (%)
Construction 4.3 6,083 -16.9
Arts and Recreation Services 2.4 3,377 -11.4
Accommodation and Food Services 7.0 9,924 -8.3
Transport, Postal and Warehousing 2.1 2,989 -7.3
Other Services 1.9 2698 -4.9
Electricity, Gas, Water and Waste Services 1.9 2,739 -4.0
Financial and Insurance Services 7.9 11,281 -3.9
Retail Trade 4.9 6,979 -3.2
Public Administration and Safety 16.6 23,644 0.0
Agriculture, Forestry and Fishing 0.1 130 0.0
Health Care and Social Assistance 14.0 19,922 1.0
Manufacturing 1.0 1,433 3.7
Professional, Scientific and Technical 14.6 20,802 5.1
Services
Administrative and Support Services 3.7 5,287 5.1
Rental, Hiring and Real Estate Services 1.6 2,256 5.6
Information Media and Telecommunications 4.6 6,544 6.5
Education and Training 8.9 12,643 6.8
Wholesale Trade 1.4 2,007 6.8
Mining 1.4 1,986 7.2
Total 100.0 142,724 -0.5
Source: NIER
Construction stands out as having experienced a particularly sharp contraction in both employment
and IVA in 2019-20, with heavy and civil engineering construction showing larger declines than the
other segments of the industry. Engagement with industry and government stakeholders have
indicated this contraction is attributable to the timing of committed projects concluding, and not
specifically caused by COVID-19.
However, ongoing research is required to understand whether this is the case, and whether the
COVID-19 pandemic continues to affect investment decisions impacting the construction sector.
11Post-COVID City: Driving Economic Recovery and Growth
Currency of published data and developments since June 2020
Published data on GRP and GSP figures were available through to June 2020 at the time this
report was written, informing useful insights into the initial impacts of the pandemic during the
first period under lockdowns.
Caution needs to be exercised in relying on data for the 2019-20 financial year due to:
• The timing of the period obscuring the severity of the initial phase of lockdowns (off the
back of the pre-COVID period July – December 2019).
• Circumstances evolving since June 2020 as different parts of the economy have opened
at different times, supporting activity, investment and confidence at different rates.
GSP forecasts for South Australia provide an instructive example, with measured GSP (from the
ABS) contacting 1.4 per cent in the year to June 2020, compared with forecast GSP (by Deloitte
Access Economics) contracting 1.6 per cent in the year to December 2020.
Data on expenditure and movement within the Adelaide City area has been used to complement
published data to provide insights into how the Adelaide City economy has performed since June
2020, as well as richer detail on the experiences of sub-sectors and areas within the city.
2.2 Shifts in movement during COVID-19
Public health measures enforced to enable social distancing have driven significant changes in
where, how, and how often people move around the Adelaide City Centre area, resulting in
significant reductions in footfall through the areas.
Public transport patronage data produced by the Department of Infrastructure and Transport
indicates a similar trend in reduced mobility within the Adelaide CBD through 2020. Validations
within the Adelaide CBD declined by an estimated 62 per cent between the March and June quarter
in 2020, and remain down on the corresponding quarter for the previous year (2019) for the
September and December quarters in 2020. Data on public transport validations within the
Adelaide CBD was not available for 2021 at the time this report was written.
In considering this analysis of public patronage data, it is important to note that other factors may
have contributed to the changes observed, such as increased private vehicle use. More work needs
to be done to understand the full set of changes occurring regarding public transport use in the
Adelaide City Centre (and more broadly).
Similar trends in movement through the Adelaide City Centre are observed in data tracking the
daily number of vehicle Bluetooth detections through the intersection of King William, Grenfell and
Currie streets, averaged a rolling seven-day period. Chart 2.1 shows how detections in the
Adelaide City Centre (captured via this intersection as a proxy) fell dramatically in March 2020
before tracking up again at a similar trajectory as (personal) device detection data produced by
the CoA.
12Post-COVID City: Driving Economic Recovery and Growth
Chart 2.1: Weekly vehicle detections, intersection of King William, Grenfell and Currie streets
50
45
Vehicles (thousands)
40
35
30
25
20
15
Jan Feb Mar Apr May Jun Jul Aug Sep Oct Nov Dec
2021 2020 2019
Source: Department for Infrastructure and Transport
2.3 Shifts in movement within main street areas during COVID-19
The level of movement throughout the area can be measured using mobile phone detection
sensors located throughout the Adelaide City area. The unique devices referred to in this dataset
describe mobile devices counted once per day within a detection zone. Unique devices refers to the
number of devices counted within a precinct. Movement between precincts may result in a device
being counted multiple times in the total count across all sensors. Detections within a precinct
should translate directly to one person’s movement being detected.
Chart 2.2 shows how the trends in total unique detections in the Adelaide City Centre over the
year between the pre and pandemic periods, with detections remaining subdued in 2021 relative
to 2019 and 2020. As would be expected, the sharpest decline in detections was most notable
once stay-at-home requirements came into effect in April 2020, with monthly detections falling 59
per cent compared to April 2019.
This trend in unique detections had improved early 2021 but remained subdued, with the number
of detections in the first quarter of 2021 (to March) down 8.2 per cent compared with the same
period in 2020 (before public health measures and social distancing requirements came into force).
Chart 2.2: Monthly detections within the Adelaide LGA, January 2019 – March 2021, all sensors
12
Number of detections (m)
10
8
6
4
2
0
Jan Feb Mar Apr May Jun Jul Aug Sep Oct Nov Dec
2019 2020 2021
Source: CoA
13Post-COVID City: Driving Economic Recovery and Growth
For comparison, detections in the March quarter of 2021 was 7.9 per cent lower than in the same
period in 2019, indicating the extent of the change in behaviour (and visitation) following stay-at-
home requirements and border restrictions coming into force.
Some precincts have recovered, even performed better, than prior to the pandemic, while others
still lag. This fits with observations made by stakeholders that the recovery has been non-uniform.
Detection zones covering or close to residential areas exhibited less volatility than the city overall,
with residents (rather than visitors) accounting for a larger proportion of footfall. For example,
Hutt Street saw a smaller drop in visitors, compared with Hindley Street and the East End, which
rely more heavily on visitor traffic, as they are largely hospitality based.
Hutt Street
Chart 2.3 shows detections through the Hutt Street area. Hutt Street is one of the more residential
precincts in the Adelaide City Centre and sees far less movement than other precincts. As such,
while Hutt Street saw a significant drop in movement, it was one of the less affected areas within
the Adelaide City Centre. Detections through the zone in March 2021 are 20 per cent lower than
movement in March 2019.
Chart 2.3: Monthly unique device detections, Hutt Street zone, January 2019 – March 2021
0.40
0.35
Number of detections (m)
0.30
0.25
0.20
0.15
0.10
0.05
0.00
Jan Feb Mar Apr May Jun Jul Aug Sep Oct Nov Dec
2019 2020 2021
Source: CoA
Hindley Street
Chart 2.4 shows detections in the Hindley Street zone. Hindley Street was another significantly
impacted area due to its concentration of hospitality businesses, and its proximity to the West End
(and footfall driven by the universities) and the Adelaide Railway Station (impacted by reduced
public transport patronage). Detections through the precinct in March 2021 are 17 per cent lower
than movement in March 2019.
14Post-COVID City: Driving Economic Recovery and Growth
Chart 2.4: Monthly unique device detections, Hindley Street zone, January 2019 – March 2021
1.2
Number of detections (m)
1.0
0.8
0.6
0.4
0.2
0.0
Jan Feb Mar Apr May Jun Jul Aug Sep Oct Nov Dec
2019 2020 2021
Source: CoA
As Hindley Street includes a significant concentration of late night trading night-time detections
provide an instructive view of the impact of the pandemic on trading conditions. Across the whole
week, night-time detections are at 85 per cent of 2019 levels for both 2020 and 2021 in the March
quarter. Importantly, Saturday night detections are down significantly from 2019 levels. Movement
through the area on Saturday nights for the March quarter were equal to 79 per cent of the levels
observed for the corresponding period in 2019.21
East End
Chart 2.5 shows detections through the East End precinct, which fell 53 per cent from April 2019
to 2020, reflecting the concentration of hospitality and retail businesses affected by lockdowns.
However, analysing the most recent data available for 2021, detections through the zone in March
2021 are 25 per cent higher than movement in March 2019, the only precinct to experience an
increase in movement over this period.
Chart 2.5: Monthly unique device detections within the East End zone, January 2019 – March 2021
2.5
Number of detections (m)
2.0
1.5
1.0
0.5
0.0
Jan Feb Mar Apr May Jun Jul Aug Sep Oct Nov Dec
2019 2020 2021
Source: CoA
21
City of Adelaide, Device counters analysis (April 2021)
15You can also read


