COVID-19, ONE YEAR LATER - Capital Markets Entering Uncharted Waters June 2021 - CFA Institute
←
→
Page content transcription
If your browser does not render page correctly, please read the page content below
COVID-19, ONE YEAR LATER
Capital Markets Entering Uncharted Waters

June 2021
COVID-19, ONE
YEAR LATER
Capital Markets Entering Uncharted Waters
Results of a membership survey conducted by CFA
Institute

June 2021
The mission of CFA Institute is to lead the investment profession globally by
promoting the highest standards of ethics, education, and professional
excellence for the ultimate benefit of society.

CFA Institute, with more than 170,000 members (In the mainland of China, CFA
Institute accepts CFA® charterholders only) worldwide, is the not-for-profit
organization that awards the Chartered Financial Analyst® (CFA) and Certifi-
cate in Investment Performance Measurement® (CIPM) designations. CFA®,
Chartered Financial Analyst®, AIMR-PPS®, and GIPS® are just a few of the
trademarks owned by CFA Institute. To view a list of CFA Institute trademarks
and the Guide for the Use of CFA Institute Marks, please visit our website at
www.cfainstitute.org.

© 2021 CFA Institute. All rights reserved. No part of this publication may be
reproduced, stored in a retrieval system, or transmitted, in any form or by
any means, electronic, mechanical, photocopying, recording, or otherwise,
without the prior written permission of the copyright holder. This publication
is designed to provide accurate and authoritative information in regard to the
subject matter covered. It is sold with the understanding that the publisher
is not engaged in rendering legal, accounting, or other professional service. If
legal advice or other expert assistance is required, the services of a
competent professional should be sought.
COVID-19, ONE YEAR
LATER
Capital Markets Entering Uncharted Waters
Results of a membership survey conducted by CFA Institute
June 2021
This research paper constitutes the second edition of our work on the impact of the COVID-19
crisis for capital markets and the investment management industry.

It is based on a survey of the global CFA Institute membership, conducted in March 2021.

Olivier Fines, CFA
Head of Advocacy and Policy Research EMEA
CFA Institute
London

Contributors:

Prashant Goswami
Market Intelligence
CFA Institute
Hong Kong SAR

Bristol Voss
Senior Manager, Content Engagement & Publishing
CFA Institute
New York

                                             © 2021 CFA INSTITUTE. ALL RIGHTS RESERVED.    iii
This page intentionally left blank
Contents
 1. Executive Summary1
 2. Methodology                                                                   4
 3. Highlights                                                                     6
 4. Key Messages for Governments, Policy Makers, and Regulators                    9
 5. Details of Results                                                            12
    5.1   A K-Shape Economic Recovery: Are We Engineering A
          Post-pandemic World Made up of Clear Winners and Losers?                12
    5.2 Equity Markets and the Real Economy: Are They Out of Sync?                17
    5.3 Inflation is Showing Up: But will it Last?                                27
    5.4 The Crisis may Catalyse Structural Transformations to the
        Economy: A Rise in the Role of Government, Big Tech, and ESG
        are Key Trends                                                            34
    5.5 The Financing of Economic Relief Programmes or How
        Keynes Called It: Should We Get Ready for Tax Rises and
        Debt Monetisation?                                                        46
    5.6 Central Banks and Unorthodox Monetary Policy
        Measures: Can Monetary Conditions ever be Normalised?                     50
    5.7 The Unintended Socioeconomic Consequences of the Stimulus
        Measures: Have they Widened the Wealth Gap and Favoured
        the Investor Class?                                                       62
    5.8 Regulators have done Well in the Crisis: They Should
        Now Consider Systemic Risk, Pension Viability, and Money
        Markets as Key Concerns                                                   71
    5.9 Corporate Credit Risk has been Affected by the
        Crisis: How Investors need Better Forward-Looking
        Information in their Impact Analysis                                      79
 6. Conclusion                                                                    87
 7. Appendix 1. Survey demographics                                               89
                                      © 2021 CFA INSTITUTE. ALL RIGHTS RESERVED.    v
This page intentionally left blank
1. Executive Summary
         CFA Institute has conducted a survey of its global membership to analyse the effects of the
         current economic crisis caused by the COVID-19 epidemic on financial markets and the
         investment management industry. The survey was run worldwide from 8 to 28 March 2021.

         This research constitutes the second iteration of our work on the effects of the COVID-19
         crisis. The first survey results were released in June 2020 and were based on the survey run
         worldwide from 14 to 24 April 2020.1

         Our first report was accomplished with the desire to clarify the events that were unfolding
         globally as a result of the health measures put in place to address the epidemic. We already
         had declared that the 2020 crisis was an unprecedented event compared with previous histor-
         ical crises. It has forced policy makers, governments, regulators and monetary authorities to
         carefully consider the level of intervention that would be required in the face of the economic
         lockdown that had been decided. What all of these parties seemed to agree on was that they
         would stand ready to do whatever it takes to prevent another dislocation of liquidity in credit
         and money markets, akin to what occurred during the 2007–2009 Global Financial Crisis.

         Our purpose was to make use of the long history of CFA Institute and the varied experi-
         ence of its members to help decipher the complex input coming from the economy and
         financial markets. In so doing, we painted a comprehensive picture of the crisis, in the
         midst of it, and to question the membership on the type of recovery that would emerge,
         the effects of volatility, the interventionism of public authorities, the regulatory response,
         professional ethics in times of crisis, the role of financial markets in such circumstances,
         and the impact on employment in the financial sector.

         For this second report, we benefitted from some hindsight into the development of the
         crisis.

         Governments and central banks in advanced economies have implemented robust and
         comprehensive plans and have taken a coordinated approach to fiscal and monetary stimu-
         lus, which was a novel and potentially controversial stance on central bank independence.
         This influx of liquidity into the system clearly tamed the risks of market dislocation and
         helped bridge the gap—at least partially—for market participants, workers, regulators,
         policy makers, and investors directly affected by the economic shutdown measures.
1See CFA Institute, Is the Coronavirus Rocking the Foundations of Capital Markets? (Charlottesville, VA: June 2020),
https://www.cfainstitute.org/research/survey-reports/is-the-coronavirus-rocking-the-foundations-of-capital-markets.

                                                       © 2021 CFA INSTITUTE. ALL RIGHTS RESERVED.                  1
COVID-19, One Year Later
Concerns are rising, however, as to the eventual unintended consequences of this liquidity
infusion by central banks and government relief programmes, including questions regard-
ing a multispeed recovery, inflationary pressures, addiction to monetary stimulus, taxes,
emerging regulatory risks, and the actual financial health of corporates.
These considerations formed the framework for our second research paper on the subject
of the COVID-19 crisis.
In particular, we sought to explore the socioeconomic consequences of the crisis and that
of the stimulus measures as they may be having distortion effects. As part of this effort,
we have tried to focus on the “S” in environmental, social, and governance (ESG) and to
extract some high-level observations on societal developments at large, including how the
various socioeconomic categories may have experienced the crisis differently.
The research paper is based both on the results from our membership survey and on an
external literature review to provide explanatory context for the survey results.
The themes that this research explores are as follows:
■ The shape of the economic recovery
One year after the start of the crisis, the recovery that is forming could be taking
a K shape, where different parts of the economy, markets, and social categories are
affected in materially different ways.
■ Equity markets and the real economy
We show that equity markets are perceived to have progressed out-of-pace with the
real economy as a result of monetary stimulus.
■ Inflation may be back on the agenda
Input prices have been the first to show nervousness in connection with the output gap
generated by the crisis. The question will be whether this is temporary or structural.
■ The structural consequences of the crisis on the economy
We may be observing structural transformations to the traditional economic balance,
with the rise of central bank interventions and a larger role for governments, Big Tech
as the clear winners, and ESG as a forceful trend in financial services.
2 WWW.CFAINSTITUTE.ORG1. Executive Summary
■ The financing of economic relief programmes
How the government economic relief programmes will be paid for is a key question
with taxes and debt monetisation under consideration.
■ Monetary stimulus by central banks
The question should now switch to whether it will be possible to normalise monetary
policy while authorities are wondering how to coordinate money supply and fiscal
policy.
■ The socioeconomic consequences of the stimulus measures
Authorities should consider the effects of economic and monetary stimulus on the
fragile balance among the various socioeconomic stratums.
■ Regulators and the crisis
Regulators fared well during the crisis, but a key question now is about the major risks
they should be focusing on.
■ Corporates
In the short-term, it would appear that the risk of corporate credit default risk is on
the rise, but it could normalise over the longer term. In the meantime, corporates
should provide investors with more forward-looking information to enable them to
assess the impact of the crisis more precisely.
© 2021 CFA INSTITUTE. ALL RIGHTS RESERVED. 32. Methodology
About CFA Institute
CFA Institute is the global association of investment professionals that sets the standard
for professional excellence and credentials. The organisation is a champion of ethical
behaviour in investment markets and a respected source of knowledge in the global finan-
cial community. Our aim is to create an environment where investors’ interests come first,
markets function at their best, and economies grow. There are more than 170,000 CFA®
charterholders worldwide in 162 markets. CFA Institute has nine offices worldwide and
supports 158 local societies. For more information, visit www.cfainstitute.org or follow us
on Twitter at @CFAInstitute and on Facebook.com/CFAInstitute.
Why we are Performing this Research
CFA Institute continues to be of the view that there is a great deal of misunderstanding
and misinterpretation about how the current crisis is being analysed and commented on.
Through its global and professional membership, our organisation is uniquely positioned
to participate in the ongoing debate about the potential effects of the crisis on capital mar-
kets and investment management.
Our aim is to provide an honest and unbiased perspective on how our membership views
the key outcomes of this period, from various regional and factual viewpoints. We also
endeavour to bring context to these survey results where possible and where causality
can be established, to propose a rational explanation for the opinions expressed by the
membership.
Notably, to avoid undue speculation, we strive to separate our opinion from facts when
interpreting the results.
Survey Details and Methodology
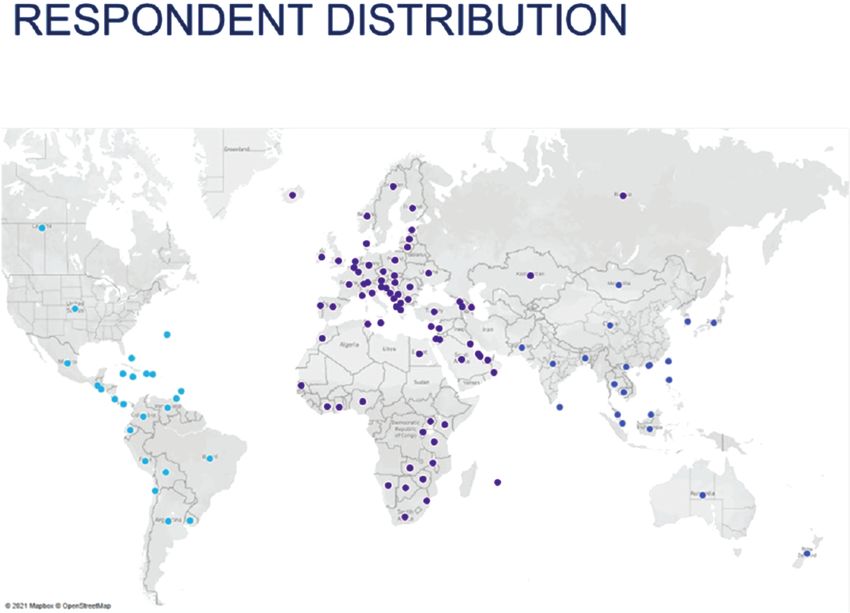
The survey was fielded to the global membership of CFA Institute across all regions and
jurisdictions where the organisation has representation. The survey was sent on 8 March
2021 and closed on 28 March 2021.
4 WWW.CFAINSTITUTE.ORG2. Methodology
A total of 150,024 individuals received an invitation to participate. Of those, 6,040 pro-
vided a valid answer, for a total response rate of 4%. The margin of error was +/-1.2%. See
Appendix 1 for a detailed review of the survey’s demographics.
© 2021 CFA INSTITUTE. ALL RIGHTS RESERVED. 53. Highlights
Key highlights and statistics from the survey include:
■■ On the shape of the economic recovery
Some 44% of respondents globally see the economy of their region recovering in the
form of a K-shape, which is an economic course that affects different categories of
people, businesses, regions, and industries in varying ways. Another 32% of respon-
dents are optimistic as they believe the economy is already on a steady recovery path
and will return to its pre-pandemic pace within one to three years. Some regions are
more pessimistic than others—in particular, only 27% of Europeans responded opti-
mistically compared with 36% of respondents in the United States.
■■ On equity markets
A plurality of respondents globally expressed the view that equities in their respec-
tive markets (45%) and global developed markets in general (43%) have recovered too
quickly from the market slump in February–March 2020 and are due for a correction
within the next one to three years. In all configurations, the proportion of respondents
who believe that equities are properly valued is low in all regions (2–16%). Overall,
the view seems to be that global developed market equities are more overvalued than
those in emerging markets.
■■ On volatility
A large plurality of 48% of respondents globally think market volatility did not have
a material effect on their asset allocation strategy or investment process. Compared
with last year’ survey (32% on that answer), we can see that the decisive actions of
governments and central banks to tame potential market dislocation may have had a
stabilising result.
■■ On inflation
A large majority of 65% of respondents globally believe that an accommodative mone-
tary policy combined with supply side constraints will cause inflationary pressure over
the next one to three years. Those respondents, however, appear to be split equally on
whether this inflation will cause central banks to restrict monetary policy as a result
(31% think central banks will switch to a restrictive policy and 34% think not).
6 WWW.CFAINSTITUTE.ORG3. Highlights
■■ On the structural consequences of the crisis for the economy
At a global level, 58% of respondents agree that the role of government will broaden
as a result of the crisis and that the share of government spending in GDP will struc-
turally and materially rise, as will taxes. In addition, 40% agree that the Build Back
Better movement and the trend toward sustainable investment products is strong (58%
in Europe versus 33% in the United States). These respondents believe that ESG-
compliant products will dominate the financial landscape within the next 10 years.
Also, 34% agree that the crisis has resulted in a growing and consolidated dominance
of a small number of Big Tech companies.
■■ On the financing of economic relief programmes
A large majority of 65% of respondents believe there will be a rise in the general level
of taxation to finance governments’ economic relief programmes. In addition, 51%
agree that governments and monetary authorities will tolerate higher levels of infla-
tion and therefore engage in debt monetisation to finance public deficits. In contrast,
43% are of the view that the economic recovery will permit a gradual repayment of
debt over time through growth. There is regional dichotomy on this question between
advanced and emerging economies, where the former show a higher level of concern
about tax rises, inflation, and debt monetisation than the latter group.
■■ On unorthodox monetary policy measures
At a global level, respondents are split on whether the current extraordinary cycle
of accommodative monetary policy should start being restricted (51%) or whether
it should be continued to support people and businesses until the economy is suf-
ficiently stable (43%). On this question, there is a divide between Europe and the
United States, with the latter showing a marked preference for a swift exit strategy
by central banks and a return to a normalised monetary policy. On the form that
an exit planning strategy should take if central banks decide to reverse course, 70%
think interest rates should be gradually realigned with the economic cycle and infla-
tion expectations. On the question of the importance of central bank’s independence,
35% would support a coordination of monetary and fiscal policy, whereas 29% think
it is a bad idea because central banks should operate independently from the Treasury.
Finally, on the market impact to be expected if central banks were to plan an exit
strategy, the story is clearly about value stocks versus growth stocks—49% of respon-
dents think value stocks would be the most positively affected asset class, whereas 41%
think growth stocks would be the most negatively affected.
© 2021 CFA INSTITUTE. ALL RIGHTS RESERVED. 7COVID-19, One Year Later
■■ On the socioeconomic consequences of the stimulus measures
At a global level, 44% of respondents believe the stimulus measures have created a
goldmine for the investor class, widening the wealth gap with the working class. In
addition, 41% believe that the stimulus measures were necessary and that they have
benefitted society at large, even if the various relief programmes could have been bet-
ter targeted. In addition, 39% believe that a combination of asset inflation and eco-
nomic hardship during the crisis has created the conditions for a large new set of
risk-taking and uninformed investors to be active in capital markets—or the gamifica-
tion of capital markets. Also important, 37% of respondents agree that the current
accommodative monetary policy and financial support measures have resulted in as
significant financial asset bubble.
■■ On regulators’ role in the crisis and key risks for them to consider
Globally, a majority of respondents (51%) agree that regulators have overall properly
addressed the situation in line with their mandate. A quarter of respondents (26%)
think that the measures enacted were excessive—that is, over and beyond what was
necessary to stabilise the system. On the question of key risks regulators should now
focus on, 40% agree that systemic risk and “too-big-to-fail” institutions in risk of dis-
tress should be a concern for regulators, 36% think regulators should focus on the risk
of pension systems undergoing severe stress as a result of the crisis, 34% support the
view that regulators should address the risk of a breakdown in credit and money mar-
kets, and 30% are worried about the risk of regulatory overload. Interestingly, ESG
featured among the least-identified risks, with only 18% thinking regulators should
focus on ESG matters.
■■ On corporate credit risk and financial reporting priorities
A majority of 56% of respondents globally think credit default risk has increased in
the short term (1–3 years), compared with 43% who think so in the medium term
(5 years) and 32% over the long term (10 years), which may indicate that respondents
expect the market to stabilise progressively. Emerging market economies show a
higher level of concern over corporate credit risk than advanced economies. On the
question related to financial reporting priorities as we emerge from the crisis, 23%
of respondents agree that forward-looking information is the most important aspect
to focus on, to help assess the impact of the crisis on companies’ anticipated results.
Another 20% feel the priority should be to show the impact of the crisis on estimates,
including goodwill, loans, and intangibles.
8 WWW.CFAINSTITUTE.ORG4. Key Messages for Governments,
Policy Makers, and Regulators
Our research on the effects of the COVID-19 crisis and that of the response measures
crafted to address the resulting economic fallout is showing that government intervention,
public policy, and regulation are not an easy and linear mechanism to use with predictable
outcomes.
In a world that is globalised in nature, the complexity of economic and financial crises
could easily be analysed through the prism of chaos theory or the butterfly effect.2 Policies
are often double-edged swords that may have unintended consequences on the existing
socioeconomic or financial equilibrium. CFA Institute believes these potential effects
should be analysed and considered as part of the response to future crises.
Set forth below are the key messages our research has highlighted, for the attention of
governments, policy makers, and regulators:
■ If it in fact materialised, a K-shape economic recovery could signal a structural inflec-
tion point for the economy in general, but also for the series of economic agents that
would be affected in materially different ways. Authorities should pay attention to the
sectors, workers, and populations who may not be prepared for a redesigned economic
landscape.
■ It is important to ask whether it is realistic for equity markets to stay ahead of, or be
out of sync with, the real economy for a prolonged period of time. In such a context,
the potential effect of an abundance of liquidity in financial markets may be distorting
2 US mathematician and MIT Professor Edward Lorenz (1917–2008) was a pioneer of chaos theory. This theory was
first applied to weather predictions and Lorenz observed that there was a cyclical nonlinear nature to weather; however, he
remarked that the profession continued to apply linear statistical models in meteorology. In 2004, French mathematician
Benoit Mandelbrot applied concepts of chaos theory and complexity to the behaviour of financial markets to challenge the
notion that financial markets are efficient or predictable. In his Misbehavior of Markets (2004), Mandelbrot argues that finan-
cial markets follow patterns (fractals) that repeat themselves in large or small scales, exposed to unpredictable events. This
idea is indirectly used as well by financier and author Nassim Nicholas Taleb in his seminal works, Black Swan (2007) and
Antifragile (2012). The butterfly effect is related to chaos theory in that it represents “the idea that some complex dynamical
systems exhibit unpredictable behaviors such that small variances in the initial conditions could have profound and widely
divergent effects on the system’s outcomes” (Jamie L. Vernon, “Understanding the Butterfly Effect,” American Scientist 105,
no. 3 (2017): 130). Our thesis is that economic crises have evolved over the years into more chaotic systems in the sense
described by chaos theory and the butterfly effect.
© 2021 CFA INSTITUTE. ALL RIGHTS RESERVED. 9COVID-19, One Year Later
the natural creative destruction mechanism of the free-market economy, as a vector of
iterative innovation. It is also possible that the current situation may be the source of
bigger crises in the future, as the natural cleansing process will not have taken place.
The phenomenon of zombie companies should be analysed.
■ If materialising, the rise of government as an economic agent responsible for a grow-
ing share of GDP could have consequences for the free-market economy. We should
not necessarily assume that this transition will be smooth for the typical processes
involved in price formation, debt management, capital raising, innovation, or research
funding.
■ Authorities should pay attention to the risk that a continued accommodative monetary
policy may undermine faith in fiat currencies. In parallel, economic agents may be
shifting their trust onto cryptocurrencies, which could be benefitting from the belief
that these means of payment are kept clear of government intervention. Ultimately, if
materialising, such a development could reduce the capacity of monetary authorities
to effect policy efficiently.
■ It is possible the continued drive of accommodative monetary policy since the 2007–
2009 Global Financial Crisis may have altered the traditional readjustment mecha-
nisms between asset classes according to the economic cycle. In particular, the typical
risk-on and risk-off cycles between value-oriented and growth-oriented stocks have
been disrupted. Such a phenomenon could have consequences in the future on capital
allocation and investor risk appetite. Policy makers should stay alert to such potential
distortionary side effects of monetary policy.
■ Authorities should consider the potential unintended consequences of monetary stim-
ulus on the socioeconomic equilibrium. In connection with the K-shape economic
recovery, a widening of the wealth gap could become a disincentive to entire cat-
egories by discouraging engagement in economic activity. In parallel, if a financial
asset bubble is emerging, such a phenomenon could further destabilise socioeconomic
aggregates.
■ The question of the gamification of financial markets should be analysed in terms of
its potential structural effects on the following: price formation, prudent investing
rules, retirement planning, and risk appetite. It is possible that the crisis, combined
with an accommodative monetary policy cycle, may have favoured the rise of a new
class of uninformed day traders taking on more risk than would be warranted by their
investor profile.
10 WWW.CFAINSTITUTE.ORG4. Key Messages for Governments, Policy Makers, and Regulators
■ When designing future economic relief programmes and monetary stimulus mea-
sures, authorities should consider integrating accountability and impact metrics as
part of the plan. The current approach may have aggravated the level of asymmetric
risk and moral hazard in the system, where large financial institutions continue to
benefit from a risk-reward paradigm that works in their favour. Such a framework is
not conducive to reconciling the general public with financial markets.
■ Regulators should continue to focus on systemic risk in financial markets. Short-term
funding and money markets are showing that they continue to require the assistance
of the government and central banks in times of stress, which would demonstrate that
the system at large has not yet reached the desired state of resilience that was aimed
for in the aftermath of the 2007–2009 Global Financial Crisis.
■ The impact of the crisis on the viability of pension systems should be considered by
regulators. The theme of pensions and the accumulation of long-term savings is rising
as a key structural risk, alongside the known secular changes to demographics and
economics that are affecting the sustainability of pension systems. Given the size of
the economic aggregates that pensions represent, stress in this sector could have rami-
fications in broader financial markets.
■ Regulators also should consider the risk of regulatory overload, as firms are grap-
pling with a regulatory framework whose breadth and depth has accelerated markedly
since the 2007–2009 Global Financial Crisis. The risks related to regulatory over-
load include subdued innovation, industry consolidation, reduced investment choices,
focus on costs rather than on quality, and reduced access to quality advice.
© 2021 CFA INSTITUTE. ALL RIGHTS RESERVED. 115. Details of Results
5.1 A K-shape Economic Recovery: Are we
Engineering A Post-pandemic World Made up
of Clear Winners and Losers?
CFA Institute asked our membership this very question regarding the shape of a potential
recovery in an April 2020 survey.
At that time, our conclusion had been that the CFA Institute membership appeared to
be more conservative than the positive and optimistic commentaries heard in a series of
industrial sectors, including technology and banking. Indeed, close to 80% of respondents
were of the view that the economy would be slow or stagnant over the short term (two to
three years), before eventually picking up in the medium term—the so-called hockey stick
or slow U-shape recovery.
One difficulty of assessing this recovery resides in measuring the true inflection point
past which we can confidently say that the economy is on an upward trajectory and will
recuperate from the crisis. This point may have been reached toward the end of 2020, at
least in certain parts of the world as we will discuss, yet the annual impact now measured
for the whole of 2020 is known, and it is severe. These trend cycles work on a rolling basis,
so any analysis of the impact of the crisis must be executed with caution and over longer
periods of time to measure true momentum. The whole story, indeed, will be discovered
gradually over the next few years.
Data from the International Monetary Fund (IMF) provide a quick snapshot of the real
impact of the crisis between 2019 and 2020 on the global economy:
■ The global economy shrank by 3.3% in 2020.
■ On a global scale, the 2020 crisis has been the worst experienced by the world econ-
omy since the 1930 Great Depression.
■ A large majority of countries experienced a technical recession over the period.
■ The only major economy to avoid a recession and register a growth in read GDP was
China, at 2.3%.
12 WWW.CFAINSTITUTE.ORG5. Details of Results
■ Most countries have experienced a rise in unemployment figures despite government
support measures (e.g., from 3.7% to 8.9% of the active population in the United
States, 3.8% to 5.4% in the United Kingdom, 5.7% to 9.7% in Canada, and 11.9% to
13.4% in Brazil). The impact has been variable, however, depending on government
programmes, and other jurisdictions have been able to contain at least part of the
impact. It is also possible we are not yet seeing the true structural impact of the crisis
and the output gap that has resulted. In this context, France’s unemployment rate had
increased only marginally from 8.5% to 8.9% at the end of 2020, while Germany’s
rate increased from a low level of 3.1% to 4.3% and Japan also increased from a low
point of 2.4% up to 3.3%.
■ Also worrying at the end of 2020 was the level of advertised job vacancies. In most
countries, although gradually improving after the crash of spring 2020, the level of
new vacancies was still below the level observed in 2019 at the same time.
Nevertheless, the IMF now expects the world economy to expand by 6% in 2021. At a
local level, it projects that the United States will see a real GDP growth of 6.4% over the
same period, while the European Union is expected to see growth of 4.4% and Japan of
3.3%.
In this environment, the question is now shifting to the real risk or possibility that the
recovery takes different forms and degrees of momentum in different parts of the world,
for different industries, and importantly, for various classes of socioeconomic agents.
This scenario is described as a K-shape recovery.
And this also happens to be the picture that the IMF is starting to paint about the world
economy in its latest World Economic Outlook, Managing Divergent Recoveries.3 In a way,
this is a shift in the IMF’s stance on the long-term impact of the crisis since its previous,
and much more sombre, outlook in October 2020.
The view seems to now be one in which the massive recovery packages, relief programmes,
and monetary stimulus enacted in advanced economies were largely successful at bridging
the pre- and post-pandemic situations. The IMF today predicts the output loss by 2024 in
advanced economies will be limited to 1%, as compared with pre-pandemic assumptions.
Two arguments are advanced to explain this intellectual shift.
3See International Monetary Fund, World Economic Outlook, Managing Divergent Recoveries (Washington, DC: IMF,
April 2021), https://www.imf.org/en/Publications/WEO/Issues/2021/03/23/world-economic-outlook-april-2021.
© 2021 CFA INSTITUTE. ALL RIGHTS RESERVED. 13COVID-19, One Year Later
First, as we also explained in the first survey research, this 2020 crisis was not the result
of pre-existing problematic signs of weakness in economic or financial factors, as was the
case for the 2007–2009 Global Financial Crisis. The economic fundamentals were rea-
sonable, and there was no immediate threat to financial stability. As such, the economic
crisis was self-inflicted as a political measure enacted to address the health crisis. We have
also argued that there are unresolved systemic imbalances in money markets and short-
term funding markets that can cause credit seizure in times of liquidity stress, but these
issues are not what directly caused the 2020 crisis. The Systemic Risk Council (Sponsored
by CFA Institute) recently addressed this lingering issue in its April 2021 response to
the SEC consultation on the reform of money funds in the United States in light of the
March 2020 turmoil in US short-term financing markets.4
Second, as the IMF and other economic circles are pointing out, the bridging of advanced
economies—as well as the resulting recovery that is now being observed early in 2021—
was based on three factors, or levers, that have been coordinated at an international level:
■ A gradual adaptation of work and society to a state of lockdown.
■ The “whatever-it-takes” approach to government relief programmes and central bank
monetary stimulus, through debt and fiscal deficit.
■ The quicker-than-expected and international development of vaccines.
It now appears, however, that emerging and developing economies did not necessarily
have access to these three levers, which is causing a recovery that is now showing signs
of differing speeds depending on local governments’ access to international funding, the
stability and operational efficiency of civil society, and access to vaccines.
Then, even in advanced economies, we face the question of jobs actually lost, especially
for low-skilled workers, and whether this cohort will be able to emerge from the crisis in
decent condition. This question is of particular relevance right now, given that it would
appear that world leaders are aiming for the recovery to take a particular colour, that is,
green and digital. How fast can a generation of workers adapt to a top-down mandate to
transform the very fabric of the economic system on vastly different terms?
4See SRC, “Systemic Risk Council Responds to Securities and Exchange Commission Consultation on Reform of
Money Funds and Other Open-Ended Funds,” The Systemic Risk Council, 12 April 2021, https://www.systemi-
criskcouncil.org/2021/04/systemic-risk-council-responds-to-securities-and-exchange-commission-consultation-on-
reform-of-money-funds-and-other-open-ended-funds/.
14 WWW.CFAINSTITUTE.ORG5. Details of Results
On the market side of the equation, industries and economic sectors have clearly experi-
enced the crisis in differing ways. The US Chamber of Commerce produced an interesting
analysis in September 20205 of the ways in which different industries fared during the
various lockdown periods. It concluded that while industries such as travel, entertain-
ment, hospitality, and food services had clearly slumped, others had actually flourished,
including technology, retail, and software services.
FIGURE 1. MEMBERSHIP SENTIMENT ABOUT THE CURRENT ECONOMIC RECOVERY
Please choose the statement that best characterizes your sentiment about the current economic recovery
in your market:
Global AMER APAC EMEA
50%
45%
44%
43%
43%
45%
40%
34%
32%
32%
35%
27%
30%
25%
20%
15%
11%
11%
10%
10%
8%
10%
7%
6%
5%
5%
4%
4%
4%
4%
4%
4%
4%
5%
0%
A K-shape The economy is A W-shape The economy There will not Not sure.
economic on a steady path economic will get worse be a real
recovery is towards fully recovery is over the next recovery and
forming, where recovering and forming, 1-3 years, long-term
different parts of operating on a whereby the before economic
the economy are pre-pandemic economy will progressively stagnation will
recovering at pace within the seesaw after an recovering. ensue.
different rates, next 1-3 years. initial strong
times or rebound.
magnitudes.
Source: CFA Institute Global Membership Survey, COVID-19, One Year Later (March 2021).
5See
Suzanne Clark, “What Is the K-Shaped Recovery?” US Chamber of Commerce, 3 September 2020, https://
www.uschamber.com/series/above-the-fold/what-the-k-shaped-recovery.
© 2021 CFA INSTITUTE. ALL RIGHTS RESERVED. 15COVID-19, One Year Later
Figure 1 shows how our global membership answered the question on the shape of the
recovery, in March 2021 (one year after the first survey).
The plurality of respondents globally favour a K-shape economic recovery, as discussed
earlier. This would validate the current thesis that we should be prepared for a recovery
that affects people, regions, and industries in different ways.
The responses seem to be reasonably homogeneous at a regional level. Yet, an interesting
observation would be that specific regions appear to be less optimistic than others. In par-
ticular, Europe is among those subregions that are marginally less keen to believe that the
economy is already on a steady path to full recovery. Only 27% of European respondents
chose that option compared with 34% in North America (36% in the United States) and
36% in South Asia.
One explanation for this variation could be that it is taking European governments and
the European Union significant time and effort to agree and enact the technical aspects of
the Recovery and Resilience Facility programme, originally entered into force in February
2021. The EUR700 billion recovery fund, financed through a much-debated mutualisa-
tion of EU debt, is tied to negotiations on national recovery and resilience plans, along-
side requested structural reforms, including on pension systems, sustainability, and how
to bring back public deficits in line with Maastricht Treaty rules. Commentators have
argued that the EU’s recovery could be delayed as a result.
As we have sought to highlight, in general, emerging and developing economies appear to
be less optimistic about the economic recovery. Only 23%, 25%, and 27%, respectively, of
respondents in Latin America, Middle East, and Africa believe their economy is already
on a steady path to recovery. They also believe in higher proportion (7%, 9%, and 8%) that
a real economic recovery will not occur and that long-term stagnation will ensue.
16 WWW.CFAINSTITUTE.ORG5. Details of Results
5.2 Equity Markets and the Real Economy:
Are They Out of Sync?
The debate continues to rage about the pace of the economic recovery and whether equity
markets have been riding a wave of their own. This recovery perhaps reflects monetary
stimulus rather than economic fundamentals.
When considering actual real GDP progression numbers, several advanced economies
seem to be on a steady path to reaching levels last seen in February 2020, immediately
before the March slump. This trend is evidenced in the latest Organisation for Economic
Co-operation and Development (OECD) Economic Outlook released in March 2021
(Figure 2).6
FIGURE 2. OECD WEEKLY GDP TRACKER (% CHANGE YEAR ON YEAR)
USA JPN DEU GBR AUS
5
0
–5
–10
–15
–20
–25
Mar-20 May-20 Jul-20 Sep-20 Nov-20 Jan-21 Mar-21
Source: OECD, Economic Outlook (March 2021).
6See OECD, Economic Outlook, Interim Report March 2021, Strengthening the Recovery: The Need for Speed (Paris:
OECD Publishing, March 2021), https://www.oecd-ilibrary.org/economics/oecd-economic-outlook/volume-2020/
issue-2_34bfd999-en.
© 2021 CFA INSTITUTE. ALL RIGHTS RESERVED. 17COVID-19, One Year Later
In terms of projections, Berenberg Bank developed interesting anticipation trends toward
the end of 2020, using data from Eurostat, the UK Office for National Statistics (ONS),
and the US Bureau of Economic Analysis (BEA) (Figure 3).
FIGURE 3. OUTLOOK FOR REAL GDP IN ADVANCED ECONOMIES (Q4 2019 = 100)
US Eurozone UK
110
105
100
95
90
85
80
75
2019 2020 2021 2022
Real GDP, Q4 2019 = 100. Quarterly data; dotted lines are Berenberg forecast.
Source: Berenberg, Eurostat, ONS, and BEA.7
As shown in Figure 3, Berenberg Bank was predicting that the United States would
return to real GDP levels observed before the pandemic slump as early as in Q1 2021.
The OECD outlook report showed interesting projected real GDP trends for advanced
and emerging economies (Figure 4). Notably, those trends have improved compared with
mid-2020 levels.
7Christian Bettinger et al., Horizon, Q3 2020 (Hamburg: Berenberg, June 2020), https://www.berenberg.de/filead-
min/web/asset_management/news/horizonte/Horizon_2020-Q3.pdf.
18 WWW.CFAINSTITUTE.ORG5. Details of Results
FIGURE 4. GLOBAL GROWTH PROSPECTS
A. World GDP B. G20 advanced economies C. G20 emerging-market economies
November 2019 projection November 2019 projection November 2019 projection
December 2020 projection December 2020 projection December 2020 projection
March 2021 projection March 2021 projection March 2021 projection
2019Q4=100 2019Q4=100 2019Q4=100
110 110 115
105 105 110
100 100 105
95 95 100
90 90 95
85 85 90
19Q4
20Q2
20Q4
21Q2
21Q4
22Q2
22Q4
19Q4
20Q2
20Q4
21Q2
21Q4
22Q2
22Q4
19Q4
20Q2
20Q4
21Q2
21Q4
22Q2
22Q4
Source: OECD, Economic Outlook (March 2021).
Yet, as we explained in the first chapter, the structural impact of the crisis on medium-
term economic growth trends measured in terms of the output gap compared with pre-
pandemic levels could be much higher, in general, in emerging or developing economies
than in advanced economies (Figure 5).
As discussed, these trends and projections seem to be related, in part, to a simple analysis
of the pace of vaccine rollout per jurisdiction.
In the meantime, compared with previous crises, world equity markets have recovered at a
quicker pace than usual (Figure 6).
Global equities had reached an all-time high in April 2021, as measured by the market
cap weighted index MSCI World (Figure 7).
© 2021 CFA INSTITUTE. ALL RIGHTS RESERVED. 19COVID-19, One Year Later
FIGURE 5. PROJECTED MEDIUM-TERM COSTS FROM THE PANDEMIC
GDP in 2022Q4 relative to November 2019 projection % difference
1
0
–1
–2
–3
–4
–5
–6
–7
–8
–9
USA TUR JPN DEU CHN ITA CAN RUS FRA KOR BRA AUS SAU EA17 WLD GBR MEX ARG ESP ZAF IDN IND
Source: OECD, Economic Outlook (March 2021).
FIGURE 6. WORLD EQUITY INDICES PROGRESSION SINCE 31 DECEMBER 2019 (US: S&P
500, GERMANY: DAX 30, JAPAN: NIKKEI 225, UK: FTSE 100)
28.92%
FTSE 100 Nikkei 225 S&P 500 DAX 30 25.30%
20.00%
16.69%
10.00%
0.00%
–10.00% –7.85%
–20.00%
0%
20 Mar May Jul Sept Nov 2021 Mar
Source: Data from Yahoo Finance, FactSet8
8Yahoo Finance, FTSE 100, https://uk.finance.yahoo.com/quote/%5EFTSE?p=%5EFTSE&guccounter=1; Nikkei 225,
https://uk.finance.yahoo.com/quote/%5EFTSE?p=%5EFTSE&guccounter=1; S&P 500, https://uk.finance.yahoo.com/
quote/%5EGSPC/history?p=%5EGSPC; DAX Performance-Index, https://uk.finance.yahoo.com/quote/%5EGDAXI/
history?p=%5EGDAXI.
20 WWW.CFAINSTITUTE.ORG5. Details of Results
FIGURE 7. MSCI WORLD INDEX (PRICE) SINCE 1980, US DOLLARS
2941.75
2500
2000
1500
1000
500
1983 1987 1991 1995 1999 2003 2007 2011 2015 2019
Source: MSCI All Country World Index, MSCI.com.
The Buffet Indicator can be used to actually measure whether the recovery of equity mar-
kets has been out-of-sync with the real economy. This metric tracks the ratio of stock mar-
ket capitalisation to GDP. CFA® charterholder Dhruv Goyal released a piece in February
2021 on this metric, precisely to measure whether the relationship between economic
growth and equity markets performance had changed.9
His findings revealed that the indicator had reached an all-time high in the third quarter of
2020. Observing that part of this result was due to a higher share of the private sector’s growth
in the economy over the past 40 years, he also depicted how the increase in money supply—
and therefore monetary stimulus—may have played a role in this decoupling (Figures 8 and 9).
To assess our membership’s opinion, we asked them what they thought about equities
in their respective market, as well as in global developed market equities and in global
emerging market equities. The results are shown in Table 1.
A plurality of members globally expressed the view that equities in their respective mar-
kets (45%) and global developed markets in general (43%) have recovered too quickly and
are due for a correction expected within the next one to three years.
9See Dhruv Goyal, “Beware the Bubble? The US Stock Market Cap-to-GDP Ratio, Enterprising Investor,”
Enterprising Investor, 2 February 2021, https://blogs.cfainstitute.org/investor/2021/02/02/beware-the-bubble-the-us-
stock-market-cap-to-gdp-ratio/.
© 2021 CFA INSTITUTE. ALL RIGHTS RESERVED. 21COVID-19, One Year Later
FIGURE 8. US STOCK MARKET FIGURE 9. US STOCK MARKET
CAPITALIZATION VERSUS NOMINAL GDP, IN CAPITALIZATION VS. MONEY SUPPLY, IN
US DOLLARS (BILLIONS) US DOLLARS (BILLIONS)
50000 50000
Market capitalisation
Nominal US GDP
40000 Money supply (money of zero maturity)
40000 Market capitalisation
30000 30000
20000 20000
10000 10000
0 0
1970
1974
1978
1982
1986
1990
1994
1998
2002
2006
2010
2014
2018
1970
1974
1978
1982
1986
1990
1994
1998
2002
2006
2010
2014
2018
Source: Data from St. Louis Fed, BEA, Earthen Street Source: Data from St. Louis Fed, BEA, Earthen Street
Capital. Courtesy of Dhruv Goyal, CFA.10 Capital. Courtesy of Dhruv Goyal, CFA.11
This is an interesting result as it could show that CFA Institute members believe there is
a true disconnect between economic growth fundamentals and capital markets caused in
part by monetary stimulus, which will be corrected in a not too distant future.
With 21% of responses globally opting for Not Sure, there still seems to be significant
uncertainty about the status of emerging market equities.
Whatever the configuration, the proportion of respondents who believe that equities are
properly valued is low in all regions (between 2% and 16%).
Several regional variations and cross-factorial differences are worth pointing out:
■ Respondents in North America (the United States, in particular), at 50%, are more
worried about a correction than Europeans (40%), which can be explained by the pace
of equity markets in both regions.
■ A correlation exists between expressed pessimism on the shape of the recovery
(Question 1) and the view that equities in general are overpriced.
10 This chart originally appeared in Goyal, “Beware the Bubble?” Enterprising Investor.
11 This chart originally appeared in Goyal, “Beware the Bubble?” Enterprising Investor.
22 WWW.CFAINSTITUTE.ORG5. Details of Results
TABLE 1. MEMBERSHIP OPINION ON THE EQUITY MARKETS IN RESPONSE TO COVID-19
Please choose the statement that best characterizes your sentiment about the following equity markets, after
the economic shock caused by COVID-19:
Global AMER APAC EMEA
Equity markets have recovered Equities in your market 45% 48% 43% 38%
too quickly on the impulse of
monetary stimulus; they are now
out of pace with the real economy Global developed market equities 43% 35% 55% 51%
and a correction is to be expected
within the next 1-3 years. Global emerging market equities 25% 21% 34% 29%
Equities in your market 7% 6% 8% 9%
Equity markets are correctly
priced; they properly reflect
Global developed market equities 7% 9% 3% 5%
fundamentals or economic
expectations.
Global emerging market equities 10% 12% 5% 10%
Equities in your market 16% 17% 13% 18%
Equity markets will stay on their
current upward trend for a
prolonged period of time as Global developed market equities 16% 16% 13% 19%
monetary stimulus is unlikely to
be waned.
Global emerging market equities 18% 19% 14% 18%
Equities in your market 26% 25% 33% 26%
Equity markets will gradually
stabilize in line with the real
economy while monetary Global developed market equities 25% 28% 22% 18%
policy progressively
normalises.
Global emerging market equities 26% 26% 28% 24%
Equities in your market 6% 4% 4% 9%
Not sure Global developed market equities 9% 12% 6% 5%
Global emerging market equities 21% 23% 18% 18%
Source: CFA Institute Global Member Survey, COVID-19, One Year Later (March 2021).
■ A correlation exists between inflation expectations (which will be analysed in forthcoming
sections) and views about equity valuation. Respondents who do not think inflation pres-
sures will manifest over the next one to three years also believe that a continuing expan-
sionary cycle of monetary policy will keep equity prices on an upward trend.
© 2021 CFA INSTITUTE. ALL RIGHTS RESERVED. 23COVID-19, One Year Later
■ Respondents in emerging markets appear more optimistic that equities in their own
market and in global emerging markets in general will gradually stabilise.
■ The overall view seems to be that global developed market equities are more overval-
ued than those in global emerging markets. This could make sense given the varia-
tions in monetary stimulus and government relief programmes enacted in different
parts of the world.
The Impact of Market Volatility
Then we considered the question of market volatility. We wanted to see if our members’
position on this question had changed from a year ago.
Equity volatility in US markets as measured by the CBOE VIX Index appears to have
retreated to levels generally seen between 2012 and 2020 (Figure 10).
FIGURE 10. CBOE VOLATILITY INDEX (VIX)
2020 crisis
40
20
0
Source: MarketWatch.12
When asked if market volatility in the 2020 crisis had had an impact on their professional
activity and asset allocation choices, the responses between the two surveys compared in
the following ways (Figure 11):
Respondents were largely circumspect in response to the April 2020 survey, but a large plu-
rality of 48% globally now think volatility did not have a material impact on their activity
or that of their firm. This opinion could be in line with the decisive actions of authorities to
tame potential market dislocation through public intervention and monetary stimulus. In
effect, the proportion of respondents who have indicated that volatility had had an impact
12MarketWatch, CBOE Volatility Index, https://www.marketwatch.com/investing/index/vix/download-data?start
Date=12/31/2015&endDate=5/20/2021.
24 WWW.CFAINSTITUTE.ORG5. Details of Results
FIGURE 11. COMPARISON OF MEMBER RESPONSES TO IMPACT ON PROFESSIONAL
ACTIVITY
(a) March 2021
Market volatility has moved sharply since the worldwide emergence of the COVID-19 crisis, for global equities
and fixed income instruments. Select the statement that best describes how you feel about market volatility in
your local market:
GLOBAL AFRICA EAST ASIA EUROPE LATIN AMERICA & CARIBBEAN
MIDDLE EAST NORTH AMERICA SOUTH ASIA SOUTHEAST ASIA & OCEANIA
60%
53%
51%
48%
50% 43%
40%
38%
37%
37%
40%
33%
33%
33%
32%
30%
29%
29%
28%
28%
30%
26%
26%
24%
24%
24%
22%
19%
18%
20%
16%
13%
10%
0%
My firm is currently investigating Market volatility has had no Market volatility has forced my
how market volatility could impact significant impact on my firm to significantly alter its
our strategic asset allocation or activity or my firm’s activity. investment management
investment choices. processes or allocation choices.
Note:
“Not relevant for me” response option excluded from analysis.
"Not sure" response option not displayed.
(Continued)
has fallen in all regions (from 26% to 18% globally). Exceptions here concern emerging mar-
kets in Africa and the Middle East, who have seen an increase in the proportion of respon-
dents who indicated market volatility had had a significant impact.
© 2021 CFA INSTITUTE. ALL RIGHTS RESERVED. 25COVID-19, One Year Later
FIGURE 11. COMPARISON OF MEMBER RESPONSES TO IMPACT ON PROFESSIONAL
ACTIVITY (CONTINUED)
(b) April 2020
Market volatility has moved sharply since the worldwide emergence of the COVID-19 crisis, for global equities
and fixed income instruments. Select the statement that best describes how you feel about market volatility:
GLOBAL AFRICA EAST ASIA EUROPE LATIN AMERICA & CARIBBEAN
MIDDLE EAST NORTH AMERICA SOUTH ASIA SOUTHEAST ASIA & OCEANIA
50%
46%
45%
43%
45%
42%
41%
41%
41%
40%
40%
40%
37%
35%
35%
34%
34%
35%
32%
32%
31%
28%
30%
26%
25%
25%
24%
24%
25%
22%
22%
18%
20%
17%
15%
10%
5%
0%
My firm is currently investigating Market volatility has had no Market volatility has forced my
how market volatility could impact significant impact on my firm to significantly alter its
our strategic asset allocation or activity or my firm’s activity. investment management
investment choices. processes or allocation choices.
Note:
“Not relevant for me” response option excluded from analysis.
"Not sure" response option not displayed.
Source: CFA Institute Global Member Survey, Is the Coronavirus Rocking the Foundations of Capital Markets? (April
2020); CFA Institute Global Member Survey, COVID-19, One Year Later (March 2021).
Regional variations, however, are showing yet again that emerging markets have experienced
market volatility differently, which may be explained by the differing levels of public support
in those regions. Respondents in Africa (37%), Latin America (29%), Middle East (38%), and
South Asia (33%; including India and Pakistan) continue to show a more significant level of
impact from volatility on their investment processes and asset allocation choices.
26 WWW.CFAINSTITUTE.ORG5. Details of Results
5.3 Inflation is Showing Up: But will it Last?
It is possible to view the current debate on inflation as one of timing and cycles. As much
as inflation is an economic factor that is difficult to predict, we recognise that different
forces are at play over the short and the long term. Interestingly, the long-term structural
data tends to point to continued deflationary pressures.
Foremost, an ageing population and the globalisation of exchanges are both factors that
are acting against a marked increase in consumer prices. The role of technology advances
warrants further analysis in terms of its interplay with productivity. In essence, classical
economics have taught us that GDP growth comes from a combination of the growth in
the labour force and that of labour productivity. It is fair to say that the role of labour force
growth has diminished over the years since the post–World War II economic expansion
phase.13 In other words, the resulting growth in real GDP that was attained probably was
due to two factors: (1) productivity growth, although the gains observed have been mod-
erate in the industrial world until the 2008 crisis; and (2) it can be argued that GDP has
been able to grow in real terms thanks to an increasing role of retail consumption fuelled
by an economy largely based on an expansion of credit, especially in the United States.
This latter idea was developed by historian Clarence Carson as early as 1985.14 Figures
12 and 13 show the progression of the US federal debt and household debt over the years.
Over the short and medium term, however, the story looks different.
The question is whether the massive monetary stimulus and economic relief programmes
decided by governments will have an impact on consumer prices. As this report is being writ-
ten, we are starting to see inflationary pressures on input and producer prices (Figure 14).
In the United States, the annual inflation rate (measured using the Consumer Price Index
[CPI]) has been on the upside since May 2020, along with the relief and stimulus pro-
grammes (Figure 15). In March 2021, the inflation rate reached 2.6% on a rolling annual
basis, returning to levels seen before the crisis hit in February and March 2020. Then, in
May, the figure reached 5.0%, a level last seen in 2008 and before that at the end of the
1980s.
Several factors need to be considered to determine whether inflation is going to rise to
unsustainable levels and for a prolonged period of time:
13See Peter Bisson, Elizabeth Stephenson, and S. Patrick Viguerie, “The Productivity Imperative,” McKinsey &
Company, 1 June 2010, www.mckinsey.com/featured-insights/employment-and-growth/the-productivity-imperative.
14See Clarence Carson, “A Credit Expansion Economy,” Foundation for Economic Education, 1 March 1985, https://
fee.org/articles/a-credit-expansion-economy/.
© 2021 CFA INSTITUTE. ALL RIGHTS RESERVED. 27COVID-19, One Year Later
FIGURE 12. TOTAL PUBLIC DEBT (FEDERAL) IN THE UNITED STATES AS A PERCENTAGE
OF GDP
140
120
100
Percent of GDP
80
60
40
20
0
1970 1975 1980 1985 1990 1995 2000 2005 2010 2015 2020
U.S. recessions are shaded; the most recent end date is undecided. Sources: OMB; St. Louis Fed fred.stlouisfed.org
Source: Federal Reserve Economic Data (FRED).15
■ Pent-up demand. It is possible we will see a rise in consumption of services (catering,
hotels, travel) as economies open up. It is also possible this adjustment will have only
a temporary effect on inflation.
■ Savings rate. Especially in the United States, where savings rates tend to be lower
than in Europe, the question will be whether individual consumers spend or save
the money they receive from the relief programmes. Evidence also suggests that the
personal savings rate has increased significantly as a result of the crisis. Such an effect
would tend to reduce inflationary pressures (Figure 16).
15FRED, “Federal Debt: Total Public Debt at Percent of Gross Domestic Product,” https://www.marketwatch.com/
investing/index/vix/download-data?startDate=12/31/2015&endDate=5/20/2021.
28 WWW.CFAINSTITUTE.ORGYou can also read