Droughts in the area of Poland in recent centuries in the light of multi-proxy data
←
→
Page content transcription
If your browser does not render page correctly, please read the page content below
Clim. Past, 16, 627–661, 2020
https://doi.org/10.5194/cp-16-627-2020
© Author(s) 2020. This work is distributed under
the Creative Commons Attribution 4.0 License.

Droughts in the area of Poland in recent centuries in
the light of multi-proxy data
Rajmund Przybylak1,6 , Piotr Oliński2,6 , Marcin Koprowski3,6 , Janusz Filipiak4 , Aleksandra Pospieszyńska1,6 ,
Waldemar Chorażyczewski
              ˛           2,6 , Radosław Puchałka3,6 , and Henryk Paweł Dabrowski
                                                                              ˛        5

1 Department  of Meteorology and Climatology, Faculty of Earth Sciences and Spatial Management,
Nicolaus Copernicus University, Toruń, Poland
2 Department of Medieval History, Institute of History and Archival Sciences, Faculty of History,

Nicolaus Copernicus University, Toruń, Poland
3 Department of Ecology and Biogeography, Faculty of Biological and Veterinary Sciences,

Nicolaus Copernicus University, Toruń, Poland
4 Department of Meteorology and Climatology, Institute of Geography, Faculty of Oceanography and Geography,

University of Gdańsk, Gdańsk, Poland
5 Dendroarchaeological Laboratory, Archaeological Museum in Biskupin, Biskupin, Poland
6 Centre for Climate Change Research, Nicolaus Copernicus University, Toruń, Poland

Correspondence: Rajmund Przybylak (rp11@umk.pl)

Received: 27 May 2019 – Discussion started: 11 June 2019
Revised: 30 January 2020 – Accepted: 31 January 2020 – Published: 1 April 2020

Abstract. The history of drought occurrence in Poland            criteria used were those proposed by McKee et al. (1993) and
in the last millennium is poorly known. To improve this          modified for the climate conditions of Poland by Łab˛edzki
knowledge we have conducted a comprehensive analysis us-         (2007).
ing both proxy data (documentary and dendrochronological)           More than 100 droughts were found in documen-
and instrumental measurements of precipitation. The paper        tary sources in the period 1451–1800, including 17
presents the main features of droughts in Poland in recent       megadroughts. A greater than average number of droughts
centuries, including their frequency of occurrence, cover-       were observed in the second halves of the 17th century and
age, duration, and intensity. The reconstructions of droughts    the 18th century in particular. Dendrochronological data con-
based on all the mentioned sources of data covered the pe-       firmed this general tendency in the mentioned period.
riod 996–2015. Examples of megadroughts were also cho-              Analysis of SPI (including its lowest values, i.e. droughts)
sen using documentary evidence, and some of them were de-        showed that the long-term frequency of droughts in Poland
scribed.                                                         has been stable in the last two or three centuries. Extreme
   Various documentary sources have been used to identify        and severe droughts were most frequent in the coastal part
droughts in the area of Poland in the period 1451–1800 and       of Poland and in Silesia. Most droughts had a duration of 2
to estimate their intensity, spatial coverage, and duration.     months (about 60 %–70 %) or 3–4 months (10 %–20 %). Fre-
Twenty-two local chronologies of trees (pine, oak, and fir)      quencies of droughts with a duration of 5-or-more months
from Poland were taken into account for detecting nega-          were lower than 10 %. The frequency of droughts of all cat-
tive pointer years (exceptionally narrow rings). The delimita-   egories in Poland in the instrumental period 1722–2015 was
tion of droughts based on instrumental data (eight long-term     greatest in winter, while in the documentary evidence (1451–
precipitation series) was conducted using two independent        1800) droughts in this season are rarely mentioned.
approaches (Standard Precipitation Index, SPI, calculated for       The occurrence of negative pointer years (a good proxy for
1-, 3-, and 24-month timescales, and a new method proposed       droughts) was compared with droughts delimited based on
by authors). For delimitation of droughts (dry months), the      documentary and instrumental data. A good correspondence

Published by Copernicus Publications on behalf of the European Geosciences Union.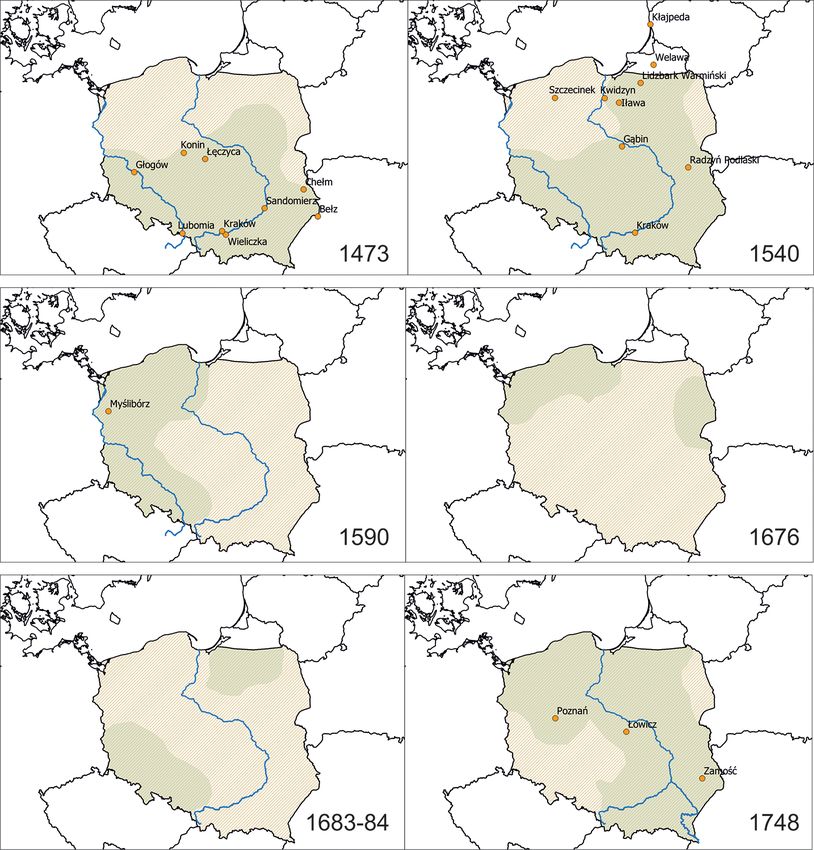
628                                                                 R. Przybylak et al.: Droughts in Poland in recent centuries

was found between the timing of occurrence of droughts              2014; Fragoso et al., 2018; White et al., 2018), and therefore
identified using all three kinds of data (sources).                 a brief overview is omitted here.
                                                                       To estimate how unprecedented the scale of climate dry-
                                                                    ing in recent decades is, a longer perspective is needed.
1   Introduction                                                    Therefore, in recent decades quite a lot of drought recon-
                                                                    structions encompassing almost the entire millennium, or
The increase of the rate of global warming that has been            the shorter historical pre-industrial period, were constructed
observed in recent decades also influences characteristic           for different greater or smaller regions (e.g. Inglot, 1968;
changes in the occurrence and intensity of precipitation            Piervitali and Colacino, 2001; Cook et al., 2004, 2010,
(IPCC, 2013). Although precipitation totals are slightly            2015; Herweijer et al., 2007; Pfister et al., 2006; Brewer et
greater from year to year in some regions, frequency of             al., 2007; Domínguez-Castro et al., 2008, 2010; Woodhouse
precipitation is getting lower while its intensity is increasing.   et al., 2010; Brázdil et al., 2013, 2016, 2018 (see references
As a result, breaks between precipitation episodes are getting      herein); Dobrovolný et al., 2015; Fragoso et al., 2018; Hanel
longer and longer, which significantly favours the occurrence       et al., 2018).
of droughts. The majority of statistical analyses presenting           What is the state of knowledge about drought occurrence
results of drought frequency and intensity averaged for the         and intensity in Poland – the area that is the object of our
entire world (Dai and Trenberth, 1998; Dai et al., 2004; Dai,       studies in this paper? It must be said that for the instru-
2011a, b, 2013; IPCC, 2013) and its different regions (see          mental period, and in particular for the period after World
Held et al., 2005; Alexander et al., 2006; Bartholy and Pon-        War II, the knowledge is good. Papers have been published
gracz, 2007; Łab˛edzki, 2007; Brázdil et al., 2009; Senevi-         analysing the following: (1) classification of drought types
ratne et al., 2012; NAS, 2013; Miles et al., 2015; Osuch            and the development of drought indices (Bak   ˛ and Łab˛edzki,
et al., 2016; Bak ˛ and Kubiak-Wójcicka, 2017; Brázdil et           2002; Łab˛edzki, 2007; Łab˛edzki and Kanecka-Geszke, 2009;
al., 2018) usually confirm their rising tendencies, in partic-      Tokarczyk, 2013; Łab˛edzki and Bak, ˛ 2014); (2) tendencies in
ular in more recent decades. On the other hand, some au-            drought occurrence and intensity (Farat et al., 1998; Magier
thors document that this change for the entire globe is not         et al., 2000; Łab˛edzki, 2007; Kalbarczyk, 2010; Bartczak
as clear as is presented in some above-mentioned publica-           et al., 2014; Radzka, 2015; Wypych et al., 2015; Bak    ˛ and
tions, and it depends among others on the drought metrics           Kubiak-Wójcicka, 2017); (3) monitoring of drought con-
used (Sheffield et al., 2012; Greve et al., 2014, and references    ditions (Łab˛edzki, 2006; Doroszewski et al., 2008, 2012;
therein). For example, Sheffield et al. (2012) argue that over-     Tokarczyk and Szalińska, 2013; IMGW, 2014; ITP, 2014;
estimation of the rate of change of global droughts is related      Łab˛edzki and Bak,˛ 2014); and (4) drought hazard assess-
to the shortcomings (simplifications) of the Palmer Drought         ment for periods when observations are available (Łab˛edzki,
Severity Index (PDSI) used for this purpose. They write             2009; Tokarczyk and Szalińska, 2014). In recent years the
the following: “The simplicity of the PDSI, which is calcu-         influence of future climate change on the occurrence of
lated from a simple water-balance model forced by monthly           droughts in Poland in the 21st century has also been ad-
precipitation and temperature data, makes it an attractive tool     dressed (Liszewska et al., 2012; Osuch et al., 2012, 2016).
in large-scale drought assessments, but may give biased re-         On the other hand, little is known about drought occur-
sults in the context of climate change.” Thus, the reliable es-     rence in the pre-instrumental and early instrumental periods
timate of global tendencies in the occurrence and intensity         in Poland. Generally, only one attempt to form a drought
of droughts still needs more research. Nevertheless, a greater      chronology for the 16th to mid-19th century was proposed
or lesser increase in frequency of droughts in many regions         based on documentary evidence (Inglot, 1968).
have been observed in recent decades. Moreover, climatic               Drought is one of the most stressful factors for trees (Vi-
models project that this tendency probably will be more com-        tas, 2001; Allen et al., 2010; Sohar et al., 2013). The mea-
mon and clear in the future world. The IPCC (2013) report           surement of tree ring widths is one of the ways to study the
concludes that droughts will be not only more frequent but          effect of climate parameters on trees (Zielski et al., 2010).
also more intense in many regions, particularly in areas with       Some factors such as frost or summer drought may have an
dry conditions in today’s climate. For this reason, the study       immediate effect on ring width, whereas other factors, such
of drought occurrence and its intensity is very important, in       as winter drought, may have a delayed effect on ring widths.
particular when its manifold negative socio-economic conse-         This delayed effect occurs because the meristematic tissues
quences are taken into account. Many aspects dealing with           are dormant during the winter months in temperate and cold
drought (definition; kinds – meteorological, agricultural, hy-      climates. The effect of different factors is seen as variations
drological, socio-economic; quantitative ways of measure-           in ring size and structure, which change systematically or
ment; socio-economic consequences; etc.) were described re-         vary slowly throughout the life of the tree (Fritts, 1976).
cently in many publications (e.g. Wilhite and Glantz, 1985;         The effect of drought on tree rings is observed as narrow
Tate and Gustard, 2000; Herweijer et al., 2007; Mishra and          rings (Koprowski et al., 2012; Opała, 2015). The relation-
Singh, 2010; Dai, 2011a; Brázdil et al., 2013, 2018; IPCC,          ships are significant enough to reconstruct drought in tem-

Clim. Past, 16, 627–661, 2020                                                                  www.clim-past.net/16/627/2020/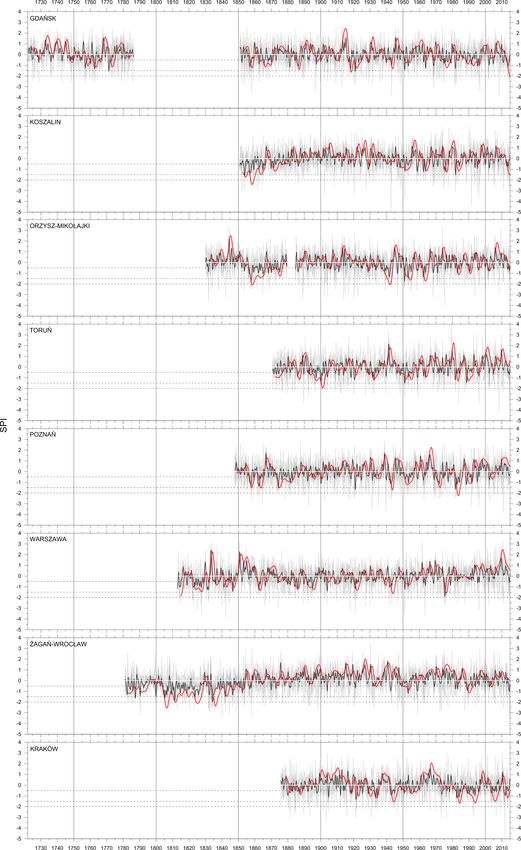
R. Przybylak et al.: Droughts in Poland in recent centuries                                                                629

perate climates and in cold regions like Finland (Helama and      clear and when they had an impact on economic and so-
Lindholm, 2003), Sweden (Seftigen et al., 2013), and Czech        cial life. Another group of sources used by us is daily
Republic (Dobrovolný et al., 2015). Therefore, we have as-        records that have the character of meteorological observa-
sumed that information derived from tree rings can comple-        tions. Sometimes they were prepared by scholars, such as
ment the existing knowledge about past droughts in Poland.        professors Marcin Biem (ca. 1470–1540) and Michał of
According to studies by Somorowska (2016), the effect of          Wiślica (1499–1575) of the Jagiellonian University, who
drought extends from the south-west towards the central part      conducted such observations in Kraków from 1499 to 1531
of the country and, in some cases, to the north-east of Poland.   and from 1534 to 1551 (Limanówka, 2001), or townsmen
Another study suggests that in the future some of the high-       with scientific ambitions such as Gottfried Reyger (1704–
est probability of drought occurrence can be in the central       1788), who began his observations in Gdańsk in 1721 as a
part with the lowest probability in south-eastern Poland (Dia-    17-year-old man and continued them later, among others as
kowska et al., 2018).                                             a member of the Naturforschende Gesellschaft in Gdańsk
   Although in the last three decades many climate recon-         until 1786 (Filipiak et al., 2019). Sometimes daily obser-
structions for the last millennium have been conducted for        vations were conducted by amateurs; the best examples of
Poland (see Przybylak et al., 2005, or Przybylak, 2016, for       which are the records of the Polish nobleman from the east-
a review), droughts were not analysed. Therefore, to fill this    ern territories of the Polish–Lithuanian Commonwealth, Jan
important gap we decided to investigate them in a more de-        Antoni Chrapowicki, which were conducted for the years
tailed manner than was done by Inglot’s team. Moreover, for       1656–1685 (Nowosad et al., 2007). Sources of this kind are
this purpose we used more sorts of proxy data (not only doc-      nonetheless relatively rare.
umentary but also dendrochronological). The reconstructions          The correspondence, the manuscript press (“written
of droughts based on all the mentioned sources of data cov-       newspapers”), and printed press were also used in the
ered the period 996–2015. Thus, the main aim of this paper        reconstruction of droughts. In the case of written newspa-
is to present the main features of drought occurrence, dura-      pers, these are often records similar to those that appear in
tion, and intensity in the area of Poland in this period. Sec-    chronicles. They were drawn up on a regular basis, which
tion 2 describes all the kinds of data used and their quality.    increases their credibility. They provided news from the re-
Section 3 addresses the methods used in this study, including     gion, as well as information coming from other countries,
drought indices. Section 4 presents the results of three recon-   e.g. from Lviv, from which a news writer in 1698 wrote: “w
structions of droughts derived from (1) documentary, (2) in-      tych krajach chaniebnie [! – emphasis added] susze wielkie,
strumental, and (3) dendrochronological data. Examples of         dla których na zim˛e bardzo mało siano, bo nie podobna
megadroughts are also analysed here. The results obtained         lemieszem ukroić ziemi˛e” [in English “in these countries
are discussed in Sect. 5, and the main conclusions are in the     shamefully there are great droughts, for which reason we
last section.                                                     sowed very little for the winter, because you cannot cut
                                                                  the land with the ploughshare”] (Maliszewski, 2018). Other
                                                                  sources that turned out to be useful for the implementation of
2     Data
                                                                  our project were official files (e.g. protocols from meetings
2.1    Documentary data
                                                                  of the regional dietines and the Parliament (Sejm), treasury
                                                                  registers, and inspection reports) and documenting activities
Records on drought for historical reconstruction of cli-          undertaken, e.g. in connection with droughts and fires. They
mate can be found in many different historical sources            reported requests for financial support in connection with
from Poland. Their number has significantly increased since       drought, tax exemption requests, etc. In economic files one
the mid-15th century, which is why the mid-15th century           can find explanations for low harvests, which occurred for
was adopted as the initial chronological boundary for the         example due to drought. There are a few sources concerning
reconstruction of the number and intensity of droughts in         religious behaviours in which, for example, the organisation
the Polish territory using documentary evidence. Below we         of prayers asking for rain or describing the end of a drought
describe the types of historical sources used to reconstruct      were described. When such accounts appeared, it can be as-
droughts in Poland.                                               sumed that the drought must have been severe for people and
   Records of droughts in the Polish territory are most of-       the environment.
ten found in narrative sources – chronicles, yearbooks, mem-         In addition to the above-mentioned historical sources col-
oirs, diaries, and travel accounts. The information included      lected during the queries in Polish, Lithuanian, Ukrainian,
in these sources has a varying degree of accuracy. Often only     and German archives, the authors used several published
one account concerning drought appeared, e.g. “magna sic-         collections (of varied quality) of historical sources concern-
citas”. In many of the records, however, more detailed de-        ing the climate research in the period from the 10th cen-
scriptions of the course of droughts and accompanying phe-        tury to the end of the 18th century for Poland, central Eu-
nomena were given. In the ancient sources droughts were           rope, or selected regions of central Europe. They include
described above all when their manifestations were very           the period from the 10th century to the end of the 16th

www.clim-past.net/16/627/2020/                                                                 Clim. Past, 16, 627–661, 2020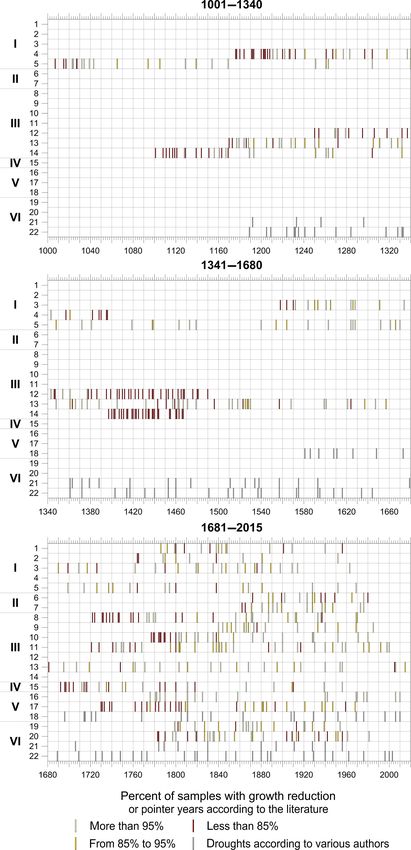
630                                                                R. Przybylak et al.: Droughts in Poland in recent centuries

century (Girguś et al., 1965), the Middle Ages (Malewicz,         2.2     Dendrochronological data
1980), 1450–1586 (Walawender, 1935), the years 1648–1696
                                                                   We used 22 chronologies (17 oak chronologies, 5 pine
(Namaczyńska, 1937), and 1772–1848 (Szewczuk, 1939).
                                                                   chronologies, and 1 fir chronology) from different locations
In the last 20 years, two databases containing over 10 000
                                                                   in Poland to detect pointer years (Table 1, Fig. 1). Table 1
weather records were made available in universities in Toruń
                                                                   presents a list of them, including also time coverage and
and Wrocław as part of cooperation between climatologists
                                                                   sources. As shown in Table 1, the longest chronology avail-
and historians. They have been used many times to study
                                                                   able to us covers the years 996–1986, and it was constructed
Poland’s climate in historical times (Wójcik et al., 2000;
                                                                   for western Pomerania (site 5). For Upper Silesia (sites 16
Przybylak et al., 2001, 2004, 2005, 2010; Przybylak, 2011,
                                                                   and 18) and Lesser Poland (sites 21 and 22), the pointer years
2016); they have also contributed to widening the scope of
                                                                   were detected by Opała and Mendecki (2014) and Opała
this research.
                                                                   (2015) and by Szychowska-Krapiec
                                                                                                  ˛     (2010), respectively (Ta-
   To sum up, for the purpose of this research over 200 ac-
                                                                   ble 1, Fig. 1).
counts referring directly to droughts and prolonged shortages
of rainfall were used, along with a few hundred more descrip-
tions from everyday weather observations, the use and crit-        2.3     Instrumental data
ical elaboration of which allowed periods of drought to be
                                                                   2.3.1    Isolated series
indicated. The state of the preservation of sources for par-
ticular periods and for individual regions is uneven. Most         The number of known precipitation series whose beginnings
of them describe droughts in Silesia, Pomerania, and Lesser        date back to earlier than the 20th century is very limited.
Poland. A large number of entries refer to droughts affecting      There are only a dozen of those that begun before 1800.
the whole territory of Poland. In the case of Silesia, the dis-    Efforts to organise meteorological measurements in Poland
tribution of sources is fairly even for the whole period; in the   were made relatively early in comparison to other European
case of other regions their number increases with successive       countries. The country’s complicated history (e.g. many wars
ages. The only exception is the first half of the 17th cen-        and changes of borders) has resulted in the loss of the major-
tury, in which the number of preserved records is definitely       ity of sources collected in the archives, and in many cases
smaller. To some extent, this was affected by the losses in the    irretrievably. However, actions to restore the long measure-
state of preserved sources that occurred during the Swedish        ment series based on the discovered collections have been
invasion of Polish territories in 1655–1660. Many sources          taken for a few selected locations.
from the first half of the 17th century were then destroyed as        The oldest surviving results of instrumental precipitation
a result of military actions.                                      series in Poland come from Gdańsk and are dated to the first
   The accuracy scale of the collected information is variable.    half of the 18th century. In January 1739, Michael Christoph
Some accounts provide quite precise information concerning         Hanov, a mathematician and physician, started daily obser-
the duration of the drought, even to the accuracy of 1 d, while    vations of weather phenomena and measurements of a dozen
others are definitely more general – they only indicate the        meteorological elements, including precipitation. The results
existence of a drought in a given year. It very often occurs       of his efforts were published in the newspaper Danziger Er-
that one drought is described in several, or sometimes even        fahrungen on a weekly basis. Hanov presented the complete
several dozen, independent sources, which confirms its high        series in his manuscript Wetter Beobachtungen in Danzig
intensity.                                                         1739–1773.
   To assess the credibility of individual records, it was nec-       Hanov’s instrumental series was accompanied by the notes
essary to conduct a critical source analysis, in which it turned   from a weather chronicle authored by Gottfried Reyger. He
out that sometimes even short accounts provided very impor-        started systematic observations of the weather in Gdańsk in
tant and reliable information, while other records with a sim-     December 1721 and carried them out until mid-1786. The
ilar structure proved to be wrong due to the fact that, for ex-    results of observations were used mainly to study how cli-
ample, the year of the occurrence of the drought was changed       mate affects the development of plants. Reyger published the
(e.g. by 1 year) when the information was being copied from        outcomes of his studies in Die Beschaffenheit der Witterung
another, earlier source. The sources containing daily records,     in Danzig vom Jahr 1722 bis 1769 beobachtet nach ihren
as in the case of the memoirs of J. A. Chrapowicki (1988)          Veränderungen und Ursachen erwogen (Reyger, 1770) and
or Reyger (1770, 1788), required a different treatment. It         in Die Beschaffenheit der Witterung in Danzig. Zweyter Theil
was possible to count the days with precipitation and with-        vom Jahr 1770 bis 1786, nebst Zustätzen zur Danziger Flora
out precipitation along with a very precise indication of the      (Reyger, 1788).
duration of the droughts.                                             Reyger usually presented remarks on general weather con-
                                                                   ditions supplemented by some additional data. Months were
                                                                   usually described in a qualitative, even aggregate, manner.
                                                                   His notes were very detailed and even the weather of the par-
                                                                   ticular days or weeks was very often characterised. Reyger

Clim. Past, 16, 627–661, 2020                                                                  www.clim-past.net/16/627/2020/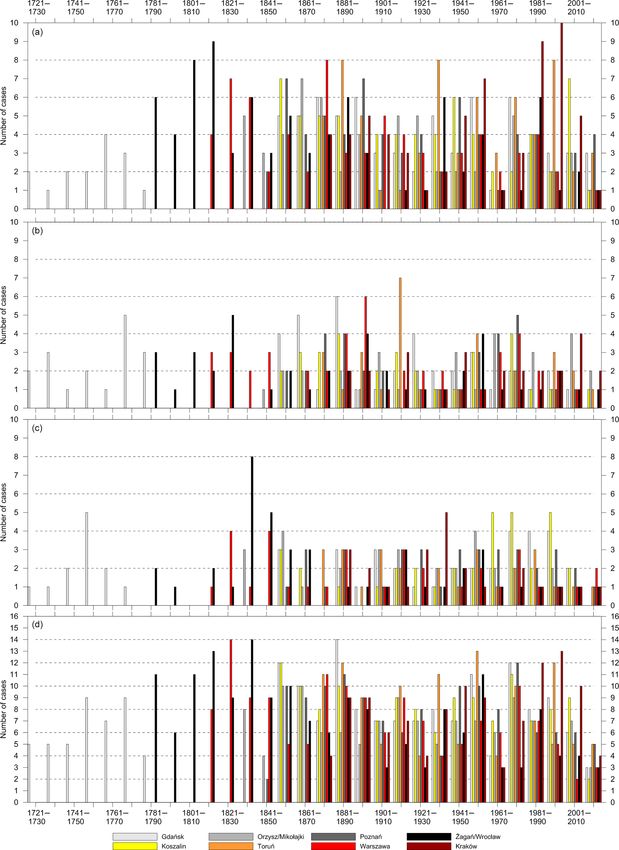
R. Przybylak et al.: Droughts in Poland in recent centuries                                                                                          631

Table 1. Basic characteristics of the chronologies used for pointer year analysis. Locations of natural-forest regions (Zielony and
Kliczkowska, 2010) and sites are shown in Fig. 1. EPS – expressed population signal, rbar.tot – the mean of all correlations between different
cores.

     Site      Site name             Time span    Number      EPS         rbar.tot    Species    Source
     number                                            of
                                                  samples                                        Last access to data bases: 16 March 2020
     Region I (Baltic province)
     Site 1    Koszalin              1782–1987        22     0.899        0.339       Oak        https://www.ncdc.noaa.gov/paleo-search/study/5219
                                                                                                 (Ważny, 1990)
     Site 2    Gdańsk               1762–1986         45    0.887        0.192       Oak        https://www.ncdc.noaa.gov/paleo-search/study/5215
                                                                                                 (Ważny, 1990)
     Site 3    Wolin                 1554–1987        23     0.877        0.318       Oak        https://www.ncdc.noaa.gov/paleo-search/study/5224
                                                                                                 (Ważny, 1990)
     Site 4    Gdańsk               1175–1396         13    0.579        0.388       Oak        Henryk Paweł Dabrowski,
                                                                                                               ˛         unpublished
     Site 5    western Pomerania     996–1986         205    0.907        0.250       Oak        https://www.ncdc.noaa.gov/paleo-search/study/5214
                                                                                                 (Ważny, 1990)
     Region II (Masuria–Podlasie province)
     Site 6    Gołdap                1871–1987         22    0.941        0.472       Oak        https://www.ncdc.noaa.gov/paleo-search/study/5216
                                                                                                 (Ważny, 1990)
     Site 7    Suwałki               1861–1987        19     0.872        0.303       Oak        https://www.ncdc.noaa.gov/paleo-search/study/5221
                                                                                                 (Ważny, 1990)
     Site 8    Hajnówka              1720–1985         19    0.851        0.314       Oak        https://www.ncdc.noaa.gov/paleo-search/study/5217
                                                                                                 (Ważny, 1990)
     Region III (Greater Poland–Pomerania province)
     Site 9    Poznań               1836–1987         17    0.904        0.385       Oak        https://www.ncdc.noaa.gov/paleo-search/study/5220
                                                                                                 (Ważny, 1990)
     Site 10   Zielona Góra          1774–1987         19    0.876        0.330       Oak        https://www.ncdc.noaa.gov/paleo-search/study/5226
                                                                                                 (Ważny, 1990)
     Site 11   Toruń                1714–2015         48    0.886        0.335       Oak        Puchałka et al. (2016)
     Site 12   Tuchola               1249–1490          7    0.054        0.347       Pine       Henryk Paweł Dabrowski,
                                                                                                               ˛         unpublished
     Site 13   Kuyavia-Pomerania     1169–2015        247    0.816        0.195       Pine       Koprowski et al. (2012)
     Site 14   Chojnice              1100–1468        21     0.688        0.327       Oak        Henryk Paweł Dabrowski,
                                                                                                               ˛         unpublished
     Region IV (Masovia–Podlasie province)
     Site 15   Warszawa              1690–1985        19     0.850        0.291       Oak        https://www.ncdc.noaa.gov/paleo-search/study/5223
                                                                                                 (Ważny, 1990)
     Region V (Silesia province)
     Site 16   Upper Silesia         1770–2010        80      0.880     Correlation   Pine and   Opała and Mendecki (2014)
                                                            (average)     0.530       oak
     Site 17   Wrocław               1727–1987        22     0.870        0.327       Oak        https://www.ncdc.noaa.gov/paleo-search/study/5225
                                                                                                 (Ważny, 1990)
     Site 18   Upper Silesia         1568–2010        178    0.850      Correlation   Pine       Opała (2015)
                                                                          0.510
     Region VI (Lesser Poland province)
     Site 19   Kraków                1792–1986        29     0.906        0.361       Oak        https://www.ncdc.noaa.gov/paleo-search/study/5213
                                                                                                 (Ważny, 1990)
     Site 20   Kosobudy              1782–1989         22    0.937        0.448       Oak        https://www.ncdc.noaa.gov/paleo-search/study/5218
                                                                                                 (Ważny, 1990)
     Site 21   Lesser Poland         1109–2004        238   No data      No data      Pine       Szychowska-Krapiec
                                                                                                              ˛     (2010)
     Site 22   Lesser Poland         1109–2006        560   No data      No data      Fir        Szychowska-Krapiec
                                                                                                              ˛     (2010)

www.clim-past.net/16/627/2020/                                                                                    Clim. Past, 16, 627–661, 2020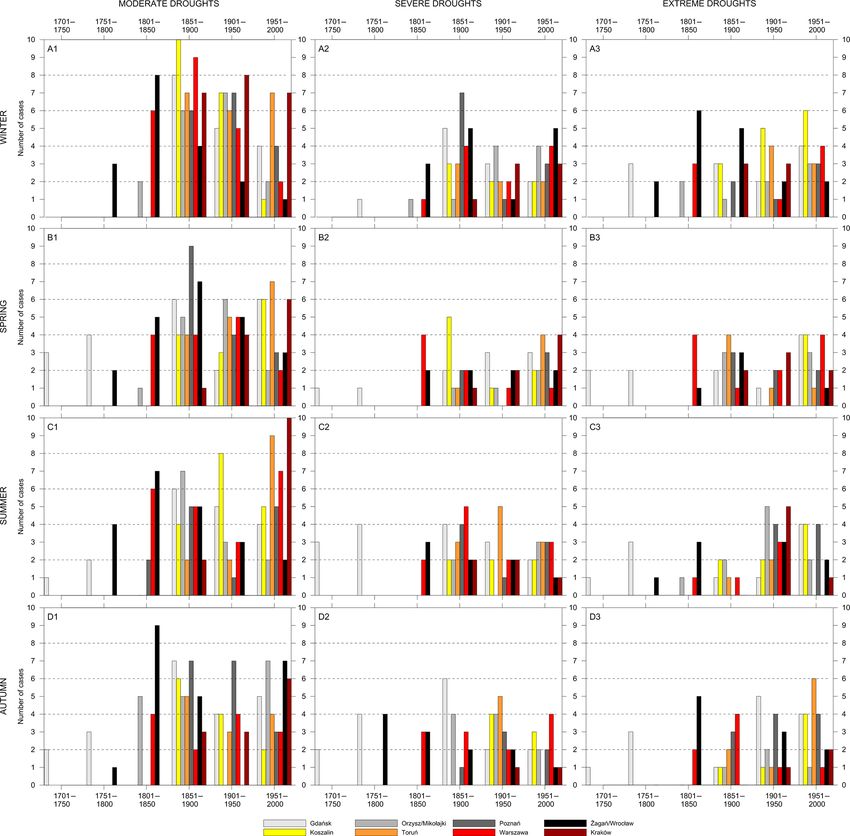
632 R. Przybylak et al.: Droughts in Poland in recent centuries
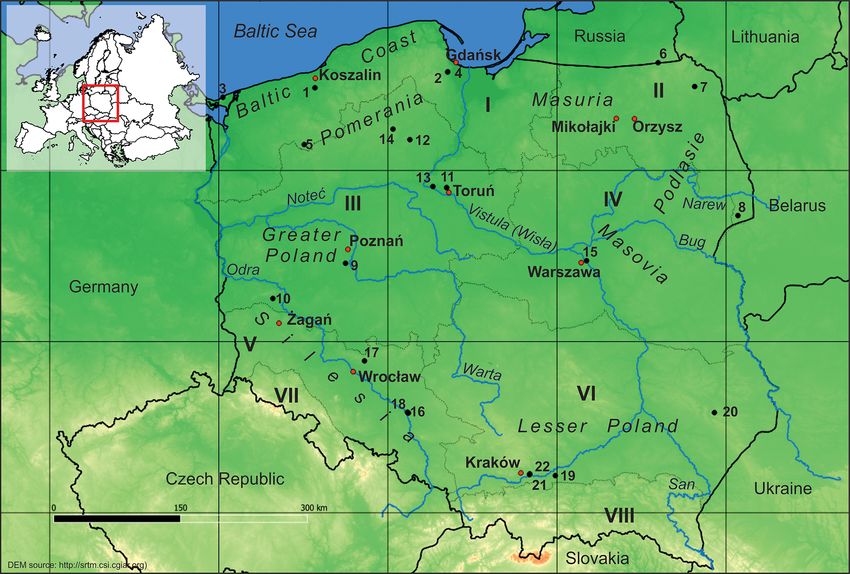
Figure 1. Location of dendrochronological sites and natural-forest regions (black dots and black dotted lines, respectively; for more details
see Table 1) as well as meteorological series (red dots) and geographical regions (for more details see Table 2) used in the study.
paid special attention to particularly important weather and in 1792. The work on completing the collections of the
climate phenomena (heavy rain, floods, droughts, and heat Kraków series continue till the present day, the effect of
and cold waves). His notes after 1783 (Hanov’s death) which are reconstructions of monthly values of precipitation
were more accurate. Despite the lack of measured values of sums since 1863 (Twardosz, 2005, 2007). As for other Polish
precipitation, detailed data on the monthly number of rain- cities, Lorenc (2000) performed a homogenisation of series
fall and snowfall were presented (for more details including of monthly precipitation totals of Warszawa (Warsaw) since
the reconstruction of the air temperature and precipitation se- 1813. Mi˛etus (2002) reconstructed atmospheric precipitation
ries since 1721; see Filipiak et al., 2019). Some sources sug- sums from Koszalin (formerly Köslin) since 1848. In another
gest an even earlier date for the beginning of Reyger’s instru- paper, Kożuchowski and Mi˛etus (1996) presented series of
mental observations (Hellmann, 1883, after Rojecki, 1965). precipitation totals in Szczecin (formerly Stettin) since 1848.
Besides the short description in the mentioned literature no In 2011 a reconstruction was performed for the precipitation
other proof of such activity is available. series from Gdańsk in 1880–2008 (further extended to 1851)
(Filipiak, 2011). During the CLIMPOL project (“Climate
of northern Poland during the last 1000 years: Constrain-
2.3.2 Long-term continuous series
ing the future with the past”) Filipiak reconstructed the se-
The series from Wrocław (formerly Breslau) that com- ries of monthly precipitation totals since 1891 for Lake
menced in 1791 (Bryś and Bryś, 2010) is the longest con- Żabińskie in NE Poland (54◦ 070 N, 21◦ 590 E) (Larocque-
tinuous Polish precipitation series. For the purpose of the Tobler et al., 2015). Further, the series of Orzysz (for-
present paper we prolonged this series until 1781 based merly Arys) and Mikołajki (formerly Nikolaiken), also in NE
on precipitation measurements in Żagań (formerly Sagan) Poland, were collected for the years 1830–1904 and since
within the Mannheim network of stations established for 1889, respectively. As both stations are located very close
Europe and North America by the Palatine Meteorologi- to one another (approximately 20 km), these two series have
cal Society in 1780 (Przybylak et al., 2014). The cited au- data very much in common. The correlation coefficient cal-
thors proved that there exist high correlations between the culated for the overlapping periods 1889–1904 and 1981–
precipitation series from both places. Source data from Ża- 2015 exceeds 0.85. Thus we decided to combine both se-
gań were taken from the publication Ephemerides Societatis ries: data from Orzysz cover the period between 1830 and
Meteorologicae Palatinae, 1783–1795. In addition, we must 1890 and the later data come from Mikołajki. A couple of se-
say that the Wrocław series is the only continuous series ries, e.g. Poznań (formerly Posen), Toruń (formerly Thorn),
to have begun before 1800 in the area currently belong- Racibórz (formerly Ratibor, Silesia), and Śnieżka (formerly
ing to Poland. The best-known long-term climatological se- Schneekoppe, Sudety mountains), began around the middle
ries in Poland is the one from Kraków that commenced of the 19th century and are available in yearbooks that were
Clim. Past, 16, 627–661, 2020 www.clim-past.net/16/627/2020/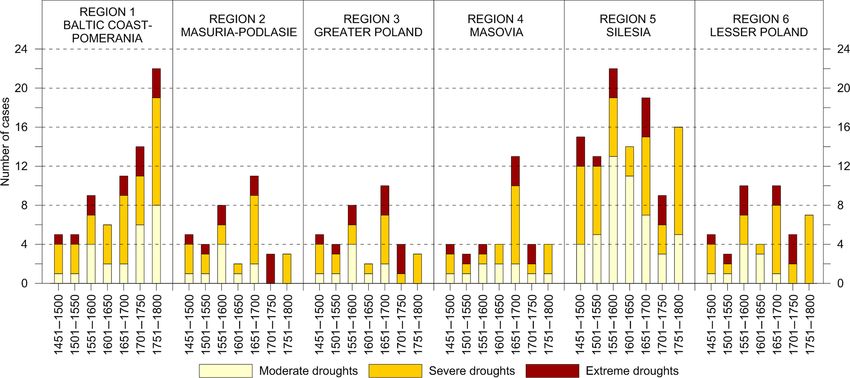
R. Przybylak et al.: Droughts in Poland in recent centuries                                                                 633

initially released by the Royal Prussian Meteorological In-      Bäche vertrockneten” [all streams dried up] and the like, un-
stitute (Königlich Preussischen Meteorologischen Institut),      derlining the extreme nature of the drought. Superlative ad-
then since 1918 by the Polish National Meteorological and        jectives were very often used.
Hydrological Service (PIM until 1945, further PIHM, after           Severe droughts that lasted almost the whole season but
1972, IMGW, and currently IMGW-PIB). The complete list           no longer (up to about 2–3 months) were marked with the in-
of instrumental series employed in the current research and      dex −2. When they fell in the spring period of plant growth,
their sources is presented in Table 2.                           they influenced the quality of the harvest. It was frequently
                                                                 reported that crops had dried up in fields, on hillslopes espe-
                                                                 cially exposed to the sun, and with less-humid soils than in
3     Methods
                                                                 the valleys. Those droughts made it difficult for people and
3.1    Documentary data
                                                                 animals to obtain water; sometimes they prevented the work
                                                                 of some mills on the rivers, but they did not paralyse grain
The collected historical sources informing about droughts        milling in the entire province. Droughts were incidentally re-
were evaluated according to a three-level scale, taking into     lated to forests and meadows. Efforts were made to focus on
account, first of all, signalled manifestations and conse-       those descriptions in which at least two of the phenomena
quences of the drought and its duration. The droughts were       described above appeared. There was no requirement to de-
divided into “extreme”, “severe”, and “moderate”.                scribe such droughts in more sources. Examples of descrip-
   Extreme droughts (index −3) constituted periods of no         tions of severe droughts in different historical sources are
rainfall or very scarce rainfall that were long-lasting – they   presented in Table 4.
lasted at least one season (2–3 months or more). The princi-        Moderate droughts (marked with the index −1) were ones
ple that extreme droughts should be recorded in sources from     whose appearance was noticeable by people; however, they
two regions or more was adopted; even in view of the absence     lasted for a relatively short period of time and affected crops
of sources this allows us to assume that these were droughts     to a limited extent. This group also includes records that
of an exceptional nature, having been noted by many writ-        seem incidental, are not confirmed in other sources, or may
ers. Such an extreme drought of 1473 was described, among        indicate a small range of drought, yet they were significant
others, in the Annals by Jan Długosz and, for example, in        enough to be recorded in the sources (Table 5). There is
the local chronicle of Wrocław by Nicolaus Pol. When the         no record of consequences (including economic ones). In
source information indicated an extreme drought but at the       the description of the drought, a superlative adjective is not
same time there appeared information, for example, about         used. There appear such expressions as “dürrer Sommer”
the high level of water or floods, which may have indicated      [dry summer]. In other sources, in reference to the same pe-
heavier precipitation especially in the summer season, it was    riod of time, there may be records that indicate, for example,
concluded that no extreme drought had taken place. In agri-      rain instead of drought.
cultural terms, extreme droughts contributed to much earlier        Therefore, relatively long periods of 50 years were
cereal harvests; they often seriously threatened the growth      adopted to assess long-term (secular) frequencies. It should
and size of yield, as was mentioned in the sources. Descrip-     also be added that most probably in the oldest sources from
tions of extreme droughts usually contain several permanent      the 15th–17th centuries, primarily droughts of considerable
elements: severe water shortages, fires, the destruction of      intensity were recorded (i.e. droughts referred to by us as
crops; sometimes there also appeared records about the fact      severe and extreme), while those of a smaller scale (moder-
that people did not remember a similar drought having oc-        ate) were omitted. This is due to the nature of the sources at
curred in their lifetime. These droughts caused water reser-     the time and the relatively modest number of such records.
voirs – ponds and lakes – to dry up completely. Sometimes,       Therefore, it can be assumed that droughts of −1, and proba-
and probably in an exaggerated way, sources reported the         bly in some part also droughts of −2 may be underestimated
drying up of smaller rivers.                                     from the perspective of historical sources. The sources for the
   During extreme droughts, there were frequent records of       18th century are definitely more precise. In the 18th century,
persistent, very low water levels in the largest rivers – the    the duration of the drought as well as its territorial range can
Odra and the Wisła (Table 3). The result was a lack of wa-       often be very precisely determined, though not always.
ter for people and animals, halting the work of water mills
in whole provinces. The consequences of drought were un-         3.2   Dendrochronological data
derlined – particularly a lack of food and high prices. Nu-
merous fires broke out in cities, villages, and forests. The     We hypothesised that narrow tree rings are linked with
sources used such phrases as “estas ferventissima et siccitas    drought. The limited access to water during the vegetation
inaudita” [very hot and incredible summer drought], “sidere      season leads to a water deficit in trees and as a consequence
solari plus solito effervescente et nullas dante pluvias” [ex-   the cambium activity decreases and produces fewer cells,
traordinary sun heat and continuous drought], “unaufhörlich      which is positively correlated with tree-ring widths (Liang
trockene Witterung” [unbelievably dry weather] and “alle         et al., 2013). De-trending of the chronology was done with

www.clim-past.net/16/627/2020/                                                                 Clim. Past, 16, 627–661, 2020
634 R. Przybylak et al.: Droughts in Poland in recent centuries
Table 2. List of sites, their locations, and periods covered by series of monthly precipitation totals used in the paper.
No. Station Geographical Observation Location (ϕ, λ; h) Sources of data
region period
Isolated series
1a Gdańsk∗ 1 1722–1786 54◦ 200 N, 18◦ 400 E; Reyger (1770, 1788) and Filipiak et al. (2019) for the periods 1722–1738
13 m a.s.l. and 1773–1786; Hanov (1773) for the period 1739–1773
Long-term continuous series
1b Gdańsk 1 1851–2015 54◦ 200 N, 18◦ 400 E; Filipiak (2011) for the whole period
13 m a.s.l.
2 Koszalin 1 1851–2015 54◦ 120 N, 16◦ 110 E; Reichsamt für Wetterdienst (1939) for the period 1851–1930 corrected
46 m a.s.l. by Mi˛etus (2002); Mi˛etus (2002) for the period 1931–1990;
Central Database of Historical Data of IMGW-PIB (Polish National
Meteorological and Hydrological Service) for years 1991–2015
3a Orzysz 2 1830–1890 53◦ 480 N, 21◦ 560 E; Dove (1851) for the period 1830–1850; Reichsamt für
122 m a.s.l. Wetterdienst (1939) for the years 1851–1904
3b Mikołajki 2 1891–2015 53◦ 480 N, 21◦ 340 E; Central Database of Historical Data of IMGW-PIB for the whole period
116 m a.s.l.
4 Toruń 3 1871–2015 53◦ 010 N, 18◦ 360 E; Pospieszyńska and Przybylak (2013) for the period 1871–2010;
60 m a.s.l. Central Database of Historical Data of IMGW-PIB for years 2011–2015
5 Poznań 3 1848–2015 52◦ 250 N, 16◦ 560 E; Dove (1851) for the period 1848–1850; Central Database of Historical
66 m a.s.l. Data of IMGW-PIB for the years 1851–2015
6 Warszawa 4 1813–2015 52◦ 130 N, 21◦ 010 E; Lorenc (2000, 2007) for the years 1813–1999; Central Database of
97 m a.s.l. Historical Data of IMGW-PIB for the years 2000–2015
7a Żagań 5 1781–1790 51◦ 370 N, 15◦ 190 E; Ephemerides Societatis Meteorologicae Palatinae, 1783–1795
102 m a.s.l. for the whole period
7b Wrocław 5 1791–2015 51◦ 070 N, 17◦ 050 E; Bryś and Bryś (2010) for the years 1791–2000; Central Database of
120 m a.s.l. Historical Data of IMGW-PIB for the years 2001–2015
8 Kraków 6 1876–2015 50◦ 040 N, 19◦ 580 E; Kożuchowski (1985) for the period 1876–1900, Twardosz (2007)
216 m a.s.l. for the years 1901–2000, Central Database of Historical
Data of IMGW-PIB for the years 2001–2015
Key: geographical regions: 1: Baltic coast–Pomerania, 2: Masuria–Podlasie, 3: Greater Poland, 4: Masovia, 5: Silesia, 6: Lesser Poland. ∗ The series for periods 1722–1738 and 1773–1786 were
reconstructed based on Reyger’s weather chronicle.
R program (R Core Team, 2019) and dplR package (Bunn, temperature data starting from 1951, and they cover a max-
2008) using the smoothing spline option, which reflects imum time span depending on the length of the chronology
trends in the chronology better than other options. The “n- (Table 6). Because the time span was too short (for example
year spline” was fixed at two-thirds the wavelength of n years for site 2 when chronology covers the years 1951–1986) for
(Cook et al., 1990). The residual version of the chronology some extended analysis going back to previous months, the
was built by pre-whitening, performed by fitting an autore- common period from previous October to current September
gressive model to the data with AIC model selection (Bunn, was taken into account. The sum of monthly precipitation
2008). At first the relationships between tree growth and was also included; the months were selected dependably on
precipitation were checked. We analysed the effect of climate the significant correlation of the single months and period
monthly precipitation and temperature on tree-ring widths selected by daily data analysis.
using the treeclim package (Zang and Biondi, 2015). Analy- Next we used daily data for Toruń and tree-ring chronolo-
sis of climate growth relationships for monthly data for Toruń gies of pine and oak representing region III. Daily data
revealed that precipitation during the vegetation season plays show more precisely the period of the year which influ-
a significant role for both pine and oak. For example, a sig- ences tree growth. According to previous findings, the cli-
nificant positive correlation was observed for June and July mate growth relationships are comparable at different sites
for pine, while for oak a positive correlation was observed in Poland (Zielski et al., 2010), so we used the relationships
for the previous August and current June and a negative cor- between daily data and sites 11 and 13 as a model for the
relation for August (Fig. 2). For each site, the climate growth rest of our study sites. The reason for this generalisation was
relationships were tested against monthly precipitation and also the limited access to daily data. A period of 90 d with
Clim. Past, 16, 627–661, 2020 www.clim-past.net/16/627/2020/R. Przybylak et al.: Droughts in Poland in recent centuries 635
Table 3. Examples of descriptions of extreme droughts (megadroughts) in 15th–17th-century sources.
Year Description Translation Source
1473 “caumata et penuriam aquarum, adeo ut “hot weather and a lack of water, to Długosz (2009, vol. 12, p. 336)
perennes aquae verterentur in aridam, et flumina such an extent that the places where there
Poloniae principalia ubique fuerunt permeabilia, had always been water dried up everywhere,
insignis. [...] Fumabant in universis and the main Polish rivers could be crossed
Poloniae regionibus silvae, borrae, arbusta, saltus, everywhere. [...] Forests, woods, thickets, and
irremediabili igne, nec ante rescindi flamma poterat, forested hills burnt with fire; there was no way
donec ignis etiam radicem arborum voraret, ex quo to put it out, and it was impossible to extinguish
ubique fragor ruentium saltuum audiebatur. the flame before the fire even devoured the root
Apum quoque et alveariorum arbores plurimae of the trees; from here you could hear the clatter
deletae, segetes vernales exterminatae siccitate.” of collapsing thickets. Very numerous bee and
beekeeping trees were destroyed, and many
spring crops were destroyed due to drought.”
1540 “fuit in aestate horrenda siccitas adeo, ut silices, “in the summer there was such a terrible Archivum vetus et novum ecclesiae
montes et valles quasi igne flagrarent, duravit drought that the rocks, mountains and valleys archipresbyteralis Heilsbergensis
haec siccitas usque ad hyemem.” were burned down with fire; (1880, vol. 8, p. 597)
this drought lasted until winter.”
1590 “Ist ein sehr heisser truckener Sommer gewesen, “The summer was so hot [and] dry that regional Pol, vol. 4, p. 156
also, dass auch die Landflüsse, als der Bober, rivers like the Bóbr, the Kwisa, the Kaczawa,
Queiss, Katzbach, Weida, Olau, Lohe, und andere the Widawa, the Oława, the Śl˛eża
mehrgänzlich ausgetrucknet. Die Oder ist auch [Silesia], and many others dried up
so klein worden, dass man sie an allen Orten completely. The Odra also became very shallow,
durchwatten können.” so you could cross it anywhere.”
“38 Wochen regnete es nicht. Die Flüsse trockneten aus.” “It did not rain for 38 weeks. The rivers dried up.” Reinhold (1846, p. 143)
“Zacken und andere Flüsse trockneten völlig aus.” “Kamienna and other rivers dried up completely.” Bergemann (1830a, p. 84)
“Der Bober trocknete infolge starker Hitze ganz aus.” “The Bóbr dried up completely due to severe drought.” Bergemann (1830b, vol. 3, p. 85)
1676 “Tego roku straszne Panowały Susze, “That year a terrible drought took place so Muzeum Narodowe w Krakowie
że zboża wypalało w polach.” that crops burnt in the fields.” rps. MNKr. 169, p. 82
1684 “folgete auf Johanni [24.06.] eine grosse “The great long-lasting drought arrived on Gomolcke (1737, p. 32–33)
anhaltende Hitze darauf; davon das Erdreich the St. John’s Day [24.06.]; the ground became dry,
dermassen dürre wurde, dass das the crops became dry; flax and barley grew very
Sommer-Getreyde, Flachs, und Grass, poorly before the proper ear of grain had come out,
gantz zurücke geblieben, das Winter-Korn which caused very high prices”
an vielen Orten überreiffte, ehe es sich
gehöriger massen in die Ahren kaum angesetzet,
dahero Theurung entstanden”
Figure 2. Climate growth relationships between tree rings in pine (grey bars) and oak (black bars) and monthly totals of precipitation. Key:
asterisks indicate statistically significant correlation coefficients at the level of 0.05. Climate data were taken from Toruń Meteorological
Station.
www.clim-past.net/16/627/2020/ Clim. Past, 16, 627–661, 2020636 R. Przybylak et al.: Droughts in Poland in recent centuries
Table 4. Examples of descriptions of severe droughts in 15th–17th-century sources.
Year Description Translation Source
1456 “Fuitque anno eodem precipue circa partes nostras, “And that year there was an exceptionally great Catalogus abbatum
ubi plures sunt agri sabulosi et argillosi, drought in our area, where there are numerous Saganensium (1835, p. 340)
post festa paschalia siccitas magna et usque sandy and loamy soils; it occurred after
ad messem continuata. Messis autem tante the Easter holidays and lasted until the harvest.
humiditatis et instabilitatis,” In the harvest period it [the weather]
was so wet and unstable”
1532 “Ein dürrer Sommer. Es regnete in “Dry summer. It did not rain for seven weeks. Pol (1819, vol. 3, p. 72)
sieben Wochen nicht. Das Getreide und The grain and grass on the hillsides dried up.
die Weide verdorrete auf den Hügeln ganz aus. In some places there was almost no water.
In etlichen Dörfern war kein gar Wasser. In the countryside, it was impossible to grind grain.
Auf dem Lande konnte man nicht mahlen. One needed to go 10, 12, 18 miles to reach mills.
Zu 10. 12. 18. Meilen musste man zur Mühle The Oława River dried up [Silesia, auth. suppl.].
führen. Die Olau trocknete und dorrete and there was no water in it until
auch aus, und hatte kein Wasser bis the Saint Bartholomew’s Day [August 24].”
auf Bartholomei [24.08].”
1665 “Der Sommer des Jahres 1665 wird als ungemein “The summer of 1665 was incredibly hot; Wernicke (1842, p. 321)
heiss angegehen, und soll es die ganzen not even once did it rain –
Hundstage [10.07.–20.08.] hindurch auch so-called ‘Dog Days’.”
nicht einmal geregnet haben.”
Table 5. Descriptions of moderate droughts in 15th–17th-century sources.
Year Description Translation Source
1461 “Eodem anno fuit estas calidissima et “That year the summer was the hottest and Sigismundi Rosiczii chronica
fluvius Odere valde modicus, similiter the water level of the Odra river fell, (1883, p. 78)
et alii fluvii.” as did other rivers.”
1552 “Den 5 Junii [...] nach der Vesper und “On June 5 [...] after the evening and Pol (1819, vol. 3, p. 158)
grosser Dürre kam ein gewünschter after a great drought, came the desired
Regen, aber mit grossem Wetter.” rain with a great storm.”
1661 Es folgte aber ein dürrer Sommer.” “However, a dry summer came.” Happel (1690, p. 148)
the 1-year lag for the years 1947–2015 was used to find the than 95 % of trees per site displayed significant relative radial
significant relationships between the daily precipitation data growth variations above 10 was qualified as “extreme reduc-
and indexes of tree rings. For this purpose, we used the den- tion”; “great reduction” was determined as between 85 %–
droTools package (Jevšenak and Levanič, 2018). The optimal 95 % of trees; and “moderate reduction” was between 75 %
window of days was revealed to be from 6 May to 3 August and 85 %.
for pine with maximal correlation coefficient 0.435 and from
21 April to 19 July for oak with maximal correlation coeffi-
cient 0.305. The sums of daily precipitation for these periods 3.3 Instrumental data
were summed and correlated with indexed growth in years of
As shown in Table 2, for the analysis of droughts in the
growth reduction (narrow rings) and growth recovery (wide
instrumental period, eight long-term series of monthly to-
rings). The correlation coefficient is 0.79 (p < 0.05) for pine
tals of precipitation have been used. All these precipitation
and 0.65 (p < 0.05) for oak. Next, the same summed daily
series were checked for completeness. The few data gaps
precipitations for the selected periods were correlated with
in the analysed series were completed using homogenised
the remaining tree-ring indexes (after exclusion of wide- and
precipitation series from the nearest stations. For this pur-
narrow-ring indexes). The correlation coefficients are 0.40
pose, a simple method of constant quotients was utilised
for pine and 0.16 for oak.
(Pruchnicki, 1987). However, due to the lack of available ref-
To determine the pointer years we used the dplR package
erence series, such a procedure was not used to fill data for
(Bunn, 2008). The minimum absolute relative radial growth
the period 1880–1884 for Orzysz. Homogenisation of all the
variation, above which the growth change from year t − 1 to
used precipitation series was checked using the AnClim soft-
t is considered significant, was 10. Any year in which more
ware (Štěpánek et al., 2009).
Clim. Past, 16, 627–661, 2020 www.clim-past.net/16/627/2020/R. Przybylak et al.: Droughts in Poland in recent centuries 637
Table 6. Climate growth relationships for analysed sites. Only highest correlation coefficients are presented with a level of significance
p < 0.05.
Site Analysed Highest Pearson Months with highest Meteorological
number period correlation correlation coefficient station
coefficient
Region I (Baltic province)
Site 1 1951–1987 0.378 Sum of precipitation from May to June Koszalin
Site 2 1951–1986 0.296 (not significant) Sum of precipitation from June to July Gdańsk
Site 3 1951–1987 0.565 Sum of precipitation from June to August Świnoujście
Site 4 1175–1396 No climate data No climate data No climate data
Site 5 1951–1986 0.456 Sum of precipitation from June to July Koszalin
Region II (Masuria–Podlasie province)
Site 6 1951–1987 0.589 Temperature current May Suwałki
Site 7 1951–1987 0.50 Sum of precipitation from June to July Suwałki
Site 8 1951–1985 0.285 Sum of precipitation from July to August Białystok
Region III (Greater Poland–Pomerania province)
Site 9 1951–1987 0.485 Sum of precipitation from May to July Poznan
Site 10 1951–1987 −0.322 Temperature, previous December Gorzów Wielkopolski
Site 11 1951–2015 0.334, −0.335 Sum of precipitation from May to June, Toruń
temperature in June
Site 12 1249–1490 No climate data No climate data No climate data
Site 13 1951–2015 0.443 Sum of precipitation from May to July Toruń
Site 14 1100–1468 No climate data No climate data No climate data
Region IV (Masovia–Podlasie province)
Site 15 1951–1985 −0.316 Temperature, previous December Warszawa
Region V (Silesia province)
Site 16 1886–1984 > 0.4 precipitation data Temperature of February and Opole, Wrocław,
not presented due to lower March for pine Katowice and
statistical significance Racibórz
Site 17 1951–1987 0.376 Sum of precipitation from May to June Wrocław
Site 18 1568–2010 Only pointer years were analysed
Region VI (Lesser Poland province)
Site 19 1915–1986 0.324 (not significant) Temperature in February Kraków
Site 20 1951–1989 0.314, −0.323 Sum of precipitation from May to July, Lublin and Radawiec
temperature in June
Site 21 1881–1999 > 0.4 Temperature in March Kraków
Site 22 1881–1999 > 0.4 Temperature in February Kraków
On the basis of the completed series of atmospheric meteorological stations using precipitation regression equa-
precipitation, the possibility of obtaining a synthetic tions relative to altitude above sea level. Mi˛etus (1996), in
precipitation index for the whole country was tested. A sim- turn, presented mean areal precipitation for the coastal area.
ilar method was adopted in Brázdil et al. (2007) to deter- For the analysis, we took 30-year moving correlation coeffi-
mine drought indices in the Czech Republic for the period cients (r) for monthly totals of precipitation counted for the
1881–2006. In Poland, Kożuchowski (1985) presented a 100- period 1901–2000. All correlation coefficients were statisti-
year series of average areal annual atmospheric precipitation cally significant (p < 0.05) with values varying from 0.46 to
for 1881–1980 (his Table 3) calculated from data from 12 0.71 (see Table 7, upper part). Only the Kraków series had a
www.clim-past.net/16/627/2020/ Clim. Past, 16, 627–661, 2020638 R. Przybylak et al.: Droughts in Poland in recent centuries
significantly lower value of r (the highest value of 0.33 de- and Kubiak-Wójcicka (2017). According to them, this rela-
scribed the relationship between Kraków and Wrocław). For tion was reduced by the influence of external factors (the hy-
annual precipitation totals in the period 1951–2000, Kożu- dropower plant in Włocławek located in middle part of the
chowski and Żmudzka (2003) obtained only slightly higher river, major groundwater basin), and climate factors appear-
values of correlation coefficients, varying from 0.6 to 0.8. ing in the upper and middle parts of the river basin.
Unsatisfactory results of r, particularly related to the series To identify droughts (dry months), the criterion proposed
for Kraków, suggested that we should not construct monthly by McKee et al. (1993) and modified for Polish climate con-
precipitation series for the whole of Poland. It seems that ditions by Łab˛edzki (2007) was used. Droughts were divided
the number of long-term precipitation series is probably rela- into three categories based on SPI values: moderate (−0.50
tively too small for a country of such an area (312 679 km2 ). to −1.49), severe (−1.50 to −1.99), and extreme (≤ −2.00)
Further analysis was thus carried out on regions delimited droughts. Methods that identify multi-month droughts using
by a landscape criterion, though this excludes mountains, the SPI calculated for different, rigidly defined numbers of
whose atmospheric precipitation is spatially and temporally consecutive months (3, 6, 12 or 24) simplify the analysis, es-
far more variable (Kożuchowski, 1985). pecially in terms of drought duration and calculating the cu-
The aim of the analysis of instrumental series was to calcu- mulative intensity of the whole phenomenon. Therefore, in
late the number, length, and category of droughts in the area this work, we have adopted the following criteria to identify
of Poland since 1722, i.e. for almost 300 years. The Stan- droughts and determine their duration. Firstly, instances of
dardised Precipitation Index (SPI: McKee et al., 1993) was an SPI1 value within any of the above ranges for only a sin-
calculated from monthly precipitation totals to explore the gle month were considered irrelevant. Secondly, a drought
occurrence of droughts in the analysed locations (Table 2). was considered to be at least two consecutive months dur-
This index is one of the simplest methods used to identify ing which the SPI1 value was ≤ −0.50. Thus identified, a
meteorological droughts, since it uses only monthly totals of drought was determined both in terms of duration and by
precipitation and is therefore widely used in the literature. category. Thirdly, drought category was determined by the
Osuch et al. (2016) state that the SPI is used for both research dry month of lowest SPI1 value. A drought was thus con-
and operational purposes in over 60 countries. The SPI is sidered extreme if the SPI1 value for at least one of the
also most popularly used in Poland (e.g. Łab˛edzki, 2007; drought months was ≤ −2.00. If the SPI1 of the driest month
Kalbarczyk, 2010; Bak ˛ et al., 2012; Bartczak et al., 2014; within a particular instance of drought was between −1.50
Osuch et al., 2016; Bak ˛ and Kubiak-Wójcicka, 2017). What and −1.99, the drought was determined to be severe. The re-
is more, the SPI is used also by two institutes mentioned maining droughts were qualified as moderate. The number
in Sect. 1 (IMGW-PIB and the Institute of Technology and of droughts was determined for years and for climatological
Life Sciences, ITP) and also by the Institute of Soil Science seasons. A drought’s final month determined its season.
and Plant Cultivation, which is responsible for agricultural Drought is a widely occurring phenomenon, but its fre-
drought monitoring in Poland (for more details see Łab˛edzki quency is extremely limited within particular long-term pe-
and Bak,
˛ 2014). Hence our decision to also use this index in riods. For this reason, it was decided to group numbers of
our work. droughts into longer periods. For a fuller comparison of
The program SPI Generator (National Drought Mitiga- drought occurrence identified on the basis of dendrochrono-
tion Center, University of Nebraska) was used to perform logical data (narrow rings), we used instrumental data to cal-
this analysis. SPI was initially calculated for 1-, 3-, 6-, 12-, culate the number and duration of droughts within 10-year
and 24-month timescales. Further analysis was, however, periods, starting from the slightly shorter period 1722–1730,
done using SPI calculated only for 1-, 3-, and 24-month through full decades, to the 5-year period 2011–2015. Next,
timescales. All of them represent meteorological droughts, we also summed the number of droughts by a 50-year period,
from short-term to long-term droughts. The last two (SPI3 also determining seasons in this case, just as we did when
and SPI24) can also be used as a good proxy for agricultural analysing the documentary data.
and hydrological droughts, respectively. For climate condi- For the purpose of comparison of SPI1 values (meteoro-
tions in Poland, it was shown that there exists a strong spatial logical droughts) against historical indices (−1, −2, and −3),
relationship of SPI values (Table 7, lower part). Significant the following assumptions were established: the index −1
empirical relations were also found between SPI and pure was attributed to SPI1 values ranging from −0.50 to −1.49;
agricultural and hydrological indices. Łab˛edzki et al. (2008) −2 for the range −1.50 to −1.99; and −3 for SPI1 ≤ −2.00.
found high correlation coefficients (|r| > 0.7) between SPI Frequency of occurrence of meteorological droughts for the
and some agricultural indices such as crop drought index instrumental period was calculated for standard meteorolog-
(CDI), water deficit (N), and relative duration of soil mois- ical seasons (December–February, March–May, etc.) as well
ture deficit (tdef ). On the other hand, a much weaker rela- as for May–July. This allowed for comparison of the occur-
tion (r < 0.5) was found between SPI24 and hydrological rence of droughts against their statistics available in doc-
droughts estimated based on SWI-24 (24-month Standard- umentary evidence (seasons) and dendrochronological data
ised Water-level Index) for the Wisła river in Toruń by Bak ˛ (May–July). The last period was added because for this time
Clim. Past, 16, 627–661, 2020 www.clim-past.net/16/627/2020/You can also read