IMPACT-BASED FORECASTING - FOR EARLY ACTION THE FUTURE OF FORECASTS: Forecast-based Financing
←
→
Page content transcription
If your browser does not render page correctly, please read the page content below
THE FUTURE OF FORECASTS:
   IMPACT-BASED
   FORECASTING
   FOR EARLY ACTION
THE FUTURE OF FORECASTS:
    IMPACT-BASED
    FORECASTING
    FOR EARLY ACTION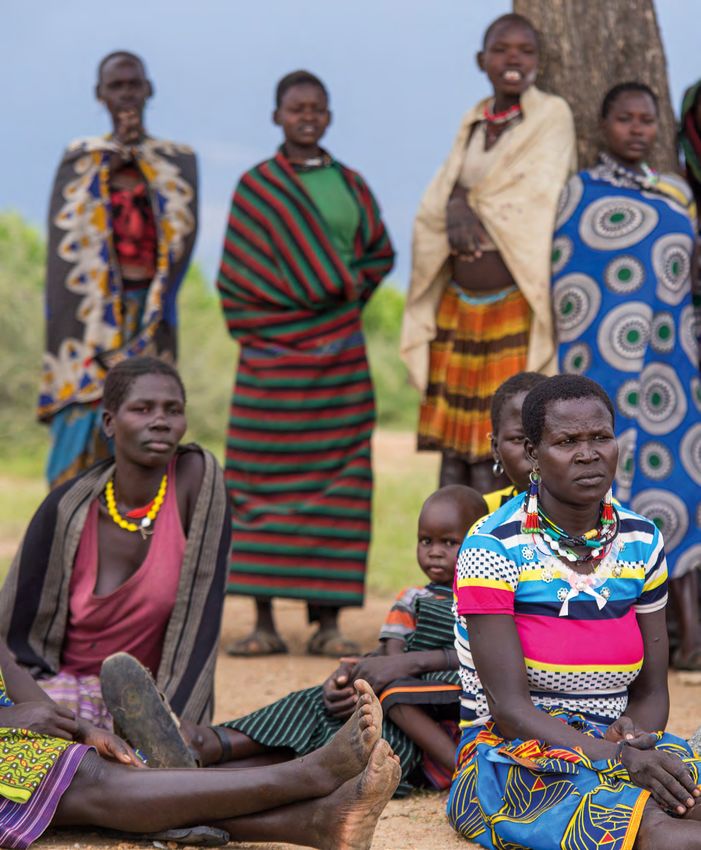
FOREWORDS


            WE OFTEN TALK about the desire to go the ‘last mile’ and narrow the gap between
            science and action. It was this desire that provided the catalyst for a change to impact-
            based thinking.

            The core tenet of this paradigm shift was to bring differing communities together, to
            provide the mechanisms and collective desire to make a difference on the ground,
            to save lives, and to reduce distress and disruption. That was the idea, and it worked.

            The most valuable part of impact-based warning is the relationship between partners,
            which creates a level of trust that enables quick decision-making under pressure. This
            is both a strength and a weakness, as any gap in these relationships could dramatically
            reduce the overall impact of the warnings.

            It also suggests that citizens’ trust may be dependent on who delivers the information
            and what relationship they have with the user. Maya Angelou is quoted as saying
            that ‘People forget what you say, forget what you did, but not how you made them feel’.
            The question is ‘how do others feel?’ when they engage with the provider of impact-
            based forecasts, and how do we allow others to resonate with us so they feel
            empowered and enriched from the experience?

            Our warnings often focus on single hazards and their direct consequences. People
            living in well-built homes, in urban settlements, generally have little to fear from
            the direct impacts of most hazards (except perhaps floods). However, urban
            populations, particularly coastal megacities, can be extremely vulnerable to indirect
            impacts such as the loss of power, water, communications, transport and even food.

            All this at a time of great environmental and societal change. The next frontier could
            be unlocked through the science of weather and climate or, equally, through embracing
            new technologies (data analytics and artificial intelligence), and developing the
            cognitive intelligence on future climates to anticipate weather impacts and inform
            actions today.

            No doubt we could all become masters of our weather-impact-based decision support.
            We could all be meteorologists as well as doctors. However, this is also the age of
            imagination.

            Everything you need to know you can get from Google. What you cannot get is where
            knowledge ends. We need partnerships which do not follow straight lines but who
            can navigate freely; creativity not knowledge; imagination rather than intelligence.
            As the climate changes, our vulnerability to it and therefore our behaviour is
            changing, and we need to embrace this change and move away from disciplinary silos
            towards a multi-disciplinary, ecosystem model.

            We should endeavour to embrace emotional intelligence and empathy, entrepreneurship
            and design, creativity and digital literacy. This guide is the start of that process. It
            provides the toolkit to develop and deliver impact-based forecasting and warning
            services and, above all, it advocates partnerships, ambition, and the desire to make
            a difference. It also provides a key stepping-stone to finally going the ‘last mile’.

                                                                                          Paul Davies
                                                                    Chief Meteorologist, UK Met Office

4                                                                      The Future of Forecasts
FOREWORDS

TODAY, one weather- or climate-related disaster occurs every 1-2 days – and climate
change is only leading to more worrying trends in terms of frequency and scale.
However the impacts of disasters are unequal, as the coping capacity of the people
they hit is based on the resources at their disposal to protect themselves from
disasters – often most limited in areas where climate impacts like floods, droughts and
storms hit hardest. Our Red Cross and Red Crescent staff and volunteers working on
the frontline know this too well.

But inequalities in front of weather- or climate-related disasters can be greatly
reduced. By using forecasts and risk analyses to determine when, where, with and
for whom to implement early action to protect lives and livelihoods. By applying
impact-based forecasting, complex scientific information is transformed into
information that is actionable, enabling humanitarian interventions such as shelter
strengthening by farmers in the Philippines’ coastal region before a typhoon’s landfall
or the distribution of veterinary kits to protect alpacas as source of livelihoods for
families in the mountainous Andean region of Peru against cold wave. Existing in
192 countries as auxiliary to the government and operating from national to the
community level, our local Red Cross and Red Crescent branches play a key role in
bridging knowledge and practice, building trust and providing timely and relevant
support developed with and for the communities.

Through the collaboration with National Hydrometeorological Services, National
Disaster Management Agencies and other key stakeholders, National Red Cross and
Red Crescent Societies in at least 30 disaster-prone countries across the globe are
working to outsmart disasters by having pre-approved plans in place to launch
forecast-based early action for extreme weather events. That number is growing.
In addition, this year saw the first large-scale, coordinated inter-agency triggering of
anticipatory actions by impact-based forecasts and warnings. As heavy monsoon
rains hit Asia, four UN agencies and Red Cross Red Crescent partners worked
alongside the Bangladesh Government to anticipate the likely impacts and release
funds to help communities at risk ahead of a flood peak.

In the spirit of co-creation and collaboration, this guide has been developed to provide
practical advice and promote dialogue between scientists, forecasters, disaster
managers, community leaders and other relevant users. By expanding the use of
impact-based forecasting, we can further strengthen our efforts to translate early
warning into early action, saving countless lives and reducing suffering – efforts made
more urgent than ever with our changing climate.

                                                                            Pascale Meige
                                          Director, Disasters and Climate Crisis Department
                            International Federation of Red Cross and Red Crescent Societies

Impact-based Forecasting for Early Action                                                               5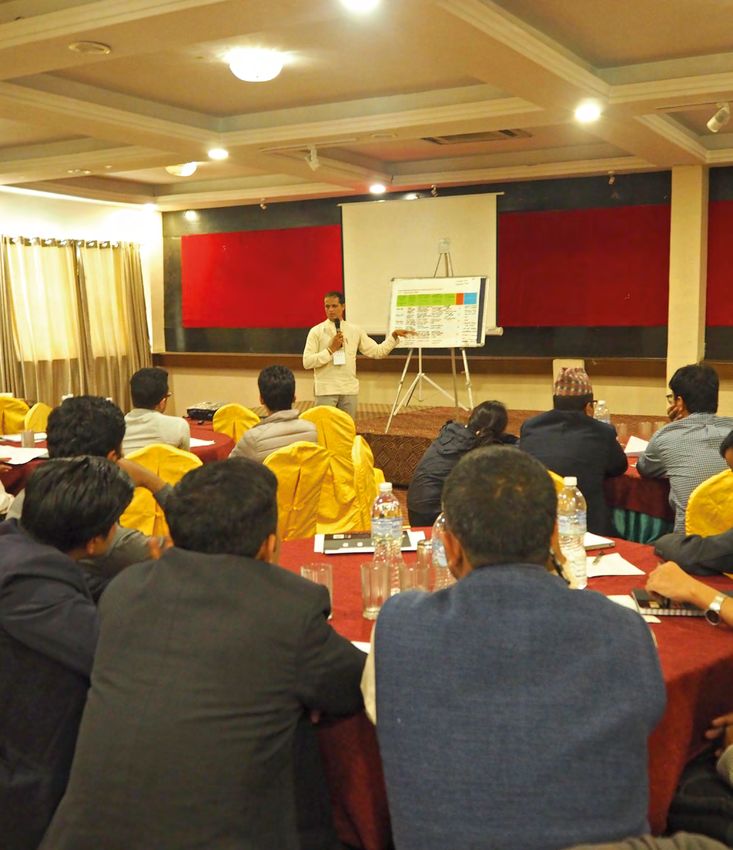
Contents
    How to use this guide                                                                    10

Chapter 1. Introduction                                                                      12

Chapter 2. Understanding Users                                                               16
    Identifying users                                                                        17
    Analysing user needs and meeting requirements                                            18

Chapter 3. Understanding Risk and Impact                                                    20
    The role of impact and risk assessments in impact-based forecasting                      21
    Impact assessments: identifying hazard impacts                                          22
    Risk Assessments                                                                        26
      Defining Risk                                                                         26
      Identifying the hazard                                                                26
      Vulnerability and Exposure                                                            27
    Identifying impact levels from hazard thresholds                                        29
    Future hazards and impact levels                                                         31

Chapter 4. Partnerships and collaboration                                                   32
    Roles and responsibilities of partner organisations                                     34
    Challenges and opportunities for creating flourishing partnerships                      35

Chapter 5. Producing Impact-based Forecasts and Warnings                                    38
    Choosing a hazard - start simple                                                        39
    Determining the level of impact                                                         40
    Determining likelihood of impact                                                        40
    Forecast Verification                                                                    41
    Bringing the risk assessment together                                                    41
      Risk Matrix                                                                           42
    Incorporating production time and updates                                               44
    Impact-based forecast and warning production software                                   45
    Content of impact-based forecasts and warnings                                          46
    Pilot projects                                                                          46
    Examples of visualisation of impact-based forecasts and warnings intervention maps      47

6                                                                        The Future of Forecasts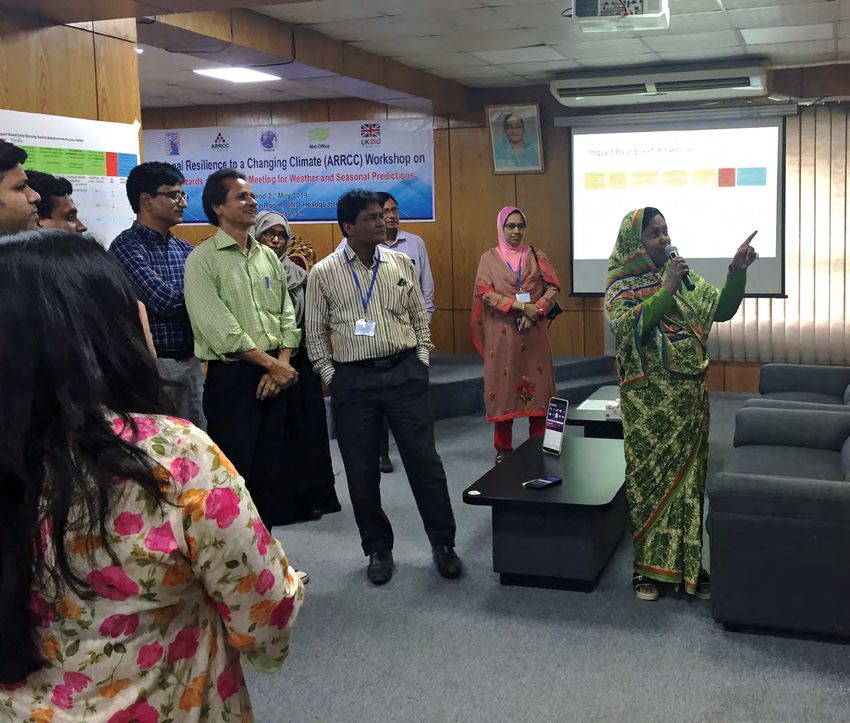
     Africa –Malaria Early Warning System                                      47
     Canada – producing risk maps with the aid of machine
     learning and artificial intelligence                                      48
     Peru – Disaster Management Office Risk Scenarios                          48
     Mongolia – Dzud Forecast-based Financing and Risk Maps                    48
     UK - Natural Hazards Partnership Vehicle over Turning Model               49

Chapter 6. Communicating & Disseminating Impact-based Forecasts and Warnings   52
  Communicating impact-based forecasts and warnings                            53
  What to communicate                                                          54
  Impact-based forecast and warning design                                     55
  Consistency                                                                  57
  Communicating risk                                                           58
  Communicating forecast and warning scenarios – what is the ‘best message’?   58
  Communicating uncertainty                                                    59
  Advice and guidance for users: ‘what can I do to reduce impacts?’            60
     Sector specific users                                                     60
     For individuals/members of public                                         60
  Hydrometeorological jargon                                                   61
  Language                                                                     61
  Channels and Technologies for Dissemination                                  63

Chapter 7. Accountability, Verification, Archive and Review                    66
  Accountability                                                               67
  Verification                                                                 67
  Gathering impact information for verification                                70
  Social media monitoring tools                                                70
  Surveys and Feedback                                                         71
  Examples of verifying impact-based forecasts and warnings                    71
  Archives                                                                     73
  Review                                                                       75

Acknowledgements                                                               76

References                                                                     77

Impact-based Forecasting for Early Action                                       7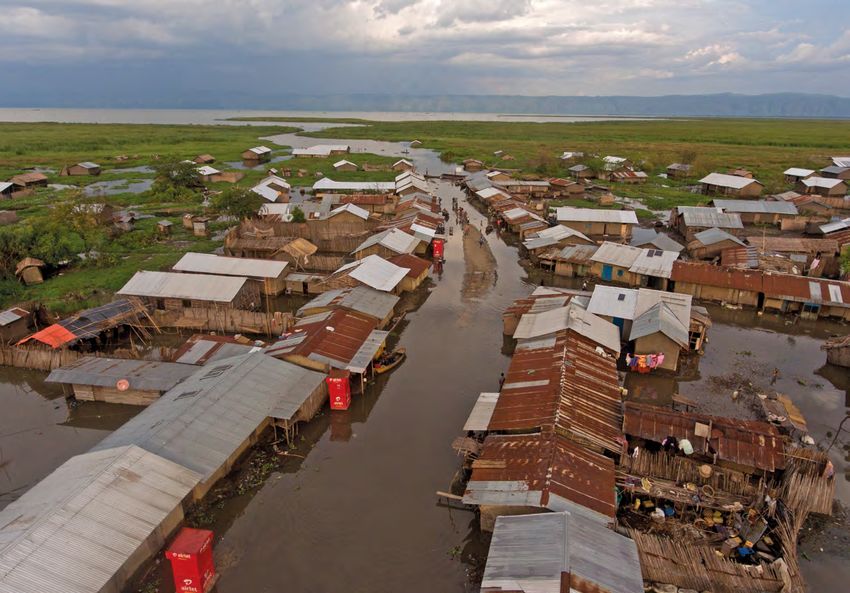
Boxes

    IPCC Definitions of Hazard Vulnerability and Exposure                                    21
    Key Data Questions                                                                       28
    Vietnam Forecast based Financing Project for Heatwaves                                   35
    USA - Wireless Emergency Alerts (WEA)                                                    63
    510 Online News Scraper and Text Mining Tool                                             70

Tables

    Table 1. Comparisons between Traditional Forecasts, Impact-based Forecasts,
             and Co-produced Impact-based Forecasts                                         14
    Table 2. Potential Data Sources for Hazard Impacts                                      22
    Table 3. Examples of Disaster Impacts                                                   24
    Table 4. Winter Windspeeds and Impact levels                                            29
    Table 5. Uganda Action-based Flood Forecasting Project:
             Organisations and Roles - Example                                              36
    Table 6. Barriers and Enablers to Forecasts and Warnings                                49
    Table 7. User Related Questions for Impact-based Forecasting and Warning                54
    Table 8. Questions for Forecast Verification                                            68

Case studies

    Case study – UK Met Office Wind Warnings                                                 29
    Case Study – Identifying thresholds for heatwave warnings in Argentina                   31
    Case Study – The Natural Hazards Partnership (UK)                                        37
    Case Study – Forecast-based Financing in the Philippines                                 50
    Case Study – Developing impact-based forecasting in data sparse
                 areas in Uganda                                                            51
    Case Study – Inconsistent Forecasts and Warnings Switzerland                             57
    Case Study – Evolution in risk communication in the UK Met Office
                 impact-based weather warnings                                              64
    Case study – UK Subjective Verification Form (Form as of March 2015)                     72

8                                                                        The Future of Forecasts
Figures

Figure 1. IBF Stakeholder Mapping in Malawi
          (Malawi Red Cross/510 adapted for this guide by Climate Centre)            18
Figure 2. Schematic of the Interaction of the Physical Climate System, Exposure,
          and Vulnerability Producing Risk (IPCC, 2014)                              21
Figure 3. Web site description of how heatwave thresholds are calculated and
          Advice on what to do in a heat wave to minimise impact on human health
          (translated from the original Spanish)                                     31
Figure 4. Future Climate for Africa: Six Building Blocks for Co-production           33
Figure 5. United Nations Office for Disaster Risk Reduction: Seven Targets of the
          Sendai Framework for Disaster Risk Reduction 2015-2030                     34
Figure 6. Organisations Involved in UK’s Natural Hazard Partnership                  37
Figure 7. Impact-based National Hazard Outlook in Australia                          39
Figure 8. UKMO Risk Matrix for Vehicle Overturning (Hemmingway & Robbins, 2020)      42
Figure 9. Red Cross Red Crescent Forecast-based Financing: Impact-based
          Intervention Map for Jamuna River Basin, Bangladesh                        43
Figure 10. Actions Selected for a Forecast-based Financing System for Flooding
           in Uganda                                                                 44
Figure 11. IRI VCAP Model - Malaria                                                  48
Figure 12. Meteorological Notice - Risk Scenario according to
           Rainfall Forecast                                                         48
Figure 13. Dzud Risk Map, Mongolia                                                   49
Figure 14. Evolution of the UK Met Office Amber Weather Warnings for Wind Showing    49
Figure 15. Predicted Percentage of Fully Damaged Houses for Typhoon Kammuri
           in the Philippines, Based on the Impact-based Forecasting Machine
           Learning Model                                                            50
Figure 16. Historical Discharge Magoro                                               51
Figure 17. Font and Size for Effective Communication                                 55
Figure 18. Indonesia Warning Risk Matrix, Table of Response Actions and
           Warning Map for Indonesian Board of Disaster Management                   56
Figure 19. Different Services, Different Warning Information                         57
Figure 20. UK Met Office Storm Maps                                                  58
Figure 21. UK Met Office Snow Risk Warning59
Figure 22. Perception of Information for Four Types of warnings
           (standard or impact-based, with or without behavioural recommendations)   60
Figure 23. WHO typhoon advice                                                        61
Figure 24. Initial Results from the UK Met Office Language Exercises for
          Descriptions of Probability                                                64
Figure 25. Excerpt from a UK Met Office Impact-based Weather Warning                 65
Figure 26. Mongolia Livestock Mortality Map                                          70
Figure 27. Australian Bureau of Meteorology - PERM Process Flowchart                 71

Impact-based Forecasting for Early Action                                             9
     How to use this guide:
     This guide outlines the steps and tools needed to develop impact-based forecasting:
     from understanding risk to producing, issuing and verifying fit for purpose impact-
     based forecasts and warnings. Designed with, and for, people working in impact-
     based forecasting, early warning and early action, the compiled information and
     recommendations will be useful for everyone from technical staff in national
     hydrological and meteorological services to disaster risk management, humanitarian
     and development agencies. The guide includes case studies from countries around the
     world to highlight the development and use of impact-based forecasting services for
     users and producers. A result of joint work between the Red Cross Red Crescent and
     the UK Met Office, this document aims to inspire the co-production of impact-based
     forecasting services that use weather, climate information, and risk analysis to reduce
     risk. The guide brings together the forecast-based financing methodology to trigger
     early action with the impact-based forecasting technical expertise of the UK Met
     Office and other experts in this field. Each chapter contains recommended steps and
     processes, as well as online resources for more detailed guidance.

10                                                            The Future of Forecasts
Content Structure of the Guide

                    What is IBF and
                  why is IBF important?                  Chapter 1.

                  Who are the users and
                  what are their needs?                  Chapter 2.

       What are the                   What are the
         risks?                     impacts to reduce?   Chapter 3.

                   How to develop IBF?

                                                         Chapter 4-5.
         Whom to                         What to
     collaborate with?                  consider?

                  What to communicate?

                                                         Chapter 6.
                   How to disseminate?

                  Why is IBF verification
                       important?

                                                         Chapter 7.
                    How to review and
                   improve IBF service?

Impact-based Forecasting for Early Action                               11
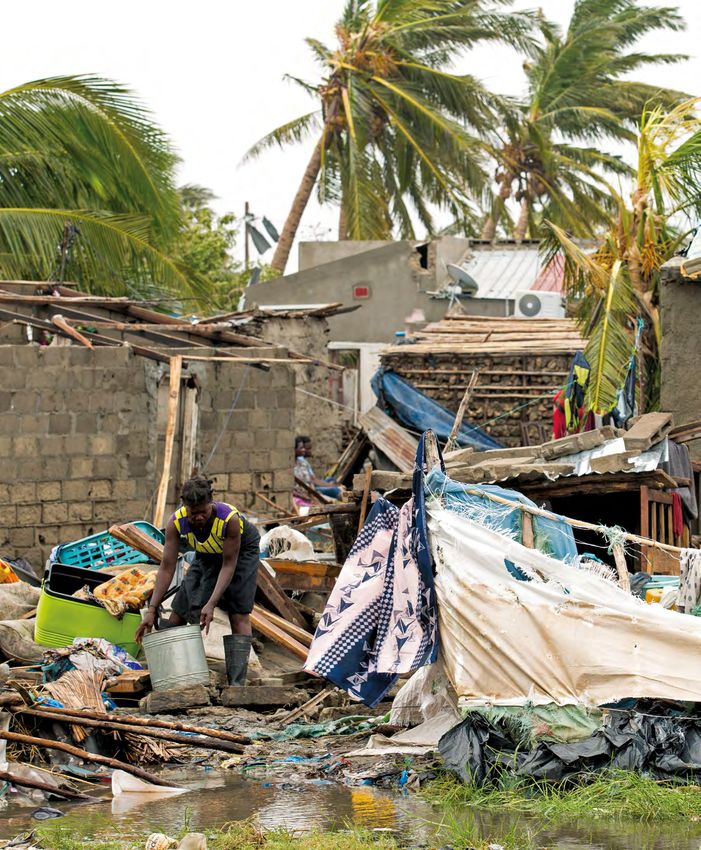
Chapter 1. Introduction Chapter 1. Introduction Cyclone Idai, Mozambique, aftermath, 15-16 March 2019 12 (Photo: Denis Onyodi: IFRC/DRK/Climate Centre) The Future of Forecasts
Chapter 1. Introduction

Impact-based forecasting enables anticipatory actions and revolutionises responses          Impact-based
to weather and climate crises: turning forecasts and warnings from descriptions of          forecasting drives
what the weather will be into assessments of what the weather will be into                  actions which save
assessments of what the weather will do enables organisations and individuals across        lives and protect
the world to anticipate and take action to mitigate the impacts brought by weather          property and
and climate events.                                                                         livelihoods.

By developing impact-based forecasting, producers of forecasts and warnings provide         Impact-based
critical information to help mitigate life-threatening impacts. The World Food              forecasting provides
Programme calculated that releasing funds to vulnerable communities and                     information on the
individuals ahead of potentially devastating weather or climate events, enables             level of risk a hazard
actions that save lives, livelihoods and property.                                          poses to a specific
                                                                                            area.
With ever growing pressure on land use, energy, livelihoods, availability of food,
water and shelter, global interest in minimising human and economic cost of                 Impact-based
extreme weather and climate events continues to increase. Impact-based forecasting          forecasts and
provides the information needed to act before disasters to minimise the socio-              warnings provide an
economic costs of weather and climate hazards. Organisations and individuals can            assessment of the
make critical decisions to ensure that resources and supplies are in place to take          forecast weather or
early action and to respond as soon as it is safe to do so. Impact-based forecasting is     climate hazard and an
one of the crucial elements of the Red Cross Red Crescent Forecast-based Financing          assessment of the
systems. The World Food Programme calculated that releasing funds to vulnerable             possible impacts,
communities and individuals ahead of potentially devastating weather or climate             including when,
events, enables actions that save lives, livelihoods, and property.                         where and how likely
                                                                                            the impacts are.
The inclusion of risk assessments makes impact-based forecasting unique among
other forecasts and warnings. Hazard forecast information combined with
vulnerability and exposure data is used by national hydrological and
meteorological services and partner organisations to create a risk assessment.

                         ‘We found that impact-based warnings increased the
                         likelihood that people would take protective action,” says
                         Philippe Weyrich at the Swiss Federal Institute of Technology
                         in Zurich’ The Washington Post

                         ‘Crucial evidence has been gathered to showcase the cost-
                         effectiveness of early actions (triggered by impact-based
                         forecasts). Across four case-studies, Return-of-Investment
                         ratios ranged from USD 2.5-7.2 for every USD 1 spent on early
                         interventions.’ Food and Agriculture Organization. Global
                         Dialogue Platform on FbF-Berlin 2018

                         ‘Damage, suffering and the cost of emergency aid will reduce
                         when communities are capable of responding proactively to a
                         disaster through early impact-based warning and early
                         action.’ Netherlands Red Cross 510 initiative.

Impact-based Forecasting for Early Action                                                                            13
Chapter 1. Introduction
Table below contrasts fictional examples of traditional forecasts with impact-based
forecasts in context of flooding and tropical cyclone.
Table 1. Comparisons between Traditional Forecasts, Impact-based Forecasts,
and Co-produced Impact-based Forecasts
Impact-based forecast
for Individuals/ Impact based forecast for Sector
Hazard Forecast members of public specific users
Flooding Heavy rain is forecast. Flash flooding of the The forecast water level in the
100 to 150mm of rain is County River is expected. recreational district is expected to
expected within a Dwellings, farm buildings cross the +0.85 alert threshold in
three-hour period. and grazing land within 5 days and remain above for a
30m of the river channel further 3 days. An impact forecast of
are expected to flood and loss of household assets is over 25%
be damaged. and affected population over 40%.
Tropical A tropical cyclone A tropical cyclone A Tropical cyclone, lead time of
Cyclone category 3, windspeed category 3, windspeed of 30 hours, with wind speed greater
of 125 km/h is expected 125 km/h is expected to than 125 km/h, corresponding to
in the next 48 hours. make landfall in 12 hours, an impact forecast of damage of
in X and Y regions, likely to 25% of housing.
damage critical
infrastructure such as
bridges, blocking
transport from
region X to region Y.
With impact-based forecasting, national hydrological and meteorological services
assess the impacts of the forecasted climate and weather phenomenon and consider
their warnings based on the level and severity of those impacts at that particular
location and /or for the target users/groups.
14 The Future of ForecastsChapter 1. Introduction
Methodological Framework of Impact-based Forecasting (IBF)
and Warning Service
Understand Build
Warnings Needs for Partnerships and
Early Actions Collaborations
Codesign IBF
Assess Risk
(Hazard ×
Vulnerability ×
Exposure)
Identify/Prioritize
Impact of interest
Coproduce IBF
Forecast Hazard
Risk Matrix
Intervention
Determine Map Define
Level Likelihood of
of Impact Impact
Deliver IBF
Communicate
Disseminate
Prepare and Act Early
Flow process
Review, Verify & Improve Linkage
Impact-based Forecasting for Early Action 15Chapter 2. Understanding Users Chapter 2. Understanding Users German Red Cross Integrated Climate Change Adaptation programme 16 in Teso and Karamoja sub-regions of Uganda The Future of Forecasts (Photo: Denis Onyodi/URCS-DRK-Climate Centre)
Chapter 2. Understanding Users Understanding the users of forecasts and warnings is critical to the development and operational delivery of impact-based forecasting. These understandings are formed through partnerships with the individuals and organisations that will use the final tools. From the design to the delivery of impact-based forecasts and warning, input from users is essential. Identifying users National hydrological and meteorological services and partners developing impact- based forecasting must identify who will be using the forecasts and warnings. Users of forecast and warnings are found often within organisations involved in disaster risk reduction, crisis management, disaster response or any organisation, business or individual that needs to make decisions in the face of a potentially impactful weather or climate event. Look for the individuals who are responsible for making critical decisions in disaster risk reduction. Potential users of impact-based forecasts and warnings are diverse. It is not often possible to develop a forecast or warning which will satisfy all of their requirements. Often users will require impact-based forecasts and warnings services be tailored to the specific challenges they are trying to address. Typical Impact-based Forecast Users ▶▶ Members of the public ▶▶ Local businesses ▶▶ Community leaders ▶▶ Transport services ▶▶ Government departments (agriculture, social ▶▶ Energy providers and services welfare, public works etc.) ▶▶ Water providers and services ▶▶ Local government officials ▶▶ Telecommunication providers and services ▶▶ Disaster Risk Reduction and Civil Protection Agencies: humanitarian agencies development agencies police military hospitals and health providers local disaster managers A cyclone warning would need different information to be useful to a department of public works compared to a humanitarian organisation. For a department of public works, an impact-based forecast service might focus on the probability and magnitude of cyclone hazards that are likely to severely damage certain types of infrastructure across the exposed area. A humanitarian organisation focusing on supporting the most populations will likely require information about the percentage of affected livelihoods and the percentage of potential deaths. With such a broad and diverse range of requirements and opinions on how services should be provided, prioritising user requirements is an important step in the development process. Impact-based Forecasting for Early Action 17
Chapter 2. Understanding Users

                          Analysing user needs and meeting
                          requirements
                          Workshops, surveys, and interviews, among other methods, can be used to gather
                          feedback and suggestions from potential users of forecasts and warnings. Their
                          feedback establishes what is needed from an impact-based forecasting tool.

              Figure 1.
       IBF Stakeholder
     Mapping in Malawi
(Malawi Red Cross/510
adapted for this guide
     by Climate Centre)

                          Listed below are some sample questions to help identify users and their needs:

                             ▶▶ Who is requesting impact-based forecasts and warnings or who could it be
                                useful for?
                             ▶▶ Who is using the forecasts for decision-making or to take early action?
                             ▶▶ What forecast and warning information is currently being used?
                             ▶▶ How is forecast and warning information used in practice?
                             ▶▶ What challenges do users face at the onset of and during a hazardous event?
                             ▶▶ What risks or impacts are users trying to reduce?
                             ▶▶ How can forecasts and warnings provide appropriate information to enable
                                informed decision-making and trigger action?
                             ▶▶ At what spatial scale do users need forecast and warning information in order
                                to act effectively?
                             ▶▶ How much time do users need in order to anticipate and prepare?
                             ▶▶ What would be the consequences of false alarms?

                          When processing feedback from users, the national hydrological and meteorological
                          service and partners can assess their current forecasts and warnings on the basis of
                          three questions:

18                                                                                 The Future of Forecasts
Chapter 2. Understanding Users 1. What forecasts and warnings already exist that can meet user requirements? Users may not be aware of forecasts and warnings that already exist that may provide the level of detail they need. 2. Which existing forecasts and warnings can be adapted to meet the user requirements of impact-based forecast services? Some existing forecasts and warnings may need to change the way information is presented or include additional data to satisfy user needs. Converting an existing threshold-based forecast or warning into an impact-based forecast or warning may be relatively simple: needing only additional data and information from partner organisations. For example, where daily maximum temperature forecasts already exist, partners from health organisations or government health departments could provide relevant data on the health impacts of maximum daily temperatures. Combining and processing the two sets of information can produce an impact-based forecast for health impacts from high maximum temperatures. 3. What capability is needed to produce the impact-based forecasts and warnings that will meet the user requirements? Some user requirements may not be immediately deliverable without significant changes within the national hydrological and meteorological service. Organisations may need to conduct a capability assessment and/or gap analysis to identify what infrastructure, resources or datasets are needed to deliver the appropriate level of impact-based forecasting. Once gaps are identified, a diagnostic can be made of if and how those gaps can be filled. The following chapter presents additional information on incorporating specific user requirements and risk assessments into the development of impact-based forecasting services. Developing impact-based forecasts to address the challenges users face The Red Cross Red Crescent uses impact-based forecasts to mitigate the impacts of extreme weather and climate for the most vulnerable populations, this is one of the key elements for decision-making for Forecast- based Financing. The specific risks and impacts addressed vary from country to country and region to region. In a region where flooding can cause significant mortality of livestock, then the impact-based forecast may deliver an assessment of the risk to livestock. In a region where the condition of bridges and roadways after an extreme event significantly affects the ability of organisations to deliver humanitarian aid, an impact-based forecast will need to focus on the impact to transportation networks. The provision of timely impact-based forecasts allows for the positioning of humanitarian aid and the moving and protecting of livestock before the weather hazard occurs. Ideally, mitigating many of the challenges faced during weather and climate events. Impact-based Forecasting for Early Action 19
Chapter 3. Understanding Risk and Impact

 Chapter 3. Understanding Risk and Impact

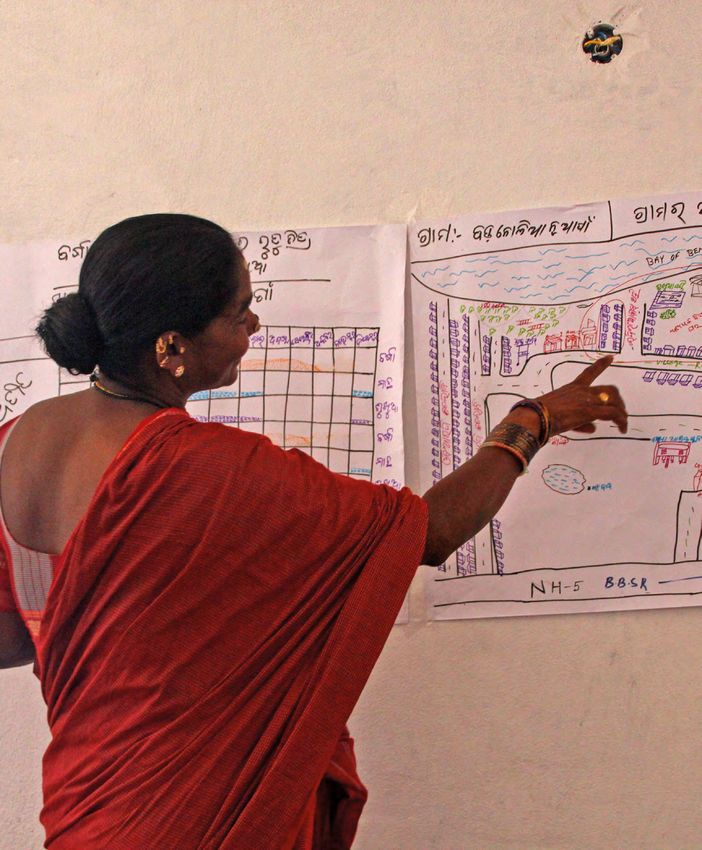
Resident of the Nolia Nua Gaon, Odisha explaining community resource and hazard maps
20
 (Photo: Sanne Hogesteeger/Climate Centre)                                             The Future of Forecasts
Chapter 3. Understanding Risk and Impact

IPCC Definitions of Hazard Vulnerability and Exposure

Hazard Hazard refers to the possible, future occurrences of natural or human-induced physical events that
        may have adverse effects on vulnerable and exposed elements. At times, hazard has been ascribed
        the same meaning as risk, but hazard is now widely accepted to be one component of risk and not risk
        itself.

Vulnerability refers to the propensity of exposed elements such as humans, their livelihoods, and assets to
                  suffer adverse effects when impacted by hazards. The ability of a population or community to
                  cope and adapt to disasters significantly impacts vulnerability. Coping capacity is the ability to
                  react to, and reduce the adverse effects of experienced hazards, whereas adaptive capacity is
                  the ability to anticipate and transform structures or organisations to better survive hazards.

Exposure refers to the presence of elements in an area in which hazard events may occur. Hence, if population
           and economic resources are not located in potentially dangerous settings, no problem of disaster
           risk exists. Exposure is a necessary, but not sufficient, determinant of risk. It is possible to be
           exposed but not vulnerable (for example by living in a floodplain but having sufficient means to
           modify building structure and behaviour to mitigate potential loss).

                                                                                              Figure 2. Schematic of
                                                                                              the Interaction of the
                                                                                              Physical Climate
                                                                                              System, Exposure, and
                                                                                              Vulnerability
                                                                                              Producing Risk
                                                                                              (IPCC, 2014)

The role of impact and risk assessments
in impact-based forecasting
Risk and impact assessments are essential steps in developing impact-based forecasts
and managing the risk of hazards. Well-designed risk and impact assessments can
help decide what potential impacts to investigate by identifying how hazards affect
people in different places.

Impact assessments turn forecasts and warnings from a description of what the
weather will be into a message about what the weather will do.

A risk assessment also allows the inherent uncertainty of hydrometeorological
factors to be expressed and factored into decision making. With this additional
piece of information, impact-based forecasts and warnings are comprehensive and
actionable over longer lead times.

Impact-based Forecasting for Early Action                                                                              21
Chapter 3. Understanding Risk and Impact
Lead times for forecasts and warnings vary significantly but can be quite short,
particularly ahead of extreme weather events. Impact-based forecasts, by
communicating the level of certainty within forecasts and warnings, can be issued
with longer lead times. While the forecast may be uncertain and the certainty in
the assessment of impacts may be low, the impact-based forecast still contains
valuable information long before the forecasted hazard. For example, instead of
waiting to determine a potential flood location with 90% confidence to issue a
flood alert, a hydrological and meteorological service might issue an impact-based
forecast showing low likelihood of flooding over a larger area 5 days in advance,
and then narrow down the region to show high likelihood and high impact at a
24 hours lead-time.
Impact assessments:
identifying hazard impacts
For impact-based forecasts and warnings it is important to identify the specific
impacts of a given hazard. Different approaches, methodologies and tools are used
to collect impact data, but the typical impacts expected of any given hazard are well
understood, especially when historical information is available. Table 1 highlights
potential sources of information and datasets for identifying hazard impacts.
Table 2. Potential Data Sources for Hazard Impacts
Hazard impact data sources
Hazard Impact Data Repositories
▶▶ National and regional ▶▶ Primary data providers - ▶▶ Data repositories - (e.g. EM-Dat,
hydrological and Government ministries Desinventar, Preventionweb)
meteorological services (environment, social welfare, ▶▶ Data collection methods: Rapid
▶▶ World Meteorological health, public works, energy) damage assessments, Post
Organization catalogue of water; Civil Protection Disasters Needs Assessments
extreme weather events Agencies/National Disaster
▶▶ Research institutes (e.g. Management Authorities
Dartmouth Flood Observatory, ▶▶ Humanitarian sector -
UNEP, Copernicus, International Affected communities,
Research Institute IRI, traditional knowledge holders,
FloodList) practitioners
▶▶ Media - newspapers,
social media
22 The Future of ForecastsChapter 3. Understanding Risk and Impact
In gathering historical datasets for a hazard, the following key questions may be
helpful:
▶▶ What were the impacts?
▶▶ When did the impacts occur?
▶▶ Where were the impacts observed?
▶▶ What is the quality of the historical records?
▶▶ What was the magnitude of the hazard? This can be related to the return
period.
▶▶ What is the frequency and geographic distribution of impacts from
a particular hazard?
▶▶ How is the nature of the hazard expected to change in the future due
to climate change, climate variability, socio-economic changes and
other external drivers?
While it may be challenging to develop an impact database with sufficient quality
in terms of spatial and temporal resolution, even in data sparse regions, impact-
based forecasting can still be produced. This is explored in more detail in Chapter
5. Producing Impact-based Forecasts and Warnings.
Flash flood from Lake Albert in Uganda, May 2020
Photo: Red Cross Climate Centre
Impact-based Forecasting for Early Action 23Chapter 3. Understanding Risk and Impact
Table 3. Examples of Disaster Impacts
Hydrometeorological Cascading
Hazard hazards Primary impacts Secondary impacts
Heavy Rain ▶▶ Landslide ▶▶ Damage of properties, ▶▶ Houses inhabitable
▶▶ Excessive erosion infrastructure ▶▶ Loss of services: power,
▶▶ Flooding ▶▶ Damage to certain crops water, communications,
(flash flood, and loss of livestock health care
river flood, ▶▶ Death by drowning ▶▶ Health issues/deaths:
waterlogging) ▶▶ Damage to topsoil waterborne diseases etc
▶▶ Mudslide ▶▶ Damage of properties, ▶▶ Loss of livelihood
▶▶ Silt deposit buildings, infrastructure ▶▶ Loss of industrial
▶▶ Damage certain crops, production
especially tubers ▶▶ Displacement/Migration:
▶▶ Dangerous travelling long and short term
conditions
Wind ▶▶ High waves ▶▶ Danger to life from flying ▶▶ Loss of services: power,
debris water, communications
▶▶ Damage to properties, ▶▶ Loss of livelihoods
buildings and other ▶▶ Injuries
manmade structures ▶▶ Houses inhabitable
▶▶ Trees, forests and orchards
damaged or uprooted
▶▶ Destroys some standing
crops, especially basic
grains
▶▶ Dangerous travelling
conditions
▶▶ Dangerous sea states
▶▶ Damage and disruption to
transport networks (trees
on railway lines and roads,
ferry ports inaccessible)
Snow ▶▶ Snow drift ▶▶ Transport networks ▶▶ Loss of livestock
▶▶ Avalanche inoperable ▶▶ Loss of services: power,
▶▶ Damage to property from water, communications
weight of snow ▶▶ Loss of livelihood
▶▶ Grazing inaccessible ▶▶ Access to health care,
▶▶ Crop damage education, food and
▶▶ Deaths medical supplies
▶▶ Loss of industrial
production
▶▶ Road traffic collisions
Ice ▶▶ Ice accretion on ▶▶ Damage to power lines ▶▶ Road traffic collisions
cables ▶▶ Power outages ▶▶ Loss of services: power,
▶▶ Transport networks water, communications
inoperable ▶▶ Access to health care,
▶▶ Damage to crops education, food and
medical supplies
24 The Future of ForecastsChapter 3. Understanding Risk and Impact
Hydrometeorological Cascading
Hazard hazards Primary impacts Secondary impacts
Lightning ▶▶ Danger to life ▶▶ Loss of services: power,
▶▶ Damage to property communications
▶▶ Power outages
▶▶ Delays to rail and air travel
Hail ▶▶ Damage to property ▶▶ Loss of livelihood
▶▶ Danger to life
▶▶ Dangerous driving
conditions
▶▶ Damage to and loss of
crops and livestock
Low rainfall ▶▶ Drought1 ▶▶ Severe crop losses ▶▶ Loss of livelihood
▶▶ Dust storms ▶▶ Water shortages ▶▶ Loss of livestock
▶▶ Desertification ▶▶ Soil erosion
▶▶ Food shortages
▶▶ Increased hunger and
malnutrition
▶▶ Disease (e.g. measles and
diarrhoea)
▶▶ Displacement/Migration:
long and short term
▶▶ Conflict
High temperatures ▶▶ Heatwave ▶▶ Danger to human and ▶▶ High temperatures
livestock health exacerbate existing
▶▶ Power outages health conditions
▶▶ Interruptions to public ▶▶ Death
transport (rail)
Low temperatures ▶▶ Cold wave ▶▶ Danger to human and ▶▶ Low temperatures
livestock health exacerbate existing
▶▶ Damage to and loss of health conditions
crops ▶▶ Death
Coastal/storm surge ▶▶ Rapid flooding ▶▶ Danger to life ▶▶ Displacement
▶▶ Removes topsoil ▶▶ Damage to infrastructure ▶▶ Loss of services: power,
and increases including settlements, water, communications,
salinity property, transport, power health care
networks ▶▶ Health issues: waterborne
▶▶ Destroys most crops diseases etc
▶▶ Disrupts and ▶▶ Loss of livelihood
contaminates water
supply
Fog ▶▶ Reduced visibility ▶▶ Disruption to transport ▶▶ Loss of livelihood
networks
▶▶ Damage to and loss of
crops (humidity).
▶▶ Delays to air travel
1
This guide recognises that there are several other factors that increase the risk of droughts.
Impact-based Forecasting for Early Action 25Chapter 3. Understanding Risk and Impact
Risk Assessments
Risk assessments are the keystone of impact-based forecasting and require
information on the following dimensions:
▶▶ Hazard
▶▶ Exposure
▶▶ Vulnerability (including coping and adaptive capacity)
Defining Risk
Risk assessments should include individual analysis of risk factors alongside, and
informed, by the historical impact assessment for each hazard of interest. The impact
assessment can focus and guide the data collection and collation on risk dimensions
like vulnerability, exposure and coping capacity. For example, in an event where a
primary concern is housing damage from strong winds, hazard data on historical
wind speeds and vulnerability data on housing quality is required. During the risk
and impact assessments, working with partner organisations and users to identify
the risk indicators that drive impacts will improve both processes.
In many cases, risk assessments use a combination of objective and subjective
methods. Consequently, data on different risk dimensions often begins as qualitative
and develops iteratively. As more data and feedback from users and partners is made
available, the assessments become more quantitative. Producing an objective
assessment of risk will be challenging due to factors that affect the quality and
robustness of information used throughout the process, including: how data is
collated; what data is available; how data is processed; what assumptions have been
made in weather and climate models.
Common global Identifying the hazard
Geospatial Platforms
for vulnerability and When resources are limited, prioritize impact-based forecasting for hazards with the
exposure data greatest impact and risk. Selecting the appropriate hazard is essential to developing a
risk assessment and ultimately developing an impact-based forecast. The decision
ThinkHazard! should be based on a combination of the following:
(GFDRR) ▶▶ The extent to which a hazard will cause negative impacts on lives, livelihoods,
well-being and other developmental aspects
OpenStreetMap ▶▶ The forecast skill available
▶▶ The forecast lead time: the length of time between the issuance of a forecast
INFORM and the onset of the disaster.
The Humanitarian Hazards that have been bringing significant impacts to the people and economy
Data Exchange should be selected for the impact-based forecasting service. However, where there is
(UN OCHA) insufficient modelling capability and forecasting skill, hazards may need to be
excluded from impact-based forecasting, even though the impact brought by the
GeoNode hazard can be significant. Also important is to ensure that the lead time available for
the hazard can provide sufficient time to implement early actions and mitigate
impacts in advance.
26 The Future of ForecastsChapter 3. Understanding Risk and Impact
Observed hydrometeorological conditions and weather or climate model output are
used to produce a weather or climate hazard forecast. Ensemble forecasting
establishes the probability of the weather or climate hazard occurring. The resulting
hazard forecast is used as the basis to calculate the level of impact and the likelihood
of impacts occurring.
In order to better understand hazards at a spatial scale, hazard exposure should be
obtained in the risk assessment phase (for example, see UNEP flood exposure). This
exposure represents an average, or typical, likelihood that an area will be affected by
a certain hazard. For example, a hydrological model can be used to determine flood
extent for a certain return period or observed flood extents can be averaged by
analysing remote sensing data over a set period. To determine hazard exposure, data
is combined with exposed population datasets, such as in the calculations of UNEP.
Climatology can be used to generate return periods, commonly used to explain the
probability of an extreme event of a certain magnitude happening in a given year. A
common misconception is that a weather or climate event with a 5-year return period
will happen once every five years. The correct meaning of a 5-year event is a 20%
probability - taking snowfall as example, this would refer to snow depth with a 20%
probability of being exceeded in any given year. 5-year events can occur in the same
year, consecutive years, or several years apart. The World Meteorological Organization
outlines statistical methods that can be used with historical data, to generate return
periods in Comprehensive Risk Assessment for Natural Hazards.
Vulnerability and Exposure
Vulnerability and exposure data, or indicators, are required to provide an objective
assessment of risk in impact-based forecasting. Organisations that manage
datasets with this type of information will be ideal candidates for impact-based
forecasting partnerships.
To identify the relevant vulnerability and exposure datasets needed for impact-based
forecasting, it is important to know what problems or issues the impact-based
forecasts and warnings are trying to address. For example, if the information in a
forecast will be used to take early action to reduce flood damage to housing, the
exposure and vulnerability indicators must be specific to the characteristics that
indicate the robustness or build quality of houses, when data is not available proxy
indicators can be used.
Going beyond hazard forecasting towards impact-based
forecasting requires linking forecasts with vulnerability and
exposure data. Essential data includes an archive of disaster
impacts, in order to assess the relationship between the
hazard and impact [to build ‘stage-damage curves’]
(Ward et al., 2013)
Impact-based Forecasting for Early Action 27Chapter 3. Understanding Risk and Impact
Typical questions to ask include:
▶▶ What are the vulnerabilities that lead to impacts?
▶▶ Which impacts cause the greatest suffering?
▶▶ Who is affected the most?
▶▶ Which impacts are the most difficult to deal with?
▶▶ How livelihoods are affected?
▶▶ Which sectors are affected the most?
Key Data Questions
The Red Cross Red Crescent recommends considering the following key questions when identifying
vulnerability and exposure data:
Exposure
▶▶ Which populations, infrastructure, natural resources, or assets are exposed?
▶▶ Where are they? For example, households on the wrong side of protective embankments or in river basins
a long way from high ground are particularly exposed.
Vulnerability
▶▶ What are the vulnerability indicators that are related to the identified impacts?
▶▶ How are impacts related to the underlying causes of vulnerability? For example, people with houses made
from low-quality materials will be vulnerable to damage. However, more indirect vulnerabilities such as
poverty and literacy might play a role an individual’s ability to prepare for and cope with impact.
Data Quality
▶▶ What is the quality and availability of data for vulnerability indicators? How often are they updated?
▶▶ Which vulnerability indicators may be redundant (e.g. education levels and literacy), and which indicators
provide new information? Once the vulnerability and exposure indicators are defined, a composite
updatable vulnerability index can be developed as one layer of the impact-based forecasting model. If you
are developing a composite index, be careful about which contributing layers you select, so as not to
overweight certain patterns of vulnerability.
Once such indicators are established, authoritative, credible sources of data from
partners and collaborating organisations should be the first choice for vulnerability
and exposure data. This ensures access to the most relevant data and allows partners
to discuss and identify the datasets needed for impact-based forecasting.
Vulnerability and exposure data can be obtainabed from global platforms (including
geospatial) and national level databases, such as national statistics and disaster risk
management agencies. Local organisations, such as district office and municipal town
halls, can help identify and access subnational and local level databases.
However, ensuring that vulnerability and exposure data is of high quality, available
in a timely manner, and is inclusive can be challenging:
▶▶ Vulnerability and exposure changes over time, particularly after an extreme
weather or climate event. Datasets must be kept up to date to ensure the
impact-based forecast or warning using this data is reliable. Recognise
that many official governmental data sources, such as a national census
or demographic and health surveys, are updated infrequently – every five
or ten years.
28 The Future of ForecastsChapter 3. Understanding Risk and Impact
▶▶ Data is sometimes available only at a more aggregated level. Granular
information is frequently only partly digitised or not available at a nation-wide
level, and therefore more difficult to use. For example, data gathered by
non-governmental organisations and the humanitarian sector through
Vulnerability and Capacity Assessments are typically available at the much
lower administrative level (town or village).
▶▶ Datasets can contain biases. Using crowd-sourced derived data, such as from
social media, comes with the risk that poor and vulnerable communities are
often not represented in these data streams due to the digital divide. However,
official statistics might not cover informal settlements or vulnerabilities linked
to informal economies” (van den Homberg 2018) and crowd-sourced data that
includes these communities may provide valuable information.
Once vulnerability and exposure data are gathered and processed, the data can be
analysed alongside the hazard information to produce a risk assessment. Commonly,
this is done using a composite risk index, such as the EU JRC does with the INFORM
Index. Equal weight is given to all of the indicators under the main risk dimensions
of hazard, exposure and vulnerability (including coping capacity).
Case study UK Met Office Wind Warnings
For the far north-west of the UK, strong winds are a way of life. In this region, much higher wind speeds
are needed to cause similar level of impact than lower windspeeds in the rest of the country. There are no
significant bridges, no railways and very few trees. The impacts of greatest concern are generally structural
damage, public safety, power/telecoms outages, and safety on coasts/causeways from high seas.
Table 4. Winter Windspeeds and Impact levels
Winter
Wind gust speed (mph) Wind speed gust (mph) Indicative
south of UK north west of UK Impact Level
60-70 70-80 Low
70-80 80-90 Medium
80+ 90+ High
For all UK weather warnings, thresholds are only used to inform the risk assessment where there is a
correlation between the specific hazard threshold and impact. The risk assessment for a particular event then
makes the use of these indicative thresholds, but then an adjustment is usually applied based on changes in
vulnerability and exposure across the warning area.
In the summer, two additional factors affect the thresholds used for wind warnings: trees are in full leaf,
making them more susceptible to wind damage, and more people are spending time outside, with a large
increase in the number of people holidaying in tents, caravans and mobile homes. The thresholds used for
wind warnings in the summer are therefore lower than in winter, with low impact warnings potentially being
issued across southern parts of the UK for wind speeds starting at 50mph.
Impact-based Forecasting for Early Action 29Chapter 3. Understanding Risk and Impact
Identifying impact levels from
hazard thresholds
Hazard-based forecasts and warnings often use hydrometeorological thresholds
based on the magnitude of the hazard as the trigger to issue a specific forecast or
warning. Although thresholds do not need to be explicitly communicated within
impact-based forecasting (unless requested by the user), hydrometeorological
thresholds are important within the impact-based forecasting process.
Identifying an appropriate hazard threshold beyond which impacts are possible,
or the level of impact is unacceptable, can be a key piece of information for the
risk assessment process.
Analysing past events helps identify correlations between the magnitude of a
hazard and the impact. The hazard’s magnitude may then be used as a proxy for
the level of impact, taking into consideration that thresholds might only be
useful proxies in certain contexts or for specific locations. For example, the UK
Met Office uses wind gust speed thresholds as an initial proxy for impacts in
windstorms (see box above). Many hazards have multiple thresholds at which
impacts occur. Thresholds will vary based on area affected, topography,
antecedent conditions, time of day, season, resilience of infrastructure, health of
the local population, types of land use, etc. Adjusting trigger thresholds, possibly
on an event by event basis and based on changing user requirements may be
necessary. Additionally, thresholds may need to be reconsidered after an event
occurs, especially for hazards that can occur in close succession, as the
vulnerability and exposure can change as a result of the preceding event.
For impact-based forecasting, thresholds must be defined from assessments
of the magnitude of hazard that results in specific impacts. This means that
it is important to understand which impacts are possible, where they may occur,
and what can be done to minimise the impacts. For example, in Argentina,
temperature thresholds have been developed in conjunction with the Ministry of
Health and other partners, which are used for impact-based heat wave warnings.
30 The Future of ForecastsChapter 3. Understanding Risk and Impact Case study Identifying thresholds for heatwave warnings in Argentina From summer 2017-2018, the Early Warning System of Heat Waves and Health (SAT-OCS) was implemented in the Servicio Meteorológico Nacional, the National Meteorological Service of Argentina. Available from October to March, the Early Warning System works automatically for 57 localities in the country, issuing a daily alert. Figure 3. Web site description of how heatwave thresholds are calculated and Advice on what to do in a heat wave to minimise impact on human health (translated from the original Spanish) At each level of alert, the population and civil protection organizations can take appropriate prevention, mitigation and response measure. In addition to displaying heat wave alerts, the website also communicates what a heat wave is, how the alert levels have been determined and what to do in a heat wave to reduce the impact on human health. A more comprehensive description of the methodology used to determine alert levels is available in Spanish here. Future hazards and impact levels Climate change has the potential to bring unprecedented hazards and levels of impact. Consideration of potential future events and the impacts that may occur should be incorporated into the development of impact-based forecasting. This means impact-based forecasting models should be updated regularly. For example, if using a machine learning algorithm, retraining the algorithm as new data becomes available is recommended. Here new advances in data science such as streaming data could enable near-automatic retraining. Manuela di Mauro recommends building on past event data but taking into account future events in Quantifying Risk Before Disasters Occur: Hazard Information for Probabilistic Risk Assessment. Such an approach provides better coverage of the possible events and results in an improved estimation of the probability of occurrence of each event and associated impacts. Mauro also outlines appropriate equations to apply to hazard, vulnerability and exposure data to produce a probabilistic risk assessment for natural hazards, which can be applied to impact-based forecasting. Impact-based Forecasting for Early Action 31
Chapter 4. Partnerships and collaboration

 Chapter 4. Partnerships and collaboration

ARRCC Stakeholder Consultation Workshop in Bangladesh
Photo: RIMES/UK Met Office

32                                                      The Future of Forecasts
Chapter 4. Partnerships and collaboration

Developing an impact-based forecasting service requires partnerships and
collaboration. Partner organisations can help identify the impacts that are of most
concern, assess user requirements, and understand the hazards that drive those
impacts. A strong collaborative approach brings together the producers of weather,
climate and risk information with those who use the information to make decisions.

A variety of methods can be used to gather, analyse and develop user requirements,
such as workshops, surveys, interviews, and technical working groups to analyse and
develop requirements into impact-based forecasting.

Getting those workshop formats, and survey and interview questions right requires
expertise as well as significant time and resources. Working with partners to co-
design, deliver and analyse the outcomes is recommended. Through such a co-
creation process, partners contribute their expertise and insights –strengthening the
learning design and process.

If needed, additional external facilitators and market research experts, supported by
partner organisations, can frame the questions that need to be asked and the
techniques that can be used to gather information from users.

                                                                                         Figure 4. Future
                                                                                         Climate for Africa:
                                                                                         Six Building Blocks
                                                                                         for Co-production

  Highlight        Lake Victoria WISER HIGHWAY Project

Lake Victoria supports Africa’s largest inland fishery. Annually, the fishery produces approximately
1,000,000 tons of fish, employs about 200,000 fishers, and generates over 500 million USD in exports. Over
30 million people live near the coastline near 1,400 landing sites or beaches from which 50,000 boats operate.
Through the WISER HIGHWAY project (HIGH impact Weather lAke sYstem), a partnership among the national
hydrological and meteorological services and stakeholders from Kenya, Rwanda, Tanzania and Uganda
coordinates early warning services for the Lake and its basin, with potentially one centralised operational
centre to provide impact-based forecasts of storm events to fisherman and small boat operators.

Impact-based Forecasting for Early Action                                                                      33
Chapter 4. Partnerships and collaboration
Partnership benefits continue even after development and implementation of
impact-based forecasting services. Members of the partnership can be tasked with
monitoring the effectiveness of forecasts and warnings and providing feedback
for improvement.
Partners are also critical in communicating impact-based forecast and warnings.
Some partner organisations will have responsibilities for anticipatory actions: to
prepare for and respond to weather and climate events. These actions likely include
providing advice to vulnerable communities on what to do in an extreme weather or
climate event. Combining partner’s anticipatory advice with impact-based forecasts
and warning can provide a seamless forecast and advice service to users.
Figure 5. United
Nations Office for
Disaster Risk
Reduction: Seven
Targets of the Sendai
Framework for
Disaster Risk
Reduction 2015-2030
Partnerships and collaboration in impact-based forecasting align with several global
frameworks, such as the International Network for Multi-Hazard Early Warning
System (IN-MHEWS), the Climate Risk and Early Warning Systems initiative
(CREWS), and the Sendai Framework for Disaster Risk Reduction. In particular,
developing impact-based forecasting contributes to five of the seven Sendai
Framework targets (A, B, C, F, G).
Roles and responsibilities of partner
organisations
The roles, responsibilities and the level of collaboration required from each
organisation within impact-based forecasting will vary. The World Meteorological
Organization provides some overall guidance on how to set up Memorandums of
Understanding between partner organisations and what to consider when
establishing partnerships.
Some organisations may already have official roles relevant to impact-based
forecasting. The World Meteorological Organization Alerting Authorities list
designates which organisations are recognised by a member state to issue official
alerts. Other organisations may need roles and responsibilities formalised. However,
34 The Future of ForecastsYou can also read


