Monitoring Intergenerational Wellbeing - Treasury Living Standards Dashboard: Conal Smith - Treasury NZ
←
→
Page content transcription
If your browser does not render page correctly, please read the page content below
BEHAVIOURAL ECONOMIC & SOCIAL ANALYSIS

Treasury Living Standards
Dashboard:

Monitoring
Intergenerational
Wellbeing

Conal Smith

June 2018
CONTENTS
1     Introduction.  .  .  .  .  .  .  .  .  .  .  .  .  .  .  .  .  .  .  .  .  .  .  .  .  .  .  .  .  .  .  .  .  .  .  .  .  .  .  .  .  .  .  .  .  .  .  .  .  .  .  .  .  .  .  .  .  .  .  .  .  . 1

2     Context.  .  .  .  .  .  .  .  .  .  .  .  .  .  .  .  .  .  .  .  .  .  .  .  .  .  .  .  .  .  .  .  .  .  .  .  .  .  .  .  .  .  .  .  .  .  .  .  .  .  .  .  .  .  .  .  .  .  .  .  .  .  .  .  .  . 2
2.1   Wellbeing and the good society. . . . . . . . . . . . . . . . . . . . . . . . . . . . . . . . . . . . . . . . . . . . . . . . 2
2.2   Te ao Māori. . . . . . . . . . . . . . . . . . . . . . . . . . . . . . . . . . . . . . . . . . . . . . . . . . . . . . . . . . . . . . . .  2
2.3   The Investment Statement. . . . . . . . . . . . . . . . . . . . . . . . . . . . . . . . . . . . . . . . . . . . . . . . . . . .  3
2.4   Budget 2019 . . . . . . . . . . . . . . . . . . . . . . . . . . . . . . . . . . . . . . . . . . . . . . . . . . . . . . . . . . . . . . .  3
2.5   Other wellbeing work. . . . . . . . . . . . . . . . . . . . . . . . . . . . . . . . . . . . . . . . . . . . . . . . . . . . . . . .  3

3     Conceptual framework .  .  .  .  .  .  .  .  .  .  .  .  .  .  .  .  .  .  .  .  .  .  .  .  .  .  .  .  .  .  .  .  .  .  .  .  .  .  .  .  .  .  .  .  .  .  .  .  .  .  .  .  . 4
3.1   The Living Standards Framework. . . . . . . . . . . . . . . . . . . . . . . . . . . . . . . . . . . . . . . . . . . . . . .  4
      Figure 1. The Living Standards Framework                                                                                     4
3.2   The OECD/Better Life model . . . . . . . . . . . . . . . . . . . . . . . . . . . . . . . . . . . . . . . . . . . . . . . . . .  5
      Figure 2. The OECD approach to measuring wellbeing                                                                              5
3.3   The economic model . . . . . . . . . . . . . . . . . . . . . . . . . . . . . . . . . . . . . . . . . . . . . . . . . . . . . . . .  6
      Figure 3. The inclusive wealth framework                                                                                            7
3.4   Adapting the OECD model to New Zealand . . . . . . . . . . . . . . . . . . . . . . . . . . . . . . . . . . . . . .  8
      Figure 4. A conceptual framework for the Living Standards Dashboard                                                 9
      Box 1. The dimensions of current wellbeing                                                                       10
      Figure 5. How’s Life? and Social Report wellbeing frameworks                                                     10
      Box 2. Indicators of wellbeing and the capital stocks                                                            12
3.5   What does a wellbeing framework add to evaluating policy proposals?. . . . . . . . . . . . . . 12
3.6   New Zealand issues. . . . . . . . . . . . . . . . . . . . . . . . . . . . . . . . . . . . . . . . . . . . . . . . . . . . . . . . . 14
      Substantive issues: The place of culture                                                                                            14
      Communication: how to describe wellbeing in New Zealand                                                                             15
      Technical issues: trade-offs between relevance and comparability                                                                    16
3.7   Potential objections . . . . . . . . . . . . . . . . . . . . . . . . . . . . . . . . . . . . . . . . . . . . . . . . . . . . . . . . 16
      People have different tastes                                                                                                         17
      Wellbeing might be different across cultures or belief systems                                                                       17
      Even the main theories of wellbeing are contradictory                                                                                17
      Wellbeing is unobservable                                                                                                            17
      Wellbeing frameworks are too complex and multidimensional to be useful for
      decision-making                                                                                                                      18
3.8   Other frameworks. . . . . . . . . . . . . . . . . . . . . . . . . . . . . . . . . . . . . . . . . . . . . . . . . . . . . . . . . . 18

4     Identifying Indicators of Intergenerational Wellbeing .  .  .  .  .  .  .  .  .  .  .  .  .  .  .  .  .  .  .  .  .  .  .  .  .  .  . 20
      Indicators of distribution and inequality                                                                                             20
      Box 3. The process of selecting indicators                                                                                            22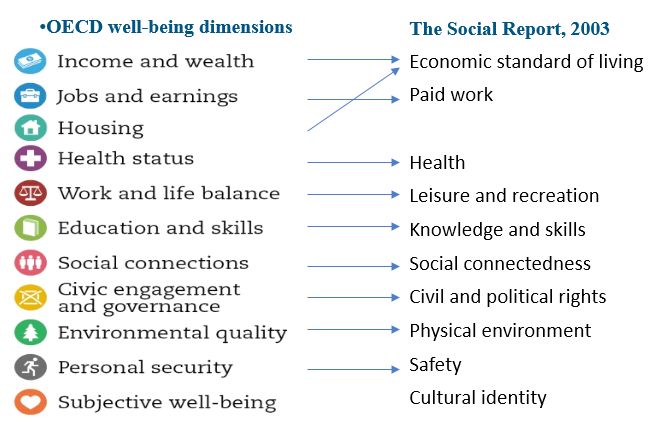
4.1 Current wellbeing. . . . . . . . . . . . . . . . . . . . . . . . . . . . . . . . . . . . . . . . . . . . . . . . . . . . . . . . . . 22
Market outcomes 23
Non-market outcomes 24
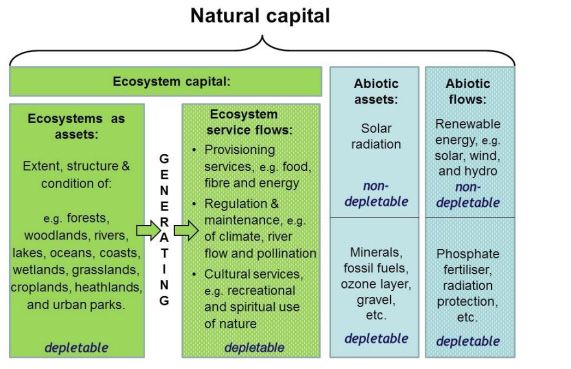
4.2 The capital stocks . . . . . . . . . . . . . . . . . . . . . . . . . . . . . . . . . . . . . . . . . . . . . . . . . . . . . . . . . . 27
Box 4. Monetisation or natural units? 28
Produced capital 28
Natural capital 29
Figure 6. Components of natural capital 30
Abiotic 31
Human capital 32
Social capital 32
4.3 Multifactor productivity. . . . . . . . . . . . . . . . . . . . . . . . . . . . . . . . . . . . . . . . . . . . . . . . . . . . . 34
4.4 Net claims on rest of world . . . . . . . . . . . . . . . . . . . . . . . . . . . . . . . . . . . . . . . . . . . . . . . . . . 35
4.5 Timeliness and scope of picture . . . . . . . . . . . . . . . . . . . . . . . . . . . . . . . . . . . . . . . . . . . . . . 35
5 Measurement proposal. . . . . . . . . . . . . . . . . . . . . . . . . . . . . . . . . . . . . . . . . . . . . . . . . . . . 36
A tiered approach 36
5.1 The Living Standards Dashboard. . . . . . . . . . . . . . . . . . . . . . . . . . . . . . . . . . . . . . . . . . . . . . 36
Living Standards Database 36
Figure 7. The Living Standards Database 37
Living Standards Overview 37
Living Standards Themes 39
5.2 Producing the Living Standards Dashboard. . . . . . . . . . . . . . . . . . . . . . . . . . . . . . . . . . . . . 39
5.3 A review of the Living Standards Dashboard. . . . . . . . . . . . . . . . . . . . . . . . . . . . . . . . . . . . 40
6 Next steps. . . . . . . . . . . . . . . . . . . . . . . . . . . . . . . . . . . . . . . . . . . . . . . . . . . . . . . . . . . . . . 42
References . . . . . . . . . . . . . . . . . . . . . . . . . . . . . . . . . . . . . . . . . . . . . . . . . . . . . . . . . . . . . . . . . . . 45
Annex 1. Evaluation of Indicators. . . . . . . . . . . . . . . . . . . . . . . . . . . . . . . . . . . . . . . . . . . . . . . . . 48
Current wellbeing . . . . . . . . . . . . . . . . . . . . . . . . . . . . . . . . . . . . . . . . . . . . . . . . . . . . . . . . . . . . . . . 48
Market outcomes 49
Non-market outcomes 54
Capital stocks. . . . . . . . . . . . . . . . . . . . . . . . . . . . . . . . . . . . . . . . . . . . . . . . . . . . . . . . . . . . . . . . . . . 68
Produced capital 68
Natural capital 69
Human capital 69
Social capital 72
Multifactor productivity . . . . . . . . . . . . . . . . . . . . . . . . . . . . . . . . . . . . . . . . . . . . . . . . . . . . . . . . . . 75
Net claims on the rest of the world. . . . . . . . . . . . . . . . . . . . . . . . . . . . . . . . . . . . . . . . . . . . . . . . . 76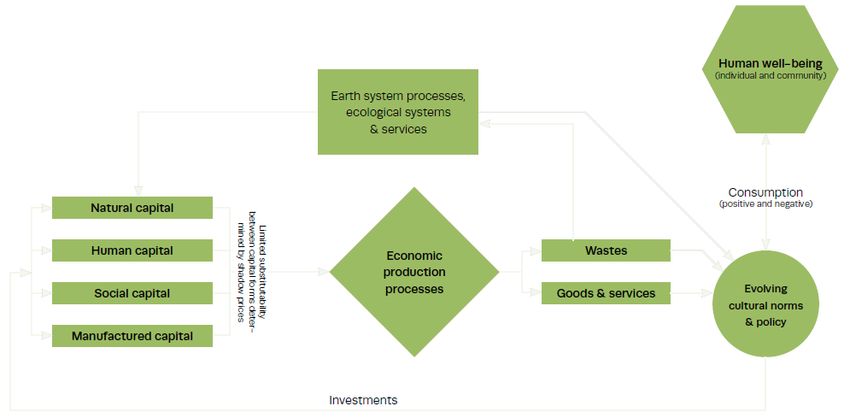
As many of you know the LSF draws on OECD analysis of wider
indicators of wellbeing. It gauges our success in developing four capitals
   – financial and physical, human, social and natural. These provide
   a more rounded picture of how successful Government policy is in
               improving New Zealanders’ living standards.

                                    Grant Robertson, Minister of Finance, IPANZ, 15/2/18
1 INTRODUCTION
The vision of the New Zealand Treasury is to promote higher living standards for all
New Zealanders. To support this, the Treasury uses the Living Standards Framework to guide its
policy-making. In 2017, the Living Standards Framework underwent a major “refresh” to focus
it on the four capital stocks (physical and financial capital, natural capital, human capital and
social capital) that underpin intergenerational wellbeing. The refresh was intended to improve
the usefulness of the Living Standards Framework in supporting the Treasury’s policy advice and
medium-term strategy, and to bring the Living Standards Framework more closely into line with
international practice by reflecting recent developments in the economics of wellbeing.
In order to usefully inform policy advice and strategic planning, the Living Standards Framework
needs to be more than just a conceptual tool. It will be necessary to develop measures that can
provide meaningful information on intergenerational wellbeing to complement existing fiscal and
economic measures. This report sets out a proposal for a dashboard measure of intergenerational
wellbeing – the Living Standards Dashboard – that aligns with the Treasury’s needs and which is
intended specifically to support the Treasury’s medium- to long-term policy analysis.
The report is divided into five sections. Following this introduction, Section 2 of the report briefly
discusses some of the key contextual factors that influence how any dashboard is likely to be used
and which set the parameters for the project. If the dashboard is to be useful to the Treasury, it is
essential to be clear about how it will be used. Section 3 discusses the conceptual model for the
dashboard. While the Living Standards Framework is based on the same capital stocks model that
underpins much international work on wellbeing (eg, The OECD Better Life Initiative), only a few
elements of the full model are represented in the Whāriki diagram used to represent the Living
Standards Framework. Meaningful measurement will require teasing out all of the key elements of
the conceptual model in order to identify what it is that will need to be measured.
Fleshing out the conceptual model with specific indicators is the focus of Section 4. This is a
largely technical task, with the key question being which measures provide the most accurate and
useful information on each dimension in the conceptual model. In many cases it is possible to
identify a suite of indicators relating to some part of the conceptual model of intergenerational
wellbeing that can be used largely “as is”. The System of National Accounts, for example, provides
a well-tested series of measures for physical and financial capital. However, there are some areas
(eg, natural capital) where measurement is much less developed.
The final section of the report focuses on the nature and scope of a dashboard suited to the
Treasury’s needs. Fully fleshing intergenerational wellbeing will result in too many indicators to
provide an intelligible overview for the Treasury and other decision-makers focused on medium-
term policy decisions. It is therefore necessary to identify a way of presenting the most important
information about intergenerational wellbeing that is tailored to the Treasury’s needs and captures
the overall picture well, without getting lost in excessive detail. A tiered approach is proposed
to address this issue, based around three distinct outputs. These include a comprehensive suite
of indicators produced by Statistics New Zealand, a high-level overview aimed at presenting the
“big picture” to decision-makers and a thematic focus that addresses particularly salient issues in
more depth.
Treasury Living Standards Dashboard: Monitoring Intergenerational Wellbeing 12 CONTEXT
The Living Standards Framework is focused on intergenerational wellbeing. However, the Living
Standards Dashboard is not simply an academic exercise to measure intergenerational wellbeing.
The design of the Living Standards Dashboard has to reflect the needs of the Treasury and the
Government more widely, and has to usefully inform policy design. From this perspective it is
essential that the Living Standards Dashboard reflects the Treasury’s main institutional constraints
and drivers.
2.1 Wellbeing and the good society
An important point to clarify early on is the relationship between the concept of intergenerational
wellbeing and other potential points of view on the role of government in society. The Living
Standards Framework is focused on increasing the intergenerational wellbeing of New Zealanders.
This is because the Living Standards Framework is intended to support the New Zealand
Treasury in its decision-making, and the Treasury’s role is centred on improving the wellbeing
of New Zealanders. However, intergenerational wellbeing is not the only way to think about the
good society, and it might reasonably be that in a pluralistic environment other values should be
considered alongside or instead of intergenerational wellbeing.
While the view that there are things (eg, human rights) that should have a high or higher
priority than intergenerational wellbeing is reasonable, this does not mean that we should try
to incorporate all of these things into the Living Standards Framework. The aim of the Living
Standards Framework is to assist the Treasury in its role in contributing to the wellbeing of New
Zealanders and effectively managing the resources that underpin the wellbeing of New Zealanders
in the future. Doing so requires measuring these concepts well, and this is the primary focus
for the Living Standards Dashboard. Just as the System of National Accounts aims to provide
an accurate measure of the size of the economy, without implying that the size of the economy
should be the sole focus of government policy, the Living Standards Dashboard aims to provide
a good measure of the main stocks and flows important to intergenerational wellbeing without
implying that this is the only goal for government.
This issue will be particularly important when applying the Living Standards Framework to policy
issues where considerations such as existence value or due process are particularly salient
(eg, natural capital, justice). Issues of this sort might reasonably cut across a wellbeing framework,
and indeed, in many cases are intended to do so. The entire point of the idea of human rights,
for example, is intended to set out a minimum set of entitlements that take priority over wider
consequentialist concerns. This remains true even if, in practice, actual conflicts between a
wellbeing perspective and other constraints such as human rights are rare.
2.2 Te ao Māori
Any comprehensive framework for intergenerational wellbeing in New Zealand needs to consider
both the wellbeing of Māori and Māori conceptions of wellbeing. This reflects the status of
Māori as the indigenous population of New Zealand and the principles of the Treaty of Waitangi.
When using an international framework to assess the wellbeing of the New Zealand population,
it is clearly important to look at outcomes for Māori. This is a fundamental part of any meaningful
analysis of the distribution of wellbeing outcomes. However, looking at the wellbeing of Māori in
this way is not equivalent to looking at Māori wellbeing. A robust assessment of Māori wellbeing
needs to apply a conception of wellbeing grounded in te ao Māori.
This report focuses primarily on developing an internationally comparable framework for
intergenerational wellbeing. While allowance is made for the framework to reflect issues of
importance to New Zealanders (including Māori), the proposed framework does not specifically
address Māori conceptions of wellbeing. Understanding wellbeing from a te ao Māori perspective
is important for government policy and for New Zealand more widely. Some reassurance that
the wellbeing domains in the Living Standards Framework are not completely alien to te ao
Treasury Living Standards Dashboard: Monitoring Intergenerational Wellbeing 2Māori can be taken from the fact that they are largely the same as the Social Report outcome
domains which were the subject of extensive consultation with Māori in 2002 but further work on
Māori conceptions of wellbeing should reflect the principle of kaupapa Māori – that a wellbeing
framework for Māori needs to be developed by Māori. A complementary paper is currently being
prepared for the Treasury focusing on Māori perspectives on wellbeing.
2.3 The Investment Statement
In 2013, the Public Finance Act (1989) was amended to require the Treasury to report to
Parliament with an Investment Statement at least every four years. The Investment Statement
outlines the importance of the Crown’s balance sheet for the quality of New Zealanders’ living
standards and describes how the balance sheet has evolved, and how it is expected to change in
the future. More specifically, the balance sheet and associated analysis describe the performance
of the Crown’s major asset and liability classes, and help to manage risks by identifying where the
main risks and weaknesses are.
While the timeframe for the 2018 Investment Statement made initial steps towards incorporating
an intergenerational wellbeing perspective into the Treasury’s reporting, future Investment
Statements will aim to take this further. It is therefore essential that the Living Standards
Dashboard supports the Treasury by providing a sound framework for thinking about the four
capitals in the context of a broadly conceived government balance sheet. Although it will not
be possible to provide robust comparable values of all four capital stocks that could be directly
incorporated into the Investment Statement, the indicators for the Living Standards Dashboard
should be sufficient to support meaningful analysis about the direction of movement in the
different capital stocks at a minimum, and comparisons of level with similar measures collected
elsewhere.
2.4 Budget 2019
The Minister of Finance has announced that the 2019 budget will be a “wellbeing budget”, with
budget priorities explicitly structured around intergenerational wellbeing. This will involve a
budget process that captures the impact of proposed initiatives in terms of both current wellbeing
and the four capitals, as well as a framework to support Ministers in making budget decisions.
Beyond this, it will be necessary to have a good overview of the supporting information about the
broad state of current wellbeing and the four capitals in New Zealand that will provide context for
the budget.
The Living Standards Dashboard will need to be aligned with Budget 2019 in two ways.
First, where work preparing for Budget 2019 is covering the same ground as the Living Standards
Dashboard, it is important to ensure that the relevant pieces of work within the Treasury are
using broadly consistent conceptual frameworks. Beyond this, however, it is important at the
level of specific indicators that common measures are used wherever possible so that genuine
measurement gaps can be clearly identified.
2.5 Other wellbeing work
There is a wide variety of work underway across the New Zealand Government that relates to
aspects of intergenerational wellbeing. The most significant work includes Statistics New Zealand’s
project to develop a sustainable development measurement framework for New Zealand. This
work is framed around the Conference of European Statisticians capital stocks model, which aligns
well with the focus of the Living Standards Framework on the four capitals. Given this, it will be
essential that work on the Living Standards Dashboard is closely coordinated with development
of both the overall framework used by Statistics New Zealand and the indicators that populate it.
Other relevant pieces of work include:
Child wellbeing strategy (DPMC)
Lifetime child wellbeing model (Oranga Tamariki)
Social Investment Agency wellbeing work programme (SIA)
The Social Report (Ministry of Social Development), and
SDG reporting (Ministry of Foreign Affairs and Trade and Statistics New Zealand).
Treasury Living Standards Dashboard: Monitoring Intergenerational Wellbeing 33 CONCEPTUAL FRAMEWORK
In order to make any progress in measuring something, it is necessary to be clear about exactly
what is to be measured. The Living Standards Dashboard is intended to provide information to
Treasury decision-makers about intergenerational wellbeing to inform medium-term strategy
and policy-making. It is thus necessary to have a clear understanding of what is meant by
intergenerational wellbeing and to establish the different concepts that will need to be measured
for the Living Standards Dashboard to provide a clear picture of it. A conceptual framework
addresses these issues and serves to ground the measurement proposal in a clear framework
consistent with the best available scientific evidence and with economic theory.
3.1 The Living Standards Framework
The Living Standards Framework is how the Treasury frames its thinking about intergenerational
wellbeing. It is intended to put sustainable, intergenerational wellbeing at the core of the
Treasury’s advice across its different functions, including economic policy advice, analysis of
governmental expenditure and long-term management of New Zealand’s asset stock. In the
language of the State Sector Act (1988), the health of the four capitals is a way of assessing how
well agencies are delivering their “stewardship role” for New Zealand public policy.
Figure 1. The Living Standards Framework
The Four Capitals
Intergenerational wellbeing relies on the growth, distribution, and sustainability of the Four Capitals. The Capitals are interdependent and
work together to support wellbeing. The Crown-Māori relationship is integral to all four capitals. The LSF is being continually developed and
the next iteration of the framework will consider the role of culture, including Māori culture, as part of the capitals approach in more detail.
Natural Capital Human Capital
This refers to all aspects of the natural environment This encompasses people’s skills, knowledge and
needed to support life and human activity. It includes physical and mental health. These are the things
land, soil, water, plants and animals, as well as which enable people to participate fully in work, study,
minerals and energy resources. recreation and in society more broadly.
Financial /
Social Capital Physical Capital
This describes the norms and values that underpin This includes things like houses, roads, buildings,
society. It includes things like trust, the rule of law, hospitals, factories, equipment and vehicles. These
the Crown-Māori relationship, cultural identity, and are the things which make up the country’s physical
the connections between people and communities. and financial assets which have a direct role in
supporting incomes and material living conditions.
Source: Treasury, 2018
The Living Standards Framework (Figure 1 above) starts with a definition of intergenerational
wellbeing, based on the Organization for Economic Cooperation and Development’s
(OECD’s) How’s Life? analysis. Four capital stocks are used as a way to organise indicators of
intergenerational wellbeing, emphasising the Treasury’s medium-term focus on managing
New Zealand’s assets. However, although consistent with the OECD framework, the model of
the Living Standards Framework presented in Figure 1 represents only part of the broader OECD
conceptual framework. This reflects the Treasury’s core role as guardian of the New Zealand
Government’s asset stock, and is useful for communicating the broad purpose of the Living
Standards Framework, but is too narrow to provide an effective model for measurement. In order
to populate a meaningful Living Standards Dashboard it is necessary to flesh out the capital stocks
model that underpins the Living Standards Framework to identify all of the key components that
need to be measured.
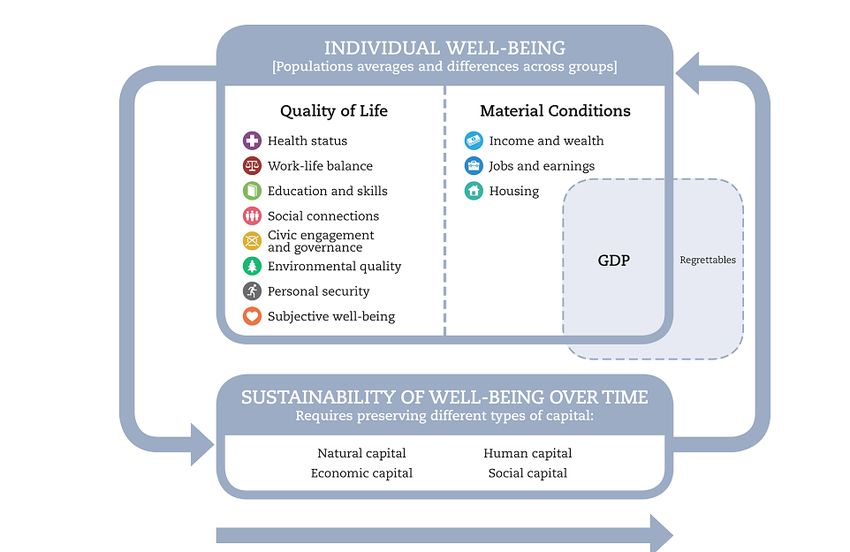
Treasury Living Standards Dashboard: Monitoring Intergenerational Wellbeing 43.2 The OECD/Better Life model
The Living Standards Framework is based on the OECD How’s Life?/Better Life model, although
it emphasises the four capitals heavily relative to the full OECD model. To flesh the capital stocks
model out fully, it is useful to consider the full OECD model. Figure 2 below illustrates the OECD
conceptual model of intergenerational wellbeing. At the core of the model is a fundamental
distinction between “here and now” and the future. Individual wellbeing in the OECD model
relates to the “here and now”: it captures the flow of current wellbeing experienced by people.
It is concerned with outcomes that are, in some sense, of intrinsic value in enabling people to
pursue the sorts of lives they have reason to value, rather than focusing on goals with a more
instrumental focus.
By individual wellbeing, the OECD does not mean to imply that wellbeing is a reductively
individualistic concept, but simply that wellbeing is something that people experience. The OECD
model of individual wellbeing specifically includes aspects related to the social context in which
people are embedded. Measuring wellbeing, in the OECD framework, involves looking not only
at the level of valued outcomes, but also at the distribution both across the population as a
whole and also across different sub-populations such as age, sex or ethnicity. Finally, it should be
noted that current wellbeing is multidimensional. It includes some aspects that relate to market
outcomes (material conditions) – income and wealth, jobs and earnings and housing – but also
a range of outcomes that go beyond what is traded in the market (quality of life) – health status,
work-life balance, education and skills, social connections, civic engagement and governance,
environmental quality, personal security and subjective wellbeing.
Figure 2. The OECD approach to measuring wellbeing
Source: OECD, 2013
The second crucial element of the OECD framework relates to the sustainability of wellbeing over
time. This focuses on preserving the levels of the four capital stocks used to produce wellbeing
outcomes: natural capital, human capital, economic capital and social capital. These capital stocks
should be thought of as capital in the sense that they are resources that are capable of storing
value, and which create a stream of benefits over time. However, the capital stocks are not
assumed to produce benefits independently of each other in the OECD model. Instead, the model
treats the capital stocks as factors of production used jointly to produce wellbeing outcomes.
Each of the dimensions of individual wellbeing is the result of all of the different capital stocks.
Investments in the capital stocks will result in the levels of the relevant stocks increasing, while
depreciation, resource depletion and pollution or waste may result in capital stock levels declining.
Treasury Living Standards Dashboard: Monitoring Intergenerational Wellbeing 5The circular arrows connecting the capital stock to wellbeing represent the use of resources in
production (the right hand side of Figure 2) and investment in the capital stocks (the left hand side
of Figure 2).
The OECD framework as presented in Figure 2 also highlights some of the classic criticisms of
gross domestic product (GDP) as a measure of wellbeing. In particular, there may be expenditure
that contributes to GDP, but which represents a net negative impact on wellbeing (regrettables).
However, this serves primarily an illustrative function rather than representing a core part of the
framework requiring measurement.
The specific domains included in current wellbeing and the choice of the four capitals
included under the sustainability section of the OECD framework are drawn primarily from
the recommendations of the report of the Commission on the Measurement of Economic
Performance and Social Progress (Fitoussi, Sen, & Stiglitz, 2009), more commonly referred to as
the Sen/Stiglitz/Fitoussi Commission.
3.3 The economic model
One of the main strengths of the OECD wellbeing framework is that, like the System of National
Accounts, it is grounded in a coherent economic model. This has three main advantages. First, it
imposes a set of constraints on the OECD framework by providing a clear set of parameters about
what should be included or excluded from the model and where different concepts fit. Without
a framework of this sort there is a risk that attempts to add fundamentally different things or
incorporating useful concepts in the wrong place can undermine the framework as a measure
of wellbeing. This is almost certainly part of the reason why many early attempts to produce
wellbeing indices historically underperformed GDP as a measure of people’s wellbeing (Delhey &
Kroll, 2013).
A second advantage of basing the measurement framework off an economic model is that it can
help in applying the framework to policy issues. Measurement of wellbeing is not an end in itself,
but a means of improving the quality of policy advice. By formalising the relationship between
different parts of the measurement framework, an economic model can help to identify trade-offs,
synergies or causal relationships between different parts of the measurement framework that may
be relevant to policy.
The final advantage of grounding wellbeing measurement in an economic model lies in the ability
to integrate the wellbeing measures with existing economic reporting. The System of National
Accounts is grounded on concepts and measures derived from economic theory. Because of
this it is possible to link the Treasury’s economic reporting back to the core concepts of the
underlying economic model. By choosing to measure intergenerational wellbeing through existing
economic frameworks rather than starting again from scratch, reporting on current wellbeing
and sustainability can be linked to the same set of core concepts. This both helps avoid double-
counting between the wider sphere of wellbeing and traditional economic reporting as well as
making it clear how the concepts used in the wellbeing framework relate to existing measures.
At the heart of the capital stocks model of wellbeing (used by the OECD) is the distinction between
current (individual) wellbeing and the four capital stocks that underpin future wellbeing. This
distinction is grounded in a simple economic model with both an aggregate production function
using both capital and labour to produce an undifferentiated output. A utility function accounts
for how output affects the utility of people as it is consumed. The United Nations Economic
Commission for Europe (UNECE) (2014) identifies this simple model of wellbeing and the economy
with the so-called Solow growth model (Solow, 1956).
In its original formulation, the Solow growth model sets aggregate income (GDP) as a function of
produced capital and labour, with technology (productivity) acting as a multiplier on the combined
effect of capital and labour. Capital depreciates over time and increases with investment,
while utility is a function of consumption. Solow’s main point in the paper was that, given that
consumption plus investment must be equal to total output, an economy will reach an equilibrium
level of total income where investment is equal to depreciation on the total capital stock.
Consequently, long-term economic growth must be driven by technology/productivity rather than
simply by capital accumulation.
Treasury Living Standards Dashboard: Monitoring Intergenerational Wellbeing 6In the context of measuring intergenerational wellbeing, the main value of the Solow growth
model is that it emphasises the distinction between production and the capital stocks on one
hand, and consumption/utility on the other. However, in its original form, this approach is
relatively narrow. In discussing the capital stocks model of sustainable development, UNECE
notes that the Solow model only considers produced capital and undifferentiated labour on the
production side and only economic output as measured by GDP on the consumption/utility side.
However, it is relatively easy to expand the model by adding in additional capital stocks to the
production function, and by adding other dimensions of human wellbeing to the utility function.
This is, in effect, the route taken by Kenneth Arrow and others (Arrow, Dasgupta, Goulder,
Mumford, & Olsen, 2012) in their inclusive wealth model.
The Arrow et al. model focuses explicitly on intergenerational wellbeing and is intended to
support the calculation of a monetary value for all relevant capital stocks. In particular, the Arrow
et al. model identifies produced, natural and human capital as well as changes in multifactor
productivity as the main drivers of human wellbeing. The capital stocks are collectively described
as “comprehensive wealth” in order to emphasise that the intent of the model is to build on
existing economic frameworks by adopting a more comprehensive set of capital stocks than simply
those traded in the market. This model is represented in Figure 3 below from the United Nations
Inclusive Wealth Report (UNU-IHDP & UNEP, 2014). However, a more formal presentation of the
model is available in Arrow et al. (2012).
Figure 3. The inclusive wealth framework
Sources: UNU-IHDP & UNEP, 2014
Three main points should be taken from the diagram in Figure 3. The first of these is the broad
similarity between the inclusive wealth framework and the OECD framework in Figure 2.
Both make the same distinction between human/individual wellbeing and productive resources
(the four capital stocks). Similarly, both identify flows from the capital stocks to produce wellbeing,
and investments flowing back to the capitals. Where the OECD framework places more emphasis
on the dimensions of human wellbeing, the inclusive wealth framework elaborates more on how
the capital stocks are used to produce wellbeing. However, this distinction is more apparent than
real. Both diagrams represent the same underlying model with emphasis on different parts of it
reflecting the available data and communication goals in each case.
The second point to take from Figure 3 is that there are potentially some important elements of
the capital stocks framework that will need to be measured, and which are not visible in the core
OECD model. The most significant of these is characterised in Figure 3 as “economic production
processes” and reflects the fact that the efficiency with which the capital stocks are used is crucial
to the human wellbeing produced, not just the level of the capital stocks. However, it is also
worth noting that the model set out in Figure 3 does not directly address issues relating to the
distribution of capital stocks or wellbeing, although this is a key part of the OECD model.
Treasury Living Standards Dashboard: Monitoring Intergenerational Wellbeing 7In describing the Living Standards Framework, the Secretary to the Treasury has asserted that
it represents “standard economics”. The third main point to take from Figure 3 is an illustration
of what this could mean. In essence, what the capital stocks model does is simply incorporate a
set of important elements that are not traded in the market, but which undeniably matter, into
a standard economic model. These include both the productive capital stocks not traded in the
market (social capital and much of natural capital) and flows of human wellbeing from sources
other than market consumption. Traditionally, these factors have not been formally represented
in the economic models in order to keep the models simple enough to be analytically tractable
and because non-market outcomes have been a challenge to measure in practice, not because the
issues in question fall outside the scope of economic inquiry. However, the price of simplicity has
been that non-market issues are often dealt with as peripheral to core economic analysis or in an
ad-hoc way.
Incorporating the main non-market elements into a standard economic model raises both
measurement and technical challenges. However, there has been substantial progress on both
fronts over the past two decades. In particular, the measurement of human wellbeing is now
underpinned by a significant body of empirical evidence (Box 1), and many of the technical
challenges are proving to be more tractable than anticipated. In particular, developments in
welfare economics have offered new methods for identifying shadow prices for non-market
outcomes (Benjamin, Heffetz, Kimball, & Szembrot, 2014; Fujiwara, 2013), that make dealing with
the trade-offs involved between market and non-market outcomes more practicable than was
previously the case.
3.4 Adapting the OECD model to New Zealand
The OECD wellbeing model uses a coherent capital stocks model to evaluate intergenerational
wellbeing, and is widely used internationally. Despite this, it is not a perfect fit for the New
Zealand Treasury. In particular, the OECD model fails to consider explicitly some aspects of
current wellbeing that are of great salience to New Zealanders – such as culture – and is framed
in language that may hinder communication with some New Zealand communities. For example,
the phrase “individual wellbeing” may be seen to suggest a reductive atomistic view of human
wellbeing that does not align well with the views of some New Zealand communities. In fact, the
fairly clear intent of the OECD is simply to reinforce the view that wellbeing is something that
is experienced ultimately by people, but from a communications perspective the language is
problematic.
Beyond the issues of broad content and communication, there is a more technical issue
relating to data availability. Where the OECD’s measurement framework is guided by the body
of internationally comparable indicators available to the OECD, for New Zealand it is possible
to supplement these with domestic data sources that may provide a more detailed picture of
outcomes in New Zealand on some topics. Another set of technical issues fall out of the underlying
economic models discussed in the previous section. In particular, it is essential that productivity
be included in any measurement framework based on the capital stocks model, and issues of
trans-border flows are important as well. Finally, while the OECD wellbeing framework is intended
primarily to support broad cross-country comparisons of aggregate outcomes, the model used to
inform the Living Standards Framework will need to be applied both to the Treasury’s medium-
term strategic policy advice and to meso- and micro-level policy issues related to advice on
specific policy interventions.
Figure 4 below presents an attempt to flesh out the Living Standards Framework to incorporate
the main features of the capital stocks model that will need to be measured for the Living
Standards Dashboard. This model starts with the Treasury Whāriki diagram that captures the four
capital stocks. However, it builds out from this to capture the main features of the OECD model
(Figure 2) and key parts of the inclusive wealth framework (Figure 3). In particular, Figure 4 adds
to the Whāriki current wellbeing, multifactor productivity, and the flows between different parts
of the model. It also highlights the role of contextual factors such as culture and demographics in
shaping wellbeing and net claims on the resources of the rest of the world.
Treasury Living Standards Dashboard: Monitoring Intergenerational Wellbeing 8Figure 4 identifies four main areas that any credible attempt to measure intergenerational
wellbeing will have to cover. These are future wellbeing, current wellbeing, multifactor
productivity and net claims on the rest of the world. The four capitals are at the core of the
measures related to future wellbeing. Intergenerational wellbeing is sustainable if the level of
the capital stocks is not declining. While produced capital and natural capital decline with use
owing to depreciation and resource depletion, human and social capital do not and, under some
circumstances, may even increase with use. Despite this, it is useful to think of all four capitals as
similar in the sense that they represent stocks of productive resources that are used to produce
human wellbeing. An important adjunct to this is that the capitals produce wellbeing outcomes
jointly: in general, it is not possible to associate an aspect of current wellbeing with just a single
capital stock.
Figure 4. A conceptual framework for the Living Standards Dashboard
Current wellbeing
Life Satisfaction
Market outcomes Non-market outcomes
• Material standard of living • Health
• Housing • Knowledge and skills
• Jobs and earnings • Leisure and recreation
• Cultural Identity / Ūkaipōtanga
• Safety
• Environmental quality
• Civic engagement and governance
• Social connections
• Self and aspirations
Affect current wellbeing directly Multifactor Productivity
Context
Demographics Use of capital stocks
Investment in
Culture in production of
capital stocks
Innovation wellbeing outcomes
etc…
Affect capital accumulation
Future wellbeing
The Four Capitals
Intergenerational wellbeing relies on the growth, distribution, and sustainability of the Four Capitals. The
Capitals are interdependent and work together to support wellbeing. Net claims on rest of world
Natural Capital Human Capital Net flows to
rest of world
This refers to all aspects of the natural This encompasses people’s skills,
environment needed to support life and knowledge and physical and mental health.
human activity. It includes land, soil, water, These are the things which enable people
plants and animals, as well as minerals and to participate fully in work, study,
energy resources. recreation and in society more broadly.
Social Capital Produced Capital
This describes the norms and values that This includes things like houses, roads,
underpin society. It includes things like buildings, hospitals, factories, equipment
trust, the rule of law, the Crown-Māori and investments. These are the things which
relationship, cultural identity, and the make up the country’s produced assets
connections between people and which have a direct role in supporting
communities. incomes and material living conditions.
Where the four capitals measure the stock of resources used to produce wellbeing, current
wellbeing measures what those resources produce: the wellbeing of New Zealanders.
Current (human) wellbeing is something that people experience, and is inherently
multidimensional. The dimensions of current wellbeing listed in Figure 4 are based on both the
OECD How’s Life? framework and the New Zealand Social Report, which are largely consistent with
each other and which together to provide consistency with international standards and alignment
with New Zealanders’ values. Section 3.5 elaborates on some of the issues around incorporating
a New Zealand perspective into the OECD framework. A distinction is made between market
outcomes, which cover those aspects of wellbeing relating to market transactions, and non‑market
outcomes, which relates to other aspects of quality of life. To gain a meaningful picture of current
wellbeing it is necessary not only to know the level of different outcomes, but also the distribution
of outcomes across the population.
Treasury Living Standards Dashboard: Monitoring Intergenerational Wellbeing 9Box 1. The dimensions of current wellbeing
While there may be some debate about how a country’s assets should be divided among
different categories of capital for the purposes of measuring comprehensive wealth
(eg, Dalziel & Saunders, 2014), the importance of natural, social, human and produced capital
is relatively widely accepted. In contrast, the dimensions of current wellbeing have in the past
been the subject of much more vigorous debate. At the most basic level there is a conceptual
and philosophical debate about what current wellbeing actually “is”. Sen (1993) argues that
wellbeing is the ability of people to live the kind of lives they have reason to value, and that
the dimensions of measurement are the “capabilities” that provide people with this kind
of control over their lives. At the other extreme, Layard (2006) takes an explicitly utilitarian
approach to wellbeing and defines it as the experience of good mental states such as life
satisfaction. Empirically, however, the choice of philosophical approach makes little difference
and there is strong evidence that wellbeing has a relatively coherent and enduring core
structure.
The lists of capabilities that comprise wellbeing from a perspective grounded in Sen
(eg, Fitoussi et al, 2009; OECD, 2011) map very closely onto the main determinants of life
satisfaction (Boarini, Comola, Smith, Manchin, & De Keulenaer, 2012). Public consultations in
widely varying parts of the world tend to come up with very similar sets of outcome domains.
This is perhaps not surprising where there is clear cross-fertilisation from a high-profile
international framework to a domestic framework such as in the case of Israel’s indicators of
“well-being, resilience, and sustainability” (OECD, 2015a). However, there are also very strong
similarities between outcome frameworks developed entirely independently (Barrington-
Leigh & Escande, 2018). The New Zealand Social Report (Ministry of Social Development,
2003) and Big Cities Quality of Life indicators (Quality of Life Project, 2007) both use outcome
frameworks almost identical to that developed by the OECD (2011) despite entirely separate
origins (Figure 5). Indeed, the only really substantive differences between the two frameworks
are the addition of a cultural identity domain in the Social Report, that housing is treated
within the economic standard of living domain in the Social Report rather than separately
(although the housing indicators in each report are very similar), and the Social Report has no
subjective wellbeing domain (although life satisfaction measures have regularly been included
in the conclusion of the Social Report).
Figure 5. How’s Life? (OECD, 2011) and Social Report (MSD, 2003) wellbeing frameworks
Treasury Living Standards Dashboard: Monitoring Intergenerational Wellbeing 10In addition to the views of experts, public consultation and evidence from life satisfaction,
there is also solid behavioural evidence that the wellbeing domains represented in the OECD
and similar models capture the important elements of wellbeing and add significant value to
more traditional measures of progress such as GDP. Delhey and Kroll (2013) show that the
OECD Better Life Index (BLI), which includes all of the dimensions of current wellbeing in the
OECD framework, significantly out-performs both real gross national income (GNI) per capita,
the UN’s Human Development Index and a range of other indices of progress in terms of
predicting average life satisfaction. The key distinguishing features of the BLI when compared
with the other indices considered are the scope of the wellbeing domains (which provide a
relatively comprehensive description of current wellbeing) and the fact that the BLI focuses
explicitly on measuring current wellbeing rather than introducing other ad-hoc adjustments.
The link between measures of progress using the full set of OECD domains and life satisfaction
is interesting because life satisfaction is strongly linked to people’s actual behaviour.
George Ward (2015), for example, shows that changes in life satisfaction predict changes in
the vote share of the incumbent government in EU countries, and that this relationship is
much stronger for life satisfaction than for economic growth, unemployment or inflation.
Grimes, Oxley, and Tarrant (2012) also find that life satisfaction explains real-world behavioural
choices using migration as an example, while Fleurbaey and Schwandt (2015) reach a similar
conclusion on the relevance of life satisfaction from survey data.
Multifactor productivity connects the four capitals to current wellbeing. While the four capitals
capture the most significant resource stocks used to produce wellbeing, the efficiency with which
these stocks are used in production processes is also of fundamental importance. If we are able
to use the capital stocks more efficiently, then this allows for higher levels of current wellbeing
consistent with sustainability. It is important to note that the idea of multifactor productivity does
not necessarily imply a single productivity measure. It is quite possible that New Zealand has
higher productivity with respect to some dimensions of current wellbeing than others.
The final element of the framework that will require measurement is net claims on the rest of
the world. This recognises that the productive resources available to New Zealand are not only a
function of those within New Zealand, but also the claims New Zealanders have on the resources
of other countries and the claims people in other countries have over the resources of New
Zealanders. Much of this can be captured by measuring net financial capital, but environmental
spill-overs from one country to another also need to be included.
An important element of the Living Standards Framework not explicitly reflected in Figure 4
is the importance of looking at the distribution of wellbeing and the capital stocks. We are
interested not only in the level of outcomes achieved in all of the areas set out in Figure 4,
but also in the distribution of outcomes. This will be of particular importance when the Living
Standards Dashboard is used in a policy context, and is also reflected in the choice of indicators
(see Section 4).
In considering Figure 4, it is worth highlighting two significant differences between the proposal
here and the Treasury’s existing model of the Living Standards Framework. Although relatively
minor, both are significant. First, Figure 4 focuses on produced capital where the Living Standards
Framework discusses physical and financial capital. As discussed in Section 4.2, produced capital
includes physical capital and knowledge assets such as computer programs or intellectual
property. Moving from physical capital to produced capital better aligns the Living Standards
Framework with the System of National Accounts and standard economic terminology. As part
of this adjustment, financial capital is moved from one of the four capitals to net claims on the
rest of the world (see Section 4.4). The other main change is in the treatment of life satisfaction.
Where the OECD includes life satisfaction as an indicator of subjective wellbeing (alongside other
subjective wellbeing measures), Figure 4 places life satisfaction as a proxy measure for overall
current wellbeing. Reflecting both concerns around conceptualising wellbeing purely in subjective
terms (eg, Sen, 1993) and the limitations of the measure, life satisfaction is used in this way only
as a complement rather than a substitute for measuring the individual domains of wellbeing
Treasury Living Standards Dashboard: Monitoring Intergenerational Wellbeing 11Box 2. Indicators of wellbeing and the capital stocks
The approach to developing a Living Standards Dashboard proposed here is based around the use
of a suite of indicators to track changes in the level and distribution of the main elements of the
Living Standards Framework. This reflects the fact that many elements of wellbeing as well as some
capital stocks are difficult to measure directly with a continuous scalar metric. Instead, we are
forced to rely on indicators of the relevant concept.
Indicators are statistics that provide information on some aspect of a particular phenomenon when
a comprehensive measure of the phenomenon itself is unavailable or simply not possible. In the
case of the Living Standards Dashboard, indicators are statistics that capture some important piece
of information about a key part of the framework (eg, material standard of living, social capital).
In a few cases – such as the use of net fixed assets as a measure of produced capital – the indicator
might be very close to providing a good scalar and continuous measure of the underlying concept.
In most cases, though, this is not true.
Generalised trust, for example, is a good indicator of social capital in that a high level of generalised
trust is strong evidence of a high level of social capital, and changes in the level of social trust
are likely to reflect changes in the level of social capital. However, we should be cautious about
interpreting the generalised trust indicator (the mean score on a 0–10 scale for New Zealand)
as a comprehensive measure of the quantity of social capital in New Zealand. For example, if
New Zealand has a mean level of trust 1 point higher than another country, we could take this as
evidence that New Zealand has a higher level of social capital, but not that New Zealand has exactly
10% more social capital than the comparison country.
Another point worth emphasising with respect to indicators is that an indicator reflects some
concept within a broader framework: it is not just a simple descriptive statistic. In the case of the
Living Standards Framework, indicators capture some aspect of current wellbeing, the capital
stocks, multifactor productivity or net claims on the rest of the world. Other statistics – such as
the age structure of the New Zealand population – may capture important contextual information
that is relevant to interpreting the indicators in the Living Standards Dashboard, but these are not
themselves indicators of wellbeing.
Finally, it is important to recognise that indicators are just that: indicators. They are not in
themselves the outcome that is being targeted. This is why setting policy targets for indicators
should be undertaken with great care, if at all. Once a target is set, the institutional incentives
are often to pursue the target indicator rather than the underlying outcome that the indicator is
meant to capture. This can have perverse incentives if it is possible to improve the indicator directly
without altering the underlying outcome.
3.5 What does a wellbeing framework add to evaluating policy
proposals?
The ultimate purpose of the Living Standards Dashboard is to support the Treasury’s policy
advice and medium-term strategy. While there is an obvious value in monitoring the resources
that underpin the wellbeing of New Zealanders and the levels of current wellbeing, it may be
less obvious as to how a wellbeing framework can be used to support better policy-making at a
practical day-to-day level.
Boarini and Smith (2014; see also OECD, 2015a) set out a framework for thinking about the
application of a wellbeing framework to policy that identifies three broad roles that such a
framework can play. These are: alignment, analysis and accountability. Alignment focuses on the
role that an explicit wellbeing framework can play in supporting different agencies in aligning their
work with each other and with broader government priorities. By providing a common language
and frame of reference for discussing the desired outcomes of policy, a wellbeing framework can
assist in identifying externalities and issues that spill over from one policy silo to another.
Treasury Living Standards Dashboard: Monitoring Intergenerational Wellbeing 12A second way in which a wellbeing framework can be used to assist decision-making is
through the analysis of the impact of policies. At heart, most policy analysis is concerned with
identifying the effect of different proposed policy options on the wellbeing of the population.
An explicit wellbeing framework helps identify the outcomes that policy targets and supports
the measurement of outcomes. While the Living Standards Dashboard will be focused primarily
on measuring wellbeing outcomes and the capital stocks at a national level, a key focus for the
application of the refreshed Living Standards Framework to policy will be to support decision-
making around the budget cycle in the evaluation of proposals for new expenditure, the review
of existing baseline expenditure and in the context of regulatory policy. This will mean applying
the wellbeing framework to analyse the impact of policy proposals on wellbeing at the meso and
micro levels, and supporting this with relevant evidence of the policy impact across the different
elements of the wellbeing framework.
An explicit wellbeing framework also supports government accountability. This occurs at two
levels. First, national monitoring of the wellbeing and capital stocks can help the public assess
whether the country is moving in the right direction. This is supported by incorporating elements
of the framework, such as estimates of the four capital stocks, in formal accountability documents
such as the Treasury’s Investment Statement. At an agency level the framework itself can support
accountability. Although many of the wellbeing domains and capital stocks are too generic to be of
direct use as an accountability metric, they provide a common framework for agencies to anchor
their performance measures to.
Beyond the alignment/analysis/accountability framing that focuses on the types of use to which
a wellbeing framework can be put, it is also useful to identify the main policy issues that a
framework can assist analysts in thinking about. The capital stocks model, on which the Living
Standards Framework is based, highlights two key types of question:
Does the proposed policy improve wellbeing now (current wellbeing) or in the future (capital
stocks)?
What are the spill-overs from the policy to outcomes other than the primary goal of the
policy?
The first question directs the analyst’s attention to the issue of whether a policy is aimed at
addressing an issue affecting people’s current wellbeing or whether it is aimed at increasing
the stock of resources for the future. In the first case, the policy is conceptually concerned with
current consumption, while in the second case, the policy is a form of saving. While many policy
initiatives will have elements of both goals, it cannot be assumed that a policy that achieves
its goal in one sense will necessarily have good outcomes in the other, and identifying these
trade‑offs is important.
A capital stocks model also directs analysts’ attention towards spill-overs into outcomes other than
the primary target of a policy. Policy interventions may have synergies, where a policy targeted at
one dimension of wellbeing – such as health – may have spill-over effects on other dimensions of
wellbeing (eg, jobs and earnings) or impact on the capital stocks (eg, human capital). Alternatively,
a policy that has positive outcomes in one area – such as improving current income – may have
negative effects in other dimensions of wellbeing or on the capital stocks (eg, natural capital).
One issue that inevitably arises in thinking about the trade-offs between different parts of a model
such as the Living Standards Framework is the issue of valuation. How should we decide between
a policy that improves health and jobs, and one that improves education and leisure? Traditional
cost-benefit analysis (CBA) tools are helpful where the benefits are fully captured by market prices
and quantities, and provide a useful framework for thinking about inter-temporal trade-offs.
However, many of the policy impacts of interest will relate to non-market outcomes and will not
be able to be assessed through traditional CBA. Recent developments in valuation techniques for
non-market outcomes, including those based on life satisfaction (Fujiwara, 2013; OECD, 2013a)
and choice experiments (Benjamin et al., 2014) offer a useful way forward here.
Treasury Living Standards Dashboard: Monitoring Intergenerational Wellbeing 133.6 New Zealand issues
As discussed in the previous section, adapting the OECD wellbeing framework to New Zealand
is not simply a matter of finding New Zealand data for all of the concepts to be measured. There
are also some changes required to the framework itself. In fact, there are three broad classes of
issue involved with adapting the OECD framework to a New Zealand context, and these need to
be considered in some depth as the issues raised are important. In particular, there is obviously
a potential for tension between adapting the framework so that it fits New Zealand better and
international comparability. The three main issues that need to be considered are:
Substantive: Are there any substantive elements of current wellbeing or any capital stocks
that would need to be included in a New Zealand framework for intergenerational wellbeing
and which are not in the OECD framework (and anything that should be dropped from the
OECD framework)?
Communications: Are there any changes to the OECD framework that need to be made in
order to communicate the intended concept more effectively to a New Zealand audience
where the concept being measured does not change?
Technical: Are there any areas where the choice of indicator used to measure a dimension
of current wellbeing or a capital stock might be different if the focus was on using the best
available New Zealand data rather than prioritising international comparability?
Substantive issues: The place of culture
Although the OECD wellbeing framework is intended to be applicable across all the OECD member
states (and to be grounded in the universal features of human wellbeing), it is reasonable to
question whether there are aspects of wellbeing relevant to New Zealand that might not be well
reflected in the OECD framework. At one level the OECD framework performs relatively well
in a New Zealand context. An analysis of the How’s Life? wellbeing domains shows that they
are all important drivers of the life satisfaction of New Zealanders (Jia & Smith, 2016). More
substantively, the Social Report (MSD, 2003, 2007) was developed to measure wellbeing in
New Zealand and underwent substantial public and expert consultation in New Zealand on the
measurement domains early on in its development (MSD, 2003), and has also been tested against
subjective wellbeing measures (Brown, Woolf, & Smith, 2012). Although the Social Report does
not explicitly consider some elements of intergenerational wellbeing, such as the capital stocks, as
a description of current wellbeing the Social Report aligns very closely with the OECD framework.
Despite generally very close alignment between the New Zealand-centred view of wellbeing
to be found in the Social Report and the OECD framework, there is one very substantial area of
difference. Where the Social Report identifies cultural identity as one of the 10 core dimensions
of wellbeing that it measures, the OECD has no corresponding dimension. The importance of
culture as an issue is reflected in the discussion papers prepared by the Treasury on the Living
Standards Framework which identify culture as an issue (King, Huseynli, & MacGibbon, 2018) and
under development (Morrissey, forthcoming). As both a bicultural country (reflecting the Treaty of
Waitangi) and a multicultural country (with an immigrant background), issues of culture, belonging
and identity are of fundamental importance if a wellbeing framework is to work in New Zealand.
Culture can potentially impact on intergenerational wellbeing in a number of different ways. It can:
affect measurement (culture may affect how people respond to self-report indicators)
be a distinct dimension of current wellbeing (cultural identity as a domain of current
wellbeing)
be a way of classifying capital stocks (cultural capital), and
be a driver of wellbeing (culture may affect people’s wellbeing without itself being an aspect
of wellbeing).
As a measurement issue, culture is worth being aware of, but issues of potential cultural response
bias should not prevent the use of self-report indicators. The best available evidence suggests that
cultural response bias to self-report questions exists, but the effect is generally not large (Exton,
Smith, & Vandendriessche, 2015) and should not prevent self-report questions being used in many
circumstances.
Treasury Living Standards Dashboard: Monitoring Intergenerational Wellbeing 14You can also read