IOT MEASUREMENT AND APPLICATIONS - OECD DIGITAL ECONOMY PAPERS OCTOBER 2018 NO. 271 - IOT BUSINESS NEWS
←
→
Page content transcription
If your browser does not render page correctly, please read the page content below

IOT MEASUREMENT
AND APPLICATIONS
OECD DIGITAL ECONOMY
PAPERS
October 2018 No. 271
2 │ IOT MEASUREMENT AND APPLICATIONS

                                              Foreword

       This report was prepared by the Working Party on Communication Infrastructure and
       Services Policy (WPCISP) and the Working Party on Measurement of the Digital Economy
       (MADE). The report reviews different definitions of the Internet of Things (IoT) in view
       of an operational definition with corresponding subcategories for the CDEP work, and
       explores feasible ways to measure IoT and its implications for infrastructure and networks.
       It concludes by proposing a framework (i.e. taxonomy) of IoT for measurement purposes.
       This paper was approved and declassified by written procedure by the Committee on
       Digital Economy Policy on 27 September 2018 and was prepared for publication by the
       OECD Secretariat.
       This report was drafted by Alexia Gonzalez Fanfalone with contributions received by Pierre
       Montagnier and Sam Paltridge from the OECD Secretariat.
       This publication is a contribution to the OECD Going Digital project, which aims to
       provide policymakers with the tools they need to help their economies and societies prosper
       in an increasingly digital and data-driven world.
       For more information, visit www.oecd.org/going-digital.
       #GoingDigital

                                         Note to Delegations:
                  This document is also available on O.N.E. under the reference code:
                                DSTI/CDEP/CISP-MADE(2017)1/FINAL

This document, as well as any data and any map included herein, are without prejudice to the status of
or sovereignty over any territory, to the delimitation of international frontiers and boundaries and to the
name of any territory, city or area.
The statistical data for Israel are supplied by and under the responsibility of the relevant Israeli
authorities. The use of such data by the OECD is without prejudice to the status of the Golan Heights,
East Jerusalem and Israeli settlements in the West Bank under the terms of international law.

© OECD 2018

You can copy, download or print OECD content for your own use, and you can include excerpts from
OECD publications, databases and multimedia products in your own documents, presentations, blogs,
websites and teaching materials, provided that suitable acknowledgement of OECD as source and
copyright owner is given. All requests for commercial use and translation rights should be submitted to
rights@oecd.org.

                                                                             OECD DIGITAL ECONOMY PAPERS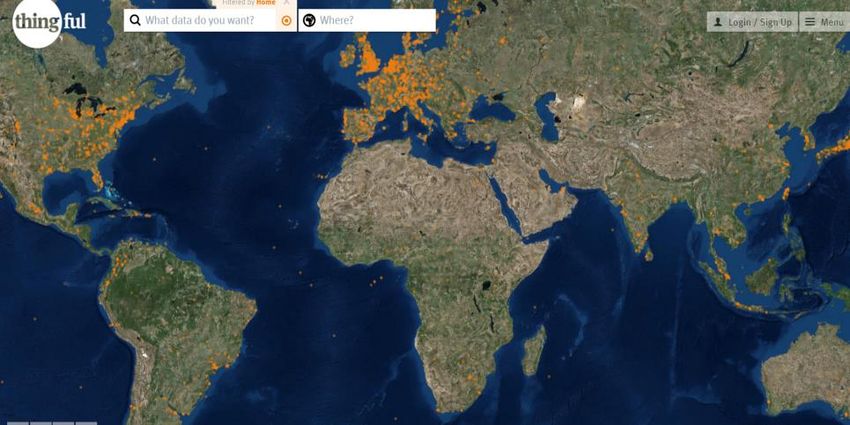
IOT MEASUREMENT AND APPLICATIONS                              │3

                                                             Table of contents

Foreword ................................................................................................................................................ 2
   EXECUTIVE SUMMARY ................................................................................................................. 5
IoT Measurement and Applications .................................................................................................... 6
1. Introduction ....................................................................................................................................... 6
2. Measurement questions/issues .......................................................................................................... 8
   2.1. Specific questions that arise with regards to presently used M2M metrics .................................. 9
3. What is IoT?..................................................................................................................................... 10
   3.1. OECD current working definition of IoT and M2M................................................................... 10
   3.2. Aspects to consider when defining and measuring IoT .............................................................. 15
4. Other IoT Definitions and current estimates of the size of IoT................................................... 17
   4.1. GSMA ......................................................................................................................................... 17
   4.2. The private sector........................................................................................................................ 17
   4.3. Telecommunication Authorities in OECD countries .................................................................. 19
   4.4. Other Government Agencies measuring IoT .............................................................................. 25
   4.5. ICT usage surveys in OECD countries ....................................................................................... 28
   4.6. Mapping IoT ............................................................................................................................... 30
   4.7. IoT and Robots: future measurement area .................................................................................. 33
   4.8. IoT and the Environment: M2M sensors and smart meters ........................................................ 33
5. Do some categories of IoT devices require prioritising in terms of measurement? .................. 35
   5.1. Will some IoT devices, such as automated vehicles, generate large increases in demands on
   infrastructure? .................................................................................................................................... 35
   5.2. What is needed in terms of infrastructure deployment (e.g. ITS, 5G)? ...................................... 40
6. Emerging regulatory and policy challenges related to the IoT highlighting the importance of
measurement ........................................................................................................................................ 45
7. Concluding remarks ........................................................................................................................ 46
   7.1. Suggested criteria for IoT measurement ..................................................................................... 46
   7.2. Proposal of an OECD definition and taxonomy of IoT .............................................................. 47
   7.3. Further measurement issues ........................................................................................................ 49
Annex A. Main outstanding questions/issues regarding IoT measurement ................................... 50
Annex B. Selected examples of other IoT Definitions ...................................................................... 52
Annex C. Detailed questions related to IoT in the ICT usage surveys (Household and Individuals,
Firms) ................................................................................................................................................... 54
References ............................................................................................................................................ 58

OECD DIGITAL ECONOMY PAPERS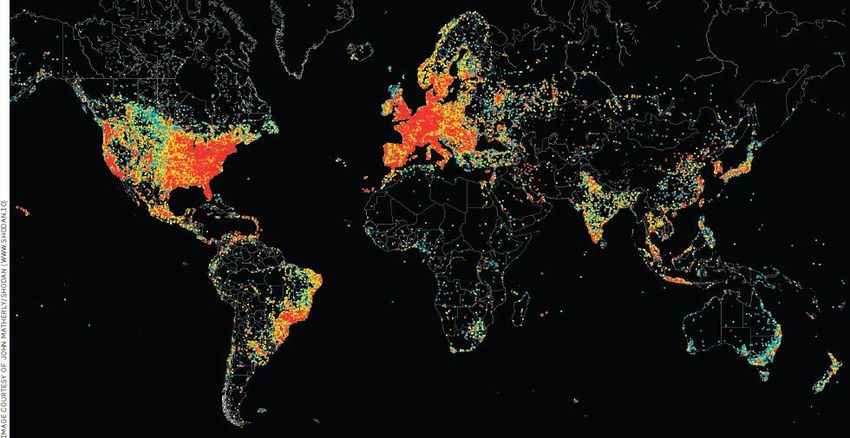
4 │ IOT MEASUREMENT AND APPLICATIONS
Tables
Table 1. United Kingdom telecommunication market: key statistics (selected indicators*) ................. 23
Table 2. The International Patent Classification (IPC)* subgroups of IoT Patent Families ................. 27
Table 3. IoT related question in the ICT usage survey questionnaires: selected recent examples for
households and individuals............................................................................................................ 28
Table 4. IoT related question in the ICT usage survey questionnaires: selected recent examples for
businesses* ..................................................................................................................................... 28
Table 5. Residential smart meter rollout in selected countries and regions .......................................... 34
Table 6. Comparison of LTE-M and LoRA technologies, Korea ......................................................... 43
Table A C.1. IoT related questions in the ICT usage survey questionnaires......................................... 54
Table A C.2. IoT related questions in the ICT usage survey questionnaires......................................... 55
Figures
Figure 1. IoT enabling environment ...................................................................................................... 11
Figure 2. Devices online per 100 inhabitants, top OECD countries ...................................................... 12
Figure 3. M2M/embedded mobile cellular subscriptions per 100 inhabitants ...................................... 13
Figure 4. Share of M2M SIM cards* over total SIMs in EU countries,** October 2016 ..................... 14
Figure 5. M2M connections per 100 inhabitants, GSMA data* for OECD Countries** ...................... 17
Figure 6. ARCEP’s components to be considered in the IoT ecosystem .............................................. 21
Figure 7. Market categorisation framework of IoT and data distribution in Japan ............................... 22
Figure 8. Monthly M2M data traffic per subscription (MB) in Sweden ............................................... 24
Figure 9. Monthly revenues per M2M subscription (USD) in Sweden and Norway ............................ 24
Figure 10. Top players in IoT, big data and quantum computing technologies, 2005-07 and 2010-12 25
Figure 11. Patents in new generation of ICT-related technologies, 2005-12 ........................................ 26
Figure 12. Ownership of Internet of Things devices in the UK 2016, by type ..................................... 29
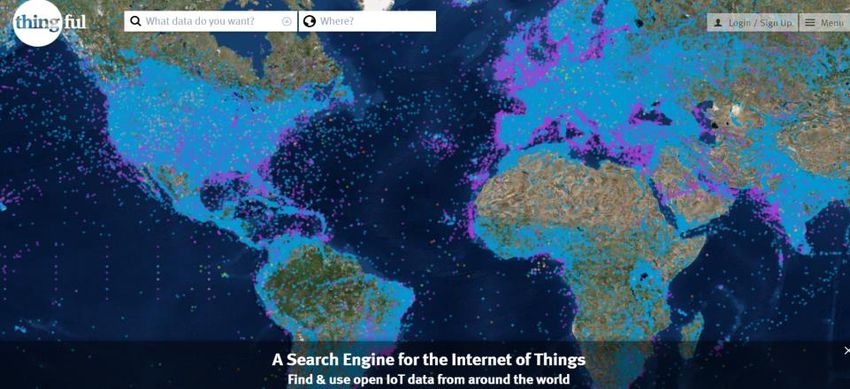
Figure 13. Thingful IoT Map................................................................................................................. 31
Figure 14. Thingful map of IoT home devices ...................................................................................... 31
Figure 15. IoTUK Nation "heat map" of IoT firms ............................................................................... 32
Figure 16. Shodan Map of the IoT ........................................................................................................ 32
Figure 17. Robot penetration OECD countries, 2015 ........................................................................... 33
Figure 18. On-board usage of data in connected Chevrolet vehicles .................................................... 36
Figure 19. Amount of data generated by an Autonomous Vehicle: Intel .............................................. 37
Figure 20. Levels of automation according to the Society of Automotive Engineers ........................... 38
Figure 21. Total Mobile Data Traffic offloaded to Wi-Fi Fixed Networks, CISCO ............................. 44
Figure 22. Proposed taxonomy of IoT for measurement purposes ........................................................ 48
OECD DIGITAL ECONOMY PAPERS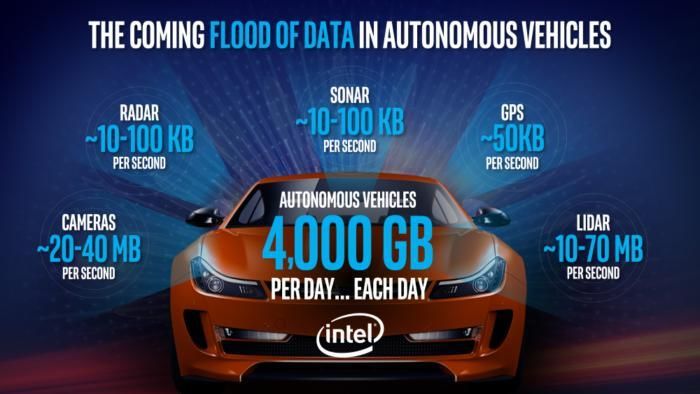
IOT MEASUREMENT AND APPLICATIONS         │5

                                     EXECUTIVE SUMMARY

       The Cancun Ministerial mandate on the Digital Economy highlighted the importance of
       developing IoT metrics to assess the effects of the IoT in different policy areas (OECD,
       2016[1]). Accordingly, this report reviews different definitions of IoT in view of
       establishing an operational definition for the CDEP work, and proposes a taxonomy for IoT
       measurement. The report also explores potential challenges for communication
       infrastructures due to the exponential growth of IoT devices through the application of
       connected and automated vehicles. This IoT application was chosen as the data
       transmission requirements of fully automated vehicles may have substantial implications
       for network infrastructure, and therefore may require prioritisation in terms of
       measurement.
       The report endorses the existing OECD working definition of IoT with the exclusion of
       devices that are already taken into account in OECD metrics (i.e. smartphones, tablets and
       PCs), and proposes to add subcategories for measurement purposes. The OECD
       overarching IoT definition would be, “The Internet of Things includes all devices and
       objects whose state can be altered via the Internet, with or without the active involvement
       of individuals. While connected objects may require the involvement of devices considered
       part of the “traditional Internet”, this definition excludes laptops, tablets and smartphones
       already accounted for in current OECD broadband metrics.”
       To better inform policy making, this report proposes a framework (taxonomy) with a
       breakdown of IoT into categories given that many connected devices will have different
       network requirements. For example, critical IoT applications such as remote surgery and
       automated vehicles will require high reliability and low latency connectivity, whereas
       Massive and disperse Machine-to-Machine (M2M) sensors used for agricultural
       applications may not be that sensitive to latency or network speeds.
       Within the IoT proposed measurement framework, the two main categories of IoT proposed
       are: Wide Area IoT, and Short Range IoT. The Wide Area IoT category includes devices
       connected through cellular technology as well as those connected through Low Power Wide
       Area Networks, whereas the Short Range IoT category includes devices using unlicensed
       spectrum with a typical range up to 100 metres. Within the category of Wide Area IoT, two
       subcategories are further suggested: 1) Massive M2M devices (e.g. sensors for agriculture
       or smart cities), and 2) Critical IoT applications (e.g. remote surgery applications, fully
       automated vehicles and other industrial robotics applications).

OECD DIGITAL ECONOMY PAPERS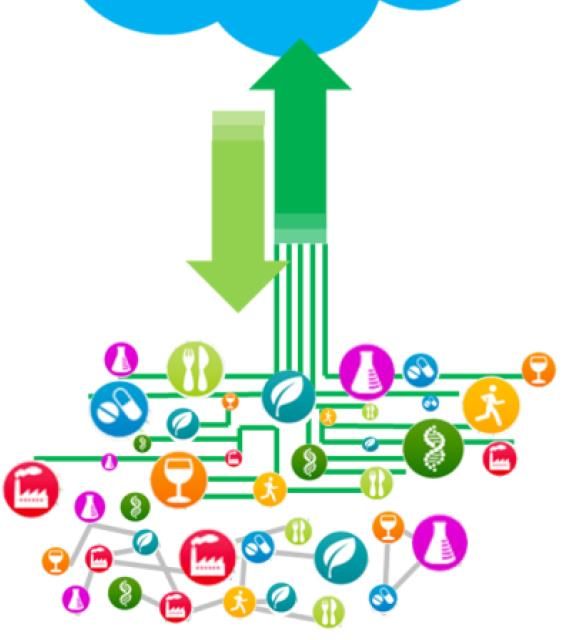
6 │ IOT MEASUREMENT AND APPLICATIONS

                          IoT Measurement and Applications

                                         1. Introduction

      The term Internet of Things (IoT) refers to the connection of an increasing number of
      devices and objects over time to the Internet. As highlighted in the Cancun Ministerial,
      following the convergence between fixed and mobile networks, and between
      telecommunication and broadcasting, the IoT represents the next step in convergence
      between ICTs and economies and societies on an unprecedented scale. It holds the promise
      to substantially contribute to further innovation, growth and social prosperity, and as with
      any such development, policy makers and other stakeholders need evidence to inform the
      decisions they will take in the coming years. As such, the Cancun Declaration invited the
      OECD to further develop work on these emerging technologies, including the Internet of
      Things, in order to fully embrace their benefits, and to strengthen the collection of
      internationally comparable statistics.
      The IoT is expected to grow exponentially, connecting many billions of devices in a
      relatively short time (OECD, 2015[2]). Some of these connected devices will be in private
      residences, related to function such as energy management, security or entertainment.
      Others will be associated with developments in areas such as transport, health and
      manufacturing. A key question, therefore, is how to prioritise measurement efforts of those
      elements of the IoT that are of most relevance to policy makers. For example, in the case
      of IoT use in manufacturing, sometimes called Industry 4.0 or the next production
      revolution, decision makers will likely wish to know not only how many robots are in
      operation in their country but also how many are connected. At the same time, they will
      not only need to know how many automobiles and trucks are connected but, in the case of
      fully automated vehicles, what are their potential demands on communication
      infrastructures in terms of generating large amounts of data.
      Developments around connectivity or the implications of new demands placed on networks
      are not, of course, new to stakeholders in communication markets. The pervasiveness of
      such developments does, however, raise questions about the best ways to collect the
      information that ultimately proves necessary to inform policy. For instance, what is the best
      source to collect data on connected robots? The producers of robots or the suppliers of the
      connectivity? Similarly, what is the best channel to gather information on autonomous
      vehicles? The vehicles’ registries that exist in all countries or the producers of those
      vehicles or those providing connectivity?
      There will be issues as well that are a high priority for communication policy and regulation
      especially, where the demands of the IoT develop in ways that have strong implications for
      the location, deployment and capabilities of infrastructures. As a single fully automated
      vehicle, for example, may generate far more data than several thousand mobile wireless
      users, this may have profound implications for decisions in areas such as spectrum, rights
      of way, the location of data centres, requirements for faster broadband access, and backhaul
      to name just a few. At the same time, others will look for information that informs

                                                                            OECD DIGITAL ECONOMY PAPERS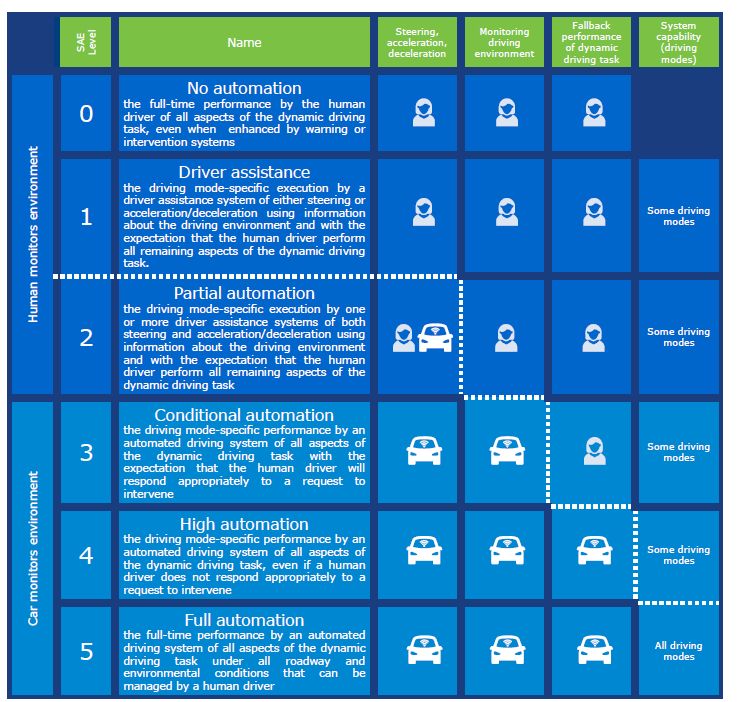
IOT MEASUREMENT AND APPLICATIONS           │7

       considerations in areas such as privacy and security, as well as interoperability, numbering
       and standardisation. Therefore, statistical definitions and indicators of IoT should reflect,
       as much as possible, the different policy interests and objectives around this area.
       Apart from being better informed on future demand for communication infrastructures,
       including those where public investment may be involved, there is a second critical reason
       measurement in this area, which is important for policy makers. It is the ability to measure
       the effects of the IoT on productivity, GDP and growth, as part of the Digital Economy.
       However, to assess any measure of the influence of IoT on GDP, the first step is to have a
       proper indicator of the size of the IoT. This latter point was made clear in a recent
       publication (2018) by the Bureau of Economic Analysis in the United States (BEA), which
       endeavoured to measure the influence of the digital economy on GDP. Although the BEA
       recognised the IoT1 as an important element of the digital economy, it was excluded given
       the inherent measurement difficulties, as well as the complexity to allocate the “digital”
       component of the connected devices when accounting for the value added (Barefoot et al.,
       2018[3]).2
       The Cancun Ministerial Mandate identified a set of areas for stakeholder engagement to
       promote IoT deployment. In particular, it highlighted the importance of developing metrics
       to measure the effects of adoption of the IoT in different policy areas (OECD, 2016[1]). In
       this respect, the aim of this report is twofold. First, to review different definitions of IoT in
       view of an operational definition for the CDEP work. Second, to explore feasible ways to
       measure IoT and its implications, notably for infrastructure and networks. The potential
       challenges for infrastructure will be discussed in a case study: the developments of
       connected and automated vehicles.
       The structure of this report is the following. Section 2 provides a short overview of the
       main IoT measurement questions that have arisen in the past few years among OECD
       countries. Section 3 summarises the IoT definition used by the OECD to date and how the
       OECD has measured Machine-to-Machine (M2M) communications since 2012. Section 4
       provides an overview of the selected definitions and measurement efforts by diverse
       government authorities, organisations, as well as market players. Section 5 addresses the
       question of whether certain categories of IoT devices require prioritising in terms of
       measurement given their potential implications for communication infrastructure (e.g.
       automated vehicles). Section 6 provides a short overview of emerging regulatory and policy
       challenges related to the IoT that underline the importance of measurement. Finally,
       Section 7 concludes by highlighting some criteria to take into account in terms of IoT
       measurement, and proposing a working definition of IoT for OECD countries, with its
       corresponding subcategories.

OECD DIGITAL ECONOMY PAPERS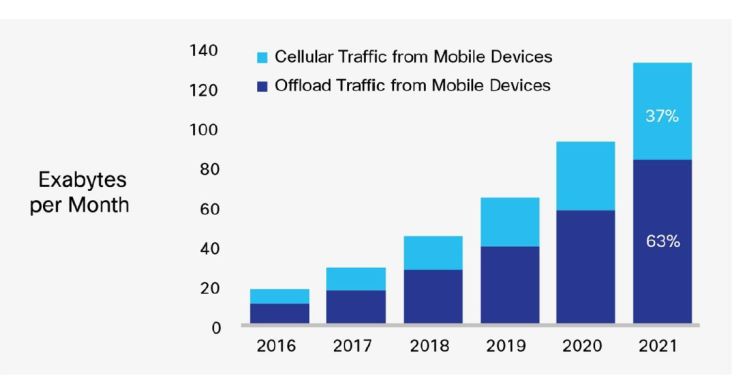
8 │ IOT MEASUREMENT AND APPLICATIONS

                                2. Measurement questions/issues

      To date, the OECD has gathered data on the number of machine-to-machine (M2M)
      connections on cellular wireless networks. Many of these M2M connections have been
      used for legacy applications built directly on mobile networks. However, as IoT devices
      increasingly become Internet Protocol (IP) based and platform-agnostic (i.e. operating on
      mobile, fixed, and other networks), how should OECD countries seek to measure the
      number of such devices and their implications for telecommunication networks?
      Most residential IoT devices are not directly connected to a telecommunication operator
      network; rather, they connect either through a “smart-home hub” or through residential
      wireless networks. There are, however, significant differences between these devices, both
      in terms of numbers of devices and network uses, and the Internet-enabled devices, which
      have proliferated in private residences in recent years, which tend to be user-focused
      (personal computers, tablets, smartphones, wearable devices and so forth).
      At the same time, many applications of IoT such as for public utilities or government use
      private networks, and thus might not appear in supply-side data (i.e. telecommunication
      operator provided). Reporting data in an area such as connections for smart metres, for
      example, is likely to be provided by the associated service providers even if
      telecommunication networks furnish the underlying connectivity. On the other hand, there
      will likely still be a need for some data to be provided by network operators as a separate
      category.
      Different IoT applications (i.e. massive and disperse M2M communications versus critical
      IoT applications) are likely to have diverse network requirements. For instance, Ericsson
      has said that automated vehicles will require low latency (i.e. lower than 5ms) and 100%
      network reliability and coverage. At the same time they say massive dispersed connected
      M2M objects, such as sensors, will require 100% network coverage, a 10-year battery life
      but are not really sensitive to latency (Ericsson, 2017[4]).3 This highlights the need to
      prioritise measurement according to policy goals.
      While IoT data use has been relatively modest to date, a question can be raised as to how
      are next-generation applications, such as fully automated vehicles, industrial IoT devices
      and so forth, are expected to change the data use profile of these devices in the future? As
      an example, according to some estimates, a single autonomous vehicle will produce 4 000
      GB of data per day, --i.e. the equivalent of data produced by 3 000 smartphones, (Intel,
      2016[5])--, or even 100 GB of data per second (CNBC Autos, 2017[6]). According to other
      estimates, a connected car generates 20 GB of data per day (Seminconductor Engineering,
      2017[7]).
      A question is then, how will a substantial increase in data affect infrastructure
      requirements? Which amount of the collected data will be actually transferred and how
      much more network capacity will be needed? At the same time, are their categories of
      devices that use SIM cards that deserved being broken out in the data collected by
      authorities given the different demands they make on infrastructures? In other words,
      information about automated vehicles may be more critical than objects such as luggage,
      environmental sensors or the many thousands of different types of things that may one day
      be connected via SIM cards (simply because they generate less traffic).

                                                                           OECD DIGITAL ECONOMY PAPERS
IOT MEASUREMENT AND APPLICATIONS │9
2.1. Specific questions that arise with regards to presently used M2M metrics
As new technologies start to emerge, such as the eSIM (embedded SIM) in wearable
devices a question can be raised as to how to take into account these new SIM cards in
M2M measurement. The Apple Watch Series 3, for example, uses and eSIM while many
Android Wear 2.0 watches have to date used a standalone “Nano SIM”. Should such
devices be considered as a single or multiple connections? In other words if one of these
devices is connected to an existing smartphone service account and the other potentially
transferable over different accounts should they be counted differently?
If such devices are recorded as multiple connections, should they be counted under
traditional mobile broadband connections (e.g. smartphones, tablets) or under connected
devices such as automobiles and sensors are today? In terms of the element related to single
or multiple connections, it is understood telecommunication providers count a single
vehicle as a single connection even if it has two SIM cards perhaps provides a way forward.
Will special types of enhanced connected devices that currently use M2M SIM cards, such
as automated vehicles, require a separate category in order to track high data consumption
of these devices (as opposed for example to data consumption from connected devices
relying only on sensors) in order to adapt network architecture and communications
infrastructure accordingly?
In addition, a further question that could be asked for device manufacturers and mobile
operators, is: when a device, such as a smartphone, has multi-homing of connectivity (e.g.
it is able to use LTE-M and LoRa networks), is there a double accounting of M2M devices
that use SIM cards and are LPWA connected devices?
A comprehensive list of questions and issues in terms of IoT measurement, and in particular
concerning current M2M measurement, can be found in Annex A.
OECD DIGITAL ECONOMY PAPERS10 │ IOT MEASUREMENT AND APPLICATIONS
3. What is IoT?
3.1. OECD current working definition of IoT and M2M
The OECD defines IoT in broad terms “including all devices and objects whose state can
be altered via the Internet, with or without the active involvement of individuals. This
includes laptops, routers, servers, tablets and smartphones, often considered part of the
“traditional Internet”. However, these devices are integral to operating, reading and
analysing the state of IoT devices and frequently constitute the “heart and brains” of the
system. As such, it would not be correct to exclude them” (OECD, 2015[2]).
In addition to IoT, Machine to Machine (M2M) communications, as a subset of IoT, is
characterised by autonomous data communication with little or no human interaction
(OECD, 2015[2]). In fact, the OECD 2012 report on the subject defined M2M as, “Devices
that are actively communicating using wired and wireless networks that are not computers
in the traditional sense and are using the Internet in some form or another. M2M
communication is only one element of smart meters, cities and lighting. It is when it is
combined with the logic of cloud services, remote operation and interaction that these types
of applications become “smart”. RFID can be another element of a smarter environment
that can be used in conjunction with M2M communication and cloud services” (OECD,
2012[8]).
In terms of the OECD’s IoT definition it has mainly been used to date to inform policy and
regulatory discussion rather than to define the IoT for data collection. It is, therefore, broad
for practical reasons. On the other hand, the authorities that collect these data (e.g.
telecommunication regulators) as well as the GSMA have defined M2M.
The first challenges in arriving at a definition of IoT for measurement are to consider
questions such as what may be practical, what may be the priorities and so forth. Such a
concept may, for example, take into account key enablers (i.e. M2M communications, big
data, cloud computing and sensors) leading to machine-learning applications (OECD,
2015[2]). Furthermore, measuring the amount of “connected devices” when multiple
devices are connected in an integrated system can prove challenging. The following
underlying technologies are key enablers that are required for IoT devices to function
properly:
semi-conductors (i.e. sensors, chips, processors, memory, and so forth)
modules and devices (i.e. software/API connecting the IoT devices)
IoT platforms (i.e. the operating systems and support existent IoT solutions)
the network (i.e. connectivity where standardisation and interoperability issues are
relevant).
The different components of the IoT enabling environment can be illustrated in a diagram
(Figure 1).
OECD DIGITAL ECONOMY PAPERSIOT MEASUREMENT AND APPLICATIONS │ 11
Figure 1. IoT enabling environment
Data Centers
Cloud Services
I. Enabling Infrastructure
Fixed
Telecommunication
LPWAN
Infrastructure
Wireless
Cellular
e.g. semiconductors, chips &
Key Devices
processors
II. IoT terminal devices and
modules
The IoT
Software Modules and APIs that connect objects
Operating system to support IoT (e.g. Ericsson IoT platform)
III. IoT platforms
solutions
e.g. sensors for Smart Cities (smart meters)
Massive and
e.g. sensors for machines
Disperse M2M
e.g. sensors for agriculture
IV. IoT services/ applications
(B2B or B2C) e.g. IoT for Health care and remote surgery
Critical IoT
e.g. IoT for industrial robotics & mining
applications
e.g. Fully automated vehicles
Note: This diagram was conceived taking into account the IoT frameworks in Japan, France, and Korea.
Source: Own elaboration.
In each key-enabling layer of the IoT, numerous economic actors are involved. This can
have an influence on defining IoT for measurement purposes, and eventually on how the
data may be collected. For example, some of the players involved are the following:
the designers and producers of connected devices sold to consumers (e.g. a
Samsung connected television or Amazon’s virtual assistant, Alexa)
the IoT module providers (i.e. chips, processors, software and APIs)
network equipment providers (e.g. Ericsson, Cisco, Huawei)
IoT cloud providers (e.g. Amazon, Google)
IoT platform providers (i.e. the integral support software that connects everything
in an IoT system facilitating communication, data flow, and device management)
connectivity providers (e.g. LoRa, SigFox, mobile operators, fixed and satellite
providers).
Future work on measurement of IoT could focus on mapping the different actors from a
supply side perspective for data collection purposes. This mapping could include
stakeholders who define connectivity protocols, those who build their own IoT LPWAN
network and make it available to customers, those who act as intermediaries by connectivity
based on third party networks, and so forth.
OECD DIGITAL ECONOMY PAPERS12 │ IOT MEASUREMENT AND APPLICATIONS
Given that the IoT is part of an ecosystem with key enablers, it has proven challenging to
find a sufficiently precise definition for measurement purposes. Nevertheless, many of the
existing definitions used for IoT, are well suited to support general concepts for policy
discussions (see Annex B for selected examples).4 In some cases, some intergovernmental
bodies have addressed regulatory issues surrounding IoT without defining it. For instance,
the Body of European Regulators for Electronic Communications (BEREC) has worked in
recent years on studying the impact of IoT on regulation and how to foster an enabling
environment for IoT without committing to a definition (BEREC, 2016[9]).5
There are ongoing efforts by intergovernmental organisations and international
standardisation bodies to harmonise a definition of the IoT for measurement purposes. One
example is that as part of BEREC’s Programme of Work and Budget for 2018. BEREC
plans to assess what type of measurement of IoT European National Regulatory Authorities
(NRAs) are already conducting on the supply-side and/or on the demand-side, and to assess
if there is, at this stage, any common set of IoT-related indicators which BEREC could
regularly collect in the future (possibly from 2019 onwards).6 Another notable example is
the International Organisation for Standardisation (ISO) who is currently working on the
definition and vocabulary of the IoT, as well as the interoperability of IoT systems
(platforms) as part of their technological standards projects (ISO, 2018[10]).
Previous work from the OECD has highlighted the difficulty to measure IoT (OECD,
2017[11]; OECD, 2015[2]; OECD, 2016[1]). It has been underlined that, “Measurement of the
number of IoT devices connected to the Internet has proven hard to obtain, with countries
only now starting to collect data.” In the absence of official statistics, one option has been
to examine private sources of data collection.
One source, among others (e.g. CISCO, Ericsson, and so forth), which has been used in
previous OECD publications, is data provided by Shodan, which describes itself as a search
engine for Internet-connected devices. In 2015, according to Shodan’s definition there were
363 million visible devices online with some 84 million recorded in the People’s Republic
of China (hereafter “China”) and 78 million to the United States (Figure 2). While
recognising that such data collection is nascent and there is no consensus to date on
definitions, such approaches provide one option for the future.
Figure 2. Devices online per 100 inhabitants, top OECD countries
Note: Last updated: 29-May-2015.
Source: OECD Digital Economy Outlook 2015, http://dx.doi.org/10.1787/888933473770 using data from
Shodan.
OECD DIGITAL ECONOMY PAPERSIOT MEASUREMENT AND APPLICATIONS │ 13
One approach to the measurement of IoT is to focus on a subset or subcategory. The OECD
has collected data from communication authorities on M2M embedded SIMs since 2012.
Likewise, the GSMA collects M2M data from its membership. While a very important part
of the IoT, this category is only a small part of all devices that are now connected or will
be so in the future.
3.1.1. OECD measurement of M2M data
The Broadband Portal publishes information on key telecommunication market indicators
from communication regulators and official statistical agencies in the OECD area. Within
the set of indicators, most OECD countries now collect data on M2M SIM cards.
To calculate the number of M2M/embedded mobile cellular subscriptions, the OECD
defines M2M on mobile networks as “the number of SIM-cards that are assigned for use
in machines and devices (cars, smart meters, and consumer electronics) and are not part
of a consumer subscription”. This means that dongles for mobile data and tablet
subscriptions should be counted by countries under the mobile broadband definition,
whereas SIM-cards in personal navigation devices, smart meters, trains, automobile etc.,
should be counted under the M2M category.
One can observe an increasing trend in M2M SIM card subscriptions in the OECD area
when comparing the latest data (June 2017), with M2M penetration data for the years 2012
and 2014 (Figure 3).
Figure 3. M2M/embedded mobile cellular subscriptions per 100 inhabitants
Years 2012, 2014 and 2017
Note: For Korea, provided data does not include some devices (personal navigation devices etc.) as they are
based on different technologies rather than SIM cards.
Source: OECD, Broadband Portal, www.oecd.org/sti/broadband/oecdbroadbandportal.htm.
OECD DIGITAL ECONOMY PAPERS14 │ IOT MEASUREMENT AND APPLICATIONS
The M2M data shows only where the SIM cards stem from (i.e. where the numbers are
assigned or from which national MNO or MVNO the SIM is allocated to the end-user), but
not where the connected device is used. Therefore, it may be the case that a country
displaying high rate of connected M2M SIM cards reflects the fact that a domestic MNO
or MVNO player is strong in the international IoT-M2M market (e.g. Telenor in Sweden).
For example, Telenor Connexion, which held 81% of the Swedish M2M market (December
2016), uses its numbering (IMSI numbers) for not only Sweden, but also their clients
around the world.7
One factor that will likely increase these M2M penetration figures is the trend by National
Regulatory Authorities (NRAs) in several countries to allow the use of extra-territorial
M2M numbers (e.g. Germany, Netherlands and Belgium). Historically, MNOs have used
their IMSI numbering in the country that supplied the numbers. In recent years, however,
regulators in countries such as Belgium and the Netherlands have moved to more open
policies around use of numbering and M2M. In this sense, it is notable that both these
countries have large shares of the EU M2M market, substantial above the equivalent shares
in other countries in the European Union, and placed second and third behind Sweden
(Figure 4).
Figure 4. Share of M2M SIM cards* over total SIMs in EU countries,** October 2016
Note: *Definition by EC of M2M SIMs: "M2M is about enabling the flow of data between machines and
machines and ultimately machines and people. Regardless of the type of machine or data, information usually
flows in the same general way -- from a machine over a network, and then through a gateway to a system where
it can be reviewed and acted on.” – www.m2mcomm.com.
**Note by Turkey: The information in this document with reference to “Cyprus” relates to the southern part of
the Island. There is no single authority representing both Turkish and Greek Cypriot people on the Island.
Turkey recognises the Turkish Republic of Northern Cyprus (TRNC). Until a lasting and equitable solution is
found within the context of the United Nations, Turkey shall preserve its position concerning the “Cyprus
issue”.
Note by all the European Union Member States of the OECD and the European Union: The Republic of Cyprus
is recognised by all members of the United Nations with the exception of Turkey. The information in this
document relates to the area under the effective control of the Government of the Republic of Cyprus.
Source: Data from European Commission Digital Single Market, EU 28, “Financial indicators, fixed and mobile
telephony, broadcasting and bundled services indicators – 2016” (European Commission, 2017[12]),
https://ec.europa.eu/digital-single-market/en/connectivity
OECD DIGITAL ECONOMY PAPERSIOT MEASUREMENT AND APPLICATIONS │ 15
3.2. Aspects to consider when defining and measuring IoT
Some of the first questions to consider in relation to a definition of the IoT are whether it
is practical for the purpose of measurement and the elements it should include. Such a
concept could take into account key enablers (i.e. M2M communications, big data, cloud
computing and sensors) leading to machine-learning applications (OECD, 2015[2]). That
being said, when multiple devices are in a system, measuring the amount of “connected
devices” can be complex. The following list is not exhaustive, but highlights some key
aspects to be considered in relation to the measurement of the IoT:
I. Measuring “connected devices” by features (allowing, among other things, to
distinguish M2M data traffic versus mobile communications traffic). These
characteristics include:
a. Dispersion or concentration of devices/applications;
b. Mobility (stationary or nomadic objects),
c. Data volume and network performance (bandwidth), and
d. QoS including security standards and sensitivity to latency.
II. Categorising IoT by technological options for their use and adoption:
a. Sensors and simple hubs (i.e. sensors gather and analyse environment
information, and hubs connect these sensors to a broader network such as air-
conditioning, electricity, security systems);
b. Integrating hubs (i.e. a system that connects simple hubs creating more complex
devices such as Apple’s HomeKit that bundles electric power, home security,
window shades into one system);
c. Enhanced applications (i.e. services that collect and analyse data from
connected devices and the environment in real time such as “automated
vehicles”).
III. Taking into account the underlying IoT infrastructure that enables communication
among devices (i.e. cloud services, quantum and edge computing, data storage,
mobile networks, LPWA networks, backhaul and backbone connectivity and so
forth).
The current OECD definition of the IoT provides a conceptual framework to guide policy
discussions, as it encompasses the universe of connected IoT devices (i.e. the definition
mentions “all devices or objects whose state can be altered via the Internet, with or without
the active involvement of individuals”). It could, however, be rendered more useful by
adding subcategories for measurement purposes. These subcategories could be based on
different features of the devices: i) range of IoT devices (i.e. wide-area or short range), or
ii) the type of M2M connection (i.e. simple sensors, or critical “live” IoT devices such as
automated vehicles). The benefits of complementing the OECD definition by adding
subcategories could be manifold. Namely, two main benefits are mentioned here. One, it
would render the issue of measuring the IoT more tractable, and two, it would allow for
prioritisation in data collection in certain categories (or subcategories) of IoT that may have
more influence in communication infrastructure.
In the future different IoT-M2M applications are likely to generate very different usage
patterns. Environmental sensors, for example, may only generate very small amounts of
data relative to connected bicycles and robots, right up to perhaps the largest amounts in
the case of automated vehicles. Thus, a breakdown of IoT into several subcategories such
as “Massive Machine to Machine communications” (e.g. sensor like M2M), and critical
IoT applications (e.g. automated vehicles) seems an advisable way forward in order to
better inform policy makers.
OECD DIGITAL ECONOMY PAPERS16 │ IOT MEASUREMENT AND APPLICATIONS
In summary, concerning IoT metrics, there is a question of definition, and a question of
measurement. The subsequent section provides an overview of the definitions by several
stakeholders (including the private sector), as well as describing how they have used these
definitions to measure the IoT.
OECD DIGITAL ECONOMY PAPERSIOT MEASUREMENT AND APPLICATIONS │ 17
4. Other IoT Definitions and current estimates of the size of IoT
4.1. GSMA
The GSMA states that although IoT is a very complex and diverse ecosystem with very
limited reported data, they define it as, “IP enabled devices capable of two-way data
transmission (excluding one-way communication sensors and RFID tags). Includes all
access technologies e.g. cellular, short-range, fixed and satellite.”
The GSMA also has a working definition of M2M cellular connection, which they use to
track the number of M2M connected objects over the years by country. Their M2M
definition is “A unique SIM card registered on the mobile network at the end of the period,
enabling mobile data transmission between two or more machines. It excludes computing
devices in consumer electronics such as e-readers, smartphones, dongles and tablets.” This
means that certain applications that are regarded as IoT/M2M according to other definitions
are not counted in the GSMA data.8 According to GSMA data on M2M penetration, the
number of M2M SIM cards in every OECD country has increased from 2012-2017
(Figure 5).
Figure 5. M2M connections per 100 inhabitants, GSMA data* for OECD Countries**
Type the subtitle here. If you do not need a subtitle, please delete this line.
Note: *Population data from OECDstat and M2M data from GSMA Intelligence. **Luxembourg is not shown
in the graph. According to the communications regulator, the Institut Luxembourgeois de Régulation, there
were 89 400 M2M SIM cards at the end of 2016, whereas GSMA reports 1 377 000 M2M SIM in Q2 2017.
Source: Own elaboration using data from GSMA Intelligence database.
4.2. The private sector
McKinsey (2015) defines the IoT as, “sensors and actuators connected by networks to
computing systems. These systems can monitor or manage the health and actions of
connected objects and machines. Connected sensors can also monitor the natural world,
OECD DIGITAL ECONOMY PAPERS18 │ IOT MEASUREMENT AND APPLICATIONS
people, and animals.” Their definition excludes, “systems in which all of the sensors’
primary purpose is to receive intentional human input, such as smartphone apps where data
input comes primarily through a touchscreen, or other networked computer software where
the sensors consist of the standard keyboard and mouse” (McKinsey Global Institute,
2015[13]). The McKinsey Global Institute used this definition in a report that endeavoured
to estimate the total potential economic effects of IoT across nine different settings (e.g.
vehicles, homes, cities, factories, logistics, health, and so forth). According to this report,
the potential effects ranged from USD 3 trillion-11.1 trillion per year in 2025 (McKinsey
Global Institute, 2015[13]).9
Ericsson measured 16 billion connected devices in 2016, out of which 5.6 billion
corresponded to IoT. They estimate that by 2022 there will be 29 billion connected devices,
out of which 18 billion will be IoT related (Barboutov et al., 2017[14]). A relevant feature
regarding the IoT definition by Ericsson is that PCs, laptops, tablets, mobile phones and
fixed phones are excluded. As noted previously with the GSMA M2M definition, this
means that certain applications that are regarded as IoT/M2M are not counted in the
Ericsson data. In addition, Ericsson breaks down IoT into two subcategories: wide-area and
short-range IoT. The short-range segment mostly refers to devices connected by unlicensed
spectrum (e.g. devices using Wi-Fi, Bluetooth and Zigbee with a typical range up to 100
metres). This category also includes devices connected over fixed-line Local Area
Networks (or LANs) and powerline technologies.10 The wide-area segment consists of
devices using cellular connections (e.g. NB-IoT and Cat M1 technologies), as well as
unlicensed low-power technologies such as Sigfox, LoRa and RPMA.11
As defined by Ericsson, currently, the most common technology in the wide-area IoT
segment is GSM/GPRS, and according to them, the Compound Annual Growth Rate
(CAGR) between 2016 and 2022 for wide-are IoT and short-range IoT is expected to be
30% and 20%, respectively (Barboutov et al., 2017[14]). It is notable that the 2017 Mobility
Report by Ericsson has a change in the definition of these two segments with respect to
their 2016 report, which only referred to cellular and non-cellular IoT.12
Furthermore, given the data requirements of different IoT applications, Ericsson points out
that within the wide-area IoT segment, two distinct sub-segments have emerged: massive
and critical applications. On the one hand, massive IoT connections require high connection
volumes (but small data traffic), are usually low cost, and require low energy consumption
(e.g. smart buildings, transport logistics, fleet management, smart meters and agriculture
sensors). On the other hand, critical IoT connections require ultra-reliability and
availability of the network, low latency connectivity and high data throughput (e.g. traffic
safety, automated cars, industrial applications, remote manufacturing and healthcare,
including remote surgery).
The Ericsson Mobility Report further notes that the first cellular IoT network supporting
massive IoT applications deployed using LTE networks (based on LTE-Cat-M1 or LTE-M
and Narrow Band-IoT technologies), were launched in early 2017 (Barboutov et al.,
2017[14]).
CISCO publishes regularly the Virtual Network Index (VNI) Global Mobile Data Forecast,
which projects mobile traffic by types of data. CISCO treats as synonymous the definition
of M2M and IoT. They define M2M as technologies that “allow systems to communicate
with other devices of the same capability, such as utility metering, security and
surveillance, fleet management, GPS and navigation, asset tracking, and healthcare record
devices” (CISCO, 2017[15]).
OECD DIGITAL ECONOMY PAPERSIOT MEASUREMENT AND APPLICATIONS │ 19
In the most recent publication of the CISCO VNI they have made a methodological change.
In the February 2016 update, within the M2M category, they have updated the forecast to
include low-power wide area network (LPWAN) connections “which is an emerging ultra-
narrowband M2M connectivity alternative for a variety of IoT applications”. CISCO’s
M2M definition includes wearable devices, which are “devices capable of connecting to
and communicating with the network, either directly through embedded cellular
connectivity or through another device (primarily a smartphone) over Wi-Fi, Bluetooth,
and so forth” (CISCO, 2017).
According to CISCO’s definition of IoT, in 2016 there were 780 million M2M connections
around the world, out of which 325 million were wearable devices (e.g. smart watches,
smart glasses, health and fitness trackers, wearable navigation devices, smart clothing, and
so forth.). Of these wearable devices, 11 million already had embedded cellular connections
(i.e. eSIM) in 2016. Their forecast is that by 2021 there will be 3.3 billion M2M connected
devices, i.e. a fourfold growth in five years. In addition, the share of M2M connections as
part of the total mobile connections is likely to grow.
According to CISCO VNI data, in 2016 M2M devices represented 9.7% of global
connected mobile devices (a total 8 billion mobile-connected devices, including M2M
modules in 2016), and this share will grow up to 28.4% in 2021 (out of the 11.6 billion
forecasted mobile connections in 2021). One factor influencing the growing adoption of
IoT to is the emergence of wearable devices (CISCO, 2017[15]).
Some mobile operators now report the amount of IoT devices connected to their networks
in their annual financial statements to shareholders. In the United States, AT&T was one
of the first companies to report the number of connected devices, and by 2017 had 39
million (AT&T, 2017[16]). More recently, other large players have joined in reporting such
data such as operators in China. In 2017, China Telecom and China Mobile, reported 44.3
and 229 IoT devices, respectively (China Telecom, 2017[17]; China Mobile, 2017[18]).
4.3. Telecommunication Authorities in OECD countries
4.3.1. ANACOM the communication services regulator in Portugal
ANACOM has been collecting M2M data since 2012 (e.g. number of M2M devices with
SIM cards, traffic and revenues), in the same manner as many other regulators in the OECD
area. In 2016, for the first time, ANACOM tried to collect data on Low-Power Wide Area
(LPWA) communications technologies (e.g. revenues, number of devices, clients and
traffic). The response rate of this survey was quite low; however, based on the very limited
number of replies, they found that: 1) there are a small number of (corporate) clients, 2) a
large number of devices, and 3) very low levels of traffic on LPWA networks.
On the issue of definition and measurement of the IoT, ANACOM’s point of view is that a
harmonised methodology is preferable. Concerning metrics, besides usage (revenues, data,
devices, clients), ANACOM considers that coverage of IoT should also be studied. In this
respect, ANACOM notes that BEREC is developing a report on 5G coverage obligations
(“Best practices report on coverage obligations with a view to 5G”).
In their view, the GSMA approach is an example of how it is possible to collect data on
M2M on a harmonised way across several geographies using supply side data. It could
make sense to split these indicators by technology/standard in order to gain some insights
on the types of applications that are being offered (i.e. critical or non-critical IoT
connections).
OECD DIGITAL ECONOMY PAPERS20 │ IOT MEASUREMENT AND APPLICATIONS
However, mobile operators’ data will only cover the wide area segment applications of IoT
based on licensed spectrum. Concerning applications based on unlicensed spectrum, the
suggestion from ANACOM is to contact directly the LPWA providers (e.g. Sigfox, LoRa)
which are mostly transnational companies, in order to gather information on LPWA
communication.
As for the low range IoT segment, industrial applications and home applications will
probably involve different metrics and data sources. From ANACOM’s previous
experience, possible sources of data for residential services and devices are not directly
connected to a telecommunication operator’s network. These sources include:
Retail outlets’ and device vendors’ retail figures: For several years, ANACOM has
collected data from these sources with regards to digital TV devices (through a third
party) with good response rates and covering most of the Portuguese market.
Household surveys: ANACOM has been surveying usage of OTT services for
several years based on household surveys.
In addition, ANACOM, the Portuguese communications regulator, highlights the need to
refine M2M indicators. Many IoT applications, they note, will be based on cellular
networks, and thus, it is possible to rely on traditional data sources (i.e. mobile operators)
to collect data on the number of connections, traffic, and even revenue associated with
M2M. For ANACOM, it would make sense to further refine M2M indicators in the
following ways:
Collecting data by network/technology (e.g. 2G, 3G, 4G, and 5G).
Collecting data by subcategories of different network/technologies associated with
different M2M and IoT applications (e.g. wide area/short range, critical/non-
critical);
Collecting M2M statistics for specific applications (e.g. automated vehicles).
Likewise, in their view, an identical approach can be followed for LPWA services. A
related issue concerns mobile penetration measurement. ANACOM says M2M connected
devices should be excluded not least because they otherwise render measures of penetration
less useful.
Finally, ANACOM expresses that it would make sense to measure adoption of IoT related
technologies and applications among enterprises, especially in the case of short range
applications and private networks for which alternative data sources may not be available.
An example of this is Eurostat’s ICT usage enterprise survey, which included a module on
the use of cloud services.
4.3.2. ARCEP, the communication services regulator in France
According ARCEP, various components should be considered in the IoT ecosystem. These
include the physical objects themselves, the economic actors, the connectivity (i.e.
“backbone” of the IoT), and the data flows among connected objects (Figure 6).
OECD DIGITAL ECONOMY PAPERSIOT MEASUREMENT AND APPLICATIONS │ 21
Figure 6. ARCEP’s components to be considered in the IoT ecosystem
Platforms
Services
Data storage
& analyse Security actors
Integrators
Treatment and data
Cloud operators
Services providers & data
agregators
Connectivity Middleware
Network equipment manufacturers
and Network operators
Components producers
Physical objects Objets designers & producers
"to be connected"
Source: « Le Livre Blanc : Préparer la révolution de l’Internet des objets », (ARCEP, 2016[19]).
As such, ARCEP views the IoT as an ecosystem, and since 2016 has published several
reports on the IoT (ARCEP, 2016[19]). In their view, the physical objects to be connected to
the Internet can be designed for a large variety of applications, ranging from “smart
devices” (i.e. home equipment) to simple elementary components. The economic actors
producing those objects similarly range from object designers and producers to network
equipment manufacturers. The network layer is crucial, they say, as it ensures the quality
of the connexion needed to transmit the data among objects. In this regard, ARCEP notes
that in addition to existing traditional communication networks, new dedicated networks
are emerging (e.g. Low Power Wide Area Network (LPWAN) providers such as Sigfox,
LoRa, and so forth.).
From the perspective of IoT market players and sectors, ARCEP has pointed out several
markets where already concrete IoT applications are expanding. For example, some
applications include: i) “smart territories”, which relates -within the communities
development projects- to the communicating infrastructures (transport, energy, water) and
the optimisation of their management; ii) connected buildings (home and work); iii)
Industry 4.0; iv) automated and connected vehicles; v) digital health; and vi) agricultural
enterprises (ARCEP, 2016[19]).
4.3.3. BNetzA the communication services regulator in Germany
BNetzA has defined M2M for the first time in the numbering plan concerning IMSIs
(BNetzA, 2016[20]). It defined M2M as “the predominantly automated exchange of
information between technical devices such as machines, vending machines, vehicles or
measuring equipment (e.g. electricity, gas and water meters) or between the devices and a
central data processing unit. Communications can be either wire-based or wireless. A
OECD DIGITAL ECONOMY PAPERSYou can also read