Mapping and Assessment of Ecosystems and their Services - Indicators for ecosystem assessments under Action 5 of the EU Biodiversity Strategy to 2020
←
→
Page content transcription
If your browser does not render page correctly, please read the page content below
Technical Report - 2014 - 080

 Mapping and Assessment of
Ecosystems and their Services

            Indicators for ecosystem assessments
            under Action 5 of the EU Biodiversity
            Strategy to 2020

            2nd Report – Final, February 2014

            Environment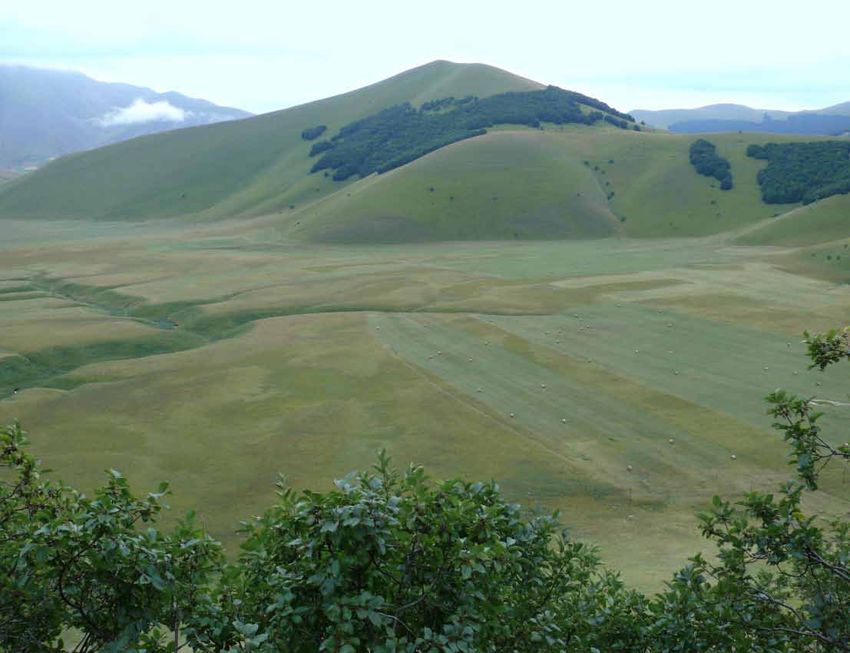
Europe Direct is a service to help you find answers
                                      to your questions about the European Union

                                                   New freephone number:
                                                 00 800 6 7 8 9 10 11

A great deal of additional information on the European Union is available on the Internet.
It can be accessed through the Europa server (http://ec.europa.eu).

ISBN 978-92-79-36161-6
doi: 10.2779/75203

© European Union, 2014
Reproduction is authorised provided the source is acknowledged.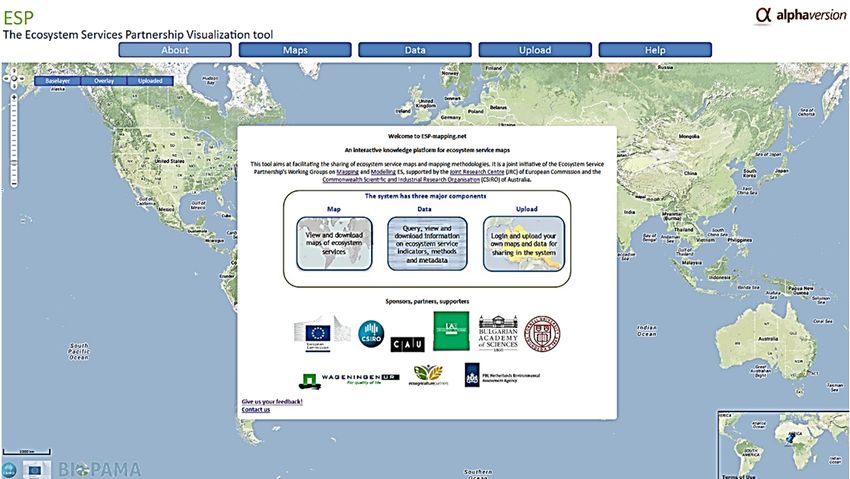
Mapping and Assessment of
Ecosystems and their Services

            Indicators for ecosystem assessments
            under Action 5 of the EU Biodiversity
            Strategy to 2020

            2nd Report – Final, February 2014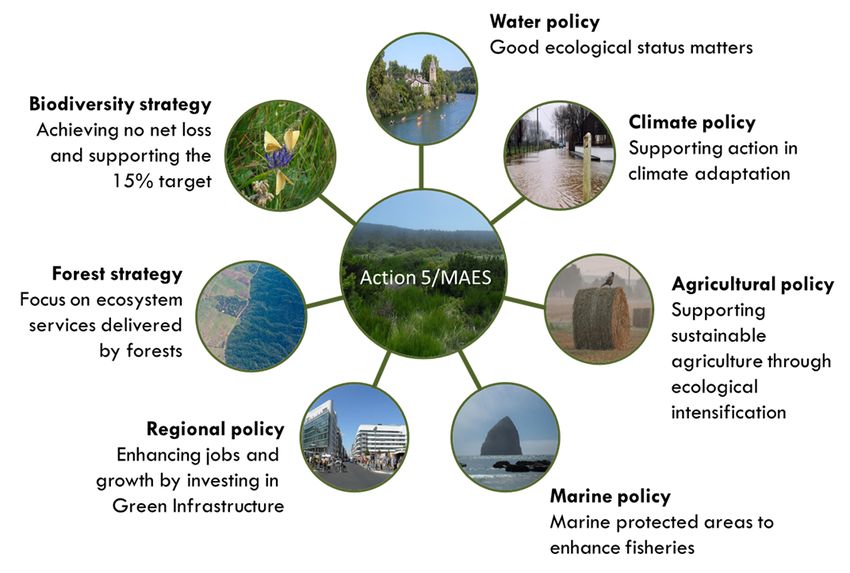
Summary

The second MAES report presents indicators that can be used at European and
Member State's level to map and assess biodiversity, ecosystem condition and
ecosystem services according to the Common International Classification of
Ecosystem Services (CICES v4.3).

This work is based on a review of data and indicators available at national and
European level and is applying the MAES analytical framework adopted in 2013.
Mapping and Assessment of Ecosystems and their Services

CONTENTS
EXECUTIVE SUMMARY .......................................................................................................................................................7

1 INTRODUCTION ...........................................................................................................................................................9
1.1       Context ............................................................................................................................................................................................................ 9
1.2       The importance of MAES and Action 5 ...................................................................................................................................... 10
    1.2.1     Biodiversity policy .......................................................................................................................................................................... 10
    1.2.2     Common Agricultural Policy ..................................................................................................................................................... 11
    1.2.3     Forest policy ...................................................................................................................................................................................... 12
    1.2.4     Water policy ...................................................................................................................................................................................... 12
    1.2.5     Climate action .................................................................................................................................................................................. 13
    1.2.6     Marine policy..................................................................................................................................................................................... 13
    1.2.7     Regional policy ................................................................................................................................................................................. 14
    1.2.8     Research .............................................................................................................................................................................................. 15
1.3       Experience based on country cases ............................................................................................................................................. 15
    1.3.1     Key challenges ................................................................................................................................................................................. 16
1.4       Structure of the report ........................................................................................................................................................................ 17
2 THE SIX PILOTS AND THE COMMON ASSESSMENT FRAMEWORK ............................................................. 18
2.1        Set up and description of the pilot studies ............................................................................................................................. 18
2.2        A common approach for the ecosystem pilots ..................................................................................................................... 18
    2.2.1     Map ecosystems: Identification of data for ecosystem mapping ...................................................................... 20
    2.2.2     Assess the condition of ecosystems: Review of data and indicators for ecosystem assessment... 20
    2.2.3     Map and assess ecosystem services: Reference frame for ecosystem services mapping and
    assessment. .............................................................................................................................................................................................................. 20
    2.2.4     Integration of the two assessments: Reference frame linking condition of ecosystems to their
    services. .................................................................................................................................................................................................................. 21
    2.2.5     Working procedure......................................................................................................................................................................... 21
3         MAPPING ECOSYSTEMS ........................................................................................................................................ 24

4 ASSESSING ECOSYSTEM CONDITION ................................................................................................................ 27
4.1       Results from the ecosystem pilots .............................................................................................................................................. 27
4.2       Towards an EU-wide assessment of ecosystems and their conditions .................................................................. 29
4.3       The use of Article 17 data for mapping and assessment .............................................................................................. 32
    4.3.1    The use of data generated in the context of the Habitats and Birds’ Directives. ...................................... 32
    4.3.2    Other global and pan-European sources of information/data in relation to species and habitats. 33
    4.3.3    National, regional and local data sets relating to species, species groups and habitats. .................... 33
5 ASSESSING ECOSYSTEM SERVICES ................................................................................................................... 34
5.1       Forest services ......................................................................................................................................................................................... 34
    5.1.1    Provisioning services .................................................................................................................................................................... 34
    5.1.2    Regulating/ maintenance services ........................................................................................................................................ 36
    5.1.3    Cultural services.............................................................................................................................................................................. 38
    5.1.4    Strengths and weaknesses ....................................................................................................................................................... 39
    5.1.5    Key references for forest ecosystem services............................................................................................................... 39

                                                                                                                                                                                                         5|Page
Mapping and Assessment of Ecosystems and their Services

5.2                Cropland and grassland services .................................................................................................................................................. 40
      5.2.1           Provisioning services .................................................................................................................................................................... 41
      5.2.2           Regulating/Maintenance Services.......................................................................................................................................... 43
      5.2.3           Cultural services.............................................................................................................................................................................. 45
5.3                Freshwater services .............................................................................................................................................................................. 46
      5.3.1           Provisioning Services .................................................................................................................................................................... 47
      5.3.2           Regulating/ Maintenance Services ........................................................................................................................................ 48
      5.3.3           Cultural Services ............................................................................................................................................................................. 53
5.4                Marine services ....................................................................................................................................................................................... 53
      5.4.1           Provisioning services .................................................................................................................................................................... 54
      5.4.2           Regulating/ maintenance services ........................................................................................................................................ 55
      5.4.3           Cultural services.............................................................................................................................................................................. 55
5.5                Lessons learned ...................................................................................................................................................................................... 59
      5.5.1           Similarities and differences between the ecosystem pilots .................................................................................. 59
      5.5.2           The use of the MAES typology as classification of ecosystems ......................................................................... 60
      5.5.3           The use of CICES as classification for ecosystem services.................................................................................... 60
5.6                Key recommendations based on the ecosystem pilots .................................................................................................... 62
6        NATURAL CAPITAL ACCOUNTING....................................................................................................................... 64

7 TOWARDS INTEGRATED MAPPING AND ASSESSMENT ................................................................................ 66
7.1       Linking biodiversity and ecosystem condition to human well-being ........................................................................ 66
7.2       A tiered approach to mapping and assessing ecosystem services ........................................................................... 68
    7.2.1     Tier 1 – Ecosystem service mapping using available indicators ......................................................................... 68
    7.2.2     Tier 2 – Ecosystem services mapping linking different indicators with land use data .......................... 68
    7.2.3     Tier 3 - Model-based approaches to map ecosystem services............................................................................ 68
7.3       The Ecosystem Services Partnership Visualization tool: an interactive knowledge platform for
ecosystem service maps ........................................................................................................................................................................................... 70
8        CONCLUSIONS AND NEXT STEPS ....................................................................................................................... 72

REFERENCES ...................................................................................................................................................................... 74

ABBREVIATIONS ............................................................................................................................................................... 76

ANNEX 1: GLOSSARY OF TERMS .................................................................................................................................. 78

6|Page
Mapping and Assessment of Ecosystems and their Services

EXECUTIVE SUMMARY

Action 5 of the EU Biodiversity Strategy to 2020 foresees that Member States will, with the assistance of the
Commission, map and assess the state of ecosystems and their services in their national territory by 2014.
Following the adoption of an analytical framework, the Working Group MAES, which steers the implementation of
Action 5 decided to test it based on the outcomes of six thematic pilots.
Four of the pilots focused on Europe’s main ecosystem types: agro-ecosystems, forest ecosystems, freshwater
ecosystems and marine ecosystems. A further pilot focused on the use of conservation status data for assessing
the state of ecosystems and of the associated delivery of services. The final pilot addressed the challenge of
natural capital accounts.
In these pilots EU services worked hand in hand with Member States to make a review of national and European
data and indicators to assess the condition of ecosystems, to quantify biodiversity and to map and assess their
services.
The pilot studies contributed indicators, which can be used for mapping and assessing biodiversity, ecosystem
condition and ecosystem services according to the Common International Classification of Ecosystem Services
(CICES v4.3). The way information is structured is presented in a graph.

           Quick guidance for mapping and assessing ecosystems and their services

                                                                                                     7|Page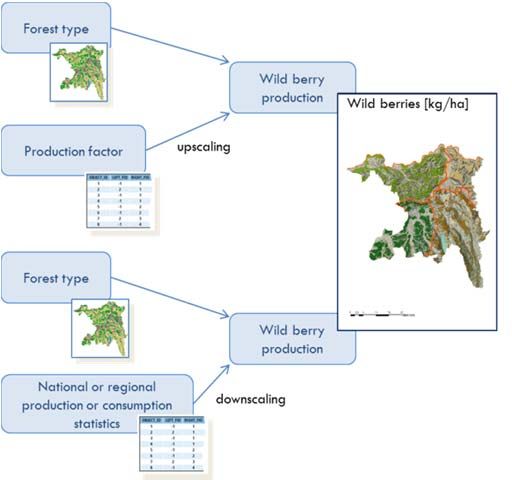
Mapping and Assessment of Ecosystems and their Services

A first European map of ecosystems according to the MAES typology is provided in Chapter 3.

Indicators for the assessment of biodiversity and condition are presented in Chapter 4. Two pieces of
information are provided: a set of available indicators based on the four thematic pilot studies, which is
complemented by a review of information that is available at EU scale.

Indicators for the assessment of ecosystem services are presented in Chapter 5. This chapter reports in
detail on the selection of indicators per ecosystem type (or per pilot study). This information can be used by
Member States in at least two possible ways. Firstly, all information is available per ecosystem type, which
enables an in-depth assessment of services provided by priority ecosystems. Indicator colour codes identify
strengths, weaknesses and possible data gaps offering additional information to users in terms of applicability
and representativeness of each indicator. Secondly, this report presents a synthesis table, which contains
indicators that are spatially explicit and readily available at national and EU scale. This indicator set is designed
in such a way that they assess ecosystem services delivered by the most important supplying ecosystems.
Depending on the availability of the data, this table can be used for a rapid assessment of ecosystem services at
national scale.

Chapter 6 of this report summarised the progress made on natural capital accounting.

Chapter 7 elaborates further on mapping issues. In particular, this report introduces a tiered mapping
approach from simple to complex on how to map ecosystem services. Tier 1 is strongly based on land cover
land use information and involves the use of the ecosystem map presented in this report. Tier 2 is based on the
mapping of indicators on land cover data. Tier 3 refers to a modelling approach.
Importantly, the authors stress the pilot-based approach of this study, which is exclusively built on the voluntary
contributions of participating Member States and EU services. Clearly, some Member States have made
substantially more progress in the development of an indicator framework for ecosystem assessment than is
reported in this report. The MAES analytical framework developed in 2013 was designed to accommodate to a
large extent the views and concepts of leading Member States so that their assessments serve as examples of
good practise.

This report provides “working guidance” on suitable approaches for the Member States for mapping and
assessment based on spatial information and indicators. Therefore, the experience arising from the application of
currently available methods and indicators is open for commenting and will be reviewed again in 2015.

        The outcome of this report is reflecting the best-available assessment of suitable data sets and
        indicators for mapping and assessing ecosystems and their services under Action 5 of the EU
        Biodiversity Strategy. Nevertheless, the recommendations for the use of maps and indicators
        presented here should be taken as a first working version on which feedback is welcome in order
        to continue improving guidance to Member States.

Supporting documents from the Pilots' work can be found at https://circabc.europa.eu/w/browse/837b3dda-6b1a-
4316-a554-723e31062c8f
Relevant reports from EEA can be found at http://projects.eionet.europa.eu/eea-ecosystem-assessments.

8|Page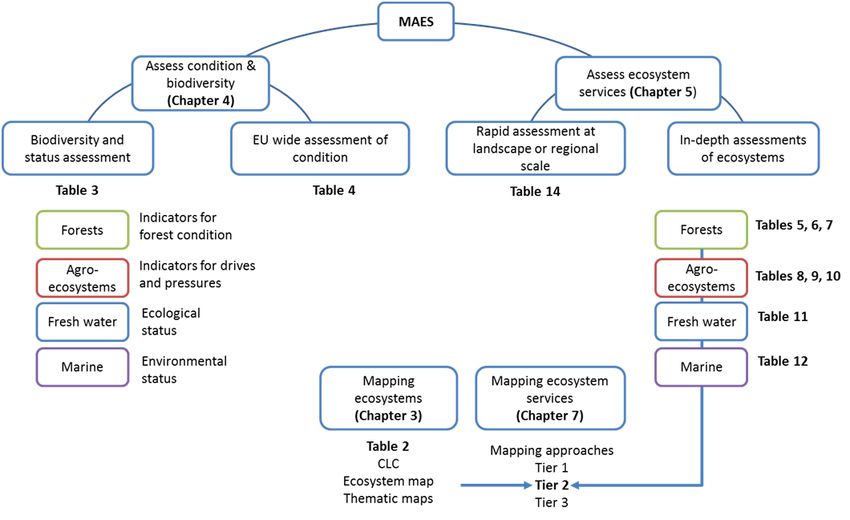
Mapping and Assessment of Ecosystems and their Services

Mapping and Assessment of Ecosystems and their
Services
INDICATORS FOR ECOSYSTEM ASSESSMENTS UNDER ACTION 5 OF
THE EU BIODIVERSITY STRATEGY TO 2020

1 INTRODUCTION

1.1 Context
Action 5 of the Biodiversity Strategy foresees that Member States will, with the assistance of the Commission,
map and assess the state of ecosystems and their services in their national territory by 2014, assess the
economic value of such services, and promote the integration of these values into accounting and reporting
systems at EU and national level by 2020.

The Working Group on Mapping and Assessment on Ecosystems and their Services (MAES) is mandated to co-
ordinate and oversee Action 5. In 2012, the working group developed ideas for a coherent analytical framework
to ensure consistent approaches are used. The report adopted in April 2013 (1) proposes a conceptual framework
linking biodiversity, ecosystem condition and ecosystem services to human well-being. Furthermore, it develops a
typology for ecosystems in Europe and promotes the CICES1 classification for ecosystem services.

Following the adoption of the analytical framework, the Working Group MAES decided to test it and in order to do
so set up six thematic pilots. Four of the pilots focused on the main ecosystem types: agro-ecosystems (cropland
and grassland), forest ecosystems, freshwater ecosystems (rivers, lakes, groundwater and wetlands), and marine
ecosystems (transitional waters and marine inlets, coastal ecosystems, the shelf, the open ocean). A further pilot
focused on the use of conservation status assessment data (cf. under Article 17 of the Habitats Directive) for
assessing the condition of ecosystems and of the associated delivery of services. The final pilot addressed the
challenge of natural capital accounts, which is an important part of Action 5 of the EU 2020 Biodiversity
Strategy. These themes were in line with the recommendations from the 2012 MAES Stakeholder workshop2
where Member States expressed their priorities for activities under Action 5 of the EU 2020 Biodiversity Strategy.
All pilots build on the MAES Analytical Framework and the proposed ecosystem typology and ecosystem service
classification and on the activities and information available from Member States, the European Commission
Services and the European Environment Agency (EEA).

This report provides working guidance to the Member States on how to map and assess the state of
ecosystems and of their services, based on the outcomes of the pilot studies. The outcome of this
report is considered to be based on the best-available assessment of suitable data sets and

1   The Common International Classification of Ecosystem Services (CICES) is linked with the Framework of
the UN System of Environmental Economic Accounts (SEEA).
2   See https://circabc.europa.eu/w/browse/ff690df1-2fdc-414c-b0a3-12b48e35f207

                                                                                                       9|Page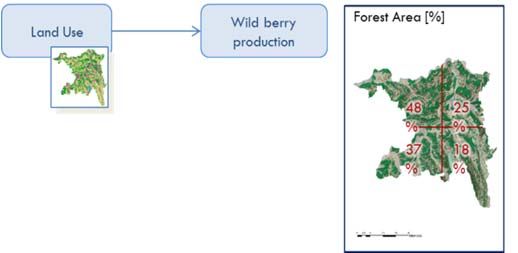
Mapping and Assessment of Ecosystems and their Services

indicators. Nevertheless, the outcomes presented here should be taken as a first working version on
which feedback is awaited that will be reflected in future versions.

1.2 The importance of MAES and Action 5
The work being carried out on the mapping and assessment of ecosystems and ecosystem services is important
for the advancement of biodiversity objectives, and also to inform the development and implementation of
related policies, on water, climate, agriculture, forest, and regional planning (Fig. 1). Robust, reliable and
comparable data are also important for the planning and implementation of individual projects.

                          Figure 1. Example to illustrate inputs of Action 5 into other policies.

1.2.1 Biodiversity policy
The mapping and assessment of ecosystems and their services is an essential part of the EU Biodiversity
Strategy to 2020 and a necessary condition to make ecosystems and their services key parameters informing
planning and development processes and decisions.

High quality and consistent information on the condition of ecosystems and the services provided by those
ecosystems will be needed in order to identify priorities for restoration, support the deployment of Green
Infrastructure and enable the development of a No Net Loss initiative (actions 6a, 6b and 7b of the EU 2020
Biodiversity Strategy).

10 | P a g e
Mapping and Assessment of Ecosystems and their Services
1.2.2 Common Agricultural Policy
Target 3 of the EU 2020 Biodiversity Strategy addresses the integration of biodiversity concerns into the development
and implementation of EU policy on Agriculture and Forestry. Agriculture is a major land use in the EU28, covering
about 47% of the land surface. The Common Agricultural Policy (CAP) is entering a new programming period
(2014-2020), with the introduction of an enhanced environmental component in Pillar 1 of the CAP (income
support to farmers). In the revised CAP, 30% of direct payments are allocated to “green” measures predominantly
focussed on the following three actions:
• Maintenance of permanent grassland;
• Crop diversification: a farmer must cultivate at least 2 crops when the arable land exceeds 10 hectares
and at least 3 crops when the arable land exceeds 30 hectares. The main crop may cover at most 75%
of arable land, and the two main crops at most 95% of the arable area;
• Ecological Focus Areas (EFAs): at least 5% of the arable area of holdings with an arable area larger than
15 hectares must be allocated to EFAs (i.e. field margins, hedges, trees, fallow land, landscape features,
biotopes, buffer strips, afforested area). This figure may rise to 7% after reporting from the European
Union in 2017 and subject to a legislative proposal.
Furthermore, under Pillar II (Rural Development) of the revised CAP there are three long-term strategic objectives
in the programming period 2014-202, one of which is “the sustainable management of natural resources and
climate action”. This over-arching objective is further broken down into six priorities, one of which is “Restoring,
preserving and enhancing ecosystems dependent on agriculture and forestry”. The focus areas identified under
this priority area are:
• Restoring, preserving and enhancing biodiversity, including Natura 2000 areas, areas facing natural or
other specific constraints, High Nature Value farmland, and the state of European landscapes;
• Improving water management, including fertiliser and pesticide management;
• Preventing soil erosion and improving soil management.
In the light of the “green” elements that are now included in the programming period 2014-2020, the new CAP is
expected to actively contribute to maintaining the rural landscape, to combating biodiversity loss and to
mitigating/adapting to climate change (COM(2010) 672 final).
By providing the information needed to characterise agricultural lands in terms of the provision of multiple
ecosystem services and the maintenance and enhancement of biodiversity, the MAES process can facilitate and
enable the delivery of the “green” elements of the revised CAP. Moreover, besides information on provisioning
ecosystem services in terms of agricultural production, the role of agro-ecosystems in supplying regulating and
cultural ecosystem services will be made explicit through the MAES process. This can support the discussion on
public goods provided by agriculture and the assessment of trade-offs for a better use of resources and an
improved spatial targeting of policy measures (2). The results from the MAES initiative will also enable the
identification of areas where regulating ecosystem services supporting agricultural production (e.g. pollination,
bio-control) should be enhanced (3). Finally, synergies between “greening” measures, in particular Ecological
Focus Areas, and the deployment of the Green Infrastructure in agricultural landscapes can be identified.
11 | P a g eMapping and Assessment of Ecosystems and their Services 1.2.3 Forest policy Forests cover around 40% of the EU land surface. The many interlinked roles of forest, from biodiversity conservation to timber provision, explain the multi-sectoral and multi-objective character of forest policies. There is a long history of EU measures supporting forest-related activities contributing to implementing sustainable forest management: coordination with Member States is developed mainly through the Standing Forestry Committee (SFC). In September 2013, a new EU Forest Strategy for forest and the forest-based sector3 was presented with a new framework and wider scope in which forest protection, biodiversity conservation and the sustainable use and delivery of forest ecosystem services are addressed. Under the Strategy, sustainable forest management (SFM) is defined following MCPFE4 criteria: “SFM means using forests and forest land in a way, and at a rate, that maintains their biodiversity, productivity, regeneration capacity, vitality and their potential to fulfil, now and in the future, relevant ecological, economic and social functions, at local, national, and global levels, and that does not cause damage to other ecosystems”. SFM addresses current pressures on European forests from two different angles. Firstly, threats from environmental changes are expected to increase in the next years and decades, such as increasing water scarcity and pests, spread of invasive alien species, habitat loss, increased risk of forest fires, etc. Secondly, human-induced pressures such as forest fragmentation and over-exploitation of forest resources could impact negatively the provision, health and vitality of forest ecosystems. With this in mind the new Forest Strategy promotes a coherent and holistic approach of forest management covering i) the multiple benefits and services of forests; ii) internal and external forest-policy issues and iii) the complete forest value-chain. From this perspective assessing, mapping and accounting of forest ecosystem services as foreseen under MAES, provides an integrated and systemic view of the forest system and the interlinked effects of the different pressures on forests. Ensuring forest protection and the delivery of forest ecosystem services is the overarching aim of the Strategy. 1.2.4 Water policy The MAES initiative is strongly linked to the implementation of EU legislation on freshwater resources, recently reviewed and synthesised in the Blueprint to Safeguard Europe's Water Resources5. The effective implementation of legislation such as the Water Framework Directive, the Groundwater Directive and the Floods Directive is sustained by high quality and comprehensive information on the quantity and quality of freshwater resources. This legislation has extensive provisions for the collection and reporting of this information. The MAES process will serve to integrate this information into a wider assessment of ecosystem condition and ecosystem services covering all ecosystem types. The outputs from the MAES process will complement the information currently available on freshwater resources and facilitate a more effective protection and management of those resources. In the light of the mutual interests and common concerns, the Nature and Water Directors of the Member States have invited the Commission in collaboration with the Member States and the EEA to review, by mid-2014 the linkages between the mapping and assessment of ecosystems and of their services (MAES) and the work 3 http://eur-lex.europa.eu/LexUriServ/LexUriServ.do?uri=COM:2013:0659:FIN:en:PDF 4 Ministerial Conference on the Protection of Forests in Europe; http://www.foresteurope.org/ 5 COM(2012) 673 final - A Blueprint to Safeguard Europe's Water Resources. http://ec.europa.eu/environment/water/blueprint/index_en.htm 12 | P a g e
Mapping and Assessment of Ecosystems and their Services

undertaken under the Water Legislation and to make recommendations concerning the priority operational
actions that should be taken to improve integration and promote synergies.

1.2.5 Climate action
Healthy, productive and resilient ecosystems are also essential if we are to combat climate change effectively.
Current EU Biodiversity policy identifies carbon sequestration and the important role that ecosystems play in
mitigating climate change and adapting to its impacts as essential ecosystem services. The recent
communication on climate change adaptation6 places considerable emphasis on nature-based solutions. There
are strong synergies between the policies on climate change and biodiversity. The work being carried out under
MAES will allow us to know more about the condition of Europe’s ecosystems and to identify opportunities for
increasing the contribution to climate change mitigation and adaptation. In particular, the mapping and
assessment of several protective functions of ecosystems preventing downstream and coastal flooding or
droughts are clear examples of how increased knowledge on the current distribution and state of ecosystems and
their services helps support climate adaptation.

1.2.6 Marine policy
Marine and coastal ecosystems provide an essential contribution to human wellbeing in multiple ways. From a
European policy perspective, increasing threats to the marine environment resulting from human use have been
recognized, and a number of policies are in place, aiming at managing/reducing the impact of human activities on
the marine environment.

The Marine Strategy Framework Directive (MSFD) is the latest and foremost piece of legislation, focusing on
achieving/maintaining good environmental status (GES) of European marine waters by 2020. The MSFD requires
an assessment on the use of marine environments and the development of action plans and explicit measures to
achieve GES. Before their adoption, robustness of these measures needs to be determined, inter alia, though
cost-effectiveness and cost-benefit analysis. MSFD has also a strong link with the Habitats and Birds Directives,
which provide the legal basis for the designation of marine protected areas. This linkage lends further strength to
the need for the application of spatially based conservation measures to protect marine biodiversity in marine
environments, both at EU and global level.

Criteria set down in the MSFD for the attainment of GES build upon existing obligations arising directly from the
Water Framework Directive (WFD), under which umbrella fall transitional and coastal waters. In this sense, for
example, the initial assessment of the environmental status of marine waters under the MSFD must take into
account the results of the assessment of coastal and transitional waters under the WFD. Similarly, the program
of measures adopted by Member States (MS) as part of their marine strategies to achieve GES must take into
account relevant measures already adopted under the WFD.

Among others, the MSFD is aimed at fulfilling a number of obligations that arise under the United Nations
Convention on the Law of the Sea (UNCLOS), namely the protection and preservation rare and/or fragile
ecosystems as well as the habitat of depleted, threatened or endangered forms of marine life. On a regional
basis, the MSFD is complemented by the obligations set forth under a number of regional agreements (the
Convention on the Protection of the Marine Environment of the Baltic Sea Area, the Convention for the Protection

6   http://ec.europa.eu/clima/policies/adaptation/what/docs/com_2013_216_en.pdf

                                                                                                       13 | P a g e
Mapping and Assessment of Ecosystems and their Services of the Marine Environment of the North-East Atlantic, the Convention for the Protection of the Marine Environment and the Coastal Region of the Mediterranean, the Protocol for the Protection of the Mediterranean Sea Against Pollution from Land-Based Sources). Such conventions can provide a wealth of data and information relevant to the mapping and assessment of ecosystems and the services they provide. Thus knowledge made available through the data gathering and reporting associated with the MSFD, the WFD and other nature legislation (not to mention the various Regional Sea Conventions) complements data collection and reporting under the MAES process, enhancing and facilitating harmonised policy and decision making. Target 4 of the EU 2020 Biodiversity Strategy also concerns the integration of biodiversity issues into the development and implementation of EU Maritime and Fisheries policy. Information coming from the full implementation of the Maritime and (new) Fisheries Policy will be paramount for the build-up of a detailed knowledge base in view of the full implementation of target 4 of the Biodiversity Strategy. In particular, the Integrated Maritime Policy aims to provide a coherent approach to maritime issues, increasing coordination between cross-cutting policies, such as blue growth, marine data and knowledge, maritime spatial planning, integrated maritime surveillance. In relation to fisheries management (the MSFD limiting the power of MS to making recommendations to the Commission when action cannot be taken at a national level and where EU measures are needed), the latest CFP (effective since 1 January 2014) aims to bring fish stocks back to sustainable levels and put an end to wasteful fishing practices. The CFP provides for the adoption of a broad range of EU legal measures concerning, inter alia the management of living aquatic resources and technical restrictions on the environmental impact of fishing. It is already foreseen that achieving the objectives of the MSFD may entail the adoption of additional fisheries management measures under the CFP, with a view to maintaining or restoring fish stocks, as well as to ensure the structure and functioning of ecosystems. Indeed, one of the qualitative criteria for determining GES under the MSFD is focused on ensuring that the populations of all commercially exploited fish and shellfish are within safe biological limits and exhibit characteristics that are consistent with healthy stocks. The success of EU Maritime and Fisheries policy is inextricably linked to the health and resilience of the natural systems that sustain our economic activities. Reporting from this policy will also contribute to the gathering of high quality and reliable information for the assessment of the condition of European marine ecosystems and the services that these ecosystems provide. Although the harmonisation of marine and maritime policy at EU level in terms of objectives and data requirements is still far from complete, the MAES process will complement the data collection and reporting activities under the individual pieces of legislation and will enhance and facilitate joined- up decision taking and policy making. 1.2.7 Regional policy Working with nature can offer cost-effective solutions to many of the challenges facing society such as adaptation to climate change, protection against extreme weather events and natural disasters, increased food and water security, better living conditions, improved social cohesion as well as business and development opportunities. Optimising the delivery of these ecosystem services will contribute significantly to regional and urban development across the Union. High quality and consistent data on the condition of our ecosystems and the services that they produce is essential for making the right decisions for future investments and the MAES initiative will play a major role in ensuring the timely provision of such data. 14 | P a g e
Mapping and Assessment of Ecosystems and their Services

1.2.8 Research
The on-going efforts on the mapping and assessment of ecosystems and ecosystem services are totally
dependent upon reliable data and good science. This action needs to integrate growing scientific evidence on
biodiversity as a key component for resilient ecosystems and delivery of ecosystem services. It is the basis for
valuing the multifunctionality of ecosystems for sustaining long-term human well-being. The integration of these
concerns in the Horizon 2020 research programme and the further engagement with the scientific community
will strengthen the knowledge and evidence base for policy and decision-making.

1.3 Experience based on country cases
DG Environment supports the practical implementation of Action 5 in the Member States not only via the working
group MAES but additionally through a service contract (MESEU - Mapping of Ecosystems and their Services in
the EU and its Member States). The aim of this contract is to provide assistance on mapping and assessment of
the state of ecosystems and their services in their national territories by making the best use of studies and work
already undertaken at EU and MS levels. A first report7 provides an analysis of several ongoing or recently
completed ecosystem assessments in Europe. The country cases are Wales (UK), Flanders and Wallonia (Belgium),
Spain, Austria, Switzerland, the Wadden Sea (The Netherlands), and several Balkan countries. The most important
outcomes from the country cases are the following:

      •   The degree of engagement of national governments varies widely across the Member States. Only in the
          case of Spain and the UK were ecosystem assessments undertaken on the basis of a national
          government initiative. Therefore, Action 5 can be seen as an incentive for other countries to
          engage biodiversity policy departments and agencies.
      •   The country case studies provide a useful body of material. However, frameworks, indicators and
          quantification methods differ widely and comparisons across the different case studies are therefore
          very difficult. The hierarchical structure of the CICES classification for ecosystem services
          facilitates the translation of available data and results in a common European
          classification8.
      •   All the case studies used land cover/ land use data as a basis for mapping. In many cases, this was
          combined with other, more detailed layers to map or model particular ecosystems. The present
          document provides a link to a pan-European ecosystem map that can be used for spatial
          ecosystem assessments (see chapter 3).
      •   Mapping precision and accuracy depend on time and material resources and data availability. The
          tiered approach to mapping and assessment based on the MESEU project results is adapted
          to accommodate the different situations in the Member States (see chapter 7).

7   https://circabc.europa.eu/w/browse/872fa6f9-7e69-429e-9696-2d117c66f66b
8   In the frame of the FP7 project OpenNESS a typology translator is available via the HUGIN website at:
http://openness.hugin.com/example/cices. It translates CICES to other classifications including MA and
TEEB. Also the first MAES paper (1) includes a cross walk between the different classification systems.

                                                                                                       15 | P a g e
Mapping and Assessment of Ecosystems and their Services
In the context of the MESEU contract a survey was carried out of Member States’ assessments of their own
needs in relation to the work on mapping and assessment of ecosystems and ecosystem services. Box 1
summarizes the most important results.
Box 1. Where is guidance most useful. Outcomes from survey of the Member States
Mapping and assessment is an ongoing process in most of the countries but needs targeted support. From the 15
countries responding:
• About 80% have started the MAES process at national level, regional or case-study level.
• Mapping is already happening, but not uniformly developed;
• 80% include stakeholders in the assessment (policy makers, NGO’s, scientists, citizens, etc.).
• Expertise is available but government (financial) support and EU based guidance (e.g. a common approach) are needed.
Methods: The main ecosystems and ecosystem services are covered using national data as well as European sources.
In particular the CICES classification and CORINE Land Cover are used. The main problems encountered are lack of
consistent approaches among all parties involved, lack of relevant data and limited resources. Based on the replies
from the 15 responding countries, the results of the survey led to the following conclusions::
• National assessments mostly cover forests, followed by agro-ecosystems, freshwater ecosystems and marine
ecosystems. Other ecosystems mentioned are: urban systems, heathland, mountains, arid zones, and peat-lands (as part
of wetlands).
• The most assessed ecosystem services are cultural services (tourism and recreation), followed by provisioning services
(nutrition and materials such as timber) and regulating and maintenance services (regulation of water flows, climate
and extreme events).
• Indicators are mainly based on national statistics;
• Common approaches across the EU are the CICES classification (60%), the CORINE Land Cover dataset and the reporting
streams under the EU environmental directives.
Technical aspects: guidance is needed. From the 15 replies of the responding countries, the following needs were expressed:
• Guidance is needed with respect to methods for mapping and assessment including GIS methods and data sources for
mapping and assessment;
• The common elements in mapping approaches are the use of land cover/ land use data and the use of ESRI’s ArcGIS.
• The INSPIRE directive is not yet considered when mapping.
1.3.1 Key challenges
This report aims to synthesise what information is available at EU and Member State scales in terms of data and
indicators in order to facilitate Member States' work when:
• identifying and prioritising which ecosystems and services to map and assess;
• identifying what data are available or needed;
• making optimal use of EU environmental reporting streams;
• helping implement other actions of the EU 2020 Biodiversity Strategy;
• guiding the use of information on ecosystem services in impact assessments or in other policies;
• linking biodiversity and ecosystem condition to ecosystem services and human well-being.
16 | P a g eMapping and Assessment of Ecosystems and their Services
1.4 Structure of the report
The report is structured as follows: Chapter 2 introduces the readers to the collaborative efforts of the Member
States and EU services in order to identify the data and indicators that can be used to report under Action 5.
Chapters 3 to 6 report on the outcomes of the work on ecosystem mapping, assessment of biodiversity and
ecosystem condition, and assessment of ecosystem services, respectively. Chapter 7 introduces the readers to
ongoing efforts to account for natural capital. Chapter 8 builds on the previous chapters to support Member
States with their national assessments. Chapter 9, finally, sums up the essential conclusions and next steps.
17 | P a g eMapping and Assessment of Ecosystems and their Services
2 THE SIX PILOTS AND THE COMMON ASSESSMENT FRAMEWORK
2.1 Set up and description of the pilot studies
Participation from Member States, stakeholders and EU bodies (EC, EEA) in the pilots was made on a volunteer
basis with a view to draw on existing initiatives and resources that could be used to measure or monitor
biodiversity, ecosystem condition and ecosystem services at national and European scales. Each pilot was co-led
by a Member State and an EU body. Table 1 provides the list of contributing parties including some stakeholders
who commented on the outcomes or who provided additional information with regard to indicators and data
sources.
Table 1. Contributions of Member States, stakeholders and EU services to the pilots
1 2 3 4 5 6
Nature Agriculture Forest Fresh water Marine Natural Capital
Accounting
MS Lead LT BE SE FR FR BG
PT
EU Lead ENV JRC JRC JRC JRC EEA
EU members EEA EEA EEA EEA EEA ENV
JRC ENV ENV ENV ENV ESTAT
AGRI AGRI RTD
ESTAT AGRI
MS members LT AT BG AT PT DE
HU BE FI ES FR EE
BG DE ES FR FR
ES SE PT
SK PT SK
UK
BG
Stakeholders CEEBweb ELO WWF-BG WWF Oceana WWF
FACE ELO LAGOONS1
FACE ARCH2
FOREST EUROPE TPEA3
1. “Integrated water resources and coastal zone management in European lagoons in the context of climate change”, FP7 grant agreement n°
283157, http://lagoons.web.ua.pt/.
2. “Architecture and roadmap to manage multiple pressures on lagoons”, FP7 grant agreement n° 282748, http://www.arch-fp7.eu/.
3. TPEA - "Transboundary Planning in the European Atlantic”, DG MARE, grant agreement MARE/2012/08, http://www.tpeamaritime.eu/
2.2 A common approach for the ecosystem pilots
The MAES conceptual model builds on the premise that the delivery of certain ecosystem services upon which we
rely for our socio-economic development and long-term human well-being is strongly dependent on both the
spatial accessibility of ecosystems as well as on ecosystem condition. This working hypothesis has been
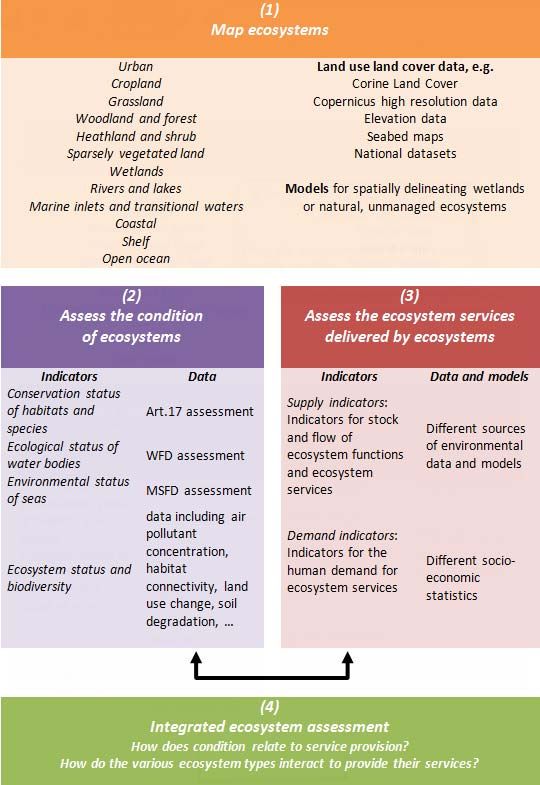
translated into a working structure that has been adopted to guide the work of the ecosystem pilot cases (Figure
2). In order to provide operational recommendations to both EU and its Member States, the proposed work
structure for the 4 ecosystem pilots is based on a 4 step approach: (i) Mapping of the concerned ecosystem; (ii)
Assessment of the condition of the ecosystem; (iii) Quantification of the services provided by the ecosystem; and
(iv) Compilation of these into an integrated ecosystem assessment (Figure 2).
18 | P a g eMapping and Assessment of Ecosystems and their Services
Introducing the pilot studies.
Pilot on habitat and species conservation status data for ecosystem
assessment. How can reported assessments on conservation status (under Habitats
Directive) be used effectively to assess the state of ecosystems and services.
Ecosystem pilots
Marine
Agro-ecosystems Forests Freshwater ecosystems
ecosystems
What indicators and data are available to map ecosystems and assess their biodiversity, condition and their
services?
Agricultural land covers European forest Lakes, rivers, wetlands Oceans, seas and
almost half of the EU ecosystems face multiple and groundwater deliver especially coastal zones
territory. Besides providing threats. Currently clean water for multiple are estimated to
food, agro-ecosystems competing socio-economic purposes and are thus contribute more than
deliver biotic materials for demands for forest vital to human well-being. 60% of the total
industrial processes and services can result in Lakes are primary economic value of the
as a source for energy multiple drivers of forest locations for summer biosphere. Yet, our
and provide important change, and may lead to recreation. Wetlands are knowledge of marine
regulating and degradation of the forest crucial in maintaining ecosystems and the
maintenance services ecosystem. Yet forests are habitats for many species services they provide is
such as pollination and key providers of almost while regulating water
not at the same level as
pest control. Furthermore all ecosystem services flows and filtering water.
their terrestrial
some agricultural provided that they are An essential question is
landscapes are a valuable managed in a sustainable understanding how
counterparts. In
source of cultural way. achieving good ecological particular, the mapping is
ecosystem services status result in the supply lagging behind. Hence,
of multiple services. this pilot is among the
first to address
indicators to map and
assess marine
ecosystem services
The pilot on natural capital accounting aims at exploring the potential for
valuation and natural capital accounting at EU and national level. This builds on the
biophysical mapping and assessment of the state of ecosystems and of their
services in the context of the EU 2020 Biodiversity Strategy using latest
developments on ecosystem accounts at global and EU level and concrete examples
in Member States.
19 | P a g eMapping and Assessment of Ecosystems and their Services
2.2.1 Map ecosystems: Identification of data for ecosystem mapping
st
The 1 MAES report (1) proposes a typology for ecosystem mapping based on the key databases available at EU
level. At the same time, the typology should allow integration of assessments on national or sub-national levels
based on more detailed classifications. The mapping of ecosystems is largely dependent on the availability of
land-cover/land-use datasets at various spatial resolutions. The most comprehensive dataset for terrestrial and
freshwater ecosystems at EU level is Corine Land Cover (CLC). The CLC dataset allows also mapping of one of
the four marine ecosystems (marine inlets and transitional waters). For the marine environment, the 1st MAES
report (1) contained a proposal to define marine ecosystem typology solely on the base of bathymetry (2D
approach). Such a rough criterion would be then complemented by other available information, at EU or MS level.
To date, EuSeaMap provides basic information for ecosystem mapping and assessment but does not yet cover all
European marine regions. However, any mapping should not be limited to the availability of land and sea cover
data only, neither at EU nor at MS level. Ecosystem mapping needs to be based on the best available data from
sub-national and national data sources at appropriate scales, to provide coherent information about ecosystems
and their characteristics additional to EU level data.
2.2.2 Assess the condition of ecosystems: Review of data and indicators for ecosystem
assessment
The EU wide assessment of the condition of the various ecosystem types requires information about drivers,
mainly land/sea use and management, and pressures such as land-take, fragmentation, pollution, climate change
as well as their impacts on the structure and function of each ecosystem type. It should make use of existing
data, mainly the reported data under EU legislation and, in particular, from assessments under Art. 17 of the
Habitats Directive and Art. 12 of the Birds Directive, the Water Framework Directive, the Marine Strategy
Framework Directive and other environmental legislation. For ecosystems without legislative reporting
framework, such as forests, either national data or European monitoring data, e.g. from the European Forest Data
Centre (EFDAC)9 or the Copernicus programme can be used. To complete and refine the ecosystem assessment,
additional information indicating habitat connectivity or other functionalities as well as information on drivers
and pressures reducing the capacity of ecosystems to provide services is needed and must be integrated in the
assessment. Again, national and sub-national data sources need to be used to provide more detailed and
additional information to describe the variability of ecosystem condition across Europe.
2.2.3 Map and assess ecosystem services: Reference frame for ecosystem services
mapping and assessment.
The 1st MAES report (1) proposed the CICES v4.3 classification as typology for ecosystem services to ensure a
coherent approach across EU Member States and to support their integration into (ecosystem) accounting
systems. The four ecosystem pilots have used this classification to organise the data collection and to compare
outcomes.
9
http://forest.jrc.ec.europa.eu/efdac/
20 | P a g eMapping and Assessment of Ecosystems and their Services
2.2.4 Integration of the two assessments: Reference frame linking condition of
ecosystems to their services.
The capacity of an ecosystem to deliver different ecosystem services is related to the condition of this
ecosystem. In a “healthy state”, an ecosystem may provide more and a sustained flow of a variety of services-
compared to an ecosystem, which is managed to provide only a maximum amount of one specific service, e.g.
fish, crops or timber. As a result, the overall capacity of such a system to provide services will be higher.
Ecosystems in a “healthy state” are considered resilient systems, which are able to recover after disturbance and
they are generally characterized by higher species diversity and a balanced trophic community.
Every ecosystem delivers multiple services. The mapping work is therefore not targeted to identify the maximum
potential of one service but to understand the spatial delivery of multiple services by interconnected ecosystems.
The capacity of an ecosystem to deliver ecosystem services should be measurable in quantitative units.
2.2.5 Working procedure
The four thematic pilots followed a coordinated approach for information gathering, review and compiling of
indicator lists. The approach is structured around four main steps.
Firstly, the Pilot leaders applied a table (referred to hereafter as the “MAES matrix”) including all ecosystem
services using CICES v4.3 as baseline classification. An EU-wide MAES matrix of ecosystem services was
populated from a literature review and assessing data and indicators available in the European data centres.
After completion and agreement with the Pilot leaders, this matrix was sent to participating Commission services
and stakeholders for review, addition of further data and agreement.
In a second step, participant MS and stakeholders from international and national organisations were requested
to populate a country-level MAES matrix with relevant data and indicators available in their country. The resulting
MAES matrices are available in CIRCABC.
The high level of detail and wide scope of the pilots yielded MAES matrices that required a supplementary level
of synthesis for better access and readability. Thus, in a third step a series of “MAES cards” were implemented
representing a synthesis of the information collected by the European and country-level MAES matrices. Each
card focussed on one service at a time and includes information on four aspects: reporting body, data availability
of the indicator (six levels), units of measurement and compiling agency. The cards are more accessible and
“readable” than the information included in the MAES matrices. The cards of the ecosystem pilots are included in
a separate supplement to this report10 and could be used as a screening tool for deciding what indicators are
available for mapping and assessing biodiversity, ecosystem condition and ecosystem services. The cards were
reviewed and agreed in a technical workshop held at the JRC in Ispra on 18 and 19 November 2013. The
workshop brought together Member States, stakeholders and experts, members of the pilots, who contributed in
several technical working sessions to the further refinement and agreement on the information included in the
cards.
10
https://circabc.europa.eu/w/browse/837b3dda-6b1a-4316-a554-723e31062c8f
21 | P a g eYou can also read