Unpacking Urban Data In South African Municipalities - SALGA
←
→
Page content transcription
If your browser does not render page correctly, please read the page content below

March 2020 | 6th Edition

 Unpacking Urban Data In South
 African Municipalities

   Improving service delivery        Opening up Financial Data   Financial and Non-Financial
 and governance through data           to Empower Citizens:        Census of Municipalities:
  and technology: Cases from              Vulekamali and          Key data and insights from
eThekwini, Ekurhuleni and Blouberg       Municipal Money            Statistics South Africa
Johannesburg, South Africa

in.KNOW.vation
A Knowledge & Innovation
Publication
March 2020

SALGA National Office
Menlyn Corporate Park, Block B
175 Corobay Avenue, Cnr Garsfontein and Corobay
Waterkloof Glen Ext 11, Pretoria
Tel: 012 369 8000
Fax: 012 369 8001
Email: info@salga.org.za

www.salga.org.za

Editors
Mapule Letshweni
Ntsakisi Madzibane
Kwena Mashita

CONTENTS
         Use of data and technology to improve service delivery and governance:
         cases from eThekwini, Ekurhuleni and Blouberg

    8    Municipalities are leveraging technology solutions to improve municipal services and the living
         experience of residents. eThekwini Metropolitan Municipality scooped the 2019 Public Sector Innovator
         of the Year, for using social media (Whatsapp) to open up access to municipal services to more citizens.
         Ekurhuleni gained significant improvements through their E-Recruitment and Blouberg effectively
         manages employee time inside and outside municipal offices.

         SALGA mobile application for violence reporting, protests and
         social unrest

    14   SALGA remains concerned with the levels of violence in municipalities that in some cases leads to the
         killing of councillors and officials. Through the use of data and technology, SALGA, with the support of
         the European Union has introduced a mobile application to provide timely and easily accessible data and
         intelligence on violence, protests and social unrest to manage risks and safe lives and property.

         Unpacking South Africa’s urban data environment
         Municipalities use data to improve decision making and deliver results that meet the needs of citizens.

    20   By using data in this way, municipalities can base policy and planning on actual, live, and updated data.
         The article by South African Cities Network provides context on how and why open data and technology
         is important for municipalities; unpacks the Common Data Framework for Cities (CDFC); and showcases
         use-case example of how cities use data to inform decision making.

         Opening up financial data to empower citizens: Vulekamali and
         Municipal Money

    25   South Africa is a founding member of the multilateral Open Government Partnership (OGP) initiative that
         aims to secure concrete commitments from government to promote transparency, empower citizens,
         fight corruption, and harness new technologies to strengthen governance. Vulekamali opens up national
         and provincial budgets while Municipal Money provides municipal financial information. Both tools
         promote accountably, transparency, active citizenry and good governance.

         Financial and non-financial census of municipalities: key data and
         insights from Statistics South Africa

    30   Statistics South Africa produces two important census reports on municipalities: Financial Census of
         Municipalities and Non-Financial Census of Municipalities. The census reports provide valuable data and
         insights to municipalities, researchers, policymakers, economists and other users to analyse and assess
         the state of local government to make required decisions and improvements.

4
Indicators for the local systems of innovation
     National Advisory Council on Innovation (NACI) provides valuable information on innovation indicators

34   for local systems of innovation. These systems typically involve government, private sector, non-profit
     organisations, academia and international partners. The most common one is the National System of
     Innovation (NSI), wherein stakeholders work towards achieving common goals around the use of science,
     technology and innovation (STI) to achieve national objectives.

     Learning from Singapore, Melbourne and Barcelona
     Municipal governments around the world are adopting data and analytics to improve planning and

37   operations. Singapore’s data strategy targets regional growth; Melbourne cuts water treatment costs using
     Artificial Intelligence; and Barcelona’s smart city strategy is giving power to the people. These cities are
     offering important lessons for South African municipalities on the use of data and technology to redefine
     living spaces and experiences of citizens.

     Creating public value through proper records management
     Auditor-General of South Africa (AGSA) highlights the importance of records management for

46   municipalities. In their day-today operations, municipalities produce increasingly large amounts of
     information and consequently greater volumes of records. It, therefore, becomes imperative for accounting
     officers to invest more resources, both financial and human, to ensure the development and effective
     implementation of records management programmes within municipalities.

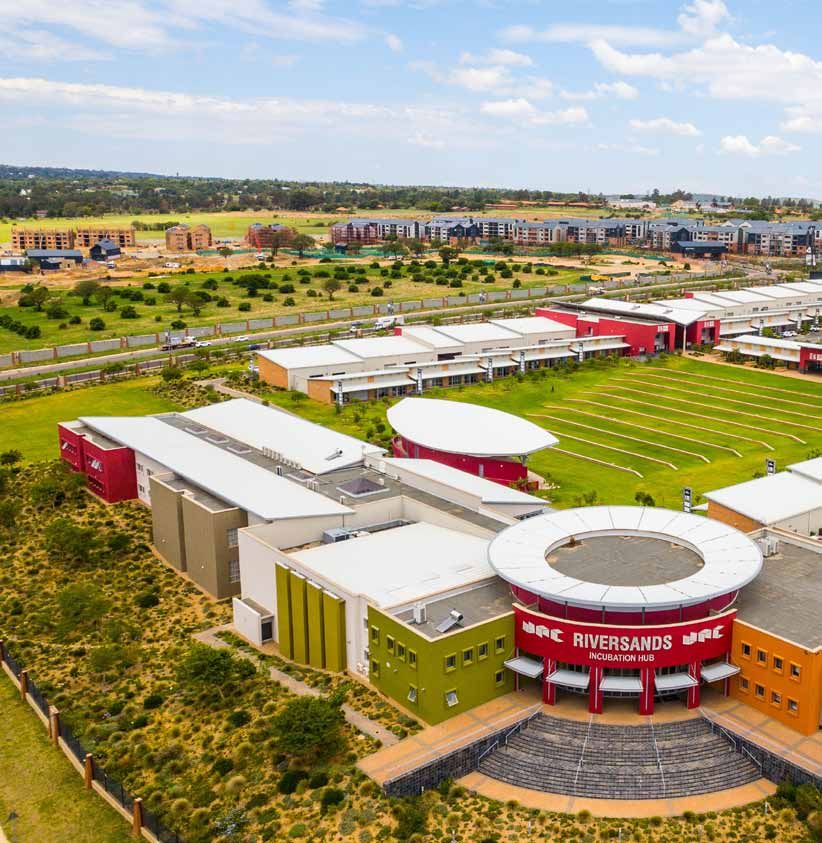
     Riversands Incubation Hub: where entrepreneurs grow businesses
     Riversands Incubation Hub is supporting over 160 SMEs by providing secure, formal premises as well as

48   guidance and mentorship in areas such as finance and marketing. Situated in the North of Johannesburg,
     adjacent to Steyn City and a stone’s throw from Diepsloot, Riversands Incubation Hub plays a crucial role in
     fostering Innovation and providing an enabling environment to grow start-ups and enterprises.

     References

53

                                                                                                        5
INTRODUCTION

Welcome to the sixth edition of in.KNOW.vation, an annual               Statistics South Africa produces two important census reports on
publication of the South African Local Government Association           municipalities: Financial Census of Municipalities and Non-Financial
(SALGA) that shares, celebrates and profiles innovations, excellence    Census of Municipalities. The census reports provide valuable
and partnerships relevant to local government. in.KNOW.vation           data and insights to municipalities, researchers, policymakers,
aims to accelerate knowledge sharing and learning to allow for the      economists and other users to analyse and assess the state of local
replication of good practices and innovation solutions in line with     government to make the required decisions and improvements.
SALGA’s mandates of capacity building, profiling, knowledge and
information-sharing.                                                    National Treasury is keeping up the commitment to open data to
                                                                        citizens with Vulekamali and Municipal Money. Vulekamali opens
Data is increasingly becoming important for the running of              up national and provincial budgets while Municipal Money provides
organisations and countries. For municipalities, data is important to   municipal financial information. Both tools promote accountability,
inform planning and implementation of municipal programme and           transparency, active citizenry and good governance. While there still
services. In this edition, we provide valuable information on the use   a need to build data infrastructure and capabilities for municipalities,
of data and technology in a municipal context. The South African        these resources demonstrate some commendable progress to
Cites Network (SACN) provides a detailed overview of urban data         build on.
in South African Municipalities, highlights the importance of open
data in informing evidence-based decision making, and showcase          SALGA heartily congratulates eThekwini Metropolitan Municipality
tools and use-case examples.                                            for scooping the 2019 Public Sector Innovator of the Year Award for

     6
Data is
                                                                                                        increasingly
                                                                                                   becoming important
                                                                                                      for the running
                                                                                                     of organisations
                                                                                                    and countries. For
                                                                                                       municipalities,
                                                                                                     data is important
                                                                                                    to inform planning
                                                                                                   and implementation
the Whatsapp Fault Reporting Line project.         management for municipalities while                  of municipal
The use of Whatsapp, commonly available            National Advisory Council on Innovation
social media tool, has significantly increased     (NACI) provides valuable information on
                                                                                                      programme and
the number of citizens who have access to the      innovation indicators for local systems of             services.
municipality, especially from rural and informal   innovation. Incubation hubs like Riversands
areas while saving municipal resources by          play a crucial role in fostering Innovation,
addressing water loses, potholes and oil leaks     providing an enabling environment to grow
speedily. This edition profiles Ekurhuleni’s       start-ups and enterprises, which is good for
E-Recruitment, which improved recruitment          municipalities.
process, cutting on paper, time and resources
and Blouberg’ s Time and Attendance System,        SALGA remains concerned
which effectively manages employee time
                                                   with the level of violence in
inside and outside municipal offices. The use
of these technologies introduced efficiencies,     municipalities that in some
accountability and good governance that            cases leads to the killing of
improves delivery of services.
                                                   councillors and officials.
Municipal governments around the world
                                                   Through the use of data and technology,
are adopting data and analytics to improve
                                                   SALGA with the support of the European
planning and operations. Singapore’s data
                                                   Union, has introduced a mobile application to
strategy targets regional growth; Melbourne
                                                   provide timely and easily accessible data and
cuts water treatment costs using Artificial
                                                   intelligence on violence, protests and social
Intelligence; and Barcelona’s smart city
                                                   unrest to manage risks and safe lives and
strategy is giving power to the people. These
                                                   property.
cities are offering major lessons for South
African municipalities on the use of data          We hope this publication will inspire and encourage more
and technology to redefine living spaces and
experiences of citizens.                           data driven innovations and technologies that benefit
Auditor General of South Africa (AGSA)
                                                   local government, its stakeholders and partners.
highlights the importance of records               Enjoy the read!

                                                                                                                   7
Improving service delivery and governance
  through data and technology:
  Cases from eThekwini, Ekurhuleni and Blouberg
Municipalities are leveraging technology solutions to improve          E-Recruitment improved recruitment processes, cutting on paper,
municipal services and the living experience of residents. In this     time and resources. Blouberg’s Time and Attendance System
article, we profile the 2019 Public Sector Innovator of the Year,      effectively manages employee time inside and outside municipal
eThekwini Metropolitan Municipality, for using social media            offices. The system saves time and money by putting an end to
(whatsapp) to open up access to municipal services to more citizens,   inaccurate reporting, buddy punching, absenteeism, tardiness and
particularly from rural and informal settlements.                      overpayment.

E-Recruitment System of Ekurhuleni Metropolitan Municipality           The use of these technologies introduced efficiency, accountability
and the Time and Attendance System of Blouberg Local                   and good governance that improves delivery of services. Other
Municipality were shared at the 2nd Annual Local Government            municipalities can learn more from use of these technologies by
Talent Management Seminar of January 2020, hosted by SALGA.            eThekwini, Ekurhuleni and Blouberg.

Whatsapp Fault Reporting Line - eThekwini Metropolitan Municipality,
KwaZulu Natal - (2019 Public Sector Innovator of the Year - CPSI Awards)
Contribution by CPSI & eThekwini Metropolitan Municipality (Aaron Mfunda and Bongani Hlope)

2019 CPSI Public Sector Innovator of the Year: eThekwini Metropolitan Municipality

     8
a) Project Overview                                                        c) Impact of the Project
The eThekwini Engineering Contact Centre is a 24 hours, 7 days a           The Municipality receives and responds to over 5000 WhatsApp
week platform provided by eThekwini Municipality for citizens to           messages monthly. These messages are from citizens reporting
report service delivery issues which include, but not limited to: water    various faults such as leaks, burst pipes, potholes, blocked sewer and
leaks, burst pipes, illegal connections, blocked sewer drains, water       storm water drains, faulty traffic lights or query their utility accounts.
supply interruptions, storm water drains, leaking meters, damaged          The project provides an affordable and convenient platform for citizens
standpipes, road spillages, faulty traffic lights, road maintenance        to report instead of waiting in long queues or telephone. Furthermore,
issues and query their utility bills. The municipality has the following   citizens can simply take pictures or send location instead of spending
channels available for citizens to report faults: Telephone; SMS line;     time explaining what they are reporting and giving directions. The
E-mail; and Walk-in Centers.                                               Municipality has rolled out free WIFI connections in various areas,
Inputs from citizens in various consultative platforms such as Budget      making it easy for citizens to report from their particular areas, thus
Hearings; Masakhane Roadshows; Focus Groups and User Platforms;            saving their hard-earned money which they would otherwise have to
as well as ward based community meetings attended by the                   use for airtime and data.
Municipality’s Education and Awareness as well as Community Liaison
                                                                           The project also increased the number of citizens who have access to
Officers, resulted in the municipality taking a decision to investigate
                                                                           the municipality, especially the poor from rural and informal areas.
and explore additional ways to make it simpler, cost-effective and
                                                                           The municipality saves money on areas such as water loss as leaks
more convenient for citizens to communicate with the Municipality
                                                                           are reported timeously, accident claims as potholes, oil spillages and
over and above the existing communication platforms.
                                                                           faulty traffic lights are reported timeously. Citizens are less frustrated
For example, citizens were forced to use their hard-earned money           as they have access to the municipality at the convenience of their
to travel to the centers to report issues to the City as many of them      homes. Other benefits of this innovation include the following:
do not have access to e-mails. Furthermore, the City suffered from
huge water losses due to water leaks not being reported timeously.          •	The City also benefits in that plumbers and technicians
Plumbers would take hours trying to find the area where the burst              do not waste time driving around to find faults. Locations
or leaking pipe or water meter is. To address these and other issues,          take them straight to points which are affected, resulting in
the WhatsApp Messenger was added to the list of channels of                    cost-effectiveness and optimal utilization of Municipality’s
communication.                                                                 resources;
                                                                            •	Citizens have their chat history with the City which is kept
b) The Innovation                                                              for reference on unresolved historical issues which provides
WhatsApp Messenger is a proprietary, cross platform, encrypted                 convenience and positively impacts the maintenance
instant messaging client for smartphones with a user base of over 1            programme as planned by the Municipality;
billion users in 2017. It is a communication tool mostly used by people     •	Citizens can also be asked to take pictures of the leaks or bursts
both in rural, informal and urban areas. A citizen sends a picture,            so correct coding of faults will be done at capturing stage which
road name and the Municipality is able to log a fault and issue a              assists in optimally deploying the correct resource to resolve the
reference number through the Engineering Contact Centre where the              fault;
WhatsApp platform is administered. The project has been operational
for three years, having been launched in 2016. The Contact Centre           •	Citizens are able to communicate with the Municipality with
ensures that WhatsApp messages are read and responded to within                regard to service delivery issues at an extremely minimal cost but
hours of being received. As per council resolution, both isiZulu and           still have issues resolved more promptly for their convenience
English are accepted as a means of communication in this facility.             and improved quality of life which is one of the core strategic
                                                                               pillars of the Municipality.
eThekwini Municipality is known to be the first
public service entity in South Africa to use                                The municipality saves money on
WhatsApp as an official business communication                              areas such as water loss as leaks
tool to communicate with citizens in South Africa.                          are reported timeously, accident
Consolidating the social wage through reliable                              claims as potholes, oil spillages
and quality basic services, the project is original                         and faulty traffic lights are
as it has not been implemented by any other
                                                                            reported timeously.
government entity.

                                                                                                                                             9
d) Sustainability                                                            Another challenge is the fact that WhatsApp is a privately-owned
                                                                             App, therefore, the Municipality is in the process of establishing its
Since its launch in 2016, a special E-Services Department was
                                                                             own App to do the same work. Good lessons have been learned in
established within the Engineering Contact Centre, which comprises
                                                                             providing an easier, cheap and convenient platform for citizens to
of about 15 staff members who were trained extensively on the
                                                                             interact with government.
usage of social media as a formal business tool. Furthermore, there is
institutional memory in the form of training and other documentation         g) Recognition
to ensure long term sustainability of the project.
                                                                             a) CPSI Public Sector Innovator of 2019
e) Replicability                                                             b) CPSI Best Citizen-Focused Innovation 2019
                                                                             c)	Gold Award for Best Implemented Project in the 2016/2017
The project can be replicated. Various entities have visited eThekwini           Financial Year, KwaZulu Natal Premier’s Service Excellence Awards
Municipality to benchmark with an intention to replicate in order to
improve service delivery.                                                    h) Contact Details
                                                                               Mr. Bongani Hlophe                     Mr. Aaron Mfunda
f) Challenges And Lessons
                                                                               Manager: Contact Centre Water          Head Of Department (Customer
The WhatsApp Fault Reporting line has a turnaround time of two                 and Sanitation                         Services) Water and Sanitation
hours for responding to citizens. The biggest challenge is the                 Tel: 031 311 8741                      Tel: 031 311 8603
expectation from citizens to respond faster.                                   Bongani.Hlophe@durban.gov.za           Aaron.Mfunda@durban.gov.za

2019 Public Sector Innovation Awards
                                                                             intelligence, ICT to leverage data to significantly improve service delivery.
                                                                             Recognition was given to: Vulekamali, The National Treasury and Usage
                                                                             of Drones for Photography of Infrastructure Sites, North West.
                                                                             Trailblazers: These are coders in the public sector who are developing
 The Centre for Public Service Innovation (CPSI) hosts the Annual Public     in-house solutions to solve service delivery challenges without relying
 Sector Innovation Awards Ceremony, a platform to unearth, nurture,          on “off-the-shelf-solutions.
 reward innovative solutions that improve service delivery and facilitate    Mr Eddie Lerobane, Limpopo, Office of the Premier
 the replication/scaling-up of these innovations within the public sector.   Mr Bonolo Monye, North West, North West Provincial Treasury
 The awards targets all three spheres of government – national, provincial   Mr Xolani Phakathi KwaZulu-Natal, Department of Health
 and local, as well as partners from the private sector and academia.
                                                                             Special Ministerial Awards:
 In 2019 the CPSI hosted the 17th Public Sector Innovation Awards
                                                                             •	Mokwakwaila Gaming Awareness, Limpopo. Through this initiative,
 Ceremony in November 2019 in Boksburg, Ekurhuleni Province where
                                                                                safety campaigns were conducted to create awareness about this
 the following deserving projects were recognised and awarded by the
                                                                                scourge. Furthermore, a number of illegal gambling machines were
 Minister for Public Service and Administration.
                                                                                confiscated and handed over to the Limpopo Gambling Board
 Category A: Innovative solutions reducing the cost of delivering            •	Youth Citizens Action Programme, Gauteng, The Y-CAP, as it is
 services: rewards innovators who “do more with less”.                          commonly known, was borne out of a youth dialogue to empower
 Winner: The North West Department of Economic Development,                     and motivate youth to be active citizens while at school. This initiative
 Environment, Conservation and Tourism developed the National                   is learner-led has reached over 32 000 learners in over 4000 schools
 Integrated Permit Administration System, an online application system          since 2010.
 to issue and manage fauna and flora permits in the province.
                                                                             Public Sector Innovator of the Year
 Category B: Citizen-Focused Innovations: focuses on the use of ICTs         Winners from the three categories contest for the prestigious Public
 and non-ICT solutions to improve efficiency and effectiveness of service    Sector Innovator of the Year Award. The 2019 Public Sector Innovator
 delivery at the coalface.                                                   of the Year: eThekwini Metropolitan Municipality for the WhatsApp
 Winner: WhatsApp Fault Reporting Line, EThekwini Metro KwaZulu-             Fault Reporting Line
 Natal. Through this initiative, the Engineering Department provides a       GEMS Health Sector Innovation Award:
 24/7/365-day direct line for reporting and communication between
                                                                             Winner: Online Application for Nursing Training: This an in-house
 citizens and the Electricity Department.
                                                                             built online system that can be used by anytime, anywhere, reducing
 Category D: Innovations Harnessing 4IR Solutions: focuses on                expenses for applicants from previously disadvantaged communities,
 frontier technologies e.g. block chain and machine learning/artificial      eliminating nepotism in the process.

    10
JOB
D A
F IN
E-Recruitment – Ekurhuleni Metropolitan Municipality, Gauteng Province
Contribution by Linda Mdwaba, Ekurhuleni Metropolitan Municipality
a) Project Overview opportunities for fraud and corruption. There was also poor document
management and archiving, no real time reporting and more capacity
E-Recruitment is an electronic, cloud-based talent management
was required to do manual capturing of CVs received.
system that offers modules for recruiting, onboarding, performance
management, learning and development, succession planning,
b) The Innovation
compensation management and its own reporting tool. The City of
Ekurhuleni has procured and implemented two modules - recruiting The E-Recruitment system allows for automated access to certified
and onboarding. The two modules allow for requisition management, 3rd parties for verification of qualifications. It sources active and
candidate sourcing and management, offer management, onboarding passive candidates across a variety of websites, job boards, referrals,
and reports. The system can be accessed by internal & external and social media. It further provides an end-to-end platform and helps
candidates who have internet access, including mobile phones. the Municipality to reach hard-to-find talent. Screening, assessment,
quick filter technologies ensure that the municipality finds and
Before acquiring the E-Recruitment, the Municipality was using selects the best talent available, including students, experienced
manual recruitment processes that took more time due to capturing professionals, and hourly workers. Interview, offer management, and
of all applicants CVs and qualifications. As a results, there was poor on- boarding tools complete the process by engaging new employees
adherence to HR recruitment policies and processes and no alignment early and making sure they are aligned with the Municipality’s values
between HR employee data and Payroll information, which created and programmes.
The process followed is outlined below:
Process Flow
Create Approve Post and Candidates Manage
Requisitions Requisitions Source Jobs Apply Online Candidates
• Requisition Type • Requisition Approval Posting Requisitions to: • Create User account • Manage Candidate
• QLF request • Career websites • Login to the system profiles
• Job Title and Job • Approval/Rejection • Job Boards • Enter details as • Manage the candidate
Description of Requisitions • Staffing agents specified in the selection workflow
• Terminate approval application flow
request
Source More Screen and Make Offer Hire
Candidates Interview Candidates
Role - Legends
HR Recruiter
Sourcing candidates through: • Screen and interview • Create offer • Hire
Candidate
• Career websites candidates • Approve Offer • Pass
information to HR
• Job Boards via eQuest • Move them through • Candidate Accepts/ HR system
• Staffing agents through selection steps and Rejects Offer Hiring Manager
Agency Portal status
11c) Impact of the Project • Create resume only once; then re-use the same profile for your
applications, profile updates done when applicable
The E-Recruitment has resulted in the following benefits for Ekurhuleni:
Improved operational efficiency: d) Replicability
• Reduced paper budget by 65% – aspiring towards a less-paper The e-Recruitment can be easily replicated in other municipalities.
environment; It is important for interested municipalities to understand their
• Improved response handling time for posting ads and receiving environments and needs and based on that, develop business
applications (for approved requisitions 4 to 6 weeks), long listing and requirements for the procurement of the system.
shortlisting processes;
• Adherence to the HR SLA (Agreed Standards with Line Departments); e) Challenges And Lessons
Some of the challenges experienced include the fact that the
Customer satisfaction:
implementation of the 2019 approved organizational structure is
• Automated Approval process for key users (Management - HODs & due to be completed by 31 March 2020, therefore requisitions are
DHs), Recruiters & Hirers still created and approved on paper instead of online. Low computer
• Approval link received via email notification literacy mainly from unskilled and semi-skilled labor forces hampers
the effective use of the system. To address this, the Municipality has
Accessibility of the system: partnered with libraries to assist the public with online applications.
• Access to the APP via mobile devices, when the network is down HR staff that were previously capturing CVs manually now assist users
you are able to work using any internet service provider on your own with online applications.
mobile;
• Burden of security and space handled by the service provider and not f) Contact Details
internally; Ms Linda Mdwaba
• No headache on archiving manual CVs office space used for storing Divisional Head: Functional Line Service- Human Resources
Linda.Mdwaba@ekurhuleni.gov.za
CVs now used accommodate more employees;
12Time and Attendance System - Blouberg the employment Act stipulated that every employer
must keep a record containing the time worked by
Local Municipality, Limpopo Province each employee. All working days are accounted
Contribution by Musiiwa Netshimbupfe, Blouberg Local for, there is no single day that will pass by without
being accounted. There is more accuracy and less
Municipality
human errors. Managers have access to accurate
a) Project Overview reporting, can access data to inform strategy, improve
leave, performance, and work culture policies of the
In the management of the employees, the Municipality relied on paper
Municipality. Overall, this system has increased the
timesheets and word of mouth. Manual management of time and
efficiency and productivity of the Municipality.
attendance was a problem and the process of keeping track of hours
worked was a complicated task. Employees were misreporting hours, d) Sustainability
allowing colleagues to clock for them. It was difficult to track field There is only once off payment, thereafter the devices become
worker attendance and meetings held outside Municipal premises. municipal property, with full support to address technical problems. It
Overall, there was poor return on employee time investment. is an integrated system linked to other HR modules such as leave and
payroll modules. The project is one of the standing items on the agenda
Accuracy was also a challenge due to employees reporting hours long
of the weekly top management meetings under corporate services and
after their work. There was illegible handwriting and often timesheets
is reported upon by the Director of corporate services. It is easy to pull
got lost or stolen. Manual time tracking was time consuming, expensive
out report on late arrivals, early departure, and absenteeism and leave
and slowed down productivity. Inefficient and outdated manual system
statistics to support municipal operations and decisions.
led to wastage of funds, especially on overtime. There was a need to
introduce a better system. e) Replicability
Blouberg Local Municipality introduced an electronic system to manage The system has enabled the Municipality to focus on outputs and
time and attendance of employees. The system exports data to a data not where and how work is done. It is user-friendly and will make
hub (HR /payroll). Data is electronically sent from a clocking terminal to day-to-day tasks easier for employees than a manual system did. It
the time tracking system. Managers can access employee attendance. has accurate GPS location, is reliable and instills disciple on its own.
Less time is spent dealing with attendance issues. The system requires The system can easily be replicated to other municipalities with easy.
fingerprint or touch screen, then verifies identity of employee, monitor Blouberg Municipality is available to provide assistance to others who
employees working hours and late arrivals, early departures, time taken wish to adopt the system.
on breaks and absenteeism.
f) Challenges And Lessons
b) The Innovation It took more than three years before the new system was implemented,
The time and attendance system is an automated system with a with a budget allocated every year but not used. It was only implemented
standalone biometric device. A biometric system simply requires an after it was part of the Key Performance Areas (KPA) of the Municipal
employee’s fingerprint, which cannot be lost or stolen. The system Manager and Director of Corporate Services. The system became one
has mobile application that is available on both Android and IOS. The of the standing items on the agenda of management meetings and
system is WIFI enabled. Employees can sign in and out anywhere with the Local Labor Forum until both parties agreed to its implementation
an ability to capture photos. The system has an accurate GPS location
For the system to be effective, all parties (management, employees
feature, which is important for work outside of municipal premises.
and labor) need to buy-in to it. It can take time to get used to new
The system is easy to use and understand.
processes, and some employees may be resistant to change due to fear
c) Impact of the Project of unknown but it is important not to give up. In the early stages, only
few employees were using the system, but with time more came on
The system has enabled the Municipality to effectively manage time of
board. Once employees saw how user friendly the system was and how
its employees. Employees simply press their finger against the scanner
much more information they have at their fingertips compared to the
or phone screen to record their time of work in various location inside
manual system, they adopted the system.
and outside municipal premises. The system saves time and money by
putting an end to inaccurate reporting, buddy punching, absenteeism, g) Contact Details
tardiness, overpayment, there is 60% savings on overtime paid.
Ms Musiiwa Netshimbupfe
The system has enabled the Municipality to comply with key pieces
Office: 015 505 7124 / Email: hr@blouberg.gov.za
of legislations and policies. Section 31(1) b of the Basic Conditions of
13SALGA Mobile Application
for violence, protests and social unrest reporting
Contributors: Nomusa Ngwenya, Rachel Manxeba, Collen Rammule, Mulanga Bodika & SALGA
Project supported by the Europe Union
SALGA Mobi is a Smart Mobile Application designed by SALGA and SALGA MOBI APP FEATURES
co-funded by the European Union with an objective to acquire and
disseminate trends and current risk information and intelligence 1) Violence/Incidents Reporting App
about municipalities. The information, insight and intelligence As a member centric organization, SALGA remains concerned about
is aimed to inform and enhance decision making processes on a the plight of Councillors and Municipal Officials. In 2016, SALGA
range of issues affecting municipalities. Timely and easily accessible conducted research looking into the killings, harm and threats
information will provide municipalities, SALGA and stakeholders with experienced by Councillors and Municipal Managers in the conduct
the intelligence they need to improve service delivery. of their duties. The findings of the research indicated that such acts
of violence were relatively high.
In particular, SALGA should use the information to support and
advise municipalities on a range of matters that require attention. The original research was augmented in 2019 to cover the entire
It should use the information to lobby for and mobilise resources country. It also looked at case studies in Kwa-Zulu Natal (Richmond)
on behalf of municipalities. Local Government Practitioners on and Western Cape (Atlantis). This allowed SALGA to develop a
the other hand, should use the information during decision making historical database of killings, threat, intimidation and damage to
processes, planning, budgeting, monitoring and evaluation and property and assets from 2000 to 2018. To say the least, the statistics
governance. including associated costs are alarming.
Other stakeholders should use the information to improve their It is against this background that this smart, user - friendly application
understanding on issues that affect municipalities and therefore was developed to track, in real-time, the threats, harm, damage to
generate programmes, interventions or measures that appropriately property and killings of Councillors (Executive Mayors, Mayors and
respond to the needs of municipalities. Ward Councillors, Speakers, Chief Whips); and Municipal Officials at
various levels of management.
14The tool tracks quantitative and geographical information by
ensuring that the basic data, reported in the form of a spreadsheet, is
extrapolated and plotted into graphs and spatial illustrations in terms
of the province, municipality, ward village and/ or township where the
incidents have taken place.
The app pinpoints the actual position of the mobile device used for
reporting, in order to enable responsive attention to problem areas.
To align with the Organised Local Government’s
vision of an improved councillor welfare dispen-
sation, SALGA ultimately plans to use the data
extracted from the app to lobby the relevant
regulators for better safety mechanisms for
councillors and senior officials.
2) Social Unrest Risk Scale
The Social Unrest Risk Scale (SURS) is a SALGA application which
identifies communities/places at sub-ward level that are at high risk
of protest. The places are identified based on their underlying socio-
economic factors. This means that the scale looked at all communities
around the country where peaceful protests took place over the past
5 years, and found commonalities in those communities in terms
of infrastructure, socio-economic conditions and similar underlying
characteristics.
DEMOGRAPHICS HOUSING
• Population density • Percent_owned_paid
• Extent_Density • Percent_Informal_Housing
• Percentage of female head of • Avg_Household_Size
households • Average_Rooms
• Percentage of head of • Avg_people_per_room
household under 20 years • Percent_Single_Household
• Age dependency
• Percentage of children
• Percentage of youth
• Percentage of foreign citizens
It is also important to note that not
INCOME MUNICIPAL SERVICE
all protest is bad. Areas with high
• Percentage of indigent • Percent_Unimproved_Pit
• Gini co-efficient • Percent_No_Refuse_Removal probability of protest (high Protest
• Percentage of unemployed • Percent_No_Piped Risk) but where protest is likely to be
head of household • Percent_No_Electricity peaceful (low Violence Risk on the
• Percentage of discouraged
EDUCATION scale) are actually areas where social
work seeker (head)
• Employment dependency
• Adults_No_Matric
cohesion is likely to be high,
• Percent_No_Internet_Access
Census variables, significant in comparing small scale area levels (SALs)
which is a good thing.
15Key Point to Note:
Underlying risk factors are not enough to lead to actual protest/unrest. The value of knowing the risk level is so that a
A trigger is required, as well as someone mobilising the community to municipality can pay particular attention to those
protest. It is also important to note that not all protest is bad. Areas
high risk areas with high violent risk and try to
with high probability of protest (high Protest Risk) but where protest is
likely to be peaceful (low Violence Risk on the scale) are actually areas identify whether there are potential triggers and
where social cohesion is likely to be high, which is a good thing. whether anyone is in the process of mobilising.
What are the Protest Risk Scale and the Violent Unrest Risk Scale?
a. The Protest Risk Scale: likelihood of protest occurring b. The Violent Unrest Risk Scale: likelihood of protest being
(either peaceful or violent). violent (if protest occurs).
Blue: low likelihood of protest. Blue: low likelihood of violent unrest.
Red: high likelihood of protest. Red: high likelihood of violent unrest.
White: uncertain likelihood of protest. White: uncertain likelihood of violent unrest.
UNREST SCALE
0 = Low 1 = High
likelihood of likelihood of
protest protest
EXAMPLE: EThekwini Results for Protest Risk (Open Street Map)
16EXAMPLE: EThekwini Results for Violent Risk (Open Street Map)
EXAMPLE: EThekwini Results for Protest and Violent Risk (Open Street Map)
How do you interpret Protest Risk Scale Unrest Risk Scale Interpretation
the results? Red Red High risk of protest; likely to be violent
Red Blue High risk of protest; likely to be peaceful
Communities marked in blue
(scale close to 0) have a low Red White High risk of protest; uncertain if will be peaceful or violent
likelihood of protest and Blue Red Low risk of protest; likely to be violent if occurs
communities marked in red
Blue Blue Low risk of protest; likely to be peaceful if occurs
(scale close to 1) have a high
likelihood of protest. Blue White Low risk of protest; uncertain if will be peaceful or violent
The scale works the same way White Red Uncertain risk of protest; likely to be violent if occurs
in identifying communities White Blue Uncertain risk of protest; likely to be peaceful if occurs
with a risk of violence. Uncertain risk of protest; uncertain if will be peaceful or violent
White White
17What do the Protest and Unrest Risk Scales allow b) When tested against a sample of past protest incidents, 96% of
you to do? all protest cases and 99% of violent unrest cases were predicted
correctly.
a) Know where: Identify communities with higher risks of protest
c) The probability confidence of the model is higher towards each
and of violent unrest.
end of the scale. It shows with high confidence if a community
b) Know which: Enable mapping of at-risk localities to prioritise is red (high risk) or blue (low risk), while probability levels of
unrest-prevention interventions. communities with medium risk (yellow) are less certain.
c) K
now what to do: Support conflict-sensitive investment,
budgeting, programme planning and monitoring & evaluation. Who can use the Protest and Unrest Risk Scales?
Municipal and IDP Planners: to identify high and low risk areas
a.
What can the Protest and Unrest Risk Scales not do? when planning resource allocations and unrest-prevention
activities. All programming by municipalities should be conflict-
a) Predict when protest or violent unrest will take place. It does
sensitive. Decision on which services to provide, where, in what
not monitor triggers for protest, only underlying socio-
way should take the unrest potential of each location into
economic enabling factors.
account. Communities with high probability of peaceful protest
b) Provide probability of unrest relating to national or international may have higher levels of social cohesion (ability to organise for
issues; protests at key points like magistrate’s courts, highways a collective goal) while communities with high probability of
or government buildings; or labour disputes unless these are violent unrest may have lower levels of social cohesion, impacting
concentrated in the community where workers live. on the way in which municipal interventions are received.
What are the main insights from the Protest and b. Councillors: when planning how to communicate with high
risk communities about service delivery issues. Protest and
Unrest Scale study?
Unrest are often triggered by how community concerns are
a) Protest and unrest relate statistically to the socio-economic received and how service plans are communicated by local
conditions in communities where they occur. Socio-economic government, even more than whether or not services have
data from the census can explain 80% of community-based actually been provided. Councillors in high protest and unrest
protest & unrest. risk areas can therefore be supported to communicate more
b) Peaceful protest and violent unrest occur in communities with and with greater conflict sensitivity.
different socio-economic characteristics. Violent unrest is not Programme Managers: of all kinds (government, NGO,
c.
simply an escalation of peaceful protest but requires distinct corporate) when planning where to locate projects and how to
prevention approaches. make projects conflict-sensitive.
d. Safety and Security stakeholders: when prioritising conflict
How reliable are the Protest and Unrest Risk Scales? prevention activities Target specific conflict prevention activities
a) The scales are 80% accurate in predicting whether there is at communities with high probability of violent protest.
likely to be protest. This is an extremely high confidence level e. SALGA: to identify high risk areas, lobby and mobile resources
for a complex social process. on behalf of the affected municipalities.
Access Link: http://salga-unrest.herokuapp.com/salga/municipality.
Full Report of the Violence in Local Government Study is is available on SALGA website:
http://www.salga.org.za/Documents%20and%20Publications%20SP.html
183) Municipal Barometer
The Municipal Barometer is a web-based application that provides municipal performance data to all.
The portal tracks nine outcomes based indicators:
Access to Access to Good Municipal
Demographic
Basic Social Governance & Financial
Trends
Services Services Accountability Vitality
Coherent Economic
Environmental Capacitated
Municipal Growth and
Resilience Municipalities
Planning Development
The Municipal Barometer is an initiative which was driven by The Municipal Barometer is easily accessible via the following link
concerns from LG Practitioners who highlighted that municipalities http://www.municipalbarometer.co.za/ and has the following three
are not able to make informed planning and credible decisions due features:
to the following: 1. Databank (Database of available indicators and sub-indicators
• limited availability of local level data; disaggregated at municipal level).
• limited access to existing data local level data; 2. Benchmarking Tool (Consists of simple factsheets to detailed
• data fragmented local level data; and technical reports).
• uncoordinated data collection & dissemination initiatives; and 3. Automated Municipal Reports (Compares past municipal
• huge costs associated with access to data. performance of individual municipalities as well as how
municipalities perform against each other on a national scale
under the following themes: Finances, Service Delivery,
www Integrated Development Planning and Human Resources).
MOBI APP PERFORMANCE INDICATORS 4) Salga Website
The website provides a platform for knowledge sharing content
The Mobi App provides a summary version of performance indicators
pertaining to the organisation and local government. It further
from the Municipal Barometer.
showcase stakeholders and partners initiatives.
Access Link: www.salga.org.za
www
19Unpacking urban data in South
African Municipalities
Contribution by Jonathan Wilson & Jokudu Guya, South African Cities Network
Johannesburg, South Africa
Introduction exchange of information, experience and best practice on urban
development and city management. References will be taken from
In the context of rapid urbanisation, cities are under increasing the experiences of, and work conducted by, the SACN in assisting
pressure to use evidence to overcome challenges and inform policy cities within their respective data environments.
and planning decision making. Moreover, through increasing access
to technology, world leaders are becoming increasingly aware of the The article is divided into three sections. First, context of how and
importance of using data and analytics to both measure the depths why open data and technology is important for municipalities in
of said challenges and subsequently propose solutions to impact informing evidence-based decision making, through a contribution
meaningfully on service delivery. This article aims to express the from Open Cities Lab (formerly Open Data Durban) (OCL) – a civic
importance of data for municipalities from the perspective of the tech organisation and key partner to the SACN. Second, an unpacking
South African Cities Network (SACN). The SACN is an established of the Common Data Framework for Cities (CDFC), an initiative of
network of South African Cities and partners that encourages the the SACN that aims to assist cities in managing data, indicators and
20www Open Cities Lab
Contribution from Richard Gevers, Director of Open Cities Lab
Open Cities Lab works with cities to create informed decision making
and evidence-based policy and development implementation. Within
the local government space in South Africa, there are a number of
challenges faced by actors in the space when it comes to ‘crowding-in’
insight, knowledge management, and ensuring there is one version of
the ‘truth’ that is known across government and externally with other
development practitioners from academia, civil society and business.
Furthermore, there is still a significant gap between citizens/residents
and local government when it comes to participatory processes and
Figure 1: Example of data stories and insight from SCODA, understanding what residents’ needs are. A critical point to consider
available at http://www.scoda.co.za/ is that technology systems and data can solve nothing without
good process, people inside and outside local government that are
reporting requirements. Third, a use-case example of how cities capacitated to use these to improve the way government works,
use data to inform decision making, through a case study of the and the political and administrative leadership buy-in to provide an
eThekwini Economic Decision Support Tool – a platform delivered enabling environment required to have impact. However, if these
in partnership with both ODD and SACN. three elements are in place, technology systems can help scale, store
safely, automate, and distribute data, knowledge and information
Importance of data for very effectively.
municipalities Cities also have a challenge when it comes to planning and forecasting
Today, urban innovations allow for the intelligent use of to inform service delivery and infrastructure development. With the
Information and Communications Technology (ICTs) to increase current outsourced governance model, much of the planning and
service delivery, and deal with ever growing urban problems of development insight and analysis is provided to government by third
cities. Local governments all over the world are being challenged parties who deliver outputs but not methodology, capacity building,
to become more innovative while also reducing operation costs, or raw data, meaning the work is often not embedded or has to be
operating in a connected environment, and engaging numerous repeated every so often (not that there aren’t pockets of excellence
internal and external stakeholders in solving societal problems both inside and in support of local government within the ecosystem).
(Janssen and Estevez, 2013). In this context, local governments Furthermore, in South Africa there is a very high standard of urban
have seen the increasing use of evidence (data, people, and other intelligence and research within the academic and agency space, but
resources) to improve decision making and deliver results that in many cases the channel of this research is academic journals and
meet the needs of the citizens (Pereira, Parycek, Falco & Kleinhans, papers which is presented at conferences, and this is not the format
2018). By using data in this way, local governments can base that a city employee can easily use to implement new ideas or policy
policy and planning on actual, live, and updated data. To assist shifts.
cities in achieving the aforementioned challenges, the SACN has
In an effort to overcome this, ODD partnered with SACN to develop the
partnered with Open Cities Lab – a non-profit organisation that
South African Cities Open Data Almanac Project (SCODA). To promote
works to realise people-centric participatory democracy. The
the sharing of insights and models to facilitate data-driven decision-
adjacent contribution outlines the organisation’s contribution
making in the metros, SCODA was constructed as a data platform to
within open data and technology in South African municipalities.
assist in breaking down the silos of information and the locking-up of
insights in static reports. In this way we hope to see less duplication,
The Common Data Framework for paying for the same data across different departments or the same
Cities work every couple of years, to the situation where we move again to
being smarter constantly improving and updating, and inviting input
Realising the importance for data within municipalities, the SACN from all areas of society into how cities are formed. Moving forward,
established the Common Data Framework for Cities (CDFC). under the mechanisms of the Common Data Framework for Cities
The existing approach to city-related data collection, extraction (further explained below), the project aims to take a more city-centric
and reporting is complicated and uncoordinated between the focus in utilising data to inform decision making in municipalities.
different stakeholders. Cities report on 2,572 indicators per year
21to national and provincial departments, regulators and other entities SCODA is currently based on the latest (2016) State of Cities Report,
as part of their monitoring and evaluation. Moreover, public reporting but updates in late 2019 will see the platform take a more city-
takes place over and above requests for data from the private sector, centric approach. A proposed feature for the SCODA platform will
civil society and citizens via the Public Access to Information Act. be the ability to pull data from various sources, particularly cities, for
This significant reporting burden results in cities having insufficient comparability and benchmarking. In working towards this vision, the
capacity to generate and analyse data for planning and decision SACN offers participating cities a white-labelled version of SCODA to
making. use as their respective open data portal.
The CDFC aims to aid this problem by assisting cities in managing 2. Codebook
data, indicators and reporting requirements - offering cities a holistic
solution to optimise their data management throughout the data The codebook is a live list of indicators that South African cities
hierarchy. The CDFC emerged as an outcome from the SACN’s Urban are expected to report on. It derives information from output and
Indicators Reference Group (UIRG). Jointly run with the City Support outcome compliance indicators, Circular 88 indicators, Sustainable
Programme (CSP), and established in 2013, the UIRG convened a Development Goals, and the SACN’s State of Cities reporting. It
group of administrative officials from the SACN participating cities, includes definitions, methodologies, and sources of indicators. Most
and other relevant institutions interested in urban data and indicators. importantly, the codebook will feature a dashboard of data availability
However, in identifying the complicated and uncoordinated data within each participating city and provide users with information as
environment within local government, it was clear that there was to where the respective data can be sourced. The codebook will be
a need for a framework that extends beyond purely indicators and hosted on the SCODA platform and is an instrument that can be
reporting. updated based on changes to reporting requirements.
In matching the data needs of cities, the CDFC has five key 3. Reporting Services
components. Each component addresses key challenges observed in
The reporting component of the CDFC responds to the reporting
South Africa’s urban data environment:
burden that all cities face as a result of the complicated and
uncoordinated data ecosystem. This component will allow cities to
1. SCODA automate reporting templates to various national and provincial
The South African Cities Open Data Almanac, available at http:// departments – thereby reducing the reporting burden placed on
www.scoda.co.za/, is a city-centric data portal that aims to support them. The reporting component will, thus, be a template engine
the planning, management, monitoring and reporting needs of cities. that allows cities to produce generic reports that are based on data
The data contained in SCODA has been recorded in the flagship State uploaded onto the SCODA platform. Based on the success of the
of Cities reports around the thematic areas (productive cities, inclusive first two components, the reporting tool will be conceptualised and
cities, sustainable cities, well-governed cities, and city demographics). developed in 2020/2021.
Figure 2: Graphic harvest of the inaugural meeting outcome produced by Grant Johnson
224. Capacity building The council was inaugurated on the 19th July 2019. A key outcome
of the first meeting, which has set the tone for the council’s
The capacity building program aims is to create human and digital development moving forward as a platform for cities to engage
systems within cities that optimise data flows from collection, and share learnings, was a call from the cities for SACN to conduct
analysis, to reporting. The capacity building component will be a roadshow based on the Council and the SCODA platform. Cities
conceptualised in the 2020/2021 financial year, drawing on the observed the value in the platform, but recognised that the lack of
results of the roadshows and further engagements between relevant data champions within individual cities posed a risk to the longevity
city officials. and success of the platform.
5. The SACCD
Through the roadshow, cities
The South African Council for City Data emerged alongside the CDFC
as a response to the lack of integration of urban data stakeholders.
interrogated their structures to define
The council, which is made up of data champions from the SACN their data environments and establish
participating cities, key stakeholders in national government as well working groups and volunteered data
as the private sector, was developed to act as a platform where cities champions who would be conduits between
could have convening power to discuss common challenges, develop
solutions and have a collective voice.
the cities and the council.
Figure 3: SACCD members from all 8 participating SACN cities Figure 4: SACCD members from Municipalities in a break away
convening on the 19th July 2019 work shopping session sharing experiences
Labour data Property data Electricity data Business Education data
licencing data
23Examples of data use for service decision-making, which results in economic development, economic
transformation, and job creation in Durban. The portal, which can
delivery be found at https://edge.durban/ is presently in BETA version and
Through the CDFC, as part of the SCODA offering to participating includes:
cities of the SACN, the SACN has seen first-hand the use of data to • Data narratives on the global, local, and national economy
inform decision making through eThekwini Municipality’s Economic • Data analysis visualisations and economic dashboards
Decision Support Tool. Located within the Economic Development
• Data sets on:
and Growth for eThekwini unit (Durban EDGE) the tool shares an
- Labour data
example of how cities can use data to inform decision making. The
- Property data
below contribution outlines the importance of this pioneering use- - Electricity data
case example. - Business licencing data
- Education data
The eThekwini Economic Decision Support Tool
eThekwini launched the EDGE portal as a two-day event that included
Contribution from Tshegang Chipeya, Senior Research Advisor for eThekwini Municipality
a hackathon and an official launch to the public. The city hosted the
Following a longstanding partnership with SACN and OCL, eThekwini Hackathon the day before the official launch to encourage the use
Municipality was pleased to launch the eThekwini Economic Decision of the data portal. Students from economics, statistics, accounting,
Support Tool (EDGE) on 14 November 2019. The first of its kind at a finance and related fields were invited to partake in the hackathon.
city level in South Africa, EDGE is an open data portal that responds Students interacted with the platform in a manner that reflected the
to the objectives of open data in municipalities for improved value of the data available for various user groups. Additionally, their
decision-making. It emanates from the Durban EDGE brand which solutions offered insight to the Economic Development Unit on the
was established in 2011 by eThekwini’s Economic Development and value of their data for improved decision-making.
Investment Promotion Unit, with the aim of creating a recognisable
The launch was an opportunity for stakeholders (including business,
source of cutting-edge economic information and intelligence.
data journalists, government leaders, academia, and civil society) to
The purpose of the tool is to provide reliable, easily accessible, and view and interact with the economic insights, data and information
regularly updated economic data on Durban. The platform has the uploaded on the portal. Through this portal the city will draw on
objectives of increasing access to city data on a single repository, available data to improve decision-making within the city – herein
disseminating consistent and accurate data and improving data offering an example of how to inform decision-making surrounding
practices and processes. The eThekwini vision is to see informed planning and policy in eThekwini Municipality.
Economic Growth Dashboard www
-2.9% 1.9% -3.8% -3.2% 3.0%
Q1 2019 Q1 2019 Q1 2019 Q1 2019 Q1 2019
2.0% 2.5% 1.9% 3.1% 2.6%
Q2 2019 Q2 2019 Q2 2019 Q2 2019 Q2 2019
Durban South African KwaZulu-Natal South Africa Global
Growth Cities Ave. Growth Growth Growth Growth
Figure 5: Example of the Economic Growth Dashboard, available at https://edge.durban/
Conclusion
Open data is important for cities as an instrument for improved service delivery.
• SACN and OCL showed through EDGE the importance on this.
• The aim of the SACN is to rollout similar projects to participating cities in the coming years. A platform like EDGE allows cities to interact with
data in an innovative manner. Users are able to access reports that are backed by data, thus offering reliable data practices.
• Monitor how this impacts service delivery.
24You can also read


