Changing Landscapes, Changing Lives: Exploring climate change impacts in the Nechako Watershed, and implications to natural resource development ...
←
→
Page content transcription
If your browser does not render page correctly, please read the page content below
Changing Landscapes, Changing Lives:
Exploring climate change impacts in the Nechako Watershed,
     and implications to natural resource development

 Prepared by: Ian Picketts, Stephen Déry and Margot Parkes (University of Northern BC)

                 with support from Terry Robert (Fraser Basin Council)

                                    June 17, 2014
Executive Summary
The Nechako River is an important waterway in North-central British Columbia (BC). The river
forms the second largest tributary of the Fraser River and provides valuable habitat for salmon,
white sturgeon and trout fish species. It is also central to the lives of several First Nations and
non-First Nations communities in the region. People who live in the Nechako River Basin (NRB)
enjoy easy access to the outdoors and a diverse range of recreational activities including
hunting, fishing, boating and snowshoeing. The primary economic drivers in the region are
related to natural resource extraction.

The NRB has undergone many changes over the last 100 years. An abundance of hydro-electric,
agricultural, forestry and mining activities have, and continue to, change the landscape. Most
notably the Kenney Dam - constructed by Alcan in the 1950s to power an aluminum smelter in
Kitimat – has permanently changed the hydrological and ecological nature of the basin. The
current outbreak of the mountain pine beetle has also had significant impacts in northern BC,
and is ultimately expected to kill up to three quarters of the mature pine trees in parts of the
watershed. These changes have altered the NRB and the way that people live and work within
it.

A variety of future changes have the potential to further transform and impact the river basin
over the next 50 years and beyond. One major source of future uncertainty relates to climate
change, as northern areas of BC are warming at nearly double the global average rate. A
number of research studies have been conducted that focused on climate change in the NRB.
These studies show that air temperatures have increased by approximately 1.6°C over the last
century, and that there has been increasing rainfall and decreasing snowfall over this period.
Future temperature projections, created by analyzing the outputs of Global Climate Models
(GCMs), indicate that the NRB is expected to become approximately 2°C warmer in the 2050s
than baseline average conditions (1961-1990). An increase in total precipitation is projected
(although there will be a decrease in snow) as well as an increase in total annual river
discharge. These and other changes have the potential to significantly affect the flow and
flooding regimes of the Nechako River. A detailed review of nine research studies focused on
the in the Nechako region reveal four main categories of climate change impacts that are highly
significant in the watershed:

1. Ecosystems: Climate change is changing the way that ecosystems function in many ways.
    Two ecosystems types of particular concern are:
   I.  Forests: Climate change is having a large impact on how forests grow, what types of
       trees grow in forests and how (and how often) forests are disturbed.
  II. Aquatic ecosystems: First Nations and non-First Nations people depend on the rivers.
       Impacts related to salmon and white sturgeon populations are extremely important.

                                                 ii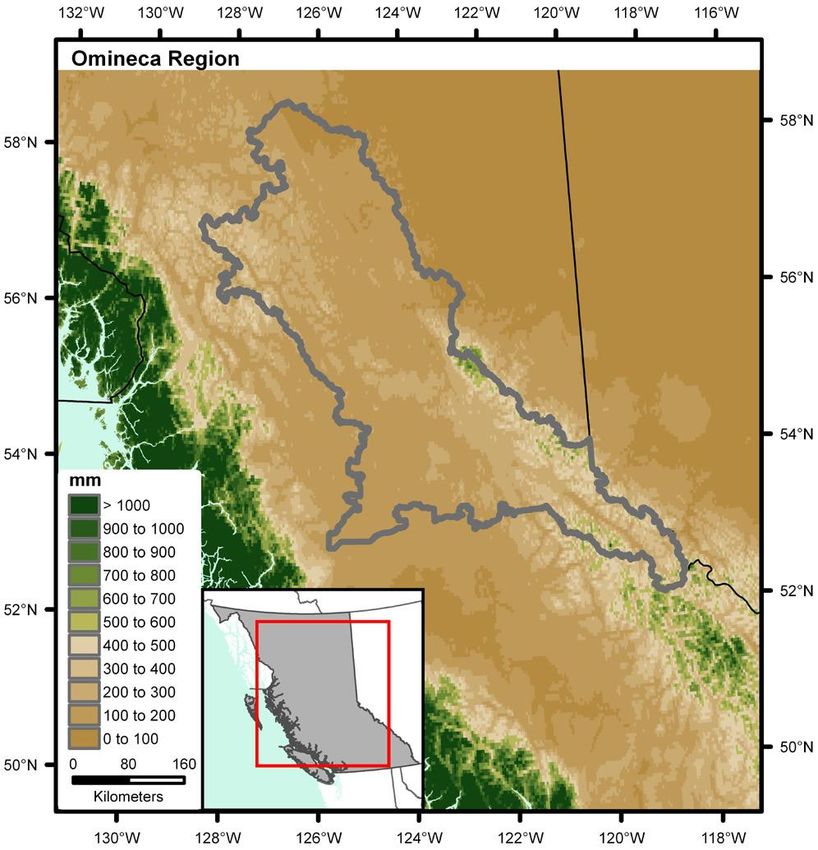
2. Water supply: Climate change is leading to impacts on the amount and the quality of water
   available. Water supply in the NRB is being affected by a number of factors including
   decreased snowfall, increased winter rain, decreased soil moisture, more forest pests and
   warming temperatures. These factors may drive more extremes such as floods.
3. Agriculture and food security: A warming climate can increase growing seasons in more
   northerly latitudes; however, an increase in extreme weather events (that can spoil or
   damage crops and farm infrastructure) may offset these positive changes. Implications
   related to losses of traditional foods are important and must be considered.
4. Community well-being: Climate change and related changes to social-ecological systems can
   affect the health, well-being and resilience of communities within watersheds in many
   interrelated ways. Climate change has had a direct effect on many sectors of the economy,
   and all impacts ultimately affect human and community wellness.
The impacts associated with climate change cannot be considered independently of the
developments and changes that have already occurred in the NRB, or the developments and
changes that may occur in the future. As noted, many human activities (such as agriculture,
hydro-electric development, mining and forestry) have already changed the nature of the
region, and continue to alter the natural and human systems within it. The following table
(Table i) provides a preliminary assessment of the degree of interaction regarding climate
impacts and resource development. Many other activities are also occurring on the landscape
such as fishing, hunting and trapping (commercially and recreationally), non-consumptive
recreation and tourism activities, and renewable energy development projects.

Table i: Interactions between climate impacts and types of resource development in the Nechako River Basin.
                          A: Ecosystems    B: Water            C: Agriculture and   D: Community Well-
                                           Supply              Food Security        being
Hydro-electric power     Very High*        Very High*          Medium*              Very High
Forestry                 Very High         High*               Medium               Very High
Agriculture              Medium            High *              Very High            High
Mining                   Medium            Medium*             Low*                 High*
Oil and gas              Low*              Low*                Low*                 Medium*
*These values are projected to increase in the future.

To effectively manage the NRB we must consider the cumulative impacts of all activities and
changes, and if the natural and human systems in the region can adapt to them. Communities
can apply the existing knowledge regarding climate change in the NRB to help proactively plan
for the future and responsibly manage development activities so that they do not cause
irreversible or unacceptable impacts. The information in this report can help in the
establishment of limits and acceptable thresholds and change for the watershed, and lead to
progress toward the integrated management of land and water resources in a way that
promotes economic, social and environmental benefits for all people within the Nechako
watershed.

                                                      iii
Table of Contents
Executive Summary..........................................................................................................................ii
Table of Contents ............................................................................................................................iv
Forward to report ............................................................................................................................v
     Acknowledgements: .................................................................................................................... 2
1       The Nechako River and Nechako Watershed: ......................................................................... 3
     1.1      The Peoples of the Nechako ............................................................................................ 5
     1.2      European settlement and modern populations .............................................................. 7
2       Climate Change: ....................................................................................................................... 9
     2.1      Climate change in BC and in the Nechako Watershed .................................................. 11
     2.2      Primary research studies ................................................................................................ 12
     2.3      Additional research studies ............................................................................................ 16
3       Climate trends and Future Projections .................................................................................. 18
     3.1      Past trends in climate ..................................................................................................... 18
     3.2      Future climate projections ............................................................................................. 20
4       Climate impacts in the Nechako Watershed ......................................................................... 23
     4.1      Primary research studies ................................................................................................ 23
     4.2      Additional research studies: ........................................................................................... 27
     4.3      Summary of climate change impacts in the Nechako Region ........................................ 28
5       Resource Development and climate change in the Nechako Watershed ............................. 32
     5.1      Hydro-electric power. .................................................................................................... 33
     5.2      Forestry .......................................................................................................................... 35
     5.3      Agriculture ...................................................................................................................... 37
     5.4      Mining ............................................................................................................................ 39
     5.5      Oil and gas ...................................................................................................................... 41
     5.6      Other .............................................................................................................................. 43
     5.7      Visualizing impacts and looking into the future............................................................. 44
6.      Discussion: Understanding climate change and resource impacts in the Nechako .............. 47
Glossary: ........................................................................................................................................ 50
References .................................................................................................................................... 52

                                                                         iv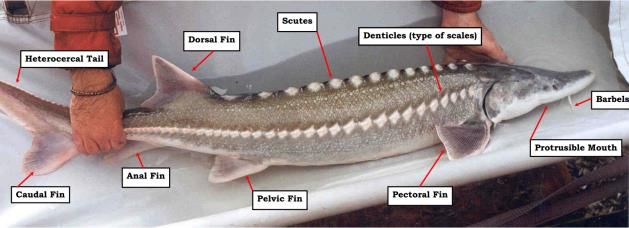
Forward to report
The purpose of this guide is to help us to increase our awareness about the changes that have
occurred, are occurring and are expected to occur in the Nechako River Basin (NRB) (also
commonly referred to as the Nechako Watershed). Although it is written primarily by
researchers, we have attempted to create a report that is accessible and engaging to a wide
audience. We have included a Glossary section at the end of the report that defines some of
the terms that are used in this document. Words that are included in the glossary are bolded
and highlighted in purple when they are first used. Please consult the footnotes and the
references for more information regarding the scientific or technical information contained
within the report, or contact the authors. An academic review article is being drafted on this
same topic that will contain more technical and background information, and should be
available shortly.

We have made every effort to summarise information in a neutral and unbiased manner.
Toward this goal we invited feedback and review on the guide from a wide variety of parties,
including local governments, First Nations, local and regional organizations, and topical experts.
This feedback has shaped the final document in a large way. Everyone has biases - ourselves
included - and the final draft has been influenced by the groups and individuals that provided
feedback, and also those that did not.

Thank you very much,

Ian, Stephen, Margot and Terry
June, 2014

Ian Picketts                                            Stephen Déry
Postdoctoral Researcher                                 Canada Research Chair in Northern
University of Northern BC                               Hydrometeorology
Email: pickets@unbc.ca                                  University of Northern BC
Phone: (250) 960-6700                                   Email: stephen.dery@unbc.ca
                                                        Phone: (250) 960-5193
Margot Parkes
Canada Research Chair in Health,                        Terry Robert
Ecosystems & Society                                    Upper Regional Manager
University of Northern BC                               Fraser Basin Council.
Email: margot.parkes@unbc.ca                            Email: trobert@fraserbasin.bc.ca
Phone: (250) 960-5744                                   Phone: (250) 612-0252

                                                v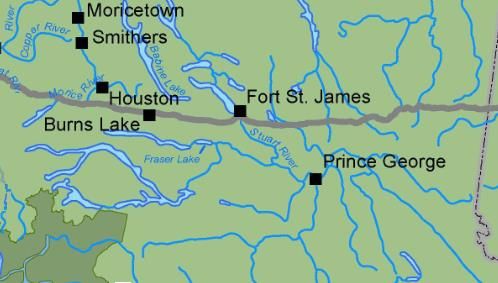
Suggested citation:
Picketts, I.M., Déry, S.J. and Parkes, M.W. (2014) Changing Landscapes, Changing Lives: Exploring
     climate change impacts in the Nechako Watershed, and implications to natural resource
     development. University of Northern BC and Fraser Basin Council. Prince George, BC, 55pp.

The report is available at: http://nhg.unbc.ca/ and at http://www.fraserbasin.bc.ca/

Acknowledgements:
Thank you to the Real Estate Foundation of BC for providing support for this initiative through
an internal grant with the University of Northern BC (UNBC). The Fraser Basin Council, the
Natural Sciences and Engineering Research Council (NSERC) and the Canadian Institutes for
Health Research (CIHR) have also provided support. Thanks to those members of the Nechako
Watershed Alliance (NWA)1 who provided review and feedback on this document in a workshop
in March 2014. A special thanks to Christina Ciesielski, Norm Bilodeau and John Rex for
reviewing the report, and to Michael Allchin for creating figures 2 and 4.

        Figure 1 Man watching the construction of the Kenney dam at the grand canyon of the Nechako.
                                 (Courtesy of the Kitimat museum archives)

“When we try to pick out anything by itself, we find it hitched to everything else in the universe.”
                                                                                          John Muir

1
 NWA alliance members who were present at the March 2014 workshop were: Lara Becket (Fraser Fort George
Regional District), Barry Booth (UNBC), Christina Ciesielski (Carrier Sekani Tribal Council), Stephen Déry (UNBC),
Theresa Fresco (FBC), Chelton Van Geloven (BC Ministry of Forests, Lands and Natural Resources [FLNRO] ),
Melanie Karjala (Resources North Association[RNA]), Steve Korpi (FBC Watersheds and Water Resources
Committee), Steve Litke (FBC), Carling Matthews (UNBC), Phil Owens (UNBC ), Ellen Petticrew (UNBC), Margot
Parkes (UNBC), Ian Picketts (UNBC), Terry Roberts (FBC & First Nations Fisheries Council), Mike Robertson
(Cheslatta First Nation), Wayne Salewski (Nechako Environment and Water Stewardship Society), Gerry Thiessen
(District of Vanderhoof), and Jun Yin– (FLNRO). NWA members who were not able to attend but contributed to the
report include: Dan Adamson (City of Prince George), Lucy Beck (Northern Health), Norm Billodeau (FLNRO), Tom
Greenway (Bulkley-Nechako Regional District), John Rex (FLNRO) Guy Scarf (Department of Fisheries and Oceans),
and Kathi Zimmerman (RNA).

                                                        2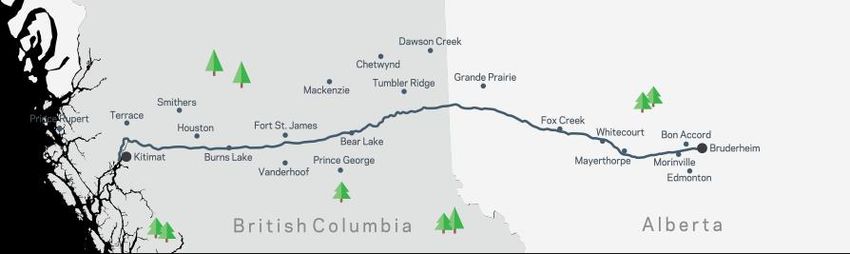
1 The Nechako River and Nechako Watershed:
The Nechako2 River begins in the Coast Mountains of western British Columbia (BC) and flows
eastward through the Interior Plateau Region until it ends at the Fraser River near the
geographical centre of the Province, at what is now the City of Prince George (Hartman, 1996).
Before the River was dammed (see Section 5.1), the Nechako River was 440 km long. The
Nechako River Basin (NRB) spans an area of 52,000 km2 (Benke and Cushing, 2005), which is
approximately the same size as the Country of Switzerland. The Stuart River, which flows
southeast from the Coast Mountains, is the biggest tributary (by flow volume) of the Nechako
River. The Nechako is in turn the second biggest tributary of the Fraser River (after the
Thompson River). The Fraser River originates in the northern Rocky Mountains near Mount
Robson (west of Jasper, Alberta), flows westward until it is joined by the Nechako River, and
flows south and then west into the Pacific Ocean at Vancouver. The Fraser drains a quarter of
BC, is home to over two thirds of the Province’s residents, and is the third largest River in
Canada (by mean flow) (FBC, 2009). It is the longest intact (i.e., undammed) river in North
America (Benke and Cushing, 2005). The Fraser River Basin (FRB) covers 220,000 km2, which is
an area nearly as large as the United Kingdom. Figure 2 provides an overview map of the NRB.

Most of the land within the Nechako basin, like much of central and northern BC, is dominated
by coniferous forests. The forested and gently rolling terrain in and around the Nechako area is
known as the sub-boreal spruce bio-geoclimatic zone, and its large tracks of mature coniferous
forests have made it well-suited for logging (see Section 5.2) (BC MoF, 1998). The remainder of
the NRB consists of surface water (including Fraser Lake and Francois Lake), agricultural lands,
wetlands and alpine regions. The watershed’s climate is continental in nature and has cold wet
winters and warm dry summers. The conditions are moderated by the presence of the Pacific
Ocean to the west (BC MoF, 1998). Because of the long wet winters, the Nechako River
naturally has high flows in spring and early summer, when the snow melts (i.e., during the
freshet period) (Moore, 1991; Benke and Cushing, 2005).

The Nechako River is biologically significant. The river is home to many fish species including
rainbow trout, a large chinook salmon run, and a genetically unique population of white
sturgeon. There are also two major sockeye salmon run in the Stuart river system (BC MoE,
2001; Benke and Cushing, 2005). The white sturgeon is the largest freshwater fish in Canada,
and adults may grow to over 6 metres in length and live for over 100 years. The sturgeon
subspecies that lives within the Nechako River (and the Stuart) usually grow to about 3 metres
in length (Figure 3). This is due to shorter winters and different food sources (Fisheries and
Oceans Canada, ND). The Nechako sturgeon population is classified as ‘critically imperilled’
(Benke and Cushing, 2005), which means that the species is facing a very high risk of extinction.
Although the Nechako sturgeon are found throughout the watershed, only one spawning area

2
    Nechako means ‘big river’ in the Carrier language.
                                                         3
for the Nechako Sturgeon (near Vanderhoof) has been located to date (Wood, 2013). They are
listed under the Species At Risk Act (SARA), which means that it is illegal to kill, possess, harm or
damage these animals. Because the Nechako sturgeon is in a critical state of decline, there are
many efforts underway to try to protect the remaining individuals and promote a population
resurgence. For example a sturgeon hatchery and conservation centre was approved in 2013,
and should be operational in the spring of 2014 (NWSRI, 2014). Many birds and mammals also
live in the NRB including the highest concentrations of moose in BC, and also bears, wolves,
great horned owls and many other species (BC MoF, 1998).
Figure 2 Overview map of the Nechako River Basin and its major tributaries. The red dots depict where there are
active hydrometric gauges.
4Figure 3 Labelled photo of the Nechako white sturgeon. (Fisheries and Oceans Canada, ND)
1.1 The Peoples of the Nechako
1.1.1 Traditional Peoples
Since long before European settlers lay eyes on what is now known as British Columbia (BC) and
travelled its great Rivers, people have been living and flourishing here. BC has been home to a
large and diverse population of aboriginal people, who spread across the entire province, for
millennia. It is thought that, before contact was established with Europeans, approximately 40%
of Canada’s Aboriginal people lived in BC (BC MoFML, 2010). There are many different groups
of First Nations people in British Columbia, and they each have traditional territories where
they historically - and continue to - live, travel and hunt3. The indigenous group that has lived
throughout the entire Nechako Watershed for thousands of years is known as the Carrier (Or
Dakelh) people (Attili and Sandercock, 2010; CSTC, 2011; Hudson, 2013).
The Carrier people were generally semi-nomadic, and governed themselves based on the clan
system. Like many First Nations peoples in Canada, they passed down knowledge and tradition
through oral story telling methods (CSTC, 2011). They relied principally on animals such as,
trout, salmon, moose and deer for food. The rivers in the region (including the Nechako and its
tributaries including the Stuart, Stellako, Nautley and Tachie) were important for transportation
and for food (Wood, 2013). There are many Carrier bands in the Nechako watershed including
the Cheslatta, Sai’kuz (or Stoney Creek), Stellat’en, Lheidli T’enneh, Nadleh Whut’en,
Wet’suwet’en, Tlazten, Tsil Kazkoh (BLB) and Takla lake First Nation.
3
The relationships between territories is complex and many boundaries of traditional territories blend into each
other and/or overlap (BC MoE http://www.bced.gov.bc.ca/abed/map.htm)
51.1.2 First Nations communities within the Nechako watershed:
There are a large number of First Nations communities within the Nechako Watershed. An
overview of some of the communities (organized by estimated size) is as follows4:
Tl’azt’en First Nation is made up of approximately 2000 members, and has its main office on
Stuart Lake. It is a member of the Carrier Sekani Tribal Council.
The Nak’azdli First Nation is a member of the Carrier Sekani Tribal Council that has
approximately 1800 members. Their main office is located near Fort St. James.
The Saik’uz First Nation (also called Stoney Creek) is a member of the Carrier Sekani Tribal
Council. It has approximately 1000 members, and its main office is situated south-east of
Vanderhoof.
The Takla Lake First Nation is a member of the Carrier Sekani Tribal Council. This First Nation
has approximately 750 members, and has its main office near Takla Landing (150 km northeast
of Fort St. James).
The Stellat’en First Nation is a member of the Carrier Sekani Tribal Council that has
approximately 500 members, and has its main office near Fraser Lake.
The Lheidli T'enneh First Nation is estimated at 380 members, with a main office in Shelley
(near Prince George) and strong links with the confluence of the Fraser and the Nechako Rivers.
The word Lheidli means "where the two rivers flow together" and T'enneh means "the People".
The Cheslatta First Nation has just over 300 members, and has its main office on Cheslatta
Lake.
The Nadleh Whut’en First Nation is a member of the Carrier Sekani Tribal Council. It is made up
of approximately 170 members, and has its main office in Fraser Lake.
The Ts’il Kaz Koh First Nation (also known as the Burns Lake Band) is a member of the Carrier
Sekani Tribal Council. It has approximately 150 members, and has its main office in Burns Lake.
The Wet’suwet’en First Nation is made up of approximately 150 members, and most member
live just west of Burns Lake. It is a member of the Carrier Sekani Tribal Council.
The Nee Tahi Buhn (Yekooche) band has approximiately 130 members, and has its main office
in Burns Lake.
4
Information about the Carrier Sekani First Nations groups, and maps of their traditional territories, can be found
at: http://www.carriersekani.ca/
61.2 European settlement and modern populations
The first Europeans to venture into the Nechako Watershed arrived in the late 1700s looking for
fur-trading opportunities (CSTC, 2011). In the early 1800s, Simon Fraser established a trading
post on Stuart Lake, and Fort St. James grew into a major trading and government centre. Fort
St. James is strategically located on Stuart Lake, and is a natural trading hub as it is connected
to a large number of major lakes and rivers in the region. It is thought to be the oldest
European settlement on the BC mainland.
Throughout the 1800s there were many changes in northwestern BC. Missionaries arrived and
settled throughout the region. BC became a British colony and then BC joined the Canadian
federation in 1871. Throughout this time there were many terrible colonial disease outbreaks
that traditional people were subjected to. First Nations people had not been exposed to (and
developed immunities to) diseases such as influenza, measles and small pox. As an unfortunate
result First Nations populations were decimated (CSTC, 2011; Hudson, 2013; Wood, 2013).
In the early 1900s farmers began to settle in the Vanderhoof area, Prince George was growing
as a railroad town, and residential schools began operating in the region. After World War II
logging in northern BC increased dramatically as cities around the world were being rebuilt. At
this time Prince George grew into a major forestry centre. In the early 1950s the Kemano
Construction Project development occurred (see Resource Development in the Nechako Basin
Section), and as a result the Kenney Dam and town of Kitimat were constructed. (The town of
Kitimat is not located within the Nechako Watershed.) Since the 1950s the population of the
NRB has increased steadily, although growth rates have been slow compared to other areas in
BC such as the Okanagan and the Lower Mainland area (BC MoFML, 2010).
There have been tremendous changes in BC in a relatively short period of time. Between 1867
and 2008, BC’s population went from 33,000 to 4,400,000: more than a 100 fold increase (BC
MoFML, 2010). Although there are many cities, towns, villages and reserves within the Nechako
Watershed (see Figure 4), this vast area is still quite sparsely populated. The population of the
Nechako watershed is estimated at approximately 105,000, if the entire population of greater
Prince George (~83,000) is included. Therefore less than 22,000 people live within the
watershed outside of Prince George. Currently the Nechako River is used extensively for
agricultural purposes, drinking water and recreation (BC MoE, 2001).
First Nations communities are included in the previous section. Moving from largest to smallest
the major non-First Nations settlements are as follows:
Prince George is a City of 76,000, located at the confluence of the Nechako and Fraser Rivers. It
is known as BC’s ‘northern capital’, and is a major centre for forestry operations with 12
sawmills and three pulp mills. The City is also a hub for regional mining operations, government
services, education, health care and transportation throughout the Pacific Rim. It is situated on
7the historical territory of the Lheidli T’enneh First Nation, and was the site of the original Fort
George trading post (City of Prince George, 2013a).
Figure 4 Settlements in the Nechako River Basin.
The district municipality of Vanderhoof has a population of 4,000. It is surrounded by rural
areas and the Saik’uz First Nations reserve is nearby; therefore, the community serves as a
supply centre for nearly 10,000 people. Vanderhoof is situated 100 km west of Prince George at
the geographical centre of BC. The town is a major agricultural hub, a forestry centre, and also a
staging area for mining operations taking place in the Stuart watershed. It is the largest centre
located entirely within the Nechako Watershed (Vanderhoof, 2010).
8Burns Lake is a village of 2,000 residents, but serves as a supply centre for nearly 8,000
surrounding people. The community is almost evenly split between First Nations and people
from European descent, and three First Nations reserves are part of the town: Wets’sewet’en,
Lake Babine and Burns Lake. Burns Lake is located 220 km west of Prince George. The main
industries in the town are forestry, mining, and tourism. In 2012 the Babine Forest Products mill
exploded, and left many concerned about the future of the community. The mill is reportedly
being rebuilt, but will be smaller than before (Bulkey-Nechako, 2012).
The district of Fort St. James has a population of 4,500 people, including nearby rural areas and
First Nations communities. The community is situated on scenic Stuart Lake, 60 km northwest
of Vanderhoof. The area is very historically significant, and is home to the Fort St. James
National Historic Site. Mining, tourism and agriculture are the main economic drivers in the
area (Fort St. James, 2013).
The village of Fraser Lake has a population of 1,200 people and is situated 160 km west of
Prince George at the east end of the ‘Lakes District’. Most residents are employed in the
forestry or mining industry, and some also work in tourism and agriculture. The area is known
for its fishing and recreation opportunities, and its resident population of trumpeter swans
(Fraser Lake, 2013). The Fort Fraser fur-trading post, established in 1806, is located just east of
the village.
Generally, the people who live within the Nechako River Basin enjoy settlements that are
smaller in size, an affordable cost of living and an abundance of natural areas that are easily
accessible. The rivers and large lakes in the region provide a plethora of outdoor recreation
activities, as do the forests and the snowy winters. There are many economic opportunities in
most of the centres, many of these relate closely to the natural resources sector.
2 Climate Change:
This section covers an introduction to the concept of climate change, looks at changes (both
past and projected) in the NRB and then examines the impacts of these changes.
Climate is a term that refers to patterns of weather over long periods of time. When discussing
the climate, researchers are usually referring to a period of time of at least 30 years.5
Therefore, when someone discusses climate change, they should be referring to changes in
temperature, precipitation and/or the number of events or extremes over multiple decades.
5
This is different than climate variability, which refers to short term changes over months to years. It is also
different than weather, which refers to changes and events that occur over hours to weeks.
9Recent climate change is also often referred to as global warming, or anthropogenic global
warming.
Since the 1800s scientists have been exploring how certain compounds, known as greenhouse
gases (GHGs), warm the atmosphere. Since the 1980s, scientists around the world have
overwhelmingly agreed that earth’s climate has been changing since about 18506, and changing
rapidly over the past 50 years. There has been a significant rise in global air temperatures, and
also shifts in the global hydrological cycle resulting in more precipitation in some areas of the
world and droughts in others. Increasing evidence shows that most of the changes to the
climate system that have occurred over the last 50 years (and longer) are due to GHG emissions
generated by human activities, and not only to natural climate variability. The activities that
are primarily responsible for the increased levels of GHGs (Davidson et al. 2003) are:
fossil fuel production and use, which emits large amounts of GHGs (primarily carbon
dioxide) into the atmosphere;
livestock rearing, which emits GHGs (primarily methane) into the atmosphere; and
deforestation, which both releases carbon dioxide from the trees and the industrial
activities, and removes the trees that play a crucial role in removing (or sequestering)
carbon dioxide from the atmosphere through photosynthesis.
These activities are all very relevant to the Nechako region and to Western Canada.
The signs of climate change are all around us, and there is a large number and variety of
examples that show that the climate is changing, and that this is affecting more than simply the
surface temperature of the earth. Examples of these statistics include:
Nine of the 10 warmest years on record have been within the last decade (2002-2012).
(The other warmest year was 1998.)
There has been a loss of volume, and sometimes complete disappearance, of glaciers
around the world over the twentieth century.
Significant increases in extreme events - such as multi-day heat waves, heavy
precipitation events, droughts and tropical cyclones - have been noted.
Changes in biological activities and cycles have been observed worldwide, such as earlier
plant leaf unfolding, bird egg-laying and animal migrations.
The Intergovernmental Panel on Climate Change (IPCC) recently released their fifth
assessment report from Working Group I, which focuses on the evidence of climate change, and
observed and expected changes. This report was written by 259 lead and over 600 contributing
authors, and was reviewed by over 50,000 individuals. The authors, working collaboratively and
on a volunteer basis, came to a number of significant conclusions regarding climate change. A
6
Almost all scientists agree that the global climate was quite stable for thousands of years before 1850. This
information has been gathered from sources such as ice core data, tree rings and ancient records.
10few of the major conclusions overviewed in the ‘summary for policy-makers report’ are as
follows (IPCC, 2013):
The climate system is undoubtedly warming. Each of the last three decades has been warmer
than the last and the changes observed since the 1960s have resulted in conditions that
probably have not occurred on earth for thousands of years. Global air temperatures have
increased by approximately 0.85°C between 1880-20127, and warming trends are evident in
almost every region on earth.
Humans are the primary cause of the warming. Global GHG concentrations have increased by
40% since preindustrial times, and are currently higher than they probably have been for at
least the last 800,000 years. The evidence for humans’ role in climate change is clear, and it is
‘extremely likely’8 that human (or anthropogenic) activities are responsible for the majority of
the changes that have occurred.
Warming will continue, even if humans reduce their GHG emissions. There is more than a 50%
chance that global air temperatures will rise by over 2°C by 2100. Changes in precipitation are
more difficult to predict, but wet areas generally will get wetter and dry areas will get drier.
Extreme events are expected to continue to increase, glacier volumes will continue to decrease,
and sea levels will likely rise an additional 26 to 55 cm. These and other changes will continue
for a long period of time whether or not humans decrease their GHG emissions.
Although some people argue that taking action on climate change and lowering GHG emissions
will negatively affect the economy, a large body of evidence shows that the economic impacts
of not acting on climate change will be much greater than taking proactive measures (e.g.,
Stern, 2006). BC is a good example of an economy that has prospered even though there is a
provincial carbon tax and many initiatives designed to decrease emissions, and a climate
change adaptation strategy and many initiatives designed to help adjust to climate impacts as
well.
2.1 Climate change in BC and in the Nechako Watershed
Different continents, countries, ecozones and regions around the world are warming and
changing at different rates. Generally the following trends apply:
1. Air temperatures above land areas (i.e., continents) are warming more quickly than
over oceans.
2. Inland areas are warming more rapidly than coastal zones.
7
Before 1880 there was not enough information available to produce reliable global temperature records from.
8
In the IPCC, extremely likely equates to a greater than 95% chance.
113. High latitude areas are warming more quickly than areas near the equator.
The following paragraphs provide an overview of our understanding of how these overall trends
are impacting on the province of BC and, where possible, the NRB. There is a focus on specific
research studies focused on or relevant to this region. Details from these studies regarding
past climate trends and future climate projections are then extracted for discussion.
The Pacific Climate Impacts Consortium (PCIC) performed an analysis of past temperatures and
precipitation patterns across BC between 1906 and 2006. Over the past century, mean
temperatures in the Province increased by 1.2°C, maximum daily temperatures increased by
0.6°C and minimum daily temperatures increased by 1.7°C. Precipitation changes were also
documented throughout the province. These changes were primarily positive (i.e., more
precipitation) and with more increases in winter than summer. Precipitation changes were
much less consistent than temperature changes across the province (Rodenhuis et al., 2009;
Walker and Sydneysmith, 2008).
Although the climate is changing in the Pacific Northwest, there are also natural cycles of
climate variability that also affect temperatures and precipitation in the region over seasons
and years. The El Niño Southern Oscillation (ENSO) and the Pacific Decadal Oscillation (PDO)
are two cycles of climate variability that are linked to temperature changes in the Pacific Ocean
that cause cycles of warmer and colder (or wetter and drier) conditions in BC over years to
decades. Therefore, because of climate variability, cooler temperatures may happen from time
to time in spite of a long term warming trend. Also, warm phases of variability can provide us
with clues about what the average climate may look like 10, 20 or 50 years in the future.
Previous research activities in the Nechako region have identified climate change as a key
concern and research need in the watershed. A number of studies have focused on
communities and areas within the Nechako Watershed, and provide detailed information
regarding past climate trends, future climate projections and/or climate impacts in the region.
This research has begun to examine climate change in and around of the NRB, and what it
might mean for natural and human systems. There is a need for more information about
climate change, particularly as it relates to water, to inform and guide emerging resource
development and watershed governance efforts. Although more research is probably
necessary, for now the existing studies can help us to gain an understanding climate change and
climate impacts in the Nechako region.
2.2 Primary research studies
In this report we will look at four research studies in detail that are most directly relevant to
climate impacts in the NRB. We also briefly examine several additional research studies (section
122.3) that explore more specific topics or a greater area (such as the FRB). An introductory
summary of these nine studies follows below:
There are four primary research studies, and five additional research studies that help us to
2.2.1 Research study I: Climate change and forestry in Vanderhoof
Between 2004 and 2008, Natural Resources Canada performed a detailed assessment
examining how climate change may affect forests, the forest industry and forest-dependent
communities in the north. A key part of the project was the development of a framework for
assessing the vulnerability of forest-based communities to climate change. Researchers built a
framework that outlines 14 detailed steps that forest-dependent communities can follow to:
1. Examine past and future climate change (see tables 1 and 2).
2. Identify and assess ecosystem and community impacts.
3. Plan and implement adaptation strategies.
The Framework was applied to a 200 km x 200 km area centred on Vanderhoof in a detailed
study led by Natural Resources Canada. Experts from Vanderhoof and across Canada studied
recent and projected future changes in the region, applied the climate information to identify
potential impacts on the forest resources and the broader community, and came up with
adaptation strategies through the use of scenarios. The scenarios were compiled to outline how
the community and the landscape will be impacted climate change impacts. A report of the
framework for assessing vulnerability for forest based communities can be found at
http://cfs.nrcan.gc.ca/bookstore_pdfs/27507.pdf (Williamson et al., 2007) and results from the
Vanderhoof research study are available at:
http://publications.gc.ca/collections/collection_2009/nrcan/Fo133-1-415E.pdf (Williamson et al.,
2008).
2.2.2 Research Study II: Climate change adaptation in Prince George
Since 2007, the University of Northern BC (UNBC) has been working closely with the City of
Prince George to understand the changes that have been occurring in and around the City, and
to identify strategies to plan for the impacts of climate change. Over the last six years a great
deal of research and action has occurred, including:
A detailed overview of the past climate changes in the region and projections of future
changes, completed in partnership with PCIC (see Tables 1 and 2).
Multiple engagements with City staff, local experts and members of the public to
understand what these changes might mean for Prince George, and what the priority
impacts are locally.
The incorporation of climate change adaptation measures into the City’s local Official
Community Plan and the Integrated Community Sustainability Plan.
13 Further research and action on priority impacts in Prince George, including forests,
flooding and transportation infrastructure.
An evaluation of the effectiveness of the adaptation actions, and an outline of which
undertakings are likely to continue.
Detailed information about the Prince George project and many reports can be found on the
City’s website at: http://princegeorge.ca/environment/climatechange/adaptation/pages/default.aspx
(City of Prince George, 2013b).
2.2.3 Research Study III: Climate change research with the Stellaquo:
In 2009 the Stellat’en First Nation (near Fraser Lake) created a plan to mitigate its GHG
emissions. Building on this work, the community partnered with researchers at UNBC to
examine the impacts of climate change in the Nechako area with a focus on water. This study
was unique in that it was guided by local Elders, and it used information from both western
scientific and Traditional Ecological Knowledge perspectives to examine changes in the area
and identify possible solutions. The work consisted of three major parts:
1. Climate information was gathered from nearby weather and hydrometric stations, and
analyzed.
2. Climate information was gathered from local youth and Elders regarding their learned
experiences with climate and climate change through interviews, focus groups and a
survey of community members.
3. The climate information compiled (in parts 1 and 2) was brought together in two
knowledge intersection workshops in 2010. These events included background
presentations on water and climate change, and talks related to the ‘western’ and
‘traditional’ information compiled. After a group discussion, people formed focus groups
and were asked about what climate change means to them, how it has impacted their
families and what they can do about it.
When it is finalized, the article will be available online at:
http://onlinelibrary.wiley.com/journal/10.1111/(ISSN)1541-00649
Article citation: Sanderson, D., Picketts, I. M., Déry, S. J., Fell, B., Baker, S., Lee-Johnson, E., and Auger,
M. (2014). Climate change and water at Stellat’en First Nation, British Columbia, Canada: Insights
from western science and traditional knowledge, The Canadian Geographer, accepted pending
revisions.
9
You need a subscription to the journal to access the article for free. You can access the article at a University
library.
142.2.4 Research study IV: Omineca region climate overview
PCIC has been involved in a number of studies, reports and projects in BC (including the Prince
George adaptation project). Recently PCIC, in partnership with the BC Government, released a
series of eight reports outlining changes that have been observed and are expected in different
regions of BC. One of the reports focused on the Omineca region, which includes most of the
Nechako watershed, and parts of the Liard and Peace watersheds as well (figure 5)10. PCIC has
briefly summarized past climatic changes as well as future projected changes – and they use
that information to outline what some of the major impacts may be in the region. The report is
available at: http://www.pacificclimate.org/news-and-events/news/2013/regional-climate-summaries
(PCIC, 2013).
Figure 5 The 'Omineca’ Region as defined by PCIC. (PCIC, 2013)
10
Almost all of the Nechako Watershed is within the ‘Omineca’ region as defined by PCIC, but a small part of the
watershed is located falls within the ‘Skeena’ region.
152.3 Additional research studies
2.3.1 Research study V: Hydrologic impacts of climate change on the Fraser River Basin
Researchers at PCIC and the University of Victoria performed a modelling study to examine the
effects of climate change on hydrology in the FRB. The researchers focused on 11 sub-basins,
two of which are located within the Nechako Watershed: one on the Stuart River near Fort St.
James and another on the Nechako River at Vanderhoof. They used models to explore current
hydrologic patterns and project what hydrologic patterns may look like in the 2050s. Changes in
temperature, precipitation, snow storage and annual run-off were calculated, and the
implications of these changes on hydrology explored. The complete article is available online at:
11
http://onlinelibrary.wiley.com/doi/10.1002/hyp.9283/abstract (Shrestha et al., 2012).
Article citation: Shrestha, R. R., Schnorbus, M. A., Werner, A. T. and Berland, A. J. (2012) Modelling
spatial and temporal variability of hydrologic impacts of climate change in the Fraser River basin,
British Columbia, Canada. Hydrological Processes, 26: 1840–1860. doi: 10.1002/hyp.9283
2.3.2 Research study VI: snow budget research
Researchers from Canada and the United States collaborated to study the changing
contribution of snow to the FRB. This study builds upon a large body of research suggesting that
snowfall and snowpacks are decreasing in western north-America. By analyzing past weather
data in the basin and applying the outputs of the Variable Infiltration Capacity (VIC) model,
researchers analyzed many trends that are occurring in the sub-watersheds of the Fraser. The
article is available online at: http://journals.ametsoc.org/doi/abs/10.1175/JHM-D-13-0120.111 (Kang
et al., 2014).
Article citation: Kang, D. H., Shi, X., Gao, H. and Déry, S. J. 2014. On the changing contribution of snow
to the hydrology of the Fraser River Basin, Canada, Journal of Hydrometeorology, in press.
doi: 10.1175/JHM-D-13-0120.1
2.3.3 Research study VII: flood analysis
It is very difficult to discern what factors or variables lead to river flooding, as rivers are such
complex systems and floods are such complex events. This is particularly true in the NRB, as
some of the flow is controlled (or regulated) by humans, and some is not regulated (e.g., the
Stellako, Nautley and Stuart tributaries). Climate change adds a whole other dimension to this
challenge, as the river systems function is changing over time also. To answer some of these
difficult questions, researchers studied how and when past flooding events have occurred in
the Nechako River Basin. This was done by examining long-term datasets of discharge from the
11
You need a subscription to the journal to access the article for free. You can access the article at a University
library.
16river from 1955 to 2008 (since when the Kenney dam was completed) and studying what
factors were present during all of the significant flooding events over this time period (Albers et
al., in review). The article summarizing this work is currently in review in the Canadian Water
Resources Journal.
Article citation: Albers, S. J., Déry, S. J. and Petticrew, E. L. In Review. Flooding in the Nechako River
Basin of Canada: A random forest modeling approach to flood analysis in a highly regulated
reservoir system, submitted to Canadian Water Resources Journal.
2.3.4 Research study VIII: Ecosystem restoration in Vanderhoof
In 2011, the BC Ministry of Forests and Range (MoFR) led a committee of local and regional
experts to create an Ecosystem Restoration plan for the Vanderhoof Forest District. The
purpose of the plan is to guide the processes of assisting with and facilitating the recovery of
vulnerable, degraded, damaged or destroyed ecosystems. Climate change was one of the major
considerations outlined in the plan. The full report is available at:
http://www.for.gov.bc.ca/dva/Other%20Documents/Vanderhoof%20ER%20Strategic%20Plan.pdf
(LMFRS, 2011).
2.3.5 Research Study IX: impacts on salmon migration in the Fraser Basin
A collaboration of researchers from the University of BC, The University of Saskatchewan and
UNBC examined monthly streamflow data from 151 gauges along the FRB over a 100 year
period from 1911-2010. Inter-annual variability in streamflow (i.e., changes from year to year)
has been increasing over time, and can have negative effects on salmon populations. Water
temperatures and flow rates play important roles in the success of salmon migration success
and the health of offspring. The article is available at:
http://www.tandfonline.com/doi/abs/10.1080/02626667.2014.892602#.U3OxevldXms 12 (Padilla et
al., in press).
Article citation: Padilla, A., Rasouli, K. and Déry, S.J. (in press) Impacts of variability and trends in runoff
and water temperature on salmon migration in the Fraser River Basin, Canada. Hydrological
Sciences Journal. Available online (available online). doi: 10.1080/02626667.2014.892602
12
You need a subscription to the journal to access the article for free. You can access the article at a University or
College library.
173 Climate trends and Future Projections
3.1 Past trends in climate
A number of the research studies focused on the Nechako watershed included detailed study of
past trends in temperature, precipitation, hydrology and other factors. An overview of the
outputs of the cast studies that included trend analysis is included as Table 1. Afterward the
outcomes are briefly summarized.
Table 1 Overview of past climate trends in the Nechako Watershed.
Study description Past trends documented in temperature, Human observations of
precipitation, hydrology, etc. changes
Forestry in Several trends were noted in temperature 16 of 18 of local
Vanderhoof (I) between 1901-2000, including: respondents surveyed
Past climate o Average temperatures increased by 1.7°C per believed the climate has
trend data were century changed ‘appreciably’
assembled for o Minimum temperatures increased by 3.0°C per over the last 35 years.
Vanderhoof from century Common observations
regional weather o Maximum temperatures increased minimally. by participants include:
stations and from Winter, spring, summer and fall precipitation all milder winters; changes
climate records. increased until the 1960s, and since then no major in bird species; shorter
Local residents changes have been observed. logging seasons;
were surveyed increased freeze-thaw
about changes they cycles; more extreme
have witnessed in weather events; and a
their lifetimes ‘blending’ of the four
seasons.
Adaptation in The effects of climate variability are significant In 2004 the
Prince George (II) in Prince George. For example, El Niño winters are Transportation Manager
Researchers approximately 1.7°C warmer and 10% drier than examined local weather
examined past average conditions. data that showed clear
climate trends Several trends were noted in temperature warming trends, and
from the Prince between 1918-2006, including: decreasing precipitation
George Airport o Average air temperatures increased by 1.3°C falling as snow.
climate station and per century. Local City staff noted
analyzed trends o Minimum temperatures increased by 2.2°C many changes in winter
from 1918-2006, per century. conditions, including an
1931-2006, 1951- o Maximum temperatures increased by 0.4°C increase in winter thaw
2006 and 1971- per century events and rain-on-snow
2006. Since 1971 mean air temperatures increased at events.
Prince George a much more rapid rate of 4.6°C per century.
City staff have Since 1931 trends have been negative for
been noticing and snowfall and positive for rainfall, suggesting more
responding to precipitation is falling as rain.
changes in weather Since the 1960s streamflows have increased in
for many years winter and decreased in summer.
18Table 1 continued.
Study description Past trends documented in temperature, Human observations of
precipitation, hydrology, etc. changes
Omineca region Several trends in temperature from 1901-2009 No other types of
climate overview were noted, including: observations were noted
(IV) o Average annual temperatures increased by in this study.
Historical trends 1.9°C per century
for the region were o Average summer temperatures increased by
created by using 1.6°C per century
the CANGRID o Average winter temperatures increased by
dataset. This is a 2.6°C per century
gridded dataset Several trends in temperature from 1951-2009
that provides were also noted, including:
historical climate o Average annual temperatures increased by
data in Canada, 2.5°C per century
which are based on o Average summer temperatures increased by
Station 2.0°C per century
observations. It has o Average winter temperatures increased by
a spatial resolution 4.2°C per century
of 50 km and was From 1901 and 2009, precipitation increased
created by by:
Environment o 40 mm per century in summer
Canada o 30 mm per century in winter
From 1951 and 2009, precipitation increased by:
o 30 mm per century in summer
o -30 mm (decreased) per century in winter
Other: According to the model simulations (which apply No other types of
Snow budget observational data), over the period of 1949 to observations were noted
research (VI) 2006 there was a: in this study.
o 19% decline in the contribution of snow to
(The other studies run-off in the entire FRB.
did not include o 11% decline in the contribution of snow to
detailed past trend run-off in the Stuart River (a tributary of the
analysis.) Nechako).
o 17% decline in the contribution of snow to
run-off in the Nautley River (a tributary of the
Nechako).
3.1.1 Summary:
As a northern inland region, temperatures in Northern BC are warming faster than the
Provincial average, and much faster than the global average rate (Rodenhuis et al., 2009;
Picketts et al., 2012; Williamson et al., 2008). The results from the nine research studies reveal
some very clear trends in the NRB. The basin has been warming at a rate of about 1.3°C - 1.9°C
per century since the early 1900s, and the rates of warming have been much greater in recent
decades. The basin is warming more quickly in the winter than in the summer, and minimum
19temperatures (or night-time lows) are increasing faster than maximum temperatures (or day-
time highs).
Precipitation trends are much less consistent and less clear, which is not surprising as
precipitation varies considerably from year to year and from location to location. Precipitation
appears to have increased over the last century, but this may due more to cycles of climate
variability (that led to drier periods earlier in the century) than climate change. There have not
been major consistent trends in total precipitation in the NRB over the last 50 years; however,
one clear trend from the nine research studies is that there has been increasing rainfall and
decreasing snowfall throughout the watershed. As a result, stream-flow levels appear to be
increasing in the winter and decreasing in the summer.
3.2 Future climate projections
A number of the NRB research studies included future climate projections as part of their
research and analysis. Climate projections are typically generated by analyzing the outputs of
Global Climate Models (GCMs). Some studies also employ Regional Climate Models (RCMs),
which are like GCMs but are ‘zoomed in’ on a smaller area. RCMs help to show how
temperature and precipitation projections may differ across a landscape, and how geographic
features (such as mountains or large bodies of water) affect the local climate. Although RCMs
can convey important local information, they rely on complex downscaling methods and are
generally perceived as far less certain than GCMs.
GHG emissions scenarios, or estimations of future human emissions, are used to feed into
climate models. The emissions scenarios affect the level of future warming, particularly over
longer time periods (such as the end of 2100).13 Future projections are usually represented as a
change from baseline conditions.14 Often average conditions from 1961-1990 are used as
baseline conditions. This time frame (1961-1990) was used to establish baseline conditions for
all of the studies overviewed in Table 2.
It is important to note that most of future climate studies produce projections, and sometimes
these are used to create more detailed scenarios. Projections are meant to be exactly that, and
should not be thought of as definite predictions of what will happen. Most studies include a
range of projections that are typically the outputs from a number of GCMs that are run using
multiple emissions scenarios. Usually it is best to present a range of projections, rather than
just the outputs of one GCM simulation or calculating the average (or median) value of all
projections. Showing a range helps to communicate that there is a lot of uncertainty when
13
Different missions scenarios don’t have a large effect on the uncertainty (or range) of future projections until
after about the 2050s (Rodenhuis et al. 2009).
14
Usually baseline conditions are the average conditions over 30 years or more because (as previously mentioned)
climate varies naturally due to cycles of weather and climate variability.
20You can also read