Hemispheric Transport of Air Pollution 2010 - UNECE
←
→
Page content transcription
If your browser does not render page correctly, please read the page content below
Hemispheric Transport
                                                                of Air Pollution
                                                                     2010
                                                                      Part D: Answers to
                                                              Policy-Relevant Science Questions

                                                                 Air Pollution Studies No. 20

Printed at United Nations, Geneva   USD 15
GE.11-22136–June 2011–2,130         ISBN 978-92-1-117047-4
ECE/EB.AIR/103
United Nations publication
Sales No. E.11.II.E.10
ISSN 1014-4625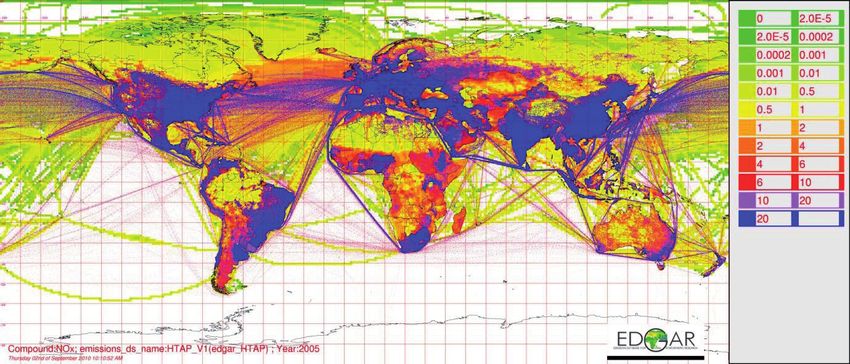
ECONOMIC COMMISSION FOR EUROPE
                        Geneva

HEMISPHERIC TRANSPORT OF
     AIR POLLUTION
          2010
        PART D: ANSWERS TO
POLICY-RELEVANT SCIENCE QUESTIONS

      AIR POLLUTION STUDIES No. 20

 Prepared by the Task Force on Hemispheric Transport of Air Pollution
                  acting within the framework of the
        Convention on Long-range Transboundary Air Pollution

                      UNITED NATIONS
                    New York and Geneva, 2010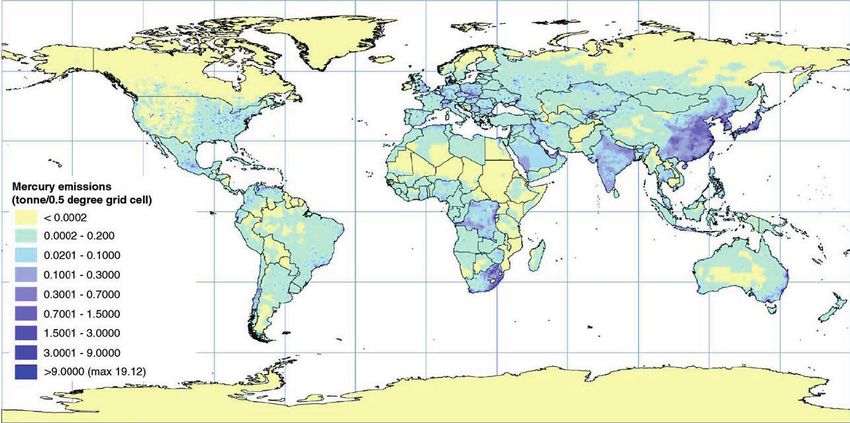
NOTE

         Symbols of United Nations documents are composed of capital letters combined with
figures. Mention of such symbols indicates a reference to a United Nations document.

         The designations employed and the presentation of the material in this publication do
not imply the expression of any opinion whatsoever on the part of the Secretariat of the
United Nations concerning the legal status of any country, territory, city or area, or of its
authorities, or concerning the delimitation of its frontiers or boundaries.

        In United Nations texts, the term “ton” refers to metric tons (1,000 kg or 2,204.6 lbs).

                                      Acknowledgements

The task force co-chairs and the secretariat would like to acknowledge the assistance of
EC/R, Inc., in preparing this publication. We would also like to acknowledge the invaluable
contribution of the individual experts and the Convention’s Programme Centres and Task
Forces.

                                      ECE/EB.AIR/103

                            UNITED NATIONS PUBLICATION
                                   Sales No. E.11.II.E.10
                                     ISSN 1014-4625
                                ISBN 978-92-1-117047-4
                             Copyright ® United Nations, 2010
                                    All rights reserved

UNECE Information Service                                     Phone: +41 (0) 22 917 44 44
Palais des Nations                                            Fax: +41 (0) 22 917 05 05
CH-1211 Geneva 10                                             E-mail: info.ece@unece.org
Switzerland                                                   Website: http://www.unece.org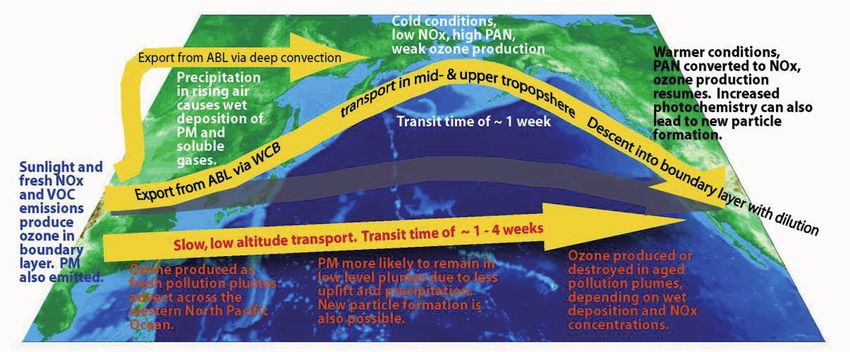
Contents
Tables ..................................................................................................................................................... v
Figures .................................................................................................................................................... v
Chemical Symbols, Acronyms and Abbreviations ............................................................................... vii
Preface ................................................................................................................................................... xi

Introduction ............................................................................................................................................ 1
1.      What is the observational evidence for the intercontinental transport of ozone,
        particulate matter, mercury, and persistent organic pollutants in the Northern
        Hemisphere? .............................................................................................................................. 3
                      Particulate Matter ...................................................................................................... 3
                      Ozone ........................................................................................................................ 4
                      Mercury ..................................................................................................................... 5
                      Persistent Organic Pollutants .................................................................................... 5
2.      What are the main processes that drive these intercontinental flows and determine
        their magnitudes? ...................................................................................................................... 7
                      A Source Apportionment Construct .......................................................................... 7
                      Drivers of Intercontinental Transport ....................................................................... 8
                      Atmospheric Circulation ........................................................................................... 9
                      Emissions .................................................................................................................. 9
                      Chemical and Physical Transformations................................................................. 11
                      Interactions with and Transformations in Other Environmental
                      Compartments ......................................................................................................... 12
3.      What do current models tell us about the contribution of intercontinental or global
        flows to concentrations and deposition in the different regions of the Northern
        Hemisphere and how changes in current emissions in one region affect air pollution
        concentrations or deposition in another region? ...................................................................... 15
                      Ozone ...................................................................................................................... 16
                      Particulate Matter .................................................................................................... 18
                      Mercury ................................................................................................................... 19
                      Persistent Organic Pollutants .................................................................................. 21
4.      What is the contribution of these intercontinental or global flows to impacts on
        human health, natural and agricultural ecosystems, and near-term climate change? .............. 23
                      Ozone ...................................................................................................................... 23
                      Particulate Matter .................................................................................................... 24
                      Mercury ................................................................................................................... 25
                      Persistent Organic Pollutants .................................................................................. 26
5.      How may the source-receptor relationships change over the next 20 to 40 years due to
        changes in emissions and climate change? .............................................................................. 27
                      Ozone and Particulate Matter.................................................................................. 27
                      Mercury ................................................................................................................... 28
                      Persistent Organic Pollutants .................................................................................. 30
6.      How well can we represent the processes that affect these intercontinental or global
        flows of air pollutants in quantitative models?........................................................................ 31
                      Ozone ...................................................................................................................... 31
                      Particulate Matter .................................................................................................... 34
                      Mercury ................................................................................................................... 34
                      Persistent Organic Pollutants .................................................................................. 35
7.      What efforts are needed to develop a system of observations, emissions, and models
        to better understand and track these flows? ............................................................................. 37

                                                                       iii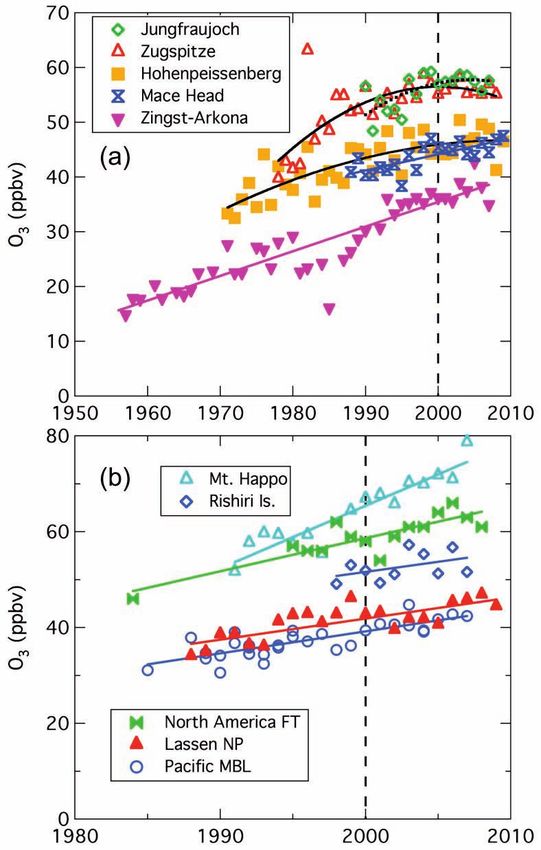
8.    What are the potential benefits of further international cooperation to address
      intercontinental transport of air pollution and how might this cooperation be
      structured? ............................................................................................................................... 41

                                                      Appendix

Appendix A        Editors, Authors, & Reviewers ............................................................................. 43

                                                               iv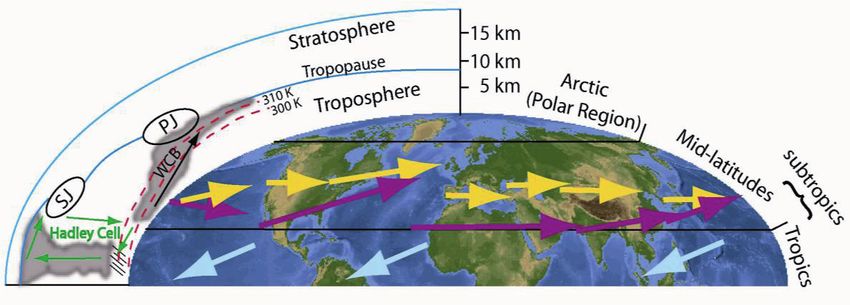
Tables
Table 3.1. Annual and spatial mean surface O3 response to 20% decreases in
anthropogenic precursor emissions (NOx, CO, VOC, plus aerosols and their
precursors). ................................................................................................................. 17
Table 3.2. The Relative Annual Intercontinental Response (RAIR) of pollutants to 20%
emission decreases in four regions approximating North America, Europe,
South Asia, and East Asia. ......................................................................................... 19
Table 5.1. The Relative Annual Intercontinental Response (RAIR) of pollutants to 20%
emission decreases in four regions approximating North America, Europe,
South Asia, and East Asia, under three scenarios: a 2001 base case, a high
global emissions scenario in 2030, and a low global emissions scenario in
2050. ........................................................................................................................... 28
Figures
Figure 1.1. A dust event that originated in the Sahara desert on 17 August 2007 and was
transported to the Gulf of Mexico. ............................................................................... 3
Figure 1.2. Springtime trends in O3 concentrations measured in (a) Europe and (b)
western North America and Japan................................................................................ 4
Figure 1.3. Atmospheric Monitoring Networks for POPs around the World. ................................ 6
Figure 2.1. Schematic diagram showing some of the main features of the atmosphere
related to the transport of air pollutants. ....................................................................... 9
Figure 2.2. Gridded map of anthropogenic NOx emissions in 2005 from EDGAR-HTAP
emissions database on a 0.1° × 0.1° grid .................................................................... 10
Figure 2.3. Spatial distribution of anthropogenic mercury emissions in 2000, within the
Z05 grid. ..................................................................................................................... 10
Figure 2.4. Transport and transformation processes during intercontinental transport of
O3 and PM.. ................................................................................................................ 11
Figure 2.5. Transport and transformation processes during intercontinental transport of
Hg ............................................................................................................................... 12
Figure 2.6. Examples of linkages among environmental compartments that must be taken
into account to understand impacts of Hg and POPs pollution transport. .................. 13
Figure 3.1. The main source and receptor regions used in the HTAP multi-model
experiments: North America (NA), Europe (EU), South Asia (SA), and East
Asia (EA).................................................................................................................... 15
Figure 5.1. The role of intercontinental transport and CH4 in future O3 scenarios. .................... 29
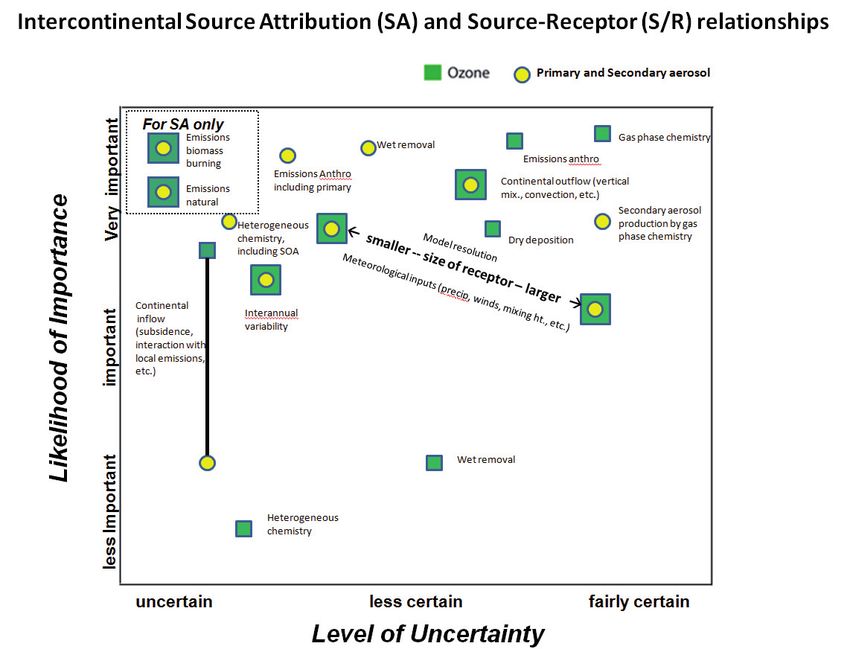
Figure 6.1. Classification of sources of uncertainty in global model estimates
intercontinental source-receptor relationships and source attribution for O3
and PM based on expert judgment. ............................................................................ 33
Figure 7.1. Major components of an integrated approach for source attribution related to
long range transport .................................................................................................... 38
v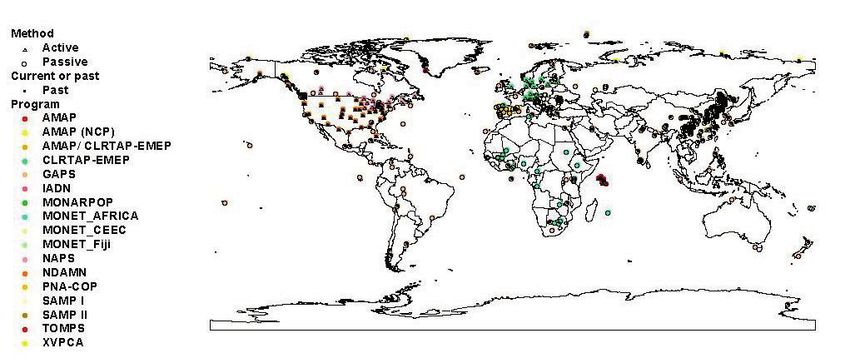
Chemical Symbols, Acronyms and Abbreviations

                               Chemical Abbreviations

C – carbon
CO – carbon monoxide
CO2 – carbon dioxide
CH4 – methane
DDT -- dichlorodiphenyltrichloroethane
HCH – hexachlorohexane
H2SO4 – sulphuric acid
HCB – hexachlorobenzene
HCHO – formaldehyde
Hg – mercury
Hg0 – elemental mercury
HgII – oxidized, ionic mercury
HgP – mercury bound to suspended particulate matter
MeHg – methyl mercury
NH3 – ammonia
NO2 – nitrogen dioxide
NO3 – nitrate
NOx – nitrogen oxides
NOy – total inorganic oxidized nitrogen
N2O5 -- dinitrogen pentoxide
Nr – total reactive nitrogen (including NOy and NHx)
O3 – ozone
PAH – polycyclic aromatic hydrocarbon
PBDE – pentabromodiphenyl ether
PCB – polychlorinated biphenyl
PCDD/F – pentachlorodibenzodioxins and furans
PFOA – perfluorooctanoic acid
PFOS – perfluorooctane sulfonate
SO2 – sulphur dioxide
SO4 –sulphate
SOx – anthropogenic sulphur oxides (combination of SO2 and SO4)
nss-SO4 – non-seasalt sulphate

                             Acronyms and Abbreviations

ABL – Atmospheric Boundary Layer
AC&C – Atmospheric Chemistry and Climate (an initiative of the International Geosphere-
        Biosphere Program-World Climate Research Program)
AeroCom – Aerosol Comparisons between Observations and Models (a global aerosol model
        intercomparison project)
AIRS – Atmospheric Infrared Sounder
AMDEs – Atmospheric Mercury Depletion Events
AOT-40 – Accumulated Ozone exposure over a Threshold of 40 parts per billion
asl – above sea level
CALIPSO – Cloud-Aerosol Lidar and Infrared Pathfinder Satellite Observations
CASTNet – Clean Air Status and Trends Network
CLRTAP – Convention on Long Range Transboundary Air Pollution

                                           vii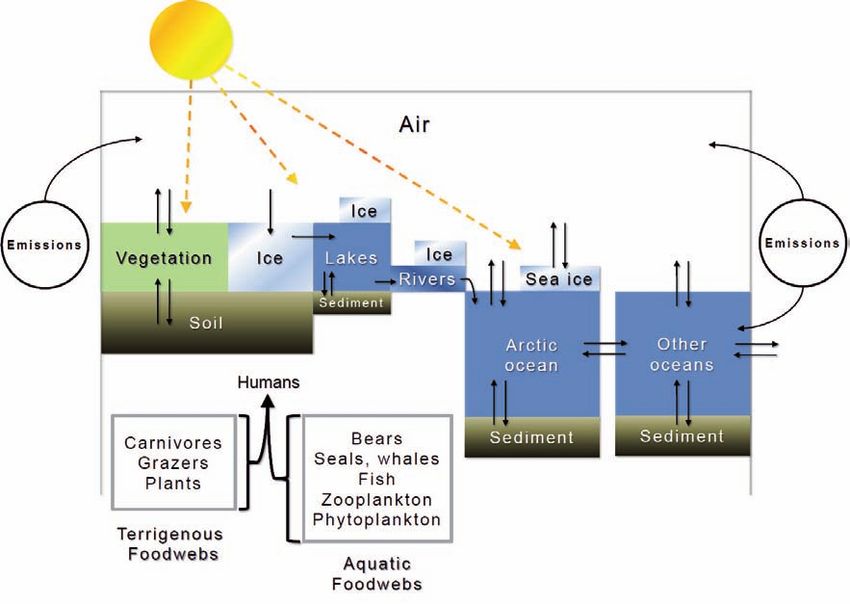
EA – East Asia
EANET – Acid Deposition Monitoring Network in East Asia
EBAS-HTAP – observation database developed by NILU
EDGAR – Emissions Database for Global Atmospheric Research
EMEP – Cooperative Programme for Monitoring and Evaluation of the Long-range
        Transmission of Air Pollutants in Europe
EMEP-CCC – EMEP Chemical Coordinating Centre
EU -- Europe
GAW – Global Atmospheric Watch Programme (within WMO)
GEO – Group on Earth Observations
GEOSS – Global Earth Observing System of Systems
HTAP – Hemispheric Transport of Air Pollution
ICAO – International Civil Aviation Organization
IGAC – International Global Atmospheric Chemistry
IGACO – Integrated Global Atmospheric Chemistry Observations
IGBP – International Geosphere-Biosphere Programme (part of the International Council of
        Scientific Unions)
IMO – International Maritime Organization
IPCC – Intergovernmental Panel on Climate Change
K – degrees Kelvin
km – kilometres
LRTAP – Long-range Transboundary Air Pollution
NA – North America
NASA – National Aeronautics and Space Administration
ng m-3 – nanograms per cubic metre
NILU – Norweigan Institute for Air Research
PAN – Peroxyacetyl Nitrate
PJ – Polar Jet stream
PM – Particulate Matter
POM – Particulate Organic Matter
POPs – Persistent Organic Pollutants
ppbv – parts per billion by volume
RAIR – Relative Annual Intercontinental Response
RCP – Representative Concentration Pathways
S/R – source-receptor
SA – South Asia
SJ – Subtropical Jet stream
SRES – Special Report on Emissions Scenarios
SUM06 – the sum of all hourly ozone concentrations greater than 0.06 parts per million
TF HTAP – Task Force on Hemispheric Transport of Air Pollutants
TP – process tracer study
μg/m3 – micrograms per cubic metre
UNECE – United Nations Economic Commission for Europe
UNEP – United Nations Environmental Programme
UNFCCC – United Nations Framework Convention on Climate Change
VOCs – Volatile Organic Compounds
WCB – Warm Conveyor Belt
WMO – World Meteorological Organization

                                           viii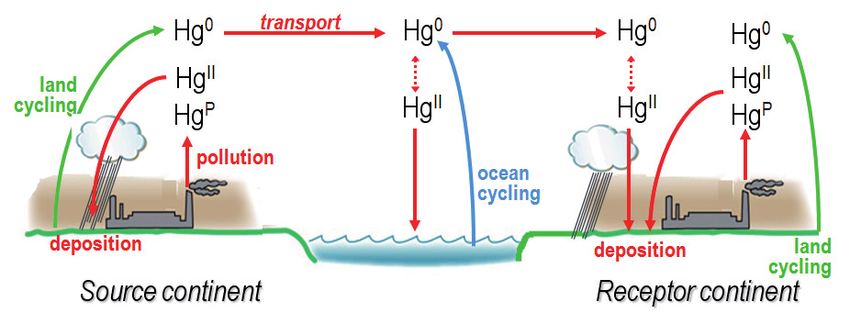
Preface
  In December 2004, in recognition of an increasing body of scientific evidence suggesting
the potential importance of intercontinental flows of air pollutants, the Convention on Long-
range Transboundary Air Pollution (LRTAP Convention) created the Task Force on
Hemispheric Transport of Air Pollution (TF HTAP). Under the leadership of the European
Union and the United States, the TF HTAP was charged with improving the understanding of
the intercontinental transport of air pollutants across the Northern Hemisphere for
consideration by the Convention. Parties to the Convention were encouraged to designate
experts to participate, and the task force chairs were encouraged to invite relevant experts to
participate from countries outside the Convention.
   Since its first meeting in June 2005, the TF HTAP has organized a series of projects and
collaborative experiments designed to advance the state-of-science related to the
intercontinental transport of ozone (O3), particulate matter (PM), mercury (Hg), and persistent
organic pollutants (POPs). It has also held a series of 15 meetings or workshops convened in
a variety of locations in North America, Europe, and Asia, which have been attended by more
than 700 individual experts from more than 38 countries. The TF HTAP leveraged its
resources by coordinating its meetings with those of other task forces and centres under the
convention as well as international organisations and initiatives such as the World
Meteorological Organization, the United Nations Environment Programme’s Chemicals
Programme and Regional Centres, the International Geosphere-Biosphere Program-World
Climate Research Program’s Atmospheric Chemistry and Climate (AC&C) Initiative, and the
Global Atmospheric Pollution Forum.
   In 2007, drawing upon some of the preliminary results of the work program, the TF HTAP
developed a first assessment of the intercontinental transport of ozone and particulate matter
to inform the LRTAP Convention’s review of the 1999 Gothenburg Protocol (UNECE Air
Pollution Series No. 16).
   The current 2010 assessment consists of 5 volumes. The first three volumes are technical
assessments of the state-of-science with respect to intercontinental transport of ozone and
particulate matter (Part A), mercury (Part B), and persistent organic pollutants (Part C). This
volume (Part D) is a synthesis of the main findings and recommendations of Parts A, B, and C
organized around a series of policy-relevant questions that were identified at the TF HTAP’s
first meeting and, with some minor revision along the way, have guided the TF HTAP’s
work. The fifth volume of the assessment is the TF HTAP Chairs’ report to the LRTAP
Convention, which serves as an Executive Summary.
  The objective of HTAP 2010 is not limited to informing the LRTAP Convention but, in a
wider context, to provide data and information to national governments and international
organizations on issues of long-range and intercontinental transport of air pollution and to
serve as a basis for future cooperative research and policy action.
  HTAP 2010 was made possible by the commitment and voluntary contributions of a large
network of experts in academia, government agencies and international organizations. We
would like to express our most sincere gratitude to all the contributing experts and in
particular to the Editors and Chapter Lead Authors of the assessment, who undertook a
coordinating role and guided the assessment to its finalisation.
   We would also like to thank the other task forces and centres under the LRTAP Convention
as well as the staff of the Convention secretariat and EC/R Inc., who supported our work and
the production of the report.

André Zuber and Terry Keating
Co-chairs of the Task Force on Hemispheric Transport of Air Pollution

                                               ix
Answers to Policy-Relevant Science Questions
Lead Authors: Terry Keating and André Zuber
Contributing Authors: Frank Dentener, Jessica Seddon, Oleg Travnikov, Alexy Gusev, Greg
Carmichael, David Parrish, Doug Grano
Introduction
Ozone (O3), particulate matter (PM), mercury (Hg), and persistent organic pollutants (POPs)
are significant environmental problems in many regions of the world. For each of these pollutants,
observed concentrations or deposition at any given location can be thought of as composed of several
different fractions, one of which is related to the intercontinental atmospheric transport of
anthropogenic emissions into the air. Other fractions may be associated with natural emission sources
or local and regional anthropogenic sources. Each fraction differs in terms of the emission sources
that contribute to it, the temporal and spatial variability of the contribution, and the potential for and
sensitivity to emission controls.
The Task Force on Hemispheric Transport of Air Pollution (TF HTAP) was organized under
the Convention on Long-range Transboundary Air Pollution (LRTAP Convention) to improve the
understanding of how the intercontinental transport of air pollutants across the Northern Hemisphere
affects the achievement of air quality and other environmental goals. The TF HTAP started by
articulating a series of policy-relevant science questions to guide its work and then organized a series
of cooperative projects and assessment activities to address these questions. These guiding questions,
which have evolved a little over the last five years, are as follows:
1. What is the observational evidence for the intercontinental transport of O3, PM, Hg, and
POPs in the Northern Hemisphere?
2. What are the main processes that drive these intercontinental flows and determine their
magnitudes?
3. What do current models tell us about the contribution of intercontinental or global flows to
concentrations and deposition in the different regions of the Northern Hemisphere and how
changes in current emissions in one region affect air pollution concentrations or deposition
in another region?
4. What is the contribution of these intercontinental or global flows to impacts on human
health, natural and agricultural ecosystems, and near-term climate change?
5. How may the source-receptor relationships change over the next 20 to 40 years due to
changes in emissions and climate change?
6. How well can we represent the processes that affect these intercontinental or global flows
of air pollutants in quantitative models?
7. What efforts are needed to develop a system of observations, emissions, and models to
better understand and track these flows?
8. What are the potential benefits of further international cooperation to address
intercontinental transport of air pollution and how might this cooperation be structured?
In this volume (Part D of HTAP 2010), we provide summary answers to these questions,
drawing upon the more detailed information presented in Parts A, B, and C of the report. The
summary information presented here is provided without references to the scientific literature. For the
supporting analysis that underlies the findings presented here, the reader is encouraged to refer to the
technical discussions in Parts A, B, and C which contain extensive bibliographies.
1The main messages that emerge from the answers to these questions are as follows:
x O3, PM, Hg, and POPs are significant environmental problems in many regions of the world.
x Mitigation of intercontinental transport is not a substitute for emission reductions at the local
and regional scale. In most cases, concentrations within a source region are more sensitive to
emission changes within that region.
x However, without further international cooperation to mitigate intercontinental flows of air
pollution, many nations are not able currently to meet their own goals and objectives for
protecting public health and environmental quality.
x With changing global emissions, it is likely that over the next 20 to 40 years it will become even
more difficult for nations to meet their own environmental policy objectives without
international cooperation to address transboundary and intercontinental flows of air pollution.
x Cooperation to decrease emissions that contribute to intercontinental transport of air pollution
has significant benefits for both source and receptor countries.
x There are formal intergovernmental forums for furthering global cooperation to mitigate sources
of POPs and Hg. However, there is no existing international agreement addressing global or
intercontinental flows of O3 and PM pollution across the Northern Hemisphere.
21. What is the observational evidence for the intercontinental transport of ozone,
particulate matter, mercury, and persistent organic pollutants in the Northern
Hemisphere?
Observations from instruments and collectors on the ground, connected to balloons, in
aircraft, or on satellites provide a wealth of evidence that concentrations and deposition of O3, PM,
Hg, and POPs are influenced by atmospheric transport between continents and, in some cases, around
the globe.
Particulate Matter
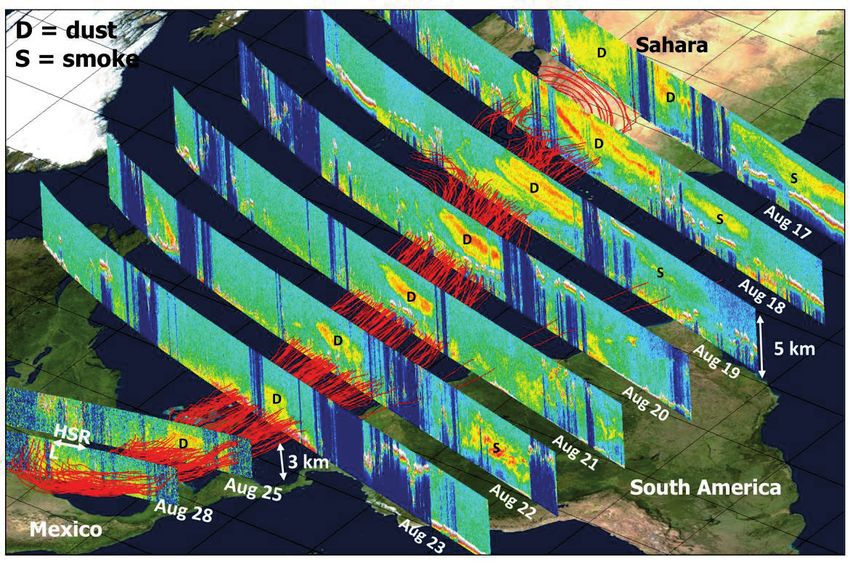
Some of the most tangible evidence for intercontinental transport of air pollution comes from
satellite images of PM concentrations, often associated with forest or grass fires and windblown soil
dust storms, which travel across oceans and continents in visible plumes. Within the past few years
satellites have begun to provide quantitative information on intercontinental transport of PM pollution
associated with these events, as well as for more typical emissions from fossil fuel combustion. These
data include estimates of the amount of pollution transported, the altitude of transport and in some
cases, aerosol properties, such as their ability to reflect or absorb solar radiation. Figure 1.1 presents
observations of trans-Atlantic transport of Saharan dust and open biomass burning smoke from
CALIPSO (Cloud-Aerosol Lidar and Infrared Pathfinder Satellite Observations).
Figure 1.1. A dust event that originated in the Sahara desert on 17 August 2007 and was
transported to the Gulf of Mexico. Red lines represent back trajectories indicating the
transport track of the dust event. Vertical images are 532 nm attenuated backscatter
coefficients measured by CALIPSO when passing over the dust transport track. The letter
‘‘D’’ designates the dust layer, and ‘‘S’’ represents smoke layers from biomass burning in
Africa (17–19 August) and South America (22 August). [Graphic courtesy of Kurt Severance
at NASA Langley Research Center.]
Ground-based lidar networks and mountain top measurement sites in Europe, North America
and Asia provide large continuous data sets that characterize the frequency of occurrence of aerosol
transport events, the meteorological conditions responsible for them, and important information on
aerosol properties. Evidence of intercontinental transport is also provided in the form of long-term
trends in surface concentration and wet deposition observations from remote islands and other remote
locations, which in some cases are comparable to the emission trends in upwind areas. Some in situ
measurements have also illuminated the importance of secondary aerosol formation from precursors
3transported from other regions. Observations of the trace element composition and stable isotope
ratios of PM have been useful in assessing the importance of natural and anthropogenic sources and
studying processing of aerosols in transit.
Ozone
For O3, evidence of intercontinental transport comes from direct O3 measurements as well as
measurements of precursor gases. Plumes of elevated O3 have been observed in the free troposphere
and at high elevation sites. Most importantly, an increasing trend in baseline O3 concentrations, i.e.,
concentrations in air masses without the contribution from local anthropogenic emissions, has been
measured consistently at a number of remote sites across the Northern Hemisphere, shown in Figure
1.2. Measurements suggest that during the latter half of the 20th century, concentrations of O3 at
northern mid-latitudes increased by a factor of two or more. It is likely that much of this change is due
to increases in anthropogenic emissions of O3 precursors.
Figure 1.2. Springtime trends in O3 concentrations measured in (a) Europe and (b) western North
America and Japan. The lines (in colour) indicate the linear regressions to the data, and the curves
(in black) indicate quadratic polynomial fits to the three central European sites over the time span
of the lines. Arkona and Zingst are two sites located close to the Baltic Sea. Mace Head is located at
the west coast of Ireland. Hohenpiessenberg (1.0 km asl) and Zugspitze (3.0 km asl) are in southern
Germany, and Jungfraujoch (3.6 km asl) is in Switzerland. The North American data are from
several sea level Pacific coastal sites and Lassen National Park (1.8 km asl) near the west coast, and
from the free troposphere over the western part of the continent. The Japanese data are from Mt.
Happo (1.9 km asl) on the Japanese mainland and Rishiri, a northern (45N) sea level island site.
4Within the limits of the measurement records, the increase has been comparable throughout
all longitudes, and has occurred in all seasons. More recently, more rapid increases have been
observed downwind of eastern Asia in the free troposphere, whereas the increases within the
boundary layer of central Europe and North America have slowed down. Measurements at some
locations on the western coasts of Europe and North America clearly show that trans-oceanic air flows
can carry O3 concentrations that approach or exceed air quality standards and objectives, and that air
can mix to the surface and contribute substantially to air quality standard violations. This is
particularly noticeable in areas with low emissions. The impact on surface air quality depends upon
vertical mixing of air into the boundary layer, which is enhanced by complex topography.
Mercury
In the atmosphere, Hg is found in the form of elemental Hg (Hg0), and ionic Hg in both gas
and particle form. While PM is often removed from the atmosphere by wet or dry deposition within a
matter of days to weeks and O3 may last weeks to months, Hg0 has an average residence time in the
atmosphere of six months to a year. This is sufficient time to become relatively well-mixed, creating
Hg0 baseline concentrations of 1.5 to 1.7 nanograms per cubic metre (ng m-3) in the Northern
Hemisphere and 1.1 to 1.3 ng m-3 in the Southern Hemisphere (at sea level). This inter-hemispheric
gradient has been observed consistently during ocean cruises.
Hg0 is removed from the atmosphere after oxidation to ionic Hg, which may exist as a gas or
incorporated into aerosols. Whether as a gas or an aerosol, ionic Hg deposits relatively quickly and is
estimated to comprise less than five percent of the total atmospheric loading of Hg. Thus, the potential
for intercontinental transport of Hg emissions depends on the chemical form in which it is emitted.
Natural emissions are almost entirely Hg0; however, anthropogenic sources emit a mixture of Hg0 and
ionic Hg in gas and particle forms.
The intercontinental transport of Hg has been observed in episodic events of elevated Hg0
concentrations recorded at remote mountain top sites and during aircraft measurement campaigns.
Such events observed in North America have been linked, based on backward trajectories and
correlation with other atmospheric pollutant concentrations, such as co-emitted carbon monoxide
(CO), to air masses originating over Asia. Analysis of such events suggests that Asian emissions have
been underestimated in available emissions inventories.
Evidence for intercontinental transport of Hg into the Arctic, which has no primary
anthropogenic sources, is also provided by observations of elevated levels of Hg in the tissue of
Arctic wildlife.
Long-term changes in the atmospheric Hg burden have been derived from chemical analysis of
lake sediments, ice cores, and peat deposits, and observed in firn air samples. Such evidence from both
hemispheres suggests about a threefold increase of Hg deposition since pre-industrial times,
emphasizing the importance of anthropogenic sources to current Hg levels in the environment.
Measured deposition trends in Europe and North America are consistent with regional emission
controls. However, global trends in concentrations and deposition are ambiguous, which may indicate
off-setting effects between emission trends in Asia and the other parts of the world and significant
recycling of Hg among environmental components. Our ability to understand these trends and the
cycling of Hg is limited by the sparsity of long-term observations for Hg concentrations and deposition.
Persistent Organic Pollutants
POPs have long lifetimes in the environment, often cycling among different environmental
compartments (i.e., air, water, soil, vegetation, snow, and ice). Thus, through direct emission and
transport or repeated cycles of emission, transport, deposition and re-emission, POPs can end up in
the environment far from their emission source. The overall potential and dominant mechanisms for
intercontinental atmospheric transport vary among individual POPs, since these have widely different
chemical characteristics. Evidence for intercontinental transport is provided from observations in
remote locations far from emission sources and in elevated levels in plumes observed at mountain top
5sites and during aircraft campaigns. Concentrations of POPs are often correlated with other
anthropogenic pollutants.
Existing atmospheric monitoring programmes provide adequate spatial coverage of
atmospheric concentration information for most POPs in the United Nations Economic Commission
for Europe region, see Figure 1.3. The introduction of passive samplers that can measure air
concentrations has significantly enhanced the spatial coverage of observations in other regions of the
world. However, only a few monitoring programmes also analyse POPs in precipitation from which
total deposition can be estimated.
Figure 1.3. Atmospheric monitoring networks for POPs around the world.
Some long-term air monitoring programmes provide temporal trends with a time span of
approximately 15 years, during which time international emission controls for many POPs have been
implemented. For some POPs (e.g., technical Hexachlorocyclohexane (or HCH)), observed
concentration trends show declines correlated with international emission controls. In other cases (e.g.,
p,p’- Dichlorodiphenyltrichloroethane (or DDT) at the Arctic stations of Alert and Pallas), observed
trends show slow or no significant decline in air concentrations in response to international emission
controls. The observed values have been shown to be correlated with climate change parameters, which
affect the cycles of transport, deposition, and re-emission that drive intercontinental transport of these
pollutants. However, our ability to understand the influence of these processes is limited by a lack of
measurements and organized monitoring of POPs in media other than air.
Although the observational record is sufficient to demonstrate that PM, O3, Hg, and POPs are
transported on intercontinental scales, to understand the contribution of these intercontinental flows to
health and environmental impacts and the significance of these flows for environmental management
now and in the future, the observational evidence must be combined with quantitative models that
describe the processes of emission, transport, transformation, and removal that drive the observed
concentrations and deposition.
62. What are the main processes that drive these intercontinental flows and determine
their magnitudes?
A Source Apportionment Construct
To understand the significance of the intercontinental transport of air pollution for air quality
and other environment goals and the importance of the various processes which drive this transport, it
is helpful to think about how air pollution concentrations and deposition may be apportioned back to
emission sources. For O3, PM, Hg, and POPs, observed concentrations or deposition at any given
location can be thought of as composed of several different fractions, one of which is related to the
intercontinental transport of anthropogenic emissions. Other fractions may be associated with natural
emission sources or local and regional anthropogenic sources. Each fraction differs in terms of the
emission sources that contribute to it, the temporal and spatial variability of the contribution, and the
potential for and sensitivity to emission controls. Dividing observed concentrations and deposition
into these distinct parts provides a construct to analyse the importance of different drivers and sources
of air pollution now and in the future.
Attributing ground-level O3 back to the emission sources that contribute to its formation is
complicated by the fact that O3 is not emitted, but is formed in the atmosphere through a non-linear
system of photochemical reactions of emitted precursors, including nitrogen oxides (NOX), volatile
organic compounds (VOC), CO, and methane (CH4). Observed surface O3 concentrations may be
thought of as composed of:
x O3 that is transported from the stratosphere
x O3 that is formed in the troposphere from
o natural precursor emissions, including lightning, soil, fire, and vegetation emissions
o anthropogenic precursor emissions that have been transported on intercontinental
scales
o anthropogenic precursor emissions from local or regional sources
The O3 precursors from different sources interact in the atmosphere such that O3 may be
produced from natural or anthropogenic, local or transported, or a combination of natural and
anthropogenic or local and transported emissions.
Each of the fractions that comprise observed O3 differs in terms of (1) sensitivity to changes
in precursor emissions, (2) the extent to which they can be controlled by a national or sub-national
jurisdiction, and (3) the magnitude of the contribution. The relative contribution of each fraction
varies widely by location and season and has evolved over time. We have confidence that human
activities have contributed to the positive trend in mean surface O3 levels observed in the Northern
Hemisphere over the latter half of the twentieth century. However, there remain large uncertainties in
our estimates of the source attribution for these changes.
PM concentrations and deposition are comprised of different chemical components, some of
which are directly emitted as particles by natural or anthropogenic sources and are commonly referred
to as primary PM. Other components are emitted by natural or anthropogenic sources as gases and
form particles through chemical and physical reactions in the atmosphere and are commonly referred
to as secondary PM. Both primary and secondary PM play a role in intercontinental transport. For
purposes of understanding the role of intercontinental transport, PM concentrations or deposition may
be thought of as composed of:
x volcanic eruptions, vegetation, and wind-blown dust (the last of which can be exacerbated by
anthropogenic factors)
x open biomass (vegetation) burning, some of which is natural and some of which may be
anthropogenic
7x anthropogenic emissions that have been transported on intercontinental scales
x local and regional anthropogenic sources
The relative magnitudes of these fractions and their sensitivity to emission changes differ by
location, season, year, and chemical component. Primary particles such as soil dust and black carbon,
which are directly emitted into the atmosphere, respond linearly to changes in their emission sources.
Secondary particles, such as sulphate and organic aerosols, are partly formed in the atmosphere
through chemical and physical reactions of precursor gases that were directly emitted. These
secondary particles may have a slight non-linear response to emission changes due to their
dependence on oxidation and other reactions. The fractions also differ to the extent to which they can
be controlled by a local or regional jurisdiction.
For Hg, adverse environmental and health impacts are associated with deposition and entry into
aquatic and terrestrial food chains. While Hg0 tends to dominate atmospheric loading and is the form in
which Hg is transported long distances, Hg deposition is dominated by ionic Hg. Dry deposition and wet
removal are both significant contributors to the total deposition of Hg. Once deposited, Hg may be re-
emitted to the atmosphere. Thus, for purposes of apportioning deposition and subsequent impacts back
to emission sources, Hg deposition can be divided into the following four fractions:
x Hg that was released originally from natural sources as Hg0 and subsequently oxidized and
deposited
x legacy Hg that was released from anthropogenic sources originally and deposited before
being re-emitted as Hg0 and subsequently oxidized and deposited again
x newly-released Hg that was released from anthropogenic sources primarily as Hg0 and
transported on intercontinental scales before being oxidized and deposited
x newly-released Hg that was released from local and regional anthropogenic sources primarily
as ionic Hg and quickly deposited
Similar to Hg, many POPs cycle back and forth between the atmosphere and other
environmental media in cycles of emission, transport, deposition, and re-emission. Unlike Hg, most
POPs do not have significant natural sources, except for polycyclic aromatic hydrocarbons (PAHs)
associated with natural biomass burning. Thus, observed POPs concentrations or deposition can be
apportioned into the following fractions:
x re-emitted POPs that were originally released from anthropogenic sources then deposited
before being re-emitted
x newly-released POPs that were released from anthropogenic sources and have been
transported on intercontinental scales
x newly-released POPs that were released from local and regional anthropogenic sources
The relative importance of each of these fractions varies depending on the individual
compound of interest and the location of the receptor relative to sources. POPs differ in terms of gas-
particle partitioning, degradation pathways, and deposition processes, affecting the potential for
atmospheric transport on relatively short time scales (monthly or annual basis). Some POPs may cycle
between the atmosphere and other environmental compartments (i.e., water, soil, vegetation, snow,
and ice) for decades and re-emission may be the largest source of input to the atmosphere. For very
long-lived pollutants, transport in ocean currents also plays an important role in determining levels in
locations remote from sources.
Drivers of Intercontinental Transport
The contribution that each of the fractions described above makes to the concentration or
deposition observed at any given location is driven by the circulation of the atmosphere, the location
and magnitude of emissions, chemical and physical transformations of the pollutants, and interactions
8with and transformations in other environmental compartments. These processes are described in
more detail below.
Atmospheric Circulation
In the mid-latitudes of the Northern Hemisphere, the general circulation is dominated by
westerly winds that flow from Asia across the North Pacific Ocean to North America, from North
America across the North Atlantic Ocean to Europe, and from Europe into Asia. These prevailing
winds are depicted in Figure 2.1. Pollution is entrained in this flow by passing frontal systems and by
deep convection that lift pollutants out of the lowest layer of the troposphere, known as the
atmospheric boundary layer (ABL), and into the mid- and upper troposphere where it can be rapidly
transported towards a downwind continent. Intercontinental transport also occurs in the boundary
layer, but at slower speeds. Long-range transport of pollutants can produce distinct plumes in the mid-
and upper troposphere, but to be relevant to air quality in a downwind continent, the pollution must
descend to the surface. As the plumes descend they are diluted and can be difficult to distinguish from
local pollution, especially in receptor regions with relatively high emissions.
The tropics and subtropics are dominated by the Hadley cell, with rising motion within deep
convective cumulus towers in the deep tropics, which is balanced by subsiding motion in the
subtropics. In the tropics, intercontinental transport is generally from east to west, guided by the trade
winds throughout the lower and mid-troposphere.
In the Northern Hemisphere polar region, the cold and stable lower troposphere forms a dome
over the Arctic, largely isolating the region from low latitude pollution that is emitted into warm air
masses that ascend into the mid- and upper troposphere above the Arctic. Pollutant transport into the
Arctic lower troposphere occurs preferentially from Europe when the outer regions of the Arctic dome
pass over northern Europe, take up fresh emissions and then retreat back into the Arctic.
Figure 2.1. Schematic diagram showing some of the main features of the atmosphere related
to the transport of air pollutants. The vertical cross section shows the average location of the
tropopause (the boundary between the troposphere and stratosphere) and the polar (PJ) and
subtropical (SJ) jet streams during winter. Vertical transport during winter is dominated by
deep convective clouds in the tropics (the upward branch of the Hadley cell) and warm
conveyor belts (WCBs) created by cyclones in the mid-latitudes. The average location of the
jet stream is shown across the entire Northern Hemisphere for winter (magenta arrows) and
summer (yellow arrows); locations of the tropical easterlies are also shown (light blue arrows).
Also shown are the winter locations of the 300 K and 310 K potential temperature surfaces
(red).
Emissions
The magnitude and impact of hemispheric and intercontinental scale transport of air
pollutants is initially determined by the global distribution of emissions, and their spatial relation to
the major meteorological transport pathways described above. Figure 2.2 shows the global
distribution of anthropogenic NOx emissions. Figure 2.3 shows the global distribution of
9anthropogenic emissions of Hg, not including open biomass burning sources. The location of
emissions with respect to the dominant atmospheric transport patterns has a strong influence on the
frequency and strength of intercontinental pollution transport. For example, the intense emission
regions along the east coasts of North America and Asia are at the origins of the North Atlantic and
North Pacific mid-latitude cyclone storm tracks, which can loft the emissions and transport them to
the free troposphere above downwind continents in a matter of days. With Western Europe located at
the end of the North Atlantic storm track, its emissions are not lofted to the same extent as those on
the east coasts of North America and Asia. Instead, European emissions are exported at relatively low
altitudes and have a strong impact on the Arctic.
Figure 2.2. Gridded map of anthropogenic NOx emissions in 2005 from EDGAR-HTAP
emissions database on a 0.1° × 0.1° grid (in tons/grid cell). (No emissions from forest fires or
savannah burning are included.) [Graphic courtesy of Emission Database for Global
Atmospheric Research (EDGAR), European Commission Joint Research Centre and
Netherlands Environmental Assessment Agency.]
Figure 2.3. Spatial distribution of anthropogenic mercury emissions (combined point and
‘distributed’ sources for all species in all emission height classes) in 2000, within the Z05
(0.5x0.51) grid. [Reprinted from Figure 5 from Wilson, S. J., et al. (2006), Mapping the
spatial distribution of global anthropogenic mercury atmospheric emission inventories,
Atmospheric Environment, 40(24): 4621-4632, with permission from Elsevier.]
10Many of the anthropogenic sources of O3 and PM precursors and Hg emissions are associated
with fossil fuel combustion or open biomass burning, and therefore, are similarly distributed. Many
POPs, however, are pesticides or industrial chemicals that have very different patterns of manufacture
and use. The manufacture or use of many of these chemicals is now banned in many countries. Thus,
the importance of intercontinental transport is strongly dependent on where the chemicals have been
used in the past or are still in use.
Chemical and Physical Transformations
Intercontinental pollution transport occurs on timescales of days to weeks, longer than the
atmospheric lifetimes of some pollutants, and ample time for the trace gases and PM emitted or
produced at the source to undergo removal or chemical transformation. By the time a polluted air
mass arrives at a downwind continent, it is likely to have very different chemical properties than it did
at the source. The chemical transformation processes that occur during intercontinental transport are
numerous and complex.
Using transport from Asia to North America as an example, Figure 2.4 depicts a few of the
most important chemical transformation processes for O3 and PM that take place in a polluted air
mass during transport. The chemical and physical transformation and removal processes that take
place during transport differ depending on whether the polluted air is transported in the atmospheric
boundary layer near the surface or the polluted air is lifted to the mid- and upper troposphere. These
processes are described in more detail in Part A, Section 1.2.3.
Figure 2.4. Transport and transformation processes during intercontinental transport of O 3 and
PM. Blue text on the left applies to continental boundary layer processes, red text apples to
low level transport and black/white text applies to high altitude transport.
For Hg, transformations between elemental and oxidized forms and the partitioning between
the gas, aqueous, and particle phases largely determine whether Hg is transported long distances or is
removed from the atmosphere. Hg is emitted into the atmosphere as Hg0 in gaseous form or as
oxidized, ionic Hg (HgII) in gaseous form or bound to suspended particulate matter (HgP). Hg0, which
has an average atmospheric lifetime of six months to a year, dominates atmospheric loading and is
typically the form in which Hg is transported long distances. Ionic Hg is removed from the
atmosphere very quickly through dry deposition and wet removal processes. These processes are
illustrated in Figure 2.5.
11Figure 2.5. Transport and transformation processes during intercontinental transport of Hg.
[Graphic courtesy of Lyatt Jaegle, University of Washington.]
For POPs, residence time in the atmosphere is largely determined by the rate of degradation
through chemical reactions (primarily with hydroxyl radicals) and the rate of wet or dry deposition to
surfaces. Many POPs are semi-volatile, such that they distribute between the gas phase and aerosols in
the atmosphere, affecting the rates of degradation and deposition. Once deposited, semi-volatile POPs
may also be re-volatilized, re-entering the atmosphere. Through such re-emission, some POPs are able
to be transported very long distances in multiple “hops” consisting of repeated cycles of transport,
deposition, and volatilization.
Interactions With and Transformations In Other Environmental Compartments
Because of the cycling of Hg and POPs among the atmosphere and land, ocean, and
vegetative surfaces, models of the atmospheric transport of Hg and POPs must account for the
emission or re-emission of Hg and POPs from surfaces and the chemical and physical processes that
occur in surface media that permanently remove the substances from circulation in the environment.
Figure 2.6 depicts the various environmental compartments and the linkages among them that must be
taken into account to understand Hg and POPs transport.
Studies using spatially and temporally resolved transport models show that substances do not
have inherent total environmental lifetimes and long-range transport potentials are not intrinsic
substance properties. The potential for long-range transport depends strongly on the time, location,
chemical and physical form of emissions; the concentration of other substances in the atmosphere and
other environmental media; and the past history of emissions and environmental conditions. For
example, the mean total environmental lifetime of DDT applied in agriculture in the 1980s was
considerably longer than in the 1970s and 1990s, in large part due to shifts in the geographic
distribution of DDT use that occurred over this period.
Air-sea exchange of semi-volatile POPs and Hg allows for multiple cycles through the
atmosphere and ocean. Ocean transport is expected to be most important for persistent substances that
are highly water soluble and have low vapour pressure, such as perfluorinated acids, which are a
relatively new class of POPs. In the Northern Hemisphere, atmospheric transport tends to be zonal
(west-east) in nature, whereas oceanic transport enhances meridional (north-south) transport as
relatively fast currents exist along the African and American continents, leading to net northward
transport in the Northern Hemisphere oceans. On the other hand, transfer of contaminants from
surface waters to the deep sea by both deep water formation and sinking with sedimenting particulate
matter may slow down long-range transport and suppress the mobility of pollutants.
Moreover, the public health and environmental impacts associated with Hg and POPs
pollution are realized primarily through the contamination of aquatic and terrestrial food webs. To
assess these impacts, one must take into account the chemical and physical transformations that occur
in other media (e.g., methylation of Hg), as well as processes of bioconcentration, bioaccumulation,
and biomagnification in food webs.
12Figure 2.6. Examples of linkages among environmental compartments that must be taken into
account to understand impacts of Hg and POPs pollution transport.
133. What do current models tell us about the contribution of intercontinental or global
flows to concentrations and deposition in the different regions of the Northern
Hemisphere and how changes in current emissions in one region affect air pollution
concentrations or deposition in another region?
Using current quantitative models, in conjunction with emission estimates and observations,
the contribution of intercontinental transport to concentrations and deposition in different regions of
the world may be estimated. These estimates may be based on methods that “tag” emissions and trace
them through the model from emission to concentration or deposition. Alternatively, these estimates
may be based on the sensitivity of concentrations or deposition to changes in emissions. In the case of
a largely inert pollutant that is permanently removed from the atmosphere upon deposition,
concentrations are linearly related to emissions and these two modelling approaches give similar
results as the contribution of all sources at a particular receptor is additive. This linear assumption is a
good approximation for most PM components and the newly-emitted fractions of Hg and POPs.
However, for O3, which has a non-linear dependence on precursor emissions, and re-emissions of Hg
and POPs, which are dependent on past emission histories and emissions from other media, the two
methods may give different perceptions of the importance of different sources.
To characterize the magnitude of intercontinental transport and the level of agreement among
current models, the TF HTAP organized a series of multi-model experiments. The first set of these
experiments was based on the emissions sensitivity approach, examining the impacts of 20% emission
decreases of relevant anthropogenic pollutants in four regions, approximately covering the major
populated areas of North America, Europe, South Asia, and East Asia. These regions are shown in
Figure 3.1. These names are used hereinafter to refer to these rectangular regions, which encompass
more than 75% of the anthropogenic emission sources in the Northern Hemisphere but also include
significant areas of ocean. Specific analyses were also made to quantify the impact in the Arctic of
emission changes in these four source regions. The findings from these experiments for each of the
pollutants of interest are discussed below. The limitations of the models are discussed in more detail
in the response to Question 6.
Figure 3.1. The main source and receptor regions used in the HTAP multi-model
experiments: North America (NA), Europe (EU), South Asia (SA), and East Asia (EA).
Additional analyses examined the Arctic (AR) as a receptor region. For PM and Hg, some
additional source and receptor regions relevant to those issues were examined.
15You can also read