Chapter 3: Korea and the Electronics Global Value Chain - September 2017 Stacey Frederick and Joonkoo Lee - Duke Global ...
←
→
Page content transcription
If your browser does not render page correctly, please read the page content below
Joint Project between GVCC and KIET

Chapter 3: Korea and the Electronics
Global Value Chain

September 2017
Stacey Frederick and Joonkoo Lee

© Duke GVC Center, September 2017
Chapter 3: Korea and the Electronics Global Value Chain1

Table of Contents
3. Korea and the Electronics Global Value Chain ................................................................... 3-4
  3.1. The Electronics Global Value Chain ............................................................................. 3-5
    3.1.1. Mapping the Electronics Global Value Chain ....................................................... 3-5
    3.1.2. Geographic Distribution (global supply and demand) ......................................... 3-11
    3.1.3. Key Firms and Segments in the Electronics GVC ............................................... 3-13
    3.1.4. Standards and Institutions .................................................................................... 3-18
    3.1.5. Human Capital and Workforce Development...................................................... 3-20
    3.1.6. Upgrading Trajectories ........................................................................................ 3-22
  3.2. The Asian Electronics Regional Value Chain ............................................................. 3-22
    3.2.1. Regional Dynamics and Trends ........................................................................... 3-23
    3.2.2. Cooperation and Competition in Asian RVCs ..................................................... 3-23
  3.3. Korea and the Electronics Global Value Chain .......................................................... 3-28
    3.3.1. Development of the Electronics Industry in Korea.............................................. 3-29
    3.3.2. Korea’s Participation in the Electronics GVC/RVC ............................................ 3-32
    3.3.3. Product Profile and End Markets ......................................................................... 3-33
    3.3.4. Institutional Context (sector-specific) and Supporting Stakeholders .................. 3-38
    3.3.5. Electronics Recommendations ............................................................................... 3-1
  References ................................................................................................................................ 3-6
  Appendix .................................................................................................................................. 3-9

List of Tables
Table 3-1. 3C Electronics, Volume (Units) and Value (US$), 2007-2015 .................................. 3-7
Table 3-2. Market Share of 3C Categories, 2007-2015 and Number of Firms ........................... 3-8
Table 3-3. World Consumer Electronics, Market Size, Top Firms, Shares, and Change, 2015.. 3-9
Table 3-4. World Electronics Exports, 2000, 2007 and 2014 .................................................... 3-11
Table 3-5. Top 10 World Exporters of Electronic 3C Final Products, 2000, 2007 and 2014 ... 3-12
Table 3-6. Top 15 Electronics Contract Manufacturers (EMS & ODM), 2014 ........................ 3-15
Table 3-7. Top 10 Semiconductor Firms by Revenue in 2010 and 2014 .................................. 3-16
Table 3-8. Segments of the Electronics GVC with Country Examples ..................................... 3-17
Table 3-9. Important Standards in the Electronics GVC ........................................................... 3-19
Table 3-10. Employee Profile for the Electronics Manufacturing Global Value Chain ............ 3-21
Table 3-11. Types of Upgrading in the Electronics GVC ......................................................... 3-22
Table 3-12. Milestones in the Korean Electronics Industry, 1970s-2000s ................................ 3-30
Table 3-13. Korea’s Exports by Sector, 1970-1998 .................................................................. 3-30
Table 3-14. Korean Investment in Electronics in China, 1980s-1997 ....................................... 3-31
Table 3-15. ICT Equipment and Device Production in Korea (trillion KRW) .......................... 3-32
Table 3-16. Korea Electronics Exports: Final, Subassemblies and Components, 2000-2015 ... 3-35
Table 3-17. Types of 3C Subassemblies Exported from Korea & Top Destinations, 2000-15 . 3-36
Table 3-18. Major Policy Measures Supporting the Korean Electronics Industry .................... 3-38
Table 3-19. Electronics National Core Technology Areas .......................................................... 3-1
Table A-3-1. Electronics Product Categories, Based on Trade Data Classifications .................. 3-9

1
    Chapter prepared by Stacey Frederick and Joonkoo Lee.
Table A-3-2. Korea Electronics: Establishments, Employment, Output, 2012 ........................... 3-9
Table A-3-3. Supporting Electronics-Specific Stakeholders by Focus Area ............................. 3-10

List of Figures
Figure 3-1. Electronics “3C” Global Value Chain....................................................................... 3-5
Figure 3-2. World Consumer Electronics Demand, by Retail Volume & Region, 2002-15 ..... 3-13
Figure 3-3. Samsung’s Electronics Value Chain ....................................................................... 3-25
Figure 3-4. LG Electronics (top) and LG Display (bottom) Value Chains ............................... 3-26
Figure 3-5. Apple’s iPhone4s Supply Chain.............................................................................. 3-27
Figure 3-6. Korea’s Annual Outward FDI in Electronics, 1990-2016 ...................................... 3-33
Figure 3-7. Korea’s Participation in the Electronics Global Value Chain, 2015 ....................... 3-34
Figure 3-8. Korea’s Electronics Exports, by Value Chain Segment, 2000-2015 ...................... 3-34
Figure 3-9. Korea’s Electronic Component Export Destinations, 2000-2015 ........................... 3-36
Figure 3-10. K-ICT Strategy: Vision and Goals ........................................................................ 3-39

List of Boxes
Box 3-1. Learning from Korea’s Experience in the Animation GVC ......................................... 3-4
Acronyms
3C         Computers, Communications and Consumer Electronics
A&T        Assembly & Testing
AMOLED     Active-Matrix Organic Light-Emitting Diode
B2B        Business to Business
COGS       Cost of Goods Sold
CRT        Cathode Ray Tube
E&E        Electronics & Electrical
EDA        Electronic Design Automation
EMS        Electronic Manufacturing Services
EU         European Union
FTA        Free Trade Agreement
FYP        Five-Year Plan
GVC        Global Value Chain
HDD        Hard Disk Drives
HS         Harmonized System
IC         Integrated Circuit
IPD        Integrated Passive Devices
IT         Information Technology
IoT        Internet of Things
LCD        Liquid Crystal Display
MNC        Multinational Corporation
NPD        New Product Development
ODM        Original Design Manufacturer
OEM        Original Equipment Manufacturer
OLED       Organic Light-Emitting Diode
PCB        Printed Circuit Board
PCBA       Printed Circuit Board Assembly
PDP        Plasma Display Panel
PLC        Programmable Logic Control
PMOLED     Passive Matrix Organic Light-Emitting Diode
R&D        Research and Development
SATS       Semiconductor Assembly and Testing Services
SMT        Surface Mount Technique
STEM       Science, Technology, Engineering and Mathematics
TFT        Thin-Film Transistor
THT        Through-Hole
US         United States
3. Korea and the Electronics Global Value Chain

Since its entry into the industry in the late 1960s, Korea has established itself as a global leader
in the electronics sector. At the same time, the industry has been integral to the country’s
economic growth over the past half century. By 1988, electronics accounted for approximately
25% of exports, making it the country’s largest export category. The sector has maintained this
share over the past 30 years. Today, exports from Korea are primarily key intermediate inputs
including semiconductors and displays. In 2015, Korea’s total electronics export were valued at
US$120 billion. Korea is home to two of the top global electronics brands, Samsung and LG, and
is a technology leader in the key components and subassemblies for these products, memory
semiconductors (Samsung and Hynik) and displays (Samsung and LG). These firms are global
household names and their brands are synonymous with innovation around the world.

Innovation in the electronics industry is driving major changes in manufacturing around the
world. The electronics hardware global value chain, coupled with the broader information and
communication technology (ICT) services industry, are perhaps the most dynamic and important
industries to consider when discussing the future of global value chains and industry 4.0.
Automation and servicification related to big data and the Internet of Things (IoT) are possible
because of the development and pervasiveness of electronic components and widespread ICT
infrastructure. While all industries, including electronics, will be impacted by industry 4.0 trends,
electronics are also what enable these trends to exist. As such, Korea’s participation in this GVC
has implications for the country’s future role in the electronics value chain, and in defining,
designing, and diffusing the technologies that are enabled by electronic components.

Korea’s leadership of global change, nonetheless, is limited by the current scope of the country’s
firms. While Korean firms hold a strong position in consumer products and key physical
components, they are comparatively weak in non-consumer electronics markets (industrial,
medical, aerospace and automotive) as well as in the software and programming-related service
segments of the value chain. The country was the 5th global exporter of electronic components,
but in other end markets, such as industrial and medical electronics, Korea is not as important,
ranking 10th and 7th respectively with few globally-recognized firms. To maintain a leadership
position, Korea will need to leverage existing strengths to move into these new areas.

This will require multidisciplinary interaction between manufacturing and service-related
sectors, as well as expanding the workforce with skills in computational sciences. Korea’s strong
background in science and engineering and industrial base are strengths in this area. However,
these strengths in science and manufacturing will need to be married with business-related skills
to translate new technical developments into marketable products.

This report uses the Global Value Chains (GVC) framework to analyze Korea’s participation and
leadership in the electronics global value chain. As one of the most highly traded industries, it
provides significant insight into how countries engage in global chains. As Korea’s major export
industry, the country’s performance in the electronics GVC can provide important lessons for
how Korea may be able to leverage its leadership, using Industry 4.0 trends to drive industrial
transformation of its economy.
3.1. The Electronics Global Value Chain
3.1.1. Mapping the Electronics Global Value Chain
The electronics industry is comprised of electronic components, subassemblies, and final
products. Electronics are capable of storing and/or processing information, which implies the
product has semiconductors/integrated circuits (IC). There is an opportunity for nearly all
products to perform electronic functions, the adoption rate has been faster in some areas. For
example, a basic refrigerator is an electrical appliance, but a “smart refrigerator” capable of
varying internal temperature or sending a message to your mobile phone is embedded with ICs
and thus would be considered an electronic product as well. In the electronics industry, these
non-traditional products are referred to as embedded products.
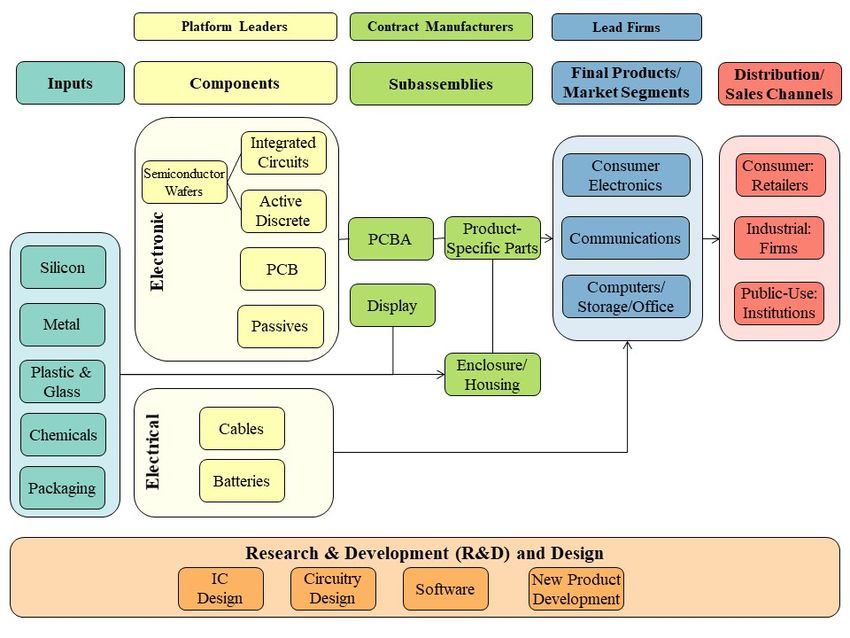
Figure 3-1 presents a map of the electronics GVC.2 It is composed of raw materials and inputs,
components, subassemblies, final product assembly for a variety of end market segments, and the
ultimate buyers of final products. The value chain also includes several activities that add value
to final products outside of the manufacturing process related to research, product and process
development, design, marketing and after-sales services. Some of the main activities include new
product development, circuitry and semiconductor design, and software. These are among the
most profitable and are controlled by lead firms and leading component suppliers, and are often
the last activities to be performed in offshore locations or outsourced.
Figure 3-1. Electronics “3C” Global Value Chain
Source: Frederick, 2017; 3C refers to consumer electronics, computers and communication devices.
2
The Harmonized System (HS) codes used to define the industry is in the Appendix. This definition builds on those
provided in (Frederick & Gereffi, 2013, 2016).
The inputs and raw materials needed to make electronic components vary by component. The
materials used in semiconductor fabrication include silicon and silicon chips (for wafers), plastic
(to form the layers of circuit boards), ceramics, various metals (mainly aluminum and copper,
but also gold and silver), and doped chemicals and other materials. Elements boron, gallium,
phosphorus, and arsenic are used in silicon chips to turn a silicon crystal from a good insulator
into a viable conductor, or anything in between. Key inputs to other electronic components
include various quantities of metals such as aluminum, copper, gold, and silver.

The next stage in the value chain is components. Electronic components are electronic elements
with two or more connecting leads or metallic pads intended to be connected, usually by
soldering to a printed circuit board (PCB), to create an electronic circuit (IBISWorld, 2015b).
They can be categorized as passive or active, where active components amplify voltage and
control the flow of electric current in a circuit. Semiconductors and passives are configured
together in an electronic subsystem, the most common type being a printed circuit board
assembly (PCBA), for incorporation into a complete electronic subassembly (Freedonia, 2012).
Integrated circuits (or semiconductors) are the most expensive components, and the most
important given these are what enable a product to process and/or store information. There are
multiple types of ICs, including memory, logic, microprocessors, and microcontrollers.

Electronic subassemblies vary by final product; however, circuit boards are found in most
electronic products. A circuit board is put into a plastic or metal enclosure (also called casing or
housing) to form a subassembly. Manufacturers at this stage may be responsible for creating the
PCBA and/or putting it in its casing; the manufacturer may take on the responsibility of sourcing
raw materials or perform the operations on a contract or consignment basis for another firm. The
electro-mechanical assembly process involves enclosure fabrication, installation of
subassemblies and components, and installation and routing of cables. A term used by industry to
refer to this stage is “box-build” or systems integration, which means assembly work other than
just PCBA.3 The final assembled product is then a “product-specific” part, indicating it is ready
to go into a definable final product.

Displays are another common subassembly in consumer electronics, and if included, is often the
most expensive intermediate input. The two main types today are: liquid crystal displays (LCD)
and organic light emitting diode (OLED); prior technologies included plasma display panels
(PDP), while the earliest displays were from cathode ray tubes (CRT). LCD and OLED markets
are broken up based on size (large versus small; TV versus computers/phones) and types. For
example, within OLED there is active-matrix OLED (AMOLED) and passive matrix OLED
(PMOLED). As OLED technology is introduced, the size of the LCD market overall going down
(based on value), however as of 2016, the LCD market is still much larger than OLED ($85
versus $15 billion)(IHS, 2016).

The distribution and sales methods for electronics components vary by type and the relative
value of the part. Passive electronic component manufacturers (other than semiconductors) sell
over half of their products via distributors (Ulama, 2015). Semiconductor and PCB companies
are more likely to sell their products directly to electronic product manufacturers (IBISWorld,
2012). How finished ICs are sold to downstream manufacturers depends on a combination of

3
    https://www.ventureoutsource.com/contract-manufacturing/information-center/terms-and-definitions
product type and scale. Customized products are sold directly to specific buyers whereas
standard products go through distributors; large buyers receive direct shipments whereas smaller
buyers source from distributors. Regardless of how the product is sold, the components may be
shipped from the Assembly and Testing (A&T) facility to the main distribution center of the
semiconductor, distributor, or assembly company in the region (in Asia, these are primarily in
Singapore, Taiwan, and Hong Kong), even if the purchasing firm is physically in the same
country as the A&T facility.

Final products are destined to a growing range of end markets, from computers and consumer
electronics, to appliances, cars, medical equipment and devices, industrial equipment, and
aerospace and defense (A&D) products. In this report, the three principal end markets, or the
“3Cs” -- computers, consumer electronics, and communications and networking (or cell phones)
-- are analyzed (Table 3-1). These markets, starting with consumer electronics, and followed by
computers and communication devices, were the original products capable of storing and
processing information, and the entire output of these industries is included in this analysis. In
the 3Cs, the lead firms are electronic specialists with technical expertise in the industry. These
are all primarily consumer market products produced in high volumes with declining unit values
as product replacement cycles are less than five years (and less than two years in several markets
and product categories). Communication devices (cell phones) are the only segment to increase
in value and volume. Compared to consumer electronics and computers, they are higher volume,
lower value products. Of the 3C categories, they accounted for 62% of volume, but only 43% of
value in 2015 (Table 3-1).

Table 3-1. 3C Electronics, Volume (Units) and Value (US$), 2007-2015
                                 2015, millions         Change (%), 2007-15        Unit Value        Share, 2015
        Segment
                                Vol       Value           Vol          Value          2015         Vol      Value
3C Total                        2,583     683,971            26%            17%           $257
Consumer Electronics              537     206,849           -35%           -25%           $346      21%       30%
Computers                         446     180,565            53%             9%           $405      17%       26%
Cell Phones                     1,600     296,557            72%          107%            $185      62%       43%
Source: Euromonitor (2016); Note: volume data not available for video game hardware (part of consumer
electronics); shares for volume and unit values do not include video game hardware, however shares based on value
include video game hardware.

The division between what is considered a computer compared to a consumer electronic or
communication device (particularly cell phones) is increasingly blurry which causes some issues
in directly comparing data across sources. The growth of smaller portable devices, including
laptops, tablets, and mobile phones, which increasingly have the same capabilities as in-home
devices, is decreasing the need to have individual units by function. Furthermore, most visual
and audio media is now available via the Internet, and physical discs (which required the use of a
video/DVD player or a portable audio player) are no longer needed. This greatly reduces the
‘tangible output,’ and will also result in a decline in exports (with a corresponding increase in
service-related trade in software). This convergence in technological capabilities also makes it
difficult to accurately segment consumer electronics into comparable categories across sources.4

4
 For example, Pegatron, a contract manufacturer, includes tablets, game consoles, LCD TVs, e-readers, and
multimedia players (MP3) as consumer electronics (Pegatron, 2015). However, tablets and e-readers are classified as
computers in other sources (e.g., trade data).
Table 3-2. Market Share of 3C Categories, 2007-2015 and Number of Firms
                                Market Share (%)                                   Number of Firms (2015)
            Consumer                                                      Consumer                 Cell     Video
Country                 Computers      Cell Phones        Video Games                 Computers
           Electronics                                                   Electronics             Phones Games
           2007 2015 2007 2015 2007             2015      2007     2015
Korea       12% 21% 9% 12%              22%       27% --              0%            2         2          2       1
Japan       33% 26% 14% 8%               2%        2%       71%      57%          13          8          3       2
US          11% 11% 33% 34%                                 14%      28%            8        12          3       4
                                        54%       18%
Europe       5% 4% 1% 1%                                --       --                 2         3          2 --
China        4% 9% 5% 10%                3%       27%        0%       0%            9        10         11       1
Taiwan --        --      10% 12%         2%        2% --         --                           4          2 --
Share
            67% 72% 73% 77%             82%       80%       84%      85%          34        ~40         20       8
Known
Source: based on market data from Euromonitor (2016); represent volumes except video games.

Computers: This segment, which also includes storage devices, servers and office equipment, is
comprised of consumer products as well as enterprise or commercial products purchased by
businesses. Computers for personal use (i.e., laptops/notebooks, desktops) are the main consumer
product. These are produced in large volume and have experienced tremendous growth in the last
decade, but has stagnated due to the growth of smaller, more handheld electronics with similar
capabilities such as smartphones. Manufacturing of most top computer brands is by contract
manufacturers who have the global scale to produce for this high-volume market. This segment
also includes printers, scanners, copiers, fax machines (and combinations thereof), as well as
parts of computer systems sold individually (keyboard, display, mouse, etc.), however these
account for a relatively small share of the overall value.

Products in the enterprise segment include computer systems, servers and storage devices;5 this
is a smaller, but growing market due to companies and individuals saving more data and the
trend towards cloud computing rather than saving all data locally on a device. The lead firms in
this segment differ from those in the personal computer segment and align more with the
communication and networking end market.

Of the 3C markets, computers are the smallest based on value and volume. In 2015, this market
value was $181 billion with 446 million units sold (Euromonitor, 2016) for an average unit value
of $405. Overall volume and to a lesser extent value have increased.

Computer companies/brands have two significant groupings; the top four, which accounted for
44% of retail volume in 2015, and the top 7 (60%). There is a significant drop in volume after
this point. Over the last eight years, US firms have maintained the top position with
approximately one-third of the market, while Asian firms in Korea, Taiwan and particularly
China have increased market share at the expense of Japanese firms. At the firm-level, growth
has been driven by Apple (US), Lenovo, the Chinese firm that acquired IBM’s computer
business in 2005, Asus (Taiwan), and Samsung (Korea).

5
    Storage devices are components of personal computers and industrial computers as well as standalone products.
Contract manufacturing is the dominate production model in the computer segment. For
notebook PCs, the top five ODM/EMS companies accounted for three-quarters of global
shipments in 2014 (131 of 172 million units)(Pegatron, 2015). Of the top five computer brands,
only Samsung and Lenovo have in-house manufacturing.
Consumer Electronics: this group is broken into in-home products (TVs, DVD players, home
audio and video), digital cameras, portable players, and video game hardware. Consumer
electronics were still the largest of the ‘3C’ categories in 2015, but significance is falling in
terms of value and volume (Table 3-3). In 2015, 537 million units were sold (not including video
game hardware) with a market value of $207 billion (video game hardware included). The
number of units and the value have declined in all product categories (except TV volume, which
has slightly increased by 4% between 2007 and 2015). The largest segment is TVs, accounting
for 64% (based on value) and 41% (based on volume) in 2015.
Japanese firms still hold the largest market share (26%), but it is declining as Korean (21%) and
Chinese (9%) firms increase market share. US firms’ volume has decreased, but it has
maintained market share. European firms have not been prominent in this segment. As demand
has decreased, the industry has become more concentrated at the firm level. The share held by
the top three firms has increased (26% to 32%). In video game hardware, Japanese and US firms
dominate the (85% of 2015 market value). In the in-home segment, Samsung, LG, and Sony are
the top firms. They accounted for 41% in 2015; up from 31% in 2007 (for TVs only, the shares
increased from 33 to 43%).
Table 3-3. World Consumer Electronics, Market Size, Top Firms, Shares, and Change, 2015
Change % Top 3 Unit
2015 (millions) Top 3 Firms/Brands,
Category (2007-15) Share Value
2015 (Volume)
Volume Value Vol Value 2015 2015
Total Consumer Electronics 537 206,849 -35% -25% Samsung, LG, Sony 32% --
(1) In-Home 353 155,542 -20% -14% Samsung, LG, Sony 41% $440
TVs 222 133,325 4% -5% Samsung, LG, Sony 43% $602
Sony, Samsung,
Home Audio/Cinema 86 17,836 -19% -26% 36% $207
Philips
Video Players 45 4,381 -63% -73% Samsung, Sony, LG 48% $96
(2) Imaging Devices 62 18,748 -68% -59% Canon, Nikon, Sony 53% $302
(3) Portable Players 122 11,787 -36% -51% Apple, Sony, Amazon 35% $97
Sony, Microsoft,
(4) Video Game Hardware -- 20,773 -- -15% 80% --
Nintendo
Source: Euromonitor (2016); Values are based on RSP. Note: volume data for video game hardware is not available.
The unique features of this segment are that (1) most firms own manufacturing facilities rather
than use contract manufacturers; and (2) they are also at least quasi-vertically integrated for key
components. For example, for LCD televisions, Samsung and LG outsource less than 15% of
final production. However, even though they own manufacturing, essentially all production is
offshore (98%+ in 2014). Until 2010, Sony followed a similar model, but dramatically increased
outsourcing after the economic crisis (which is now around 75%). Chinese firms, except Haier,
also primarily manufacture in-house (TCL, HiSense, Skyworth and Konka).The imaging devices (digital cameras) the market was valued at $18.7 billion in 2015. Since 2007, the segment has seen the greatest volume decline of all the consumer electronics categories (-68% from 2007 to 2015), yet unit values increased from $239 to $302 (Euromonitor, 2016). Mobile phones have taken away the need for separate cameras, but there is still a niche market for higher-end models. The market is concentrated; just eight firms accounted for 87% of the global market in 2015 (by volume), and is dominated by Japanese firms (78%); the top five firms -- Canon, Nikon, Sony, FujiFilm and Panasonic -- are all Japanese (Euromonitor, 2016). The only company to increase production volume between 2007 and 2015 was GoPro (US). Portable players, which includes e-readers and portable media players, is the smallest category based on retail value (6%), but made up 23% by volume in 2015. The average unit value in 2015 was $97. The top three companies accounted for 35% of the market (based on volume in 2015). The top companies and brands are Apple (iPod, Beats), Sony and Amazon (Kindle). US companies dominate in this segment. Video game hardware is highly concentrated with the top three companies accounting for 80% of sales in 2015. These are Sony (42%), Microsoft (23%) and Nintendo (15%) (Euromonitor, 2016). The market value was $21 billion in 2015; down from $28 billion in 2008. Cell Phones: Overall volume is increasing in this segment. Between 2007 and 2015, only one of the top brands (Samsung) maintained its position in the top three. The other two (Nokia and Motorola) were both absorbed by other companies (Microsoft and Lenovo). The top three companies in 2015 were Samsung, Apple and Huawei (40% share based on volume). The most notable changes between the two years are the emergence of Apple and Chinese firms/brands. Apple went from less than 1% market share to 13% and Chinese firms from 3% to 27% (with six of the top 10 firms being Chinese). Samsung also doubled market share (Euromonitor, 2016). Outside of Apple however, US/European firms saw their market share decline by more than half; from 54% to 18% (Motorola went from being a US to a Chinese firm over this time period) (Euromonitor, 2016). While Korean firms have been able to maintain market share in cell phones, the rapid growth of Chinese producers suggests they will likely out-produce Korean firms within the next two years (at least based on volume). Both countries accounted for approximately 27% in 2015, however Korea had 22% in 2007 whereas China was only 3%. A variety of production models are used in this segment. Korean firms manufacture in-house (but offshore), Chinese firms are mixed (Huawei, Xiaomi outsource, Lenovo and ZTE have a mixed strategy; TCL is in-house); the two US firms, Apple outsources while Motorola manufacturers in-house, but offshore (Vietnam). Software is a key service-related segment of the electronics value chain, and is composed, for the most part, of a different set of firms than those engaged in manufacturing and differs based on the market. The video game software industry is much larger than video game hardware and is composed of a different group of companies. In 2015, video game software had a value of $78.5 billion. While still smaller than the major hardware segments (phones, computers and TVs), it is growing and offers opportunities for smaller firms. The top five based on value in 2015 only held 15% of the market. The top three positions are US firms, but a variety of Asian companies from China, Japan and Korea also participate (Euromonitor, 2016).
In computers, Microsoft dominates software (combined with Intel microprocessors).
In mobile phones, Google playing a leading role in the development of the Android open-source
operating system and Qualcomm dominates the design of microprocessors for smartphones. In
the first quarter of 2016, 84% of smartphones were based on the Android OS, with
approximately 15% from Apple’s iOS use only in its own products (Sun & Grimes, 2016). The
other two OS each have less than 1% of the market: Research in Motion (Blackberry) and
Microsoft (Windows Phone).

        3.1.2. Geographic Distribution (global supply and demand)

Global trade in the electronics industry has shifted from developed markets and towards Asia, in
terms of both demand and supply. While the shift of production towards the region has been
steady because of lower costs and access to raw materials, more recently the rapid growth of the
Asian consumer market has also made the region important on the demand side. This section
examines these changes, analyzing the main countries participating (exporting and importing) in
the different segments of the GVC, including key end markets.

Global supply is represented by both the countries that export components (parts and product-
specific subassemblies), and those that assemble and export final products that incorporate them.
Table 3-4 lists world exports by value chain stage and the final product/subassembly categories
identifiable using trade statistics: computers/storage devices/office equipment, consumer
electronics, and communication equipment.

Exports of final 3C electronic products were US$1 trillion in 2014 (Table 3-4). Computers were
the largest category in 2014; however mobile devices surpassed computers in 2015
(UNComtrade, 2017a).

Table 3-4. World Electronics Exports, 2000, 2007 and 2014
                                             Export Value ($US, B)   Share of Total (%)      Change (%)
             Category/Share
                                             2000    2007    2014    2000 2007 2014       2000-14 2007-14
World Total                                  1,150 1,792 2,285                               99%      27%
Communication Equipment                        116     218     389   10%    12%    17%      236%      78%
Computers/Storage Devices/Office Equipment     217     315     417   19%    18%    18%       92%      33%
Consumer Electronics                           100     214     200    9%    12%     9%       99%       -7%
Industrial Final                                43      85     113    4%     5%     5%      163%      32%
Medical Final                                   17      42      52    1%     2%     2%      203%      25%
3C Subassemblies                               255     316     327   22%    18%    14%       29%        4%
Industrial Subassemblies                        12      23      31    1%     1%     1%      158%      38%
Electronic Components                          390     580     756   34%    32%    33%       94%      30%
By VC Stage
Final                                          493    874    1,170   43%    49%    51%      137%      34%
Subassembly                                    267    338      359   23%    19%    16%       34%       6%
Components                                     390    580      756   34%    32%    33%       94%      30%
Final 3C Total                                 433    747    1,006   38%    42%    44%      132%      35%
Source: UNComtrade (2017a); HS96
China has maintained its lead in the final assembly stage over the past decade, representing 40%
of final product exports in 2014 (Table 3-5). Export growth has also been strong for Vietnam,
Thailand, the United Arab Emirates (UAE), and to a lesser extent, Mexico. In terms of export
share, other top exporters have remained stable (US, EU-15, Korea, Malaysia and Singapore) or
declined (Japan and Taiwan).
Table 3-5. Top 10 World Exporters of Electronic 3C Final Products, 2000, 2007 and 2014
Country Share of World
Export Value ($, US Billions) Change (%)
Reporter Exports (%)
2000 2007 2014 2000 2007 2014 2000-14
World 433 747 1,006 132%
China 28 228 405 6% 31% 40% 1339%
EU-15 143 165 139 33% 22% 14% -3%
US 53 54 74 12% 7% 7% 41%
Hong Kong 18 38 65 4% 5% 6% 259%
Mexico 25 42 53 6% 6% 5% 113%
UAE n/a 3 31 n/a 0% 3% n/a
Vietnam 0 1 30 0% 0% 3% 52189%
Korea 21 34 24 5% 5% 2% 19%
Thailand 5 17 21 1% 2% 2% 299%
Singapore 25 22 21 6% 3% 2% -17%
Japan 40 24 12 9% 3% 1% -70%
Other Asia, nes 21 11 13 5% 1% 1% -39%
Malaysia 19 26 19 4% 4% 2% 3%
Top 10 (in given year) 393 865 91% 86% 120%
Source: UNComtrade (2017a); top exporters based on export value.
Global demand is represented by the top importers of final products and retail data. The main
consumers in both 2007 and 2014 were the EU-15, US, China/Hong Kong, and Japan. However,
demand for 3C final products is becoming less dependent on the US and the EU-15. In 2000,
these two markets accounted for 62% of world imports, however this was down to 47% in 2014
(UNComtrade, 2017b). Using the same groups as below, Asia-Pacific increased from 21% to
26% between 2000 and 2014 and the Middle East and Africa went from 1% to 6%.
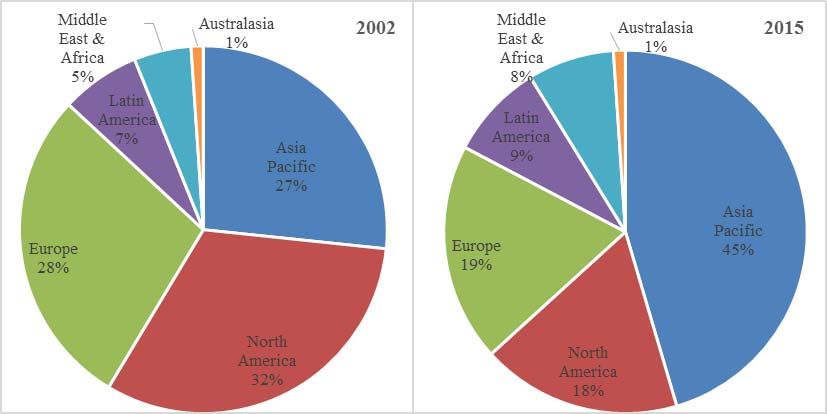
Based on retail volume, the Asia-Pacific region increased its share of demand for consumer
electronics from 27% in 2002 to 45% in 2015, surpassing North America to become the largest
market in 2004. Growth has been primarily driven by China, which accounted for half of that
demand. While demand has grown in North America and Western Europe, this has been at a
much slower pace than in Asia (Euromonitor, 2016).Figure 3-2. World Consumer Electronics Demand, by Retail Volume & Region, 2002-15
Source: Euromonitor (2016). Australasia: Australia and New Zealand; North America: USA and Canada; Middle
East/Africa (includes UAE, Saudi Arabia and South Africa); Europe (incl. Russia); Latin America (incl. Mexico).
3.1.3. Key Firms and Segments in the Electronics GVC
The electronics industry is comprised of three main groups of actors: lead firms, Tier 1
suppliers and contract manufacturers, and component suppliers. 6 Many other entities play
important roles in the broader industry, including software developers, production equipment
manufacturers, distributors, and producers of more generic components and subsystems, but
understanding how these three firm-level actors interact provides the most important insights into
economic development opportunities. The share of the total value captured by the most powerful
firms in GVCs – in this case, lead firms and component suppliers with strong “platform
leadership” - can be extremely high (Sturgeon & Kawakami, 2010). These actors control product
and technology development that are crucial for competing in the final product market, while the
introduction of new applications and better-engineered components drives growth in the chain.
Lead firms concentrate their activities in the highest value stages for final products; these
activities include marketing, branding, research, design, and product development. Some lead
firms still assemble products in-house, but outsourcing final product and subassembly activities
to contract manufacturers has been a strong trend over the past three decades (Sturgeon &
Kawakami, 2011). This enables them to focus on the highest ‘intangible’ value-adding activities
listed above without having to also focus on achieving production efficiencies. Production and
logistics activities require a different set of skills and tasks than inventing and marketing final
goods, so dividing the chain in this way enables the different actors to each develop a more
specialized set of core competencies.
6
The term “Tier 1” is used in end markets in which the final product is not typically considered an “electronic.” For
example, in the automotive industry, lead firms are motor vehicle manufacturers (e.g., Ford, Mazda, or Toyota),
however the primary electronic suppliers (such as those listed in the table) are considered Tier 1. In most cases the
Tier 1 engages in manufacturing, but it is also possible for the Tier 1 to outsource to an EMS contract manufacturer.
This is an important distinction because the distance between the contract manufacturer and the lead firm is further
removed in these end markets.The outsourcing of manufacturing functions and services by lead firms gave rise to the emergence of large supplier firms of varying degrees of sophistication and business models. Production services in the electronics industry include activities such as component purchasing, PCBA, final product assembly, and testing. In the industry, this is referred to as electronics manufacturing services (EMS). In addition to manufacturing, some contract manufacturers also provide design services; contractors that provide manufacturing plus product design services are known collectively as original design manufacturers (ODM). A few of the largest cater to large volumes for the computer, communication, and consumer electronics. Others, particularly those beyond the top 15, are specialists in automotive, medical or other niche markets. Some specialize in products with short life-cycles; others in products with longer life-cycles. A few also do design work (and thus resemble original design manufacturers)(van Liemt, 2016). Contract manufacturers establish their own global production networks to produce products and/or provide design services on behalf of lead firms for a specified period of time.7 The popularity of contract manufacturing in the electronics industry is enabled by value chain modularity, which enables a clear technical division of labor between design and manufacturing at multiple points in the value chain, most notably between the design and assembly of final products and the design and fabrication of integrated circuits (Sturgeon & Kawakami, 2011). EMS firms have become significant players in the industry as standardized operations allowed them to serve multiple customers, achieve high capital utilization rates and leverage economies of scale. Contract manufacturers account for a majority share of assembly operations in the more mature 3Cs markets and an increasing share in others. In 2014, contract manufacturing services in electronics accounted for between US$406 and US$490 billion (Buetow, 2015; IDC, 2015; NVR, 2015). Most of the EMS business is in PCBA, for which manufacturing processes and technologies are relatively generic. EMS providers can thus serve lead firms in a variety of end markets, which provides a large pool of potential customers. Yet, this limits the market power of EMS providers because their services are highly substitutable. Design expertise, on the other hand, is more sector-specific, which limits the potential for end market upgrading but does enable the firm to engage in higher-value activities. Table 3-6 lists the top global EMS and ODM providers in 2014 based on industry revenue. The contract manufacturing sector is fairly concentrated with the top company, Foxconn, accounting for approximately 30% of industry revenue in 2014 and the top 10 accounting for approximately 65% (Buetow, 2015). All the top 15 global contract manufacturers in electronics have production locations in China. Contract manufacturers are responsible for some input sourcing, but this is largely only in lower value components. Purchase contracts for the more expensive components such as microprocessors or displays are negotiated directly by the lead firms and the component companies (this is discussed further below). The global prices for the other generic electronic 7 Most large ODM contract manufacturers are based in Taiwan where they host their design functions, while their manufacturing operations are concentrated in mainland China.
and electrical components are typically low and are often purchased through global distributors.
EMS providers profit margins typically range between 2 and 10% (Rammohan, 2011).

Table 3-6. Top 15 Electronics Contract Manufacturers (EMS & ODM), 2014
          Contract          Global     Main     Year   Revenue    Emp.
Rank                                                                       Markets          Manufacturing Locations
        Manufacturers        HQ       Service   Est.   (US$, B)   (‘000)
                                                                                    China, Mexico, Brazil, USA, Czech
 1     Foxconn/Hon Hai Taiwan         EMS       1974       $135    1,061         3C Rep., Hungary, Slovakia, Turkey,
                                                                                    Malaysia
 2     Pegatron           Taiwan      ODM       2007        $33        7         3C China, Mexico, Taiwan, Czech Rep.
 3     Quanta Computer Taiwan         ODM       1988        $29     105 Computer China, USA, Germany
       Compal                                                                   3C, China, Vietnam, Taiwan, Brazil,
 4                        Taiwan      ODM       1987        $27       70
       Electronics                                                             Auto Poland
                                                                                     China, Malaysia, Mexico, Brazil,
 5     Flextronics+       Singapore   EMS       1969        $27     150          All Hungary, Israel, Poland, Romania,
                                                                                     Ukraine, India
                                                                                       China, Mexico, Taiwan, Czech Rep.,
 6     Wistron            Taiwan      ODM       2001        $19       70         3C
                                                                                       Malaysia
                                                                                     China, Malaysia, Singapore, Vietnam,
 7     Jabil Circuit      USA; FL     EMS       1966        $17     142          All India, USA, Mexico, Brazil, Hungary,
                                                                                     Ireland, Poland, Ukraine
                                                                                       China, UK, Taiwan, Czech Rep.,
 8     Inventec           Taiwan      ODM       1975        $14       --         3C
                                                                                       USA, Mexico
                          Taiwan;
                                                                           Computer China, Mexico, Poland, Russia,
 9     TPV Technology     Hong        EMS       1998        $12       32
                                                                            Consumer Brazil, Argentina
                          Kong
                                                                                     China, Malaysia, Thailand, Singapore,
 10    Celestica          Canada      EMS       1997         $6       27         All Laos, Canada, USA, Mexico, Ireland,
                                                                                     Spain, Romania
       Cal-Comp                                                            Computer
 11                       Thailand    EMS       1989         $5     247             China, Thailand, Philippines
       Electronics*                                                         Telecom
                                                                                       China, Singapore, Malaysia, Israel,
 12    Sanmina-SCI        USA; CA     EMS       1980         $5       43         All
                                                                                       Finland, USA, Mexico, Hungary
       Universal
 13    Scientific         Taiwan      EMS       2003         $4       --               China, Taiwan, Mexico
       Industrial (USI)
                                                                         Industrial
                                                                                    USA, Thailand, Mexico, Malaysia,
       Benchmark                                                          Telecom
 14                       USA; TX     EMS       1979         $3       10            China, Singapore, Netherlands,
       Electronics                                                       Computer
                                                                                    Romania, Brazil
                                                                          Medical
                          Hong                                             Consumer
 15    BYD Electronic                 EMS       2002         $3       60               China, Hungary
                          Kong                                              (Mobile)
Total/Top 15                                           $490/69%
Sources: Authors. Compiled from: Buetow (2015), firm websites and MarketLine profiles. Additional maps here.

While electronics assembly firms are mostly headquartered in Asia, key components are still
controlled by developed country firms. The world's largest electronic component companies are
headquartered in the US, Japan, Korea, Taiwan and countries in Western Europe with
manufacturing facilities in low-cost countries (such as China). In some cases, these facilities are
owned by the parent company or companies might outsource some of their production or specific
steps, particularly semiconductor assembly and test activities (SATS) to contract manufacturers
also located in low-cost countries.
Semiconductors, including discretes, ICs, and optoelectronics, are among the most critical and
expensive components in electronic products. Given the technological importance and share of
the cost of the final product, semiconductor companies often deal directly with lead firms and
work in conjunction with them on R&D and NPD of final products (in some cases lead firms
have IC and final product divisions). Top semiconductor companies are listed in Table 3-7.
Table 3-7. Top 10 Semiconductor Firms by Revenue in 2010 and 2014
Revenue ($US,
Types Year
Firm HQ B) Activities Mfg. Locations
Est.
2010 2014 2013
Microprocessor
Wafer, US, Ireland, Israel,
Intel US (CA) 40.0 51.4 (51%), Logic 1968
A&T China
(49%)
Memory (84%), Wafer, Korea (3), US (1),
Samsung Electronics Korea 28.1 37.8 1969
Logic A&T China (2)
TSMC Taiwan -- 25.0 -- Wafer Taiwan (8), China, US 1987
Qualcomm US (CA) 7.2 19.3 -- IC Design Fabless 1985
Micron Technology Memory (76%), Wafer,
US (ID) 8.9 16.7 Japan, Singapore, US 1978
(acquired Elpida 2012) Logic (24%) A&T
SK Hynik; Hynix
Wafer,
Semiconductor (2001- Korea 10.6 16.3 Memory (100%) Korea, China (1) 1983
A&T
11)
US (6), China (1),
Analog (87%), Wafer,
Texas Instruments US (TX) 13.0 12.2 Japan (1), Germany 1951
Logic (13%) A&T
(1), Scotland (1)
Memory (78%),
Wafer,
Toshiba Japan 13.1 11.0 Logic, Discrete, Japan 1875
A&T
Analog
Broadcom Ltd. 1991/
Singapore/
(acquired by Avago -- 8.4 -- IC Design Fabless 1961/
US
Technologies 2016) 2016
Discrete (68%),
Wafer, France (4), Italy (2),
STMicroelectronics Switzerland 10.3 7.4 Logic (26%), 1987
A&T Singapore (2)
Analog (7%)
Renesas Electronics Logic (45%), MC 2002/
Wafer,
(merged with NEC Japan 11.8 -- (25%), Discrete 2003/
A&T
2010) & Analog (29%) 2010
Elpida Memory Japan 6.9 --
Top 10 131.1 205.5 1997
Sources: Zino (2011, 2015); Source’s sources: 2010: company reports; iSuppli; 2014: IC Insights. Additional maps
and tables are provided here.
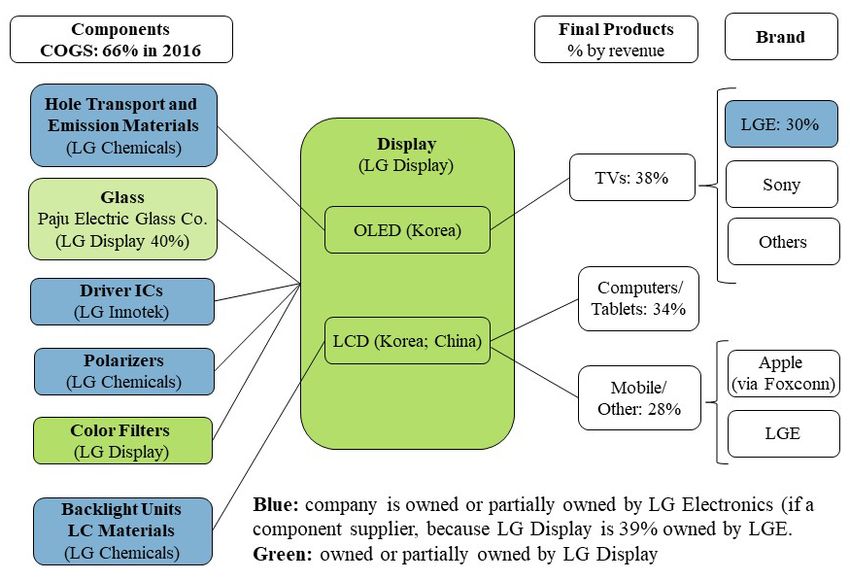
The display market is fairly concentrated in terms of companies and countries. The top country
for LCD and OLED technologies is Korea, based on headquarters and production capacity,
however China and Taiwan are very close for LCD production capacity. Korea edges ahead due
to their dominance in OLED. Overall, Korean firms control 97% of the OLED market (based onvalue, 2016). LCD is more divided; Korea still leads with approximately 37% followed by China
(27%), Taiwan (24%) and Japan (10%). Of the Korean firms, LG Display is focused on large
screen OLED whereas Samsung Display is focused on small and medium (computers, phones).
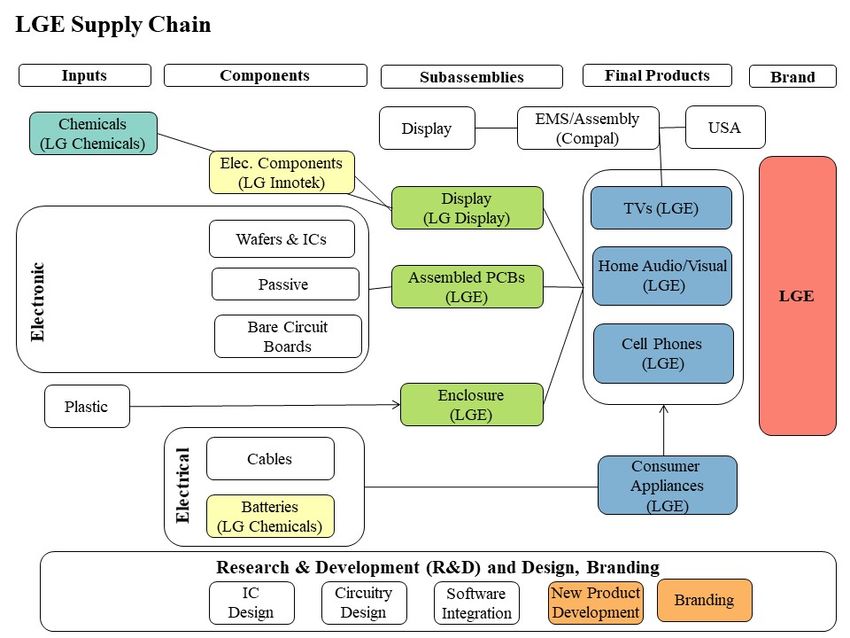
Top consumer electronics manufacturers that own manufacturing also tend to be at least partially
vertically integrated (e.g., Samsung, LG, Sony and Sharp/Foxconn).
Countries positions in the industry can also be generalized by the characteristics of most firms
with operations in the country, and compared by tiers based on sales volume and market
orientation. From a geographic market standpoint, manufacturers physically located in Mexico
and Eastern Europe primarily supply the US and Western Europe, whereas “global” providers
are all Asian based, more specifically in East and Southeast Asia. Table 3-8 gives an overview of
the roles played by the main country participants in electronics.
Table 3-8. Segments of the Electronics GVC with Country Examples
Categories Capabilities/Tiers Countries End Markets
Production
-- Japan, Europe, US --
Equipment
Component Philippines, Malaysia, Thailand,
A&T --
suppliers: Taiwan (esp. SATS)
Semiconducto Wafer fabrication; IC Taiwan, Singapore, China, Korea,
rs --
design and/or R&D US, Malaysia
Displays Korea, China --
HDD Singapore, Philippines --
For US: Mexico
For Western EU: Hungary, Poland,
Regional Czech Republic, Germany, All
Romania
EMS/ For China: China
Tier 1 MNC Laos, Myanmar (very recent) --
Branch Plants Global: Tier 3 Indonesia (entered 1990s) Consumer, Industrial
Philippines (entered 1970s) Storage/Office, Automotive
Vietnam (entered 2000s) Cell Phones, Computers
Global: Tier 2 Thailand (entered 1980s) Computers/Storage
Malaysia (entered 1970s) Computers, Consumer
Global: Tier 1 3C, All
China
Computers
ODM Design and NPD Communications
US, Taiwan, Singapore Consumer Electronics
Automotive (Germany, Japan)
Medical (UK, Ireland, Germany)
Western Europe Industrial (Europe, US)
Global brand owners;
US A&D (US)
Global Lead marketing, branding and
Japan Communications (Korea, US)
Firm (OBM) manufacturing (for
Korea Consumer Electronics (Japan,
some)
China Korea, China)
Computers/Office (US, Taiwan,
China, Korea, Japan (office))
Source: updated from Frederick and Gereffi (2016); based on trade data, market reports, and global locations of top
Tier 1/EMS/ODM companies.3.1.4. Standards and Institutions The proliferation of product standards and the wide-spread adoption of process standards have enabled the codification of this very complex supply chain. This modularity, in turn, has facilitated the electronics industry’s rapid development. Standardization has both enabled the growth in the number of products and end markets that incorporate electronic components and the transferability of at least some components among multiple products and brands. Standard-Setting Organizations There are several bodies involved in setting electronics standards and platforms. At the global level, the International Electrotechnical Commission (IEC) is the standards organization that prepares and publishes international standards for all electrical, electronic and related technologies – collectively known as "electrotechnology." ISO standards are published by the International Organization for Standardization (ISO) and are available through national standard bodies. The IEC works with the ISO and the International Telecommunications Union (ITU), in some cases developing joint standards. The IEC is composed of one national committee per country. These members help develop the standards as well as conformity assessments. Process Standards Quality standards are very important in the electronics industry and the ability to manufacture with low defect rates and quick turnaround times are necessities. As a result, maintaining certifications for international standards is of the utmost importance. Certification is important for firms throughout the supply chain from component suppliers to final product manufacturers. The ISO 9000 family of standards covers quality management systems and how products are produced rather than the product itself. These standards provide guidance and tools for firms who want to ensure that their products and services consistently meet customer requirements, and that quality is consistently improved. Companies are certified through accredited certification organizations and must renew the certification at regular intervals, typically every three years. ISO 9001 was first released in 1987, and has been through four versions with 2008 being the most recent. All requirements are generic and intended to apply to all organizations, regardless of size, industry, or products provided. Most companies obtain an ISO 9001 certification. Several industries have more specific quality management standards that expand on ISO 9001 to cater to their market’s needs, many of which are applicable to electronic and electrical product manufacturers. Lead firms often require suppliers to be certified, and firms wishing to sell into multiple end markets must obtain certifications for each industry. Tier 1 and EMS providers are required to get industry-specific certifications and ensure the latest version is implemented. In some cases, these certification requirements can be a constraint or even a barrier to entry for new firms, SMEs, or those in developing countries due to the costs required to meet the qualifications of the standard and to become and maintain certification. Given the critical nature of products for the automotive, A&D, and medical markets, quality requirements are more stringent than those for consumer electronics.
Beyond quality management, there are several other ISO standards that pertain to maintaining
operational or environmental efficiencies. The most common is the ISO 14000 family of
standards which focuses on environmental management and helps companies minimize their
environmental impact. For capital-intensive manufacturing, ISO 50001 is important to ensure
energy efficiency. The table provides a list of the main standards and certifications relevant for
the electronics and electrical industries.

Table 3-9. Important Standards in the Electronics GVC
                                                                       Certification/
          Standard                         Description                                     End Markets
                                                                      Audit Frequency
Quality Management
ISO 9001                    Industry neutral standard                 Valid: 3 years    All
                                                                                        Testing and
                            Certification would signal functional
ISO/IEC 17025: 2005                                                                     Calibration
                            upgrading to service activities.
                                                                                        Laboratories
                            Specific to the telecommunications
                            industry; developed by the telecom
TL 9000                     industry group QuEST Forum. It also                         Telecommunications
                            includes standardized product
                            measurements for benchmarking.
Business
Operations/Environment
                            Improvement of energy performance,
                                                                                        All (Energy
ISO 50001:2011              including energy efficiency, energy use   Valid: 3 years
                                                                                        Management)
                            and consumption.
                                                                      Valid: 3 years    All (Environmental
ISO 14000
                                                                      Audits: annual    Management)
RoHS                        Impacts sales to the EU market                              All
WEEE                        Impacts sales to the EU market                              All
Product
Interconnect Standards      National standards are set within                           Telecommunications
(i.e., 2G, 3G, 4G)          international standards.                                    (Mobile)
Sources: updated from Frederick and Gereffi (2016)

Product Standards
There are also numerous product standards, most of which can be found on the IEC’s database of
standards. Adoption of IEC standards is voluntary, although they are often referenced in national
laws or regulations around the world.

Standards are particularly important in enabling digitalization. General interconnect standards
are set by the International Telecommunications Union (ITU), an international standard setting
body based in Geneva. The ITU organizes study groups to produce draft recommendations on
international specifications for each generation of mobile telephony (1G-5G), and these broad
standards are then approved, modified, or rejected by world telecommunications standardization
conferences that include representatives from member states, industry associations, and firms.
How companies meet these standards in specific terms is up to them to propose to the ITU, but
since interoperability is needed to allow equipment such as mobile phone handsets and wireless
infrastructure (towers, base stations, and network switching equipment) to interact, the strongest
players, often collaborate to propose their own standards, and submit these for approval to ensure
that they meet the requirements of the general standard.
Environmental Standards
There are also environmental standards and waste regulations for electronic products in many
countries, particularly in the EU market. Since late 2006, products sold in the EU must comply
with the Restriction of Hazardous Substances (RoHS) Directive 2002/95/EC (and now also
RoHS Directive 2011/65/EU (RoHS2), effective January 2013) which restricts the use of six
heavy metals (lead, mercury, cadmium, hexavalent chromium, and other flame retardant
materials) found in electronics. The EU also promotes collection and recycling of electronic
equipment under the Waste from Electrical and Electronic Equipment (WEEE) Directive
2002/96/EC. All applicable products in the EU market must pass WEEE compliance and carry
the "Wheelie Bin" sticker. WEEE encourages manufacturers to design electronic products with
end of life recycling and recovery in mind. RoHS assists in this process by requiring the use of
safer materials via restricting the amount of hazardous chemicals (European Commisson, 2015).
Tariffs and Trade Agreements
Import tariffs for electronics and electrical products tend to be low due to the WTO Information
Technology Agreement (ITA). The ITA was reached through a Ministerial Declaration on Trade
in Information Technology Products at the first WTO Ministerial Conference, held in Singapore
in 1996. The original ITA had 29 participants, however, the number has grown to 81,
representing about 97% of world trade in IT products. The ITA requires each participant to
eliminate and bind customs duties at zero for all products specified. During 2015, the ITA was
expanded to cover an additional 201 products. At the time of writing, 54 members have agreed to
the expansion, covering 90% of world trade in IT products. Participants must develop a schedule
to eliminate tariffs on most new products over the course of three years (2016-2018) (WTO,
2016a).8 Another objective of the ITA is to eliminate non-tariff barriers (NTB) in IT trade
(WTO, 2016b). As such, free trade agreements (FTAs) are not widely used compared to other
manufacturing industries.
3.1.5. Human Capital and Workforce Development
Most workers in manufacturing establishments are production workers including operators and
technicians. Workers at these levels typically have at least primary education as well as
secondary education and some additional technical/vocational school at the technician level.
Non-production workers include research scientists, product developers, process developers,
managers, supervisors, and administrative staff. These employees typically have a four-year
university degree in engineering or a business administration field. Firms employ a range of
engineers that focus on various aspects of process and product development, including process
and systems engineers, component and machine design, field applications, and quality control.9
The highest-level workers are scientists who engage in research related to theory and conceptual
development of new ideas for technologies that will enable new processes and products.
Scientists typically have a Doctor of Philosophy (PhD) in basic sciences, engineering, or a
8
Participants: https://www.wto.org/english/tratop_e/inftec_e/itscheds_e.htm (includes all top importers and
exporters except Mexico).
9
This section draws on fieldwork conducted on the E&E industry as part of this project (Frederick & Gereffi, 2016),
and two previous studies (Frederick & Gereffi, 2013; Metha & Frederick, 2015).You can also read