The Value of U.S. Downtowns and Center Cities - CALCULATING THE VALUE OF DOWNTOWN BIRMINGHAM, ALABAMA A 2021 IDA STUDY - REV ...
←
→
Page content transcription
If your browser does not render page correctly, please read the page content below

The Value of U.S. Downtowns
and Center Cities
CALCULATING THE VALUE OF DOWNTOWN BIRMINGHAM, ALABAMA
A 2021 IDA STUDY

A 2021 PUBLICATION CREATED BY
THE INTERNATIONAL DOWNTOWN ASSOCIATION

ABOUT IDA

            IDA
            The International Downtown Association is the premier association of urban place managers
            who are shaping and activating dynamic downtown districts. Founded in 1954, IDA represents
            an industry of more than 2,500 place management organizations that employ 100,000 people
            throughout North America. Through its network of diverse practitioners, its rich body of
            knowledge, and its unique capacity to nurture community-building partnerships, IDA provides
            tools, intelligence and strategies for creating healthy and dynamic centers that anchor the well-
            being of towns, cities and regions of the world. IDA members are downtown champions who
            bring urban centers to life. For more information on IDA, visit downtown.org.

            IDA Board Chair: Tami Door, President & CEO, Downtown Denver Partnership
            IDA President & CEO: David T. Downey, CAE, Assoc. AIA, IOM

            IDA Research Committee
            The IDA Research Committee is composed of industry experts who help IDA align strategic
            goals and top issues to produce high-quality research products informing both IDA members
            and the place management industry. Chaired and led by IDA Board members, the 2019 Research
            Committee advances the work set forth in the IDA research agenda by publishing best practices
            and case studies on top issues facing urban districts, establishing data standards to calculate the
            value of center cities, and furthering industry benchmarking.

            IDA Research Committee Chair: Brian Douglas Scott, Principal, BDS Planning & Urban Design
            IDA Director of Research: Cathy Lin, AICP
            IDA Research Coordinator: Tyler Breazeale

            International Downtown Association
            910 17th Street, NW, Suite 1050
            Washington, DC 20006
            202.393.6801
            downtown.org

            © 2021 International Downtown Association, All Rights Reserved. No part of this publication may be
            reproduced or transmitted in any form—print, electronic, or otherwise—without the express written
            permission of IDA.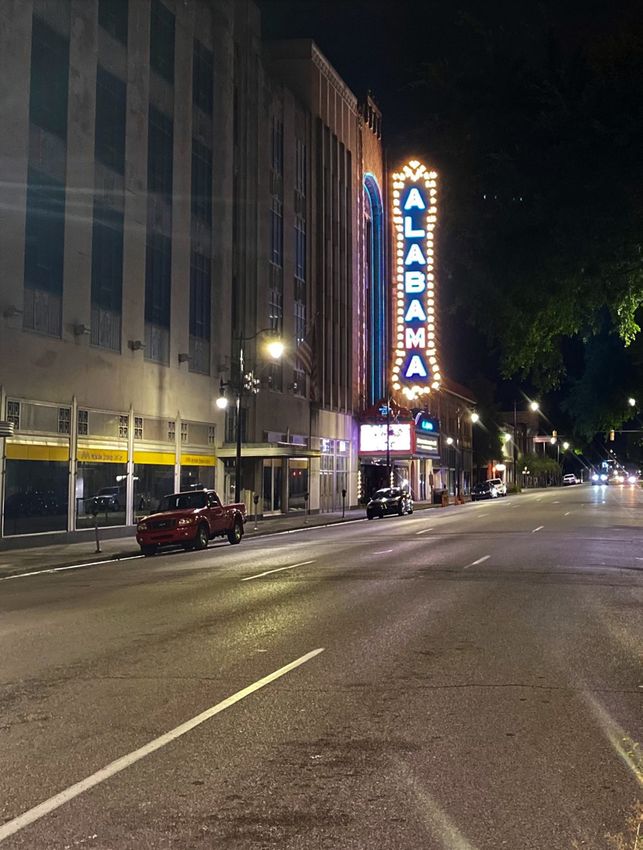
T H E VA L U E O F U . S .
                                                                      DOWNTOWNS AND
                                                                      CENTER CITIES

Stantec’s Urban Places
Project Advisors for The Value of U.S. Downtowns and Center Cities
Stantec’s Urban Places is an interdisciplinary hub bringing together leaders in planning and
urban design, transportation including smart and urban mobility, resilience, development,
mixed-use architecture, smart cities, and brownfield redevelopment. They work in downtowns
across North America—in cities and suburbs alike—to unlock the extraordinary urban promise of
enhanced livability, equity, and resilience.

Vice President, Urban Places Planning and Urban Design Leader: David Dixon, FAIA

IDA would like to thank the following individuals for their efforts on the
2021 edition of this project:
Albuquerque                     Evansville                      Los Angeles
Karen Iverson                   Josh Armstrong                  Suzanne Holley
Jonathan Teeters                Adam Trinkel                    Cole Judge
                                                                Elan Shore
Birmingham                      Little Rock
David Fleming                   Gabe Holmstrom                  West Palm Beach
Rob Buddo                       Caroline Brown                  Raphael Clemente
                                Ellen Lampe                     Shelly Williams
                                Chellie Longstreth

The REV Birmingham team would like to thank presenting sponsor PNC for their support of the
Birmingham edition of the Value of U.S. Downtowns.
CONTENTS

Section One: Project Overview
Introduction                                 8
About the Value of Downtowns Study            9
Urban Place Management Organizations         10
Methodology Overview                         12
Known Limits to this Study                   13
Improvements and Areas for Future Research   13

Section Two: Downtown Profile
Overview                                     16
Economy                                      20
Inclusion                                    24
Vibrancy                                     31
Identity                                     35
Resilience                                   37
Downtown Profile                             40

Appendices
Project Framework and Methodology            44
What factors make a vibrant downtown?        46
Principles and Benefits                      52
Data Sources                                 57
Selected Study Definitions                   58
Additional IDA Sources                       60

References
Endnotes                                     62
Photo Credits                                63


SECTION ONE

PROJECT
OVERVIEW

              1
1                                                 PROJECT OVERVIEW

    Introduction
    GREAT CITIES START DOWNTOWN

    No city or region can succeed without a strong downtown,          Longer-term, the effects of the pandemic on urban cores
    the place where compactness and density bring people,             are still emerging. The permanence of remote work remains
    capital, and ideas together in ways that build the economy,       an open question. Richard Florida cites work by economist
    opportunity, community and identity. Downtowns across             Nick Bloom that estimates that ultimately, remote work
    the U.S. experienced unprecedented change in 2020 and             will account for one-fifth of all work-days, compared with
    2021, which were fundamentally impacted by the COVID-19           just 5% pre-pandemic.1 This shift will decrease the daytime
    pandemic. In some ways the pandemic highlighted the               population in urban centers and affect consumer spending
    importance of vibrant urban places. The prolonged absences        downtown, but it also presents an opportunity to pare down
    from our favorite places and activities in some measure           auto-centric infrastructure and create justification for districts
    deepened our appreciation for them. As the pandemic               to evolve beyond a 9 to 5 worker-focused dynamic to more
    recedes, downtowns will once again be focal points for            complete live, work and play communities. The concept
    commerce and activity.                                            of the 15-minute city, the idea that everyone living in a city
                                                                      should have access to essential urban services within a 15
    Typically, despite a relatively small share of a city’s overall
                                                                      minute walk or bike ride, has gained in popularity in the past
    geography, a downtown delivers significant economic and
                                                                      year and reinforces the value of the mixed-use nature of
    community benefits across both city and region. Downtown
                                                                      many of our downtowns and center cities.2
    serves as the epicenter of commerce, capital investment,
    diversity, public discourse, socialization, knowledge and         In the coming years the ways we use and evaluate
    innovation. It provides social benefits through access to         downtowns and center cities may shift, but downtowns’
    community spaces and public institutions. It acts as a hub for    resilience across economic, social, and environmental
    employment, civic engagement, arts and culture, historical        measures positions them well to lead citywide recovery.
    heritage, local identity, and financial impact. In short, the     Downtowns have emerged from past crises even stronger,
    proximity and density that downtown and center cities create      and there’s no reason to think they won’t this time.
    drive the city around them to thrive.

    While proximity and density were challenged in the short-
    term due to the pandemic, the urgency of responses in
    2020 and 2021 also presented new opportunities to adapt
    downtowns and center cities to a more human-centric future.
    The success of open streets and outdoor dining in cities
    large and small have started to lead to permanent programs
    that prioritize people over cars. Stronger public-private
    partnerships have streamlined regulations for everything
    from new business permits to cocktails-to-go. Responding to
    the racial awakening of 2020, many organizations are working
    to address bias internally, and in their public programming.
    Several urban place management organizations are creating
    programs to specifically support minority entrepreneurs so
    that downtown better represents the community.

8                                                                                   IDA   |   The Value of U.S. Downtowns and Center Cities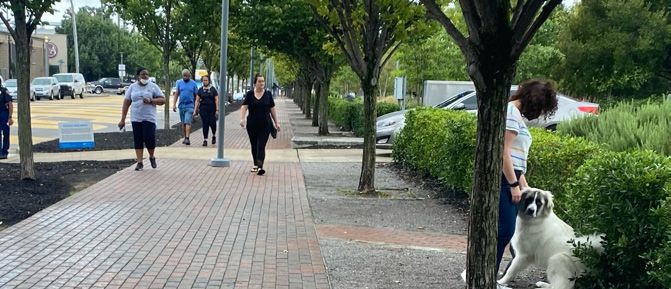
PROJECT OVERVIEW
                                                                                                                               1

    About the Value of Downtowns Study
    Building on IDA’s unique industry-wide perspective and expertise, this study quantifies the value of U.S. downtowns and
    center cities across more than 150 metrics organized under five core value principles, with a focus on how downtowns
    contribute to the city and region around them. The Value of U.S. Downtowns and Center Cities study is a partnership
    between IDA and local urban place management organization (UPMO). UPMOs have invaluable insights into the areas they
    manage and have the relationships that help them unlock essential data sources for this study.

    The study aims to emphasize the importance of downtown, to demonstrate its unique return on investment, to inform future
    decision making, and to increase support from local decision makers. The primary project goals are to:

                      Provide a common set of metrics to communicate the value of downtown.

                      Expand the range of arguments UPMOs can make to their stakeholders using
                      publicly available data.

    IDA began this research in 2017, working with Stantec’s Urban Places group and the first cohort of 13 UPMOs to develop a
    methodology for compiling and evaluating data from those 13 downtowns. In 2021, our analysis has expanded to include 43
    downtowns and center cities across the U.S.

    The analysis focuses on how downtown provides value in the five organizing principles of economy, inclusion, vibrancy,
    identity, and resilience. IDA and our UPMO partners work together to collect hundreds of individual data points, including
    historic and current data, and three geographic levels (study area, city, and MSA/county). In addition, for employment data
    we collect three different jobs totals (primary, all jobs, and all private) for all years between 2002 and 2017 to show more
    nuanced employment trends over time. In total, we utilize more than 8,400 individual pieces of data for each participating
    downtown, and our downtown database now contains around 310,000 datapoints. The demographic and jobs data included
    in the study predates the COVID-19 pandemic, but some real estate, tax and assessment data include 2020 and 2021
    figures.

downtown.org | © 2021 International Downtown Association                                                                           9
1                                              PROJECT OVERVIEW

     Urban Place Management Organizations
     IDA’s members are urban place management organizations that manage growing districts to create prosperous city centers,
     commercial neighborhoods and livable urban places for all—from residents to visitors to business owners. These UPMOs
     shape and activate dynamic downtowns, city centers and neighborhood districts.

     Since 1970, property and business owners in cities throughout North America have realized that revitalizing and sustaining
     vibrant downtowns, city centers and neighborhood districts requires focused attention beyond the services municipal
     governments alone can provide. These private-sector stakeholders come together to form and fund nonprofit management
     associations that deliver key services and activities within the boundaries of their districts. UPMOs typically operate as
     business improvement districts (BIDs), business improvement areas (BIAs), partnerships or alliances.

10                                                                               IDA   |   The Value of U.S. Downtowns and Center Cities
PROJECT OVERVIEW
1
ECONOMY Downtowns and center cities are valuable due to their roles as economic anchors for their
regions. As traditional centers of commerce, transportation, education, and government,
downtowns and center cities frequently serve as hubs of industry and revenue generators,
despite their only making up a small fraction of the city’s or region’s land area. Downtowns
support high percentages of jobs across many different industries and skill levels. Because of
a relatively high density of economic activity, investment in the center city provides a greater
return per dollar for both public and private sectors than investments elsewhere.
INCLUSION As the literal and figurative heart of their cities, downtowns represent and welcome
residents, employees, and visitors from all walks of life. Residents of strong downtowns
often come from a wide range of racial, socioeconomic, cultural, and educational
backgrounds, and from across all ages. This diversity ensures that as an inclusive place,
downtown has a broad appeal to all users and a strong social fabric. Downtowns provide
access to all to opportunity, essential services, culture, recreation, entertainment and civic
activities.
VIBRANCY The ability of vibrant places to attract visitors and new residents, as well as a regionwide
consumer base, creates value. Vibrancy means the buzz of activity and excitement that
comes with high-quality experiential offerings like breweries, restaurants, theatres,
or outdoor events. Many unique regional cultural institutions, businesses, centers of
innovation, public spaces and activities are located downtown. As the cultural center of
their cities, downtowns typically attract a large share of citywide visitors and account for a
large share of citywide hotels and hotel rooms.
IDENTITY Downtowns and center cities often serve as iconic symbols of their cities, creating a strong
sense of place that enhances local pride. The authentic cultural offerings in downtown
enhance its character, heritage, and beauty, and create an environment that other parts
of the city can’t easily replicate. Combining community history and personal memory, a
downtown’s cultural value plays a central role in preserving and promoting regional identity.
Downtowns and center cities serve as places for regional residents to come together,
participate in civic life, and celebrate their region, which in turn promotes tourism and civic
society.
RESILIENCE Downtowns and center cities play a crucial role in building stability, sustainability, and
prosperity for the city and region. Their diversity, concentration of economic activity,
and density of services better equip them to adapt to economic and social shocks
than more homogenous communities. They can play a key role in advancing regional
resilience, particularly in the wake of economic and environmental shocks, which often
disproportionately affect less economically and socially dynamic areas.
downtown.org | © 2021 International Downtown Association 111 PROJECT OVERVIEW
Methodology Overview i
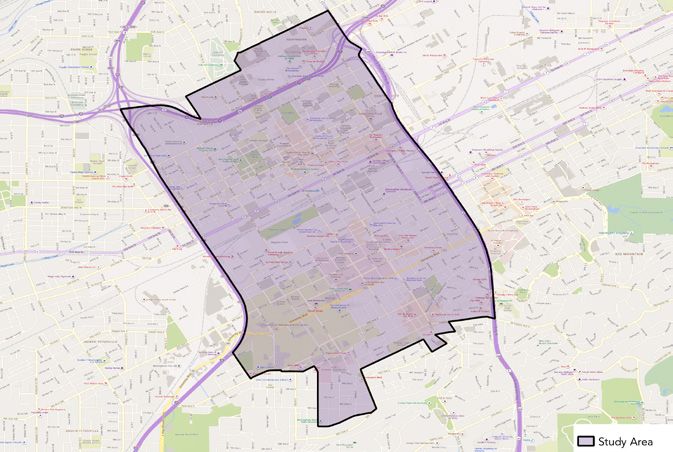
The first step to this study is to identify the right boundaries The analytical focus of the report is to make and support
that capture a downtown district. Geographic parameters value statements about downtown by comparing it to the
often vary across data sources and may not align with a city, identifying its growth trends over time, and illustrating
UPMO’s jurisdiction. This study has adopted a definition its density. For instance, data patterns revealed this for 2017
of the commercial downtown that moves beyond the employment totals in downtown Seattle:
boundaries of a development authority or a business
improvement district. IDA’s Value of Investing in Canadian
Downtown is a strong employment and industry hub
Downtowns report expresses the challenge well: “Overall,
for the city, with a concentration of high-paying and
endless debate could be had around the exact boundaries
high-growth employment sectors. 43% of all citywide
of a downtown, what constitutes a downtown and what
jobs are located downtown, as are 58% of citywide
elements should be in or out. Yet it is the hope of this
knowledge jobs. Overall, employment has increased
study that anyone picking up this report and flicking to
14% since 2010, outpacing both the city and region.
their home city will generally think: Give or take a little, this
In addition, the number of knowledge jobs grew
downtown boundary makes sense to me for my home city.”3
28% during that period. Each square mile supports
IDA worked with each UPMO to identify the boundaries of
85,924 workers on average, more than ten times the
their downtown for this project, giving priority to alignment
average job density citywide.
with census tracts for ease of incorporating data from the
U.S. Census.
To measure the value of downtowns relative to their cities,
the analysis relies on data that could be collected efficiently
and uniformly for a downtown, its city, and its region. IDA
collects data from multiple national databases, such as the
U.S. Census, LEHD, and ESRI. In addition, IDA gives each
participating UPMO a list of metrics to collect from local
sources like county assessors or commercial real estate
brokers. IDA then analyzes the data to identify study area
trends and benchmark the area against the city, the region,
and other downtowns in the study.
The analysis includes meaningful qualitative observations
to acknowledge unique features or add nuance and context
to trends revealed in the data. As an example, universities
often sit on the edge of a downtown study area. Even if
not technically inside downtown, the university’s students
typically represent a large user and consumer base for
downtown and the analysis describes how the student
presence influences the downtown environment.
i Refer to the appendix for the full methodology.
12 IDA | The Value of U.S. Downtowns and Center CitiesPROJECT OVERVIEW
1
Known Limits to this Study
While this study aims to provide a comprehensive availability, some metrics may not align with more recent
quantification of the value of downtowns, there are still data from local downtown, municipal, or proprietary sources.
several limitations to our approach. Not all local sources This will be especially true in coming years as change in
consistently collect the same data, or collects it in the same employment during COVID-19 will not be observed in our
way, which hinders our ability to make comparisons between data sources for several years.
downtowns. In some cases, the data we ask for simply does
Finally, citywide context plays a large role in the analysis.
not exist or has not been collected on the relatively small
Significant variance in overall city size (from Spartanburg’s 20
scale of census tracts or downtown sub-area. This makes it
square miles to Oklahoma City’s 606) can skew comparisons
challenging to rely on local data for analysis and can result in
of the proportion of citywide jobs or population in different
some missing pieces in our narrative.
districts. However, since downtowns operate within the
Our most recent data also comes predominantly from context of their city, understanding the proportion of jobs,
the 2019 American Community Survey (ACS), the 2018 residents, and other metrics as a percentage of their cities
Longitudinal Employer-Household Dynamics (LEHD) On the still provides an important perspective on a downtown’s
Map tool, and ESRI Business Analyst. Due to the lag in data contribution to its city and region.
Improvements Over Previous Years and
Areas for Future Research
This year has seen yet another evolution of the Value of Downtowns product featuring new tools, more data, and new methods
of analysis. Our Value of Downtowns database now integrates with Tableau, a data visualization software. With this software,
we are able to make connections and draw comparisons between downtowns in a far more nuanced and intuitive way. This
report includes some of these new visualizations. For example, charts like households by income over time, or housing units by
gross rent over time reveal trends and relationships that we previously were not able to analyze.
The Value of Downtowns database has grown exponentially over past iterations, particularly as this year we have included
demographic and jobs data for all years available since 2000, rather than only collecting four benchmark data years.
This level of additional data and capability has increased our ability to understand comparisons between downtowns and
center cities. This is reflected within this report, as well as with the launch of IDA’s newest research offering, the Value of
Downtowns: Comparisons. The Comparisons study focuses on understanding how a given downtown’s performance stacks up
to its closest peers, and evaluates a smaller number of metrics than this Value of Downtowns study.
Value of Downtowns Total Datapoints
704,000
264,624
47,118 108,900
17,550
VODT Pilot - 2017 2018 2019 2020 2021
downtown.org | © 2021 International Downtown Association 1316 IDA | The Value of U.S. Downtowns and Center Cities
SECTION TWO

DOWNTOWN
PROFILE

              2
2 DOWNTOWN PROFILE
Downtown Profile | Overview
A city’s strength and prosperity depend on a strong downtown and center city, which
serve as centers of culture, knowledge and innovation. The performance of districts and
center cities strengthens an entire region’s economic productivity, inclusion, vibrancy,
identity and resilience.
While the long-term impact of the COVID-19 pandemic
remains to be seen, in the short term the significance of
downtown and how it intertwines with the rest of the city Study Area
and region has never been more apparent. Many of the
hardest-hit sectors—retail, food, entertainment, tourism, arts DOWNTOWN PARTNERS
and culture, and nonprofits—rank among downtown’s most REV Birmingham and City Center
compelling businesses. Their return to business will mark the
District Management Corporation
start of full recovery and accelerate the return of a strong
economy citywide. (Note: All demographic data used to CITY
produce this report predates the COVID-19 pandemic.) Birmingham, AL
Downtown Birmingham is the heart and soul of its
region. At 3.2 square miles, it occupies only 2.2% of
the city’s land area yet delivers outsized benefits. The
region’s largest tax generator, downtown acts as an
Residential
economic engine, funding much of the investment by Population
the City of Birmingham in its 99 neighborhoods and
investment by Jefferson County inside and outside the City Center City Region
city. A cultural center for all its citizens, downtown brings
Population 10,602 212,297 1,085,330
together churches and entertainment venues, parks and
playgrounds, restaurants, and shops. It brings college Residential Share n/a 5.0% 1.0%
graduates back home and attracts investment of all kinds
Residents/Sq. Mile 3,293 1,453 206
to the city.
Growth 2010-2019 38% -2% -3%
Across multiple categories of data, downtown drives regional
success. In a period when citywide population has declined, Growth 2000-2019 15% -13% 18%
downtown has grown significantly; today it houses nearly
11,000 residents, about 5% of the city’s population. It delivers Source: U.S. Decennial Census (2000); American Community Survey 5-Year Estimates
(2015–2019)
even stronger economic benefits, with 37% of citywide jobs.
Additional development will continue to densify and bring
the period, citywide population would have fallen by 3.2%.
greater vibrancy to downtown, building on relatively new
Downtown’s density, more than double the city’s, remains low
assets like Railroad Park.
compared to other U.S. downtowns and sits in the middle of
The 2019 population of 10,600 capped a decade of strong the pack for “emerging” downtowns studied for the Value
growth between 2010 and 2019. The resident count rose by of Downtowns analysis. The 2019 City Center Master Plan
38% during that period, in contrast to a citywide decline of argues that downtown’s above-average size gives it a lower
2%. Downtown’s steady growth helped stave off a steeper density than other comparable downtowns.
decline citywide: if population had remained flat during
16
18 IDA
IDA | | The
The Value
Valueof
ofU.S.
U.S.Downtowns
Downtownsand
andCenter
CenterCities
CitiesDOWNTOWN PROFILE
2
Newly-released data from the 2020 U.S. Census reveal
Employment that City Center continued to grow from 2019 to 2020. The
study area in the 2020 census does not map exactly to the
Population 2018 boundaries used for this study, due to changes in tract
geographies. Nevertheless, comparing census tracts 27 and
City Center City Region 45 between 2019 and 2020 shows that they grew 14%, from
Primary Jobs 63,112 171,283 476,061 8,807 residents to 10,070.
Share of Jobs n/a 37% 13% With more than 63,000 primary jobs, downtown serves as
Employees per an economic center for the city. Downtown has 37% of
square mile 19,600 1,173 90
citywide jobs and 13% of the region’s jobs. The jobs count
Primary Jobs
Growth 2010-2018 0.4% 4% 10% has remained fairly stable since 2010, although it has grown
Private Jobs modestly citywide, by 4%, and by 10% across the region.
Growth 2010-2018 2% 5% 13%
Private jobs figures show a similar trend, with minimal growth
downtown and more significant growth in the city and
Source: LEHD On the Map (2018).
region.
Inventory City Center Share of City Per Square
Mile
Growth
2010-2019
18.3M 39% 5.7M 1%
OFFICE
(SF)
RETAIL
(SF) 5.6M 51% 1.8M n/a
RESIDENTIAL
UNITS 7,311 13%
of region
2,270 14%
HOTEL
(ROOMS) 2,897 38% 900 n/a
Source: CoStar (2021), STAR Report (2018)
downtown.org | © 2021 International
InternationalDowntown
DowntownAssociation
Association 17
192 DOWNTOWN PROFILE
Downtown serves as a hub for a variety of commercial uses. IDA recommended that the urban place management
As the 2019 City Center Master Plan notes, “The value is organizations participating in this study use the commonly
certainly measurable in economic terms where the IDA understood definition of downtown and match boundaries
estimated that downtowns ‘deliver an average of 16% of the to hard edges, roads, water, natural features or highways.
citywide property tax revenue, 42% of the hotel tax revenue, IDA worked with each group in this analysis to align its study
and 12% of the sales tax revenue. Downtowns contain 11% of area with census tract boundaries for ease of incorporating
the city’s assessed land value, 28% of total employment, and publicly available data from the U.S. Census. The city referred
36% of the city’s office space.’” Downtown holds nearly 40% to in this study is the City of Birmingham, and the region is
of Birmingham’s office space and hotel rooms and 37% of its the Birmingham-Hoover Metropolitan Statistical Area, which
jobs. Office space, however, hasn’t grown much since 2010, consists of six counties (Bibb, Blount, Chilton, Jefferson, St.
suggesting some stagnation in downtown offerings. On the Clair, and Shelby).
other hand, residential development has increased by 14%
This study let IDA, REV Birmingham, and the City Center
since 2010, rising to 7,300 units, with a robust pipeline of
District Management Corporation take a deep dive into the
projects in the planning and construction stages.
effects of downtown on the metro area, region, and state. This
Downtown Study Area data forms a baseline against which REV Birmingham and City
Center District Management Corporation will compare future
The study area extends beyond the boundaries of the City
data to track growth, changes, and trends. In addition, IDA
Center Business Improvement District area, as geographic
and REV will add downtown Birmingham to the IDA’s Vitality
parameters vary across data sources and don’t typically align
Index, an interactive online benchmarking tool that compares
with boundaries designated by the local partner organization.
a downtown to its peers through the lenses of economy,
inclusion, and vibrancy.
Downtown covers
2.2% of citywide
land area
18
20 IDA
IDA | | The
The Value
Valueof
ofU.S.
U.S.Downtowns
Downtownsand
andCenter
CenterCities
CitiesDOWNTOWN PROFILE
2
downtown.org | © 2021 International
InternationalDowntown
DowntownAssociation
Association 19
212 DOWNTOWN PROFILE
Economy | Impact, Innovation
Downtowns make up a small share of their city’s land area but have substantial
economic importance.
While downtowns and center cities constitute a small share
of citywide land area, there’s no understating their regional
economic importance. As traditional centers of commerce, Downtown Employment
transportation, education, and government, downtowns
serve as economic anchors for their cities and regions.
Thanks to highly concentrated economic activity, investment
in the center city yields a high level of return per dollar.
37% 27%
Urban centers across the U.S. were the first areas to recover
from the Great Recession, and although the impact of the
2020 COVID-19 pandemic still reverberates, prior analysis CITY’S JOBS CITY’S PRIVATE
of the role of downtowns and center cities highlights their JOBS
unique ability to absorb and recover from economic shocks
and stresses.
Benefits of Economy: Economic Output, Economic
Impact, Investment, Creativity, Innovation, Visitation, 43%
Spending, Density, Sustainability, Tax Revenue, Scale, CITY’S CREATIVE
Commerce, Opportunity JOBS
With 37% of citywide jobs, downtown serves as a distinct
jobs center for Birmingham. Its 19,600 jobs per square mile
give it a job density 17 times greater than the city overall.
Downtown’s largest sectors power the city’s largest sectors, 39% 42%
with 39% of citywide health care and social assistance jobs, CITY’S HEALTH CARE/ CITY’S KNOWLEDGE
50% of citywide finance and insurance jobs, and 67% of SOCIAL ASSISTANCE INDUSTRY JOBS
citywide educational service jobs. Even across the region, JOBS
downtown accounts for 22% of jobs in health care and
social assistance, 17% of jobs in finance and insurance, and Source: LEHD On the Map (2018)
23% of jobs in educational services. The concentration of
these “knowledge industry” jobs underscores downtown’s
downtown, the industry declined precipitously around the
importance as a jobs center in industries growing fastest
time of the Great Recession, dropping from downtown’s
nationwide.
second-largest industry, and its jobs have not returned.
Health care and social assistance (15,500 jobs), public Accommodation and food services represents the fastest-
administration (9,300 jobs), and educational services growing sector downtown, with a 60% increase in jobs
(7,900 jobs) rank as the largest industries downtown and between 2010 and 2018. In the 12 months between 2017 and
together account for more than half of all downtown jobs. 2018, the most recent year for data, accommodation and
While finance and insurance jobs remain the fourth-largest food services jobs grew by 12%, while overall numbers rose
sector for jobs, and half of citywide jobs in this sector are only minimally.
20
22 IDA
IDA | | The
The Value
Valueof
ofU.S.
U.S.Downtowns
Downtownsand
andCenter
CenterCities
CitiesDOWNTOWN PROFILE
2
Job Change in Top 10 Industries in City Center
18,000 Health Care and Social
Assistance
16,000 Public Administration
14,000 Educational Services
Finance and Insurance
12,000
Professional, Scientific, and
10,000
# of Jobs
Technical Services
Utilities
8,000
Accommodation and Food
6,000 Services
Administration & Support,
4,000 Waste Management and
Remediation
Retail Trade
2,000
Real Estate and Rental and
Leasing
0
2002 2003 2004 2005 2006 2007 2008 2009 2010 2011 2012 2013 2014 2015 2016 2017 2018
Year
Source: LEHD On the Map (2018)
Downtown houses some of the state’s largest employers. Already reduced by bank mergers and consolidations,
The top three—the University of Alabama at Birmingham downtown’s finance and insurance jobs took a deep hit in the
(UAB), the largest employer in Alabama; Regions Financial, Great Recession. While they have yet to recover, jobs in this
Alabama’s only Fortune 500 company; and Alabama Power— sector grew by 13% citywide and 18% in the city and region.
all call downtown home. They share the district with growing Management sector jobs downtown dropped dramatically
tech companies like Shipt and Landing; regional hubs for after hitting a peak of 2,100 jobs in 2010; a steady decline
financial institutions like PNC, Synovus, and Wells Fargo; cut the number to 700 in 2018. Finally, information sector
and a large number of governmental jobs, both federal and jobs have experienced a slow decline since 2002, the earliest
municipal. year for this data. From 1,500 jobs in 2010, the total dropped
to only 800 in 2018—but this parallels a sharp decline in
Knowledge industries account for nearly half of downtown
the city and region. Information jobs, just one sector of the
jobs, but the total of these jobs has declined slightly since
knowledge industry, include jobs in publishing, broadcasting,
2010. An 11% increase in health care jobs helped buoy the
telecommunications, and data processing. Bolstering
category—particularly impressive given that the growth came
knowledge industry jobs will play a key role in diversifying
atop a large base of 14,000 jobs in 2010. That total reached
downtown’s economy to emphasize the sectors most
15,500 in 2018. The growth rate, however, closely matched
future-facing, well-paying, and attractive to a well-educated
growth in the city and region, suggesting that downtown just
workforce.
kept pace with city and regional trends.
downtown.org | © 2021 International
InternationalDowntown
DowntownAssociation
Association 21
232 DOWNTOWN PROFILE
Knowledge Industry Employment Growth 2010-2018
Finance, Insurance, Management of Professional, Information Health Care and Total
Real Estate and Companies Scientific, and Social Assistance Knowledge Job
Rental and Leasing and Enterprises Technical Services Change
City Center 2% -66% -7% -47% 11% -2%
City 13% -9% -9% -22% 13% 7%
Region 18% -3% 9% -17% 14% 11%
Source: LEHD On the Map (2010 and 2018)
Small Businesses and Startups
Downtown has a concentration of small businesses (with Slightly more than one-third of downtown workers come
fewer than 20 employees) similar to that of the city, and from outside of Jefferson County. This underscores the
slightly less than the regional proportion. Small businesses importance of downtown’s economy as a regional anchor,
play a critical role, generating new jobs, promoting particularly for neighboring Shelby County, where 13% of
innovation, and boosting competition; they account for downtown workers live.
almost half of U.S. economic activity.1 Compared to the city
On average, downtown workers earn more than workers
and region, downtown has a similar proportion of younger
citywide or regionwide. Almost 66% of downtown workers
businesses (fewer than three years old). Investments in
earn more than $3,333 per month, compared to 57% citywide
the Innovation Depot and the surrounding Switch district
and 50% in the region. According to data from the Census’s
have the potential to encourage more entrepreneurs to
Annual Business Survey, the aggregate annual payroll in two
create new firms and jobs. With a concentration of vacant
downtown ZIP codes, 35233 and 35203, accounts for 24% of
buildings and underused spaces, The Switch holds significant
Jefferson County’s total payroll and 18% of the region’s total
opportunity for developers as well as growing innovation/
payroll. In addition, the average annual wage in these two
tech companies and the service and lifestyle businesses that
ZIP codes is $67,875, higher than the average wage in the
support them. A collaborative Northwest Downtown Master
county by $15,000.
Planning effort, now underway, will guide strategic growth in
both The Switch and the neighboring Civil Rights District. It
should be complete by the end of 2021.
22
24 IDA
IDA | | The
The Value
Valueof
ofU.S.
U.S.Downtowns
Downtownsand
andCenter
CenterCities
CitiesDOWNTOWN PROFILE
2
Jobs by Firm Size Jobs by Earnings
City Center City Region City Center County Region
ZIP 35233 / 35203
< 20 PEOPLE 11% 11% 16% Downtown %
of Total Annual n/a 24% 18%
20-249 PEOPLE 21% 23% 23% Payroll
> 249 PEOPLE 68% 66% 61% Average
Employee Wage $68k $52k $51k
Source: LEHD On the Map (2017) Source: U.S. Census Annual Business Survey (2018)
Number of Regional Residents Who Work in City Center
Cullman County
717 downtown workers
1%
Blount County
1,263 downtown
workers
2%
Walker County
1,110 downtown workers
1.8% St. Clair County
2,351 downtown workers
3.7%
Jefferson County
40,126 downtown workers
64%
Talladega County
638 downtown workers
1%
Tuscaloosa County
Shelby County
1,092 downtown workers
8,170 downtown workers
1.7%
13%
Source: LEHD On the Map (2018)
downtown.org | © 2021 International
InternationalDowntown
DowntownAssociation
Association 23
252 DOWNTOWN PROFILE
Inclusion | Diversity, Affordability
Downtowns and center cities invite and welcome all residents, employees and
visitors by providing access to jobs, housing, essential services, culture, recreation,
entertainment, and participation in civic activities. A strong sense of inclusion and social
cohesion keeps communities strong in times of crisis.
“
Residents By Race
Inclusive spaces in the public realm, WHITE Downtown
particularly in our cities’ downtowns, 45%
City
Region
can help break down the social 24%
barriers that often divide us. Thriving 62%
downtown districts and public
”
BLACK
spaces promote not only economic 43%
prosperity, but also social cohesion.2 70%
30%
Benefits of Inclusion: Equity, Affordability, Civic ASIAN AND PACIFIC ISLANDER
Participation, Civic Purpose, Culture, Mobility, 5%
Accessibility, Tradition, Heritage, Services, Opportunity,
1%
Workforce Diversity
1%
Racial Diversity
OTHER
With a score of 60, downtown ranks higher on the Diversity
1%
Index than the city (46.5) does. This indicates a 60% chance
that any two random residents within downtown identify as 0%
different races or ethnicities. Since 2009, the population has 0%
split fairly evenly between Black and White residents, a trend
TWO OR MORE
that continues today. The increase in both Black and White
residents downtown suggests that a growing population and 3%
expanding residential options have not triggered widespread 1%
displacement. Beginning in 2013, data also shows steady
2%
growth in populations of racial groups that identify neither as
White nor Black. HISPANIC OR LATINO
4%
In contrast to the residential population, the racial
demographics of workers looks nearly identical in downtown 4%
and across the city. About 60% of workers are White and
5%
35% are Black. In addition, the vast majority of downtown
workers commute from around the region. Only 3,000 people
Source: American Community Survey 5-Year Estimates (2015–2019)
(roughly 5% of job holders) both live and work downtown.
24
26 IDA
IDA | | The
The Value
Valueof
ofU.S.
U.S.Downtowns
Downtownsand
andCenter
CenterCities
CitiesDOWNTOWN PROFILE
2
Employment By Race
WHITE Downtown
City
61%
Region
62%
68%
BLACK
35%
35%
29%
ASIAN
2%
2%
2%
NATIVE HAWAIIAN OR PACIFIC ISLANDER
0%
0%
0%
TWO OR MORE
1%
1%
1%
HISPANIC OR LATINO
2%
2%
3%
Source: LEHD On the Map (2018)
downtown.org | © 2021 International
InternationalDowntown
DowntownAssociation
Association 25
272 DOWNTOWN PROFILE
Population Change by Race and Ethnicity
Total Population
11K
White
Black
10K Asian
Two or More Races
9K Hispanic or Latino
8K
7K
Population
6K
5K
4K
3K
2K
1K
0K
2009 2010 2011 2012 2013 2014 2015 2016 2017 2018 2019
Year
Source: American Community Survey 5-Year Estimates (2015–2019)
Age Diversity
City Center Age Diversity
Downtown skews young, with almost two-thirds of the
population under 34. Residents aged 18–24 have propelled
downtown’s growth. Between 2009 and 2019, the number of
8% 9%
residents in this age range grew by 50%, accounting for more
< 18 years
than 3,800 residents downtown. Another fast-growing group, 13% 18 - 24
residents 50 to 64, also increased by 50% between 2009
and 2019. This age range may include empty nesters who 25 - 34
still work and value living close to their jobs and to cultural 14% 36% 35 - 49
amenities. 50 - 64
65+
21%
Source: American Community Survey 5-Year Estimates (2015–2019)
26
28 IDA
IDA | | The
The Value
Valueof
ofU.S.
U.S.Downtowns
Downtownsand
andCenter
CenterCities
CitiesDOWNTOWN PROFILE
2
Socioeconomic Diversity
Slightly more than one-third of downtown residents have The surprisingly low median household income for
very limited incomes, earning less than $15,000 a year. downtown looks even more curious in comparison to
These data cover residents 25 and older, a group that would downtown’s average income of $52,117. The apparent
typically exclude college students. Since many don’t earn any disparity reflects a concentration of wealthier residents in
income, they would skew the results. However, UAB’s student parts of downtown. Residents in the City Center core and
population, which includes graduate students, averages Uptown have an average income of $86,700, and 26% of
25.6 years old; students older than 25 account for nearly those residents earn more than $100,000. In fact, a slightly
35% of enrollment. The number of households in downtown higher proportion of residents downtown earn more than
earning less than $15,000 grew by 32% between 2009 and $100,000 a year than in the city as a whole. While they make
2019, although this number peaked in 2015 and then began up just 16% of downtown’s population, the highest-income
declining slowly. UAB’s rapid enrollment growth—it has residents have increased most dramatically, rising by 400%
added nearly 6,000 students since 2009—likely contributed over the past 10 years.
to the increase in low-income households. The large student
population also pulls down downtown’s median household
income, $24,014, compared to the citywide median of
$37,375.
Household Income 25+
Less than 35%
20%
$15,000 12%
$15,000 to 24%
31%
$40,000 23%
$40,000 to 18%
25%
$75,000 26%
$75,000 to 7%
10%
$100,000 13%
More than 16%
14%
$100,000 27%
Downtown City Region
Source: American Community Survey 5-Year Estimates (2015–2019)
downtown.org | © 2021 International
InternationalDowntown
DowntownAssociation
Association 27
292 DOWNTOWN PROFILE
Economic Inclusion
Downtown offers opportunities for residents of all
educational backgrounds. Like most downtowns, the
largest share of residents above 25—42%—have a college Household
degree; the rate surpasses the rates for the city or region.
Significantly more holders of college or advanced degree
Income
live downtown today than in 2010. DOWNTOWN CITY COUNTY
Workers in jobs downtown tend to hold bachelor’s or
advanced degrees at a slightly higher rate than in the city or
MEDIAN
INCOME $24K $37K $57K
region. Nevertheless, downtown includes those with other
educational backgrounds; 30% of workers hold either a high
school diploma or less, or some college or an associate’s
AVERAGE
INCOME $52K $54K $80K
degree.
MIDDLE-
Educational Attainment for Residents 25+
39%
CLASS
HOUSEHOLDS 23% 34% 38%
High School or Less 42% ($40K–$100K)
38%
20%
Some College 31% Source: American Community Survey 5-Year Estimates (2015–2019)
30%
24%
Bachelor’s Degree 17%
20%
Advanced Degree 10%
12%
18%
Jobs by Educational
0% 10% 20% 30% 40%
Attainment
Downtown City Region Downtown 2010 HIGH SCHOOL OR LESS
Source: American Community Survey 5-Year Estimates (2015–2019)
32% 37% 39%
SOME COLLEGE OR ASSOCIATE’S DEGREE
33% 33% 33%
BACHELOR’S OR ADVANCED DEGREES
36% 30% 28%
Downtown City Region
Source: LEHD On the Map (2018)
28
30 IDA
IDA | | The
The Value
Valueof
ofU.S.
U.S.Downtowns
Downtownsand
andCenter
CenterCities
CitiesDOWNTOWN PROFILE
2
Rent Price Change Over Time
Study area City Monthly Rent Cost
22,000 Less Than $600
1,600 $600 t o $999
$1,000 t o 1,499
20,000 $1,500 t o $1,999
1,500
$2,000 or More
1,400
18,000
1,300
1,200 16,000
1,100
Number of Renter Occupied Units
Number of Renter Occupied Units 14,000
1,000
900 12,000
800
10,000
700
600 8,000
500
6,000
400
300 4,000
200
2,000
100
0 0
2008 2010 2012 2014 2016 2018 2020 2008 2010 2012 2014 2016 2018 2020
Source: American Community Survey 5-Year Estimates (2005–2009) to (2015–2019)
downtown.org | © 2021 International
InternationalDowntown
DowntownAssociation
Association 29
312 DOWNTOWN PROFILE
Housing and Affordability
Despite the fact that downtowns generally have higher Housing and Transportation Index
housing prices, density of housing, concentration of
jobs, and access to public transportation can make Downtown City Region
living downtown less expensive than living in other
neighborhoods. Downtown boasts a lower Housing and 35% 45% 54%
Transportation Index score. This means that downtown
residents spend on average only 35% of their income on Source: Center for Neighborhood Technology (CNT) Housing and Transportation Index
(2017)
housing and transportation combined, whereas city and
regional residents spend 45% to 54% of their income on
these needs.
As in most downtowns, rental units dominate the housing
Renters
supply. With 87% of housing renter-occupied, downtown
Downtown City Region
has more rental units than the average downtown. Median % RESIDENTS
gross rent is $762, lower than the $837 median citywide, WHO RENT 87% 54% 29%
but this masks wide variation. Across the two highest-cost
MEDIAN
districts, downtown core/Uptown and the University, the GROSS RENT $762 $837 $896
median rent reaches $1,021, nearly equal to the national
MEDIAN RENT
average rent of $1,062. INCREASE 34% 23% 22%
Median rent for the rest of downtown, including Five Points 2010–2019
South, with the lowest median, is $492. Downtown has RENT-
20% of all subsidized housing in the city, and that pushes BURDENED 40% 48% 43%
the median below market rent. Downtown encompasses
Source: American Community Survey 5-Year Estimates (2015–2019)
very different residential markets, but the rate of
population growth in all districts suggests plenty of room
for continued growth at all price points. Since 2009, the
number of units that rent for less than $800 has fallen by
24%, while the number of units renting for $800 and more
has increased by 170%.
30
32 IDA
IDA | | The
The Value
Valueof
ofU.S.
U.S.Downtowns
Downtownsand
andCenter
CenterCities
CitiesDOWNTOWN PROFILE
2
Vibrancy | Spending, Fun
Due to their expansive base of users, center cities can support a variety of unique retail,
infrastructural, and institutional uses that offer cross-cutting benefits to the region.
Downtowns and center cities typically form the regional Residential Growth
epicenter of culture, innovation, community, and commerce.
Residential growth signals a fast-changing and vibrant
Downtowns flourish due to density, diversity, identity, and
downtown, one that has not only a working population by
use. An engaging downtown “creates the critical mass of
day but also activities and people throughout the day and
activity that supports retail and restaurants, brings people
night. Downtown’s residential population has grown strongly
together in social settings, makes streets feel safe, and
since 2010, far outpacing rates for the city and region. During
encourages people to live and work downtown because
the period, downtown added more than 2,000 residents.
of the extensive amenities.”3 Physical distancing measures
All but one block group in the study area experienced
during the COVID-19 pandemic have only emphasized the
growth, and the area south of Railroad Park grew by more
value of a vibrant downtown with restaurants, concerts,
than 80%. Immediately outside of downtown during this
outdoor events, and festivals. The recovery of storefront
period, population actually declined in most areas but
businesses, event venues, and hotels post-pandemic will
those adjacent to Five Points South. These trends highlight
play an essential role in restoring a sense of vibrancy and
how downtown has led the surrounding area in population
normalcy.
growth.
Benefits of Vibrancy: Density, Creativity, Innovation, According to Alabama Power, downtown residential
Investment, Spending, Fun, Utilization, Brand, Variety, inventory grew by 59%, from 4,589 units in 2010 to 7,311 units
Infrastructure, Celebration in 2020. This rate of growth far outpaces city and regional
rates over the same period. In addition, the 698 residential
units under construction account for half of the region’s
residential construction. Downtown stands well-positioned
Residential to accommodate more growth. Project 20 Midtown, a recent
large multifamily development, brought in downtown’s first
Growth full-sized grocery store, among other amenities that have
further encouraged a vibrant atmosphere day and night.
Downtown City Region
RESIDENTIAL
POPULATION
GROWTH 38% -2% -3%
SINCE 2010
RESIDENTIAL
INVENTORY
GROWTH 14% 5% -3%
SINCE 2010
Source: American Community Survey 5-Year Estimates (2015–2019)
downtown.org | © 2021 International
InternationalDowntown
DowntownAssociation
Association 31
332 DOWNTOWN PROFILE
Population Change in Birmingham, 2010 to 2019
Source: IDA Analysis of U.S. Decennial Census (2010) and American Community Survey 5-Year Estimates (2015–2019)
32
34 IDA
IDA | | The
The Value
Valueof
ofU.S.
U.S.Downtowns
Downtownsand
andCenter
CenterCities
CitiesDOWNTOWN PROFILE
2
Retail Vitality
Typically, a downtown’s retail environment helps define
Retail Sales the heart of the community and ranks as a key reason
for residents, workers, and visitors to come downtown.
Downtown’s dining scene takes the lead in this area;
DOWNTOWN RETAIL SALES SHARE OF CITY downtown has more than one-third of citywide food and
$605 Million 17% beverage businesses and nearly 30% of citywide food and
beverage sales. Community responses solicited for the
RETAIL SALES PER SQUARE MILE City Center Master Plan showed general retail as the most
requested new business type, followed by grocery stores.
$188 Million The accommodation and food services sector has added
1,300 jobs since 2010, further underscoring the importance of
food and beverage downtown.
Source: ESRI Business Analyst (2019)
In total, downtown generates an estimated $605 million in
yearly retail sales, accounting for 17% of retail sales citywide.
Downtown car dealerships generate nearly half of this
All Retail value. Non-residents make roughly 90% of these purchases,
indicating downtown businesses’ reliance on customers from
TOTAL RETAIL BUSINESSES
around the city and region.
Downtown City
According to CoStar, downtown has more than 5.6 million
384 1,827 square feet of retail. At $13.65 per square foot, retail rent falls
well below the average of $24.20 for downtowns in the Value
of Downtowns study, but the vacancy rate of 5%, suggesting
NUMBER OF RESTAURANTS AND BARS
165 838
Retail Real
Source: ESRI Business Analyst (2018)
Estate
Downtown City Region
SQUARE FEET
OF RETAIL
5.6M 11M 83M
AVERAGE RETAIL
VACANCY RATE 5% 4% 4%
RENT PER
SQUARE FOOT $13.65 $12.36 $13.36
INVENTORY
PER SQUARE 1.75M 75K 15K
MILE
Source: CoStar (2021)
downtown.org | © 2021 International
InternationalDowntown
DowntownAssociation
Association 33
352 DOWNTOWN PROFILE
a strong market, falls below the average downtown rate
of 7%. Rents vary widely within downtown; in particular,
new inventory costs much more than the study average.
Downtown lacks a large supply of space dedicated to retail,
and at least some, housed in historic properties, needs
Hotels
extensive work to meet code and be considered “move-
in ready.” Some historic spaces originally built for large- DOWNTOWN CITY
footprint retail—for example, department stores, which have
largely disappeared—would require subdivision or adaptive HOTELS 16 91
reuse to make them more attractive to and useful for modern
HOTEL
tenants.
ROOMS 2,897 7,582
With 2,897 rooms in 16 hotels, downtown has about 18% of
AVERAGE
hotels citywide but 38% of hotel rooms. This concentration
underscores the intensity of activity downtown. The count
OCCUPANCY 65% 67%
puts Birmingham slightly above average among peer
downtowns, but the average occupancy rate of 65% shows Source: STR Report (2018)
room for improving visitor attraction. As downtowns recover
from the impacts of COVID, drawing more visitors will play a
crucial role in restarting the local economy.
Downtown hosts several large and culturally significant
festivals that celebrate the city’s history and diversity.
The annual Juneteenth celebration, presented by the
Birmingham Civil Rights Institute, takes place in historic
Kelly Ingram Park. The Sidewalk Film Festival showcases
the historical theatre district, and Taste of 4th Avenue
Jazz Festival highlights that historic thoroughfare. Fiesta,
Alabama’s largest celebration of Hispanic culture and
cuisine, takes place in Linn Park. Autumn brings Oktoberfest
to Railroad Park and, in November, the oldest and one of
the largest Veteran’s Day parades in the U.S. Each of these
events brings together different communities from within
downtown and the larger city, underscoring downtown’s key
function as a vibrant gathering space.
The festivals complement a full calendar of events at the
Birmingham-Jefferson Convention Complex, which contains
a theater, concert halls, and an arena. The pandemic hit
Birmingham just as several event venues had either begun
construction or launched renovations. In the fall of 2021,
a new 47,000-seat stadium will begin operation, as will
the newly renovated 17,000-seat Legacy Arena, and a
90-plus-room hotel. These venues will figure prominently
in upcoming sporting events, such as the World Games in
July 2022, the first and second rounds of the NCAA Men’s
Basketball Tournament in 2023, and the NCAA Women’s
Regional Round in 2025.
34
36 IDA
IDA | | The
The Value
Valueof
ofU.S.
U.S.Downtowns
Downtownsand
andCenter
CenterCities
CitiesDOWNTOWN PROFILE
2
Identity | Visitation, Heritage, Tradition
Downtowns and center cities preserve the heritage of a place, provide a common point
of physical connection for regional residents, and contribute positively to the brand of
the regions they anchor.
Downtowns are “iconic and powerful symbols for a city and Downtown anchors a thriving region. Its distinct districts offer
often contain the most iconic landmarks, distinctive features, different assets and different lifestyles within a concentrated
and unique neighborhoods. Given that most downtowns area. City Center serves as the traditional central business
represent one of the oldest neighborhoods citywide, they district, home to Birmingham’s tallest and oldest buildings
offer rare insights into their city’s past, present, and future.”4 and an employment hub for financial/banking institutions
The authentic cultural offerings in downtown enhance its and law firms with regional reach. The University of Alabama
character, heritage, and beauty, and create a unique sense of at Birmingham ranks as the largest single employer
place not easily replicated in other parts of the city. downtown and creates a unique university feel in its own
district, which spills over to the emerging Switch district,
Benefits of Identity: Brand, Visitation, Heritage, Tradition, home to innovation-focused enterprise.
Memory, Celebration, Fun, Utilization, Culture
Just west of the City Center, the Civil Rights District
memorializes the struggle against segregation and honors
key landmarks of the Civil Rights era. Parts of the district
make up an established national monument, which includes
the Birmingham Civil Rights Institute, 16th Street Baptist
Church, AG Gaston Motel, and Kelly Ingram Park. The district
Social Media
also encompasses the Fourth Avenue Business District, once
one of the largest Black-owned business districts in the
U.S. These evocative embodiments of U.S. history are key
attractions that bring visitors downtown.
INSTAGRAM POSTS WITH HASHTAGS The relatively young Railroad Park has started the work of
#DOWNTOWNBIRMINGHAM stitching together downtown and creating a citywide “living
#BIRMINGHAMAL
room” for all. The 19-acre park offers a green respite in the
DOWNTOWN CITY heart of downtown, serving as a community space for the
entire city. Immediately south of the park, Regions Field,
19,958 242,878 home to the Birmingham Barons Minor League Baseball
team, typically attracts thousands of fans to each game.
TWITTER FOLLOWERS Together, these two attractions have revitalized development
downtown and continue to draw new investment.
12,300 23,200 Downtown, like many of its peers, has nurtured dynamic
food, brewery and bar scenes. The food scene has won
FACEBOOK FOLLOWERS increasing attention, with a particular concentration of
10,311 33,066 award-winning restaurants in Five Point South. In January
2020, CNN Travel named Birmingham an “unexpected
foodie city.”5
As of June 1, 2021
downtown.org | © 2021 International
InternationalDowntown
DowntownAssociation
Association 35
372 DOWNTOWN PROFILE
Finally, the Uptown district serves as downtown’s hub for
hospitality and entertainment. With the new convention
complex, Protective Stadium, and Legacy Arena, it hosts
hundreds of events in a typical non-pandemic year. The study
area has led citywide preparation for the 2022 World Games,
expected to bring more than 100,000 spectators to the first
U.S. city to host the games since they began in 1981.
Building on the success of Railroad Park and the momentum
of the World Games, downtown has developed a master
plan for City Walk. At the border of Uptown and City Center,
the trail will rethink the spaces beneath Interstate 20/59
bridges as sites for recreation, public art, and green spaces.
The plan envisions a new destination that stitches together
different downtown districts and offers new community space
in a growing and thriving downtown.
Destinations and Unique Features
54 10 8
HISTORIC MUSEUMS PARKS AND
STRUCTURES NATURAL AREAS
Source: National Register of Historic Properties (2021)
36
38 IDA
IDA | | The
The Value
Valueof
ofU.S.
U.S.Downtowns
Downtownsand
andCenter
CenterCities
CitiesYou can also read