GLOBAL SHALE GAS DEVELOPMENT - Water Availability and Business Risks WRI.ORG
←
→
Page content transcription
If your browser does not render page correctly, please read the page content below
GLOBAL SHALE GAS
DEVELOPMENT
Water Availability and Business Risks

PAUL REIG, TIANYI LUO, AND JONATHAN N. PROCTOR

    WRI.ORG

                                             Global Shale Gas Development: Water Availability and Business Risks   i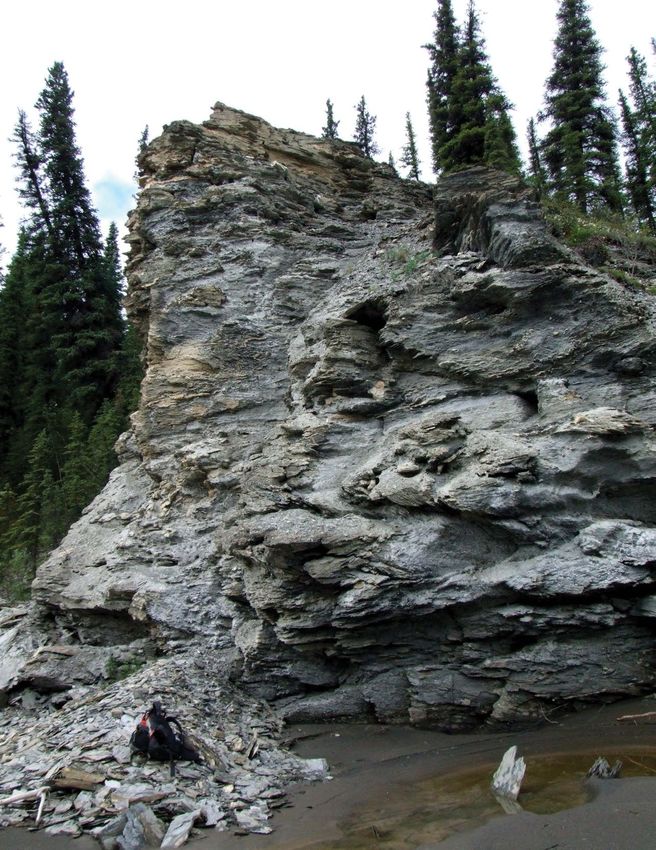
Design and layout by:
Nick Price
nickprice.contact@gmail.com
TABLE OF CONTENTS
v     Foreword

1     Executive Summary
6     Key Findings
8     Recommendations

11    Introduction

17    Shale Resources and Water
18    Extraction of Shale Resources
19    Water Requirements
20    Freshwater Availability Risks

25	Assessing Fresh Water Availability and
    Business Risk
26 Methodology
27 Geo-Database of Shale Basins and Plays
27	Water Availability and Business Risk Indicators

31	Global Results
34 Key Findings
36 Country Comparisons

41    Conclusions and Recommendations
42    Conclusions
42    Recommendations

46    Appendix A: Country Analyses

74    Definitions

75    Endnotes
iv WRI.org
FOREWORD
For many nations around the world, shale gas            This report draws on WRI’s Aqueduct Water Risk
represents an opportunity to strengthen energy          Atlas to identify the key locations, globally and with a
security while cutting emissions. In fact, shale gas    special focus on 11 countries, where shale gas and tight
adds 47 percent to the world’s natural gas reserves.    oil extraction might face the greatest water challenges.
But as governments and businesses explore this          In these areas government policies will be needed to
new and abundant resource, freshwater availability      guarantee water security, protect the environment,
is a key challenge they must address. In this study     and avoid business risks, if shale energy is developed.
WRI provides unprecedented global information on
freshwater availability for governments and busi-       With interest in shale gas growing, the time is ripe
nesses considering shale development.                   to understand its constraints. This report will be an
                                                        invaluable resource to businesses, policymakers,
Extracting oil or natural gas from shale poses a        and civil society in ensuring water for people and
number of risks to the environment and requires         the planet.
large quantities of nearby water. Much of this water
is needed for fracturing the shale to allow hydrocar-
bons to flow to the surface. Yet shale resources are
not always located where water is abundant. Our
analysis shows that China, India, South Africa, and
Mexico, for example, have large quantities of shale
gas but limited supplies of freshwater. It also shows
that roughly 38 percent of the area where shale
resources are located is arid or under significant
water stress; plus, 386 million people live above
these areas. These factors pose significant social,
                                                        Andrew Steer
environmental, and financial challenges to access-
                                                        President
ing water and could limit shale development.
                                                        World Resources Institute

With growing energy demands and attractive finan-
cial and employment opportunities for hydrocarbon
development, how can regulators and companies
determine if enough freshwater exists in a given
area to extract natural gas and oil from shale while
not degrading the environment?

                                                        Global Shale Gas Development: Water Availability and Business Risks   v
vi WRI.org
EXECUTIVE SUMMARY
Limited availability of freshwater could become a stumbling block for
rapid development of shale resources through hydraulic fracturing.
Using information from the Aqueduct Water Risk Atlas, WRI provides
the first global and country-specific resource to help stakeholders
evaluate freshwater availability across shale plays worldwide.

                                   Global Shale Gas Development: Water Availability and Business Risks   1
Innovation in hydraulic fracturing and horizontal       the first publicly available, global and country-spe-
       drilling techniques is driving the rapid development    cific analysis to help evaluate freshwater availability
       of shale resources (which include shale gas, natural    across shale resources worldwide. Using geospatial
       gas liquids, and tight oil) across the United States    analysis to combine indicators from WRI’s Aque-
       and Canada.1 Already, known shale deposits world-       duct Water Risk Atlas and other sources (Table
       wide have significantly increased the volume of the     ES1) with the locations of shale resources globally
       world’s natural gas and oil resources. Governments      from West Virginia University and the National
       from Argentina and the United Kingdom, to Mexico        Energy Technology Laboratory, the report:

                                                               ▪▪
       and China, have started to explore the commercial
       viability of their shale reserves.                           Identifies locations most in need of govern-
                                                                    ment oversight and robust corporate policies to
       The potential for expansion is huge: known shale             properly manage freshwater availability in the
       gas deposits worldwide add 47 percent to the global          context of shale development; and
       technically recoverable natural gas resources, and
       underground stores of tight oil add 11 percent to the
       world’s technically recoverable oil.
                                                               ▪▪   Informs companies of potential business risks
                                                                    associated with freshwater availability, and
                                                                    builds the case for corporate water stewardship
       But as countries escalate their shale exploration,           and early source water assessment.
       limited availability of freshwater could become
       a stumbling block. Extracting shale resources           In addition to examining water availability and shale
       requires large amounts of water for drilling and        resource development from a global perspective (Fig-
       hydraulic fracturing. In most cases, these demands      ure ES1), this report analyzes for the first time water
       are met by freshwater, making companies develop-        availability in each shale play (prospective areas
       ing shale significant users and managers of water at    within the shale formation where gas and oil could
       local and regional levels, often in competition with    be commercially extracted) for 11 countries: Algeria,
       farms, households, and other industries.                Argentina, Australia, Canada, China, Mexico, Poland,
                                                               Saudi Arabia, South Africa, the United Kingdom,
       Although experts agree that critical environmental      and the United States. WRI selected these countries
       risks and impacts are associated with developing        based on the size of their technically recoverable
       shale, the risks and impacts specific to surface and    shale resources (as estimated by the U.S. Energy
       groundwater availability have been thinly docu-         Information Administration), current exploratory
       mented. With Global Shale Gas Development:              and production activity, likelihood of future develop-
       Water Availability and Business Risks, the World        ment, and feedback from industry, academia, and
       Resources Institute (WRI) fills this gap, providing     nongovernmental organization (NGO) experts.

2   WRI.org
Table ES1 |   Indicators Selected to Evaluate Freshwater Availability and Associated Business Risks

  INDICATOR                   DEFINITION

  Baseline water stress       The ratio of total water withdrawals from municipal, industrial, and agricultural users relative to the
                              available renewable surface water. Higher values may indicate more competition among users and
                              greater depletion of water resources.

  Seasonal variability        The variation in water supply between months of the year. Higher values indicate more variation in water
                              supply within a given year, leading to situations of temporary depletion or excess of water.

  Drought severity            The average length of droughts multiplied by the dryness of the droughts from 1901 to 2008. Higher
                              values indicate areas subject to periods of more severe drought.

  Groundwater stress          The ratio of groundwater withdrawal to its recharge rate over a given aquifer. Values above one indicate
                              where unsustainable groundwater consumption could impact groundwater availability and groundwater-
                              dependent ecosystems.

  Dominant water user         The sector (agricultural, municipal, or industrial) with the largest annual water withdrawals.

  Population density          The average number of people per square kilometer.

  Reserve depth interval      The range of depths of the prospective shale area. Deeper formations generally require more water for drilling.

This report does not attempt to identify or address                    in river basins worldwide. The report results are
risks to water quality associated with the develop-                    available online (http://www.wri.org/resources/
ment of shale resources. Nor does it assess the                        maps/water-for-shale), providing open access to
performance of the oil and gas industry in manag-                      the underlying information and enabling updates as
ing water. Instead, it aims to share information                       new data are made available.
that can help increase the dialog among water
users from industry, government, and civil society

                                                                      Global Shale Gas Development: Water Availability and Business Risks       3
Figure ES1 |         L ocation of World’s Shale Plays, Volume of Technically Recoverable Shale Gas
                             in the 20 Countries with the Largest Resources, and the Level of Baseline Water Stress

       LEGEND

                        CANADA
          573

                                  Country name

                   Average Baseline Water Stress Level

              Technically recoverable shale gas
              resources (trillion cubic meters)

       BASELINE WATER STRESS LEVEL
                Low

                Low to medium
                Medium to high
                High

                Extremely high

                Arid & low water use

                    SHALE BASIN

4   WRI.org
Notes
1. Colored polygons are areas that have been identified as shale plays: shale deposits that are viable for commercial production.
2. Dark grey polygons are shale basins. While shale plays fall within basins, other shale resources within basins may not be commercially viable.
3. Circle size denotes the country’s total technically recoverable shale gas resources (trillion cubic meters).
4. Circle color denotes the area-weighted average of baseline water stress levels over all shale plays within a country. If more than half of the country’s shale play area is in
arid and low water use regions, the circle is colored in light grey.
Sources: Location of world’s shale basins and plays from West Virginia University and The National Energy Technology Laboratory. Estimates of total technically recoverable
shale gas resources from the U.S. Energy Information Administration. Estimates of baseline water stress from WRI’s Aqueduct Water Risk Atlas.
Global Shale Gas Development: Water Availability and Business Risks 5Key findings Furthermore, 386 million people live on the land
over these shale plays, and in 40 percent of the
Shale resources are unevenly distributed worldwide
shale plays, irrigated agriculture is the largest water
and, for the most part, not located where freshwater
user. Thus drilling and hydraulic fracturing often
is abundant. For example, China, Mexico (Figure
compete with other demands for freshwater, which
ES2), and South Africa have some of the largest
can result in conflicts with other water users. This
technically recoverable shale gas resources (based
is particularly true in areas of high baseline water
on estimates from the U.S. Energy Information
stress, where over 40 percent of the available water
Administration), but face high to extremely high
supplies are already being withdrawn for agricul-
water stress where the shale is located.
tural, municipal, or industrial purposes.
This report reveals that lack of water availability
The 20 countries with the largest shale gas or tight
could curtail shale development in many places
oil resources that are recoverable using currently
around the world:
available technology are shown in Table ES2.
▪▪ 38 percent of shale resources are in areas that
are either arid or under high to extremely high ▪▪ Eight of the top 20 countries with the largest
shale gas resources2 face arid conditions or high
levels of water stress;
to extremely high baseline water stress where the
▪▪ 19 percent are in areas of high or extremely
high seasonal variability; and
shale resources are located; this includes China,
Algeria, Mexico, South Africa, Libya, Pakistan,
Egypt, and India.
▪▪ 15 percent are in locations exposed to high or
extremely high drought severity.
Figure ES2 | Mexico’s Shale Plays Often Overlap with Areas with High Baseline Water Stress
11% Low
27% Low to medium
Medium to high
WATER
High
31% STRESS
4% Extremely high
8% Arid & low water use
19% Shale play
Sources: Location of shale plays from West Virginia University and The National Energy Technology Laboratory. Estimates of baseline water stress from WRI’s Aqueduct
Water Risk Atlas.
6 WRI.orgTable ES2 | Average Exposure to Water Stress across Shale Plays
A. TWENTY COUNTRIES WITH THE LARGEST TECHNICALLY B. TWENTY COUNTRIES WITH THE LARGEST TECHNICALLY
RECOVERABLE SHALE GAS RESOURCES RECOVERABLE TIGHT OIL RESOURCES
AVERAGE EXPOSURE TO AVERAGE EXPOSURE TO
RANKa COUNTRY WATER STRESS OVER RANKa COUNTRY WATER STRESS OVER
SHALE PLAY AREA SHALE PLAY AREA
1 China High 1 Russian Low
Federation
2 Argentina Low to Medium
2 United States Medium to High
3 Algeria Arid & Low Water Use
3 China High
4 Canada Low to Medium
4 Argentina Low to Medium
5 United States Medium to High
5 Libya Arid & Low Water Use
6 Mexico High
6 Australia Low
7 Australia Low
7 Venezuela, RB Low
8 South Africa High
8 Mexico High
9 Russian Low
Federation 9 Pakistan Extremely High
10 Brazil Low 10 Canada Low to Medium
11 Venezuela Low 11 Indonesia Low
12 Poland Low to Medium 12 Colombia Low
13 France Low to Medium 13 Algeria Arid & Low Water Use
14 Ukraine Low to Medium 14 Brazil Low
15 Libya Arid & Low Water Use 15 Turkey Medium to High
16 Pakistan Extremely High 16 Egypt, Arab Rep. Arid & Low Water Use
17 Egypt, Arab Rep. Arid & Low Water Use 17 India High
18 India High 18 Paraguay Medium to High
19 Paraguay Medium to High 19 Mongolia Extremely High
20 Colombia Low 20 Poland Low to Medium
a. Based on size of estimated shale gas technically recoverable resources a. Based on size of estimated tight oil technically recoverable resources
Sources: Estimates of total technically recoverable shale gas and tight oil resources from the U.S. Energy Information Administration. Estimates of baseline water stress from
WRI’s Aqueduct Water Risk Atlas.
Global Shale Gas Development: Water Availability and Business Risks 7▪▪ Eight of the top 20 countries with the largest
tight oil resources3 face arid conditions or high
Recommendations
Based on the report’s analysis, WRI offers a set of
to extremely high baseline water stress where
practical recommendations for how governments,
the shale resources are located; this includes
businesses, and civil society can continue to evalu-
China, Libya, Mexico, Pakistan, Algeria, Egypt,
ate and sustainably manage freshwater availability
India, and Mongolia.
if shale resources are developed.
Hydrological conditions vary spatially and seasonally
1. C
onduct water risk assessments to
across shale plays, with variation among plays, within
understand local water availability and
plays, and throughout the year. This variation makes
reduce business risk.
companies’ ability to meet the freshwater demands
for hydraulic fracturing and drilling highly unpredict- 1.1. C
ompanies can evaluate water-related
able, and estimates based on previous experience risks. Using a combination of publicly avail-
not always accurate in new shale formations. This able global and asset-level tools, companies
high level of uncertainty can lead to business risks for should identify water-related business risks
companies exploring new areas for development. Fur- and prioritize areas to engage with regula-
thermore, public concern over increased competition tors, communities, and industry to increase
and impacts on freshwater availability can threaten water security.
a company’s social license to operate and lead to
changes in government regulations that could impact 1.2. G
overnments can increase investments in
both short- and long-term investments. collecting and monitoring water supply
and demand information. Robust baseline
WRI’s findings indicate that companies developing information and estimates of future water
shale resources internationally are likely to face supply and demand and environmental
serious challenges to accessing freshwater in many conditions can help build a strong, shared
parts of the world. These challenges highlight a knowledge base to inform the development
strong business case for strategic company engage- of effective water policies and science-based
ment in sustainable water management at local targets and goals.
and regional levels. They also point to a need for
companies to work with governments and other
sectors to minimize environmental impacts and
water resources depletion.
8 WRI.org2. I ncrease transparency and engage with
local regulators, communities, and
industry to minimize uncertainty.
2.1. C
ompanies can increase corporate water
disclosure. By disclosing and communicating
their water use and management approach,
companies can build trust with financial and
river basin stakeholders as they investigate
water risks and opportunities. Ongoing
disclosure will reduce reputational risks.
2.2. G
overnments and companies can engage
with local and regional industry, agricul-
ture, and communities. Companies should
closely collaborate with local government,
industry, NGOs, and civil society to under-
stand the hydrological conditions and
regulatory frameworks within the river
basin. This information allows for more
accurate estimates of the cost, technology,
and processes required to access water for
shale development without displacing other
users or degrading the environment.
3. E
nsure adequate water governance to 4. M
inimize freshwater use and engage in
guarantee water security and reduce corporate water stewardship to reduce
regulatory and reputational risks. impacts on water availability.
3.1. C
ompanies can engage in public water 4.1. C
ompanies can minimize freshwater
policy. Adequate water governance and use. Using publicly available guidelines,
environmental protection standards, companies can evaluate their potential for
coupled with predictable implementation using non-freshwater sources and build a
and effective enforcement, can minimize business case for investing in technology to
environmental degradation and ensure recycle or reuse water, use brackish water,
fair water allocation and pricing. A stable or otherwise significantly reduce freshwater
regulatory environment allows companies withdrawals.
and investors to evaluate long-term oppor-
tunities and minimize business risks. 4.2. C
ompanies can develop a water strategy
and engage in corporate water steward-
3.2. G
overnments and companies, through ship. Companies should embed water
collective action, can develop source water management at the core of their business
protection and management plans. Gov- strategy to minimize exposure to risks and
ernments and businesses in the early stages ensure long-term water availability for
of developing shale resources have a unique other users, the environment, and their
opportunity to work collectively with key own operations. Corporate water steward-
river basin stakeholders to develop source ship involves a progression of increasing
water protection and management plans improvements in water use and impact
that help reduce business risks; promote reductions across internal company opera-
a shared water sourcing and recycling tions and the rest of the value chain.4
infrastructure; and improve the sustainable
management of watersheds and aquifers.
Global Shale Gas Development: Water Availability and Business Risks 9INTRODUCTION
Relatively little has been published on how shale development
impacts water availability in North America, and even less
worldwide. WRI fills this gap with new information describing where
in the world freshwater availability is most threatened and may limit
extraction of shale resources, should they be developed.
Global Shale Gas Development: Water Availability and Business Risks 11economic growth and reduce emissions from other
conventional energy sources. Compared with coal,
natural gas results in less carbon dioxide, nitrogen
oxides, sulfur dioxide, particulates, and mercury
per unit of energy produced.9 With effective poli-
cies and standards in place, natural gas could help
displace coal while complementing lower-carbon
and renewable energy sources.10
It is not sufficient to understand the potential
benefits of shale resources relative to other energy
sources; it is also necessary to know if the shale
resources can actually be extracted. This depends
on the economic viability of the resources, that is,
the cost and feasibility of extraction, as well as on
the onsite environmental and social considerations.
These considerations are complex. For shale gas and
tight oil to be extracted successfully, governments,
companies, and investors must clear a range of
economic, technical, environmental, legal, and social
hurdles. Poor management of these challenges will,
without doubt, impede development, undermine
investments, and degrade natural capital.
Much has been written about the key environmen-
Rapid development of shale resources through tal considerations and associated risks of shale
hydraulic fracturing and horizontal drilling is development, particularly in the United Sates.11
significantly increasing the contribution of natural All environmental considerations have a strong
gas, natural gas liquids, and oil to the global energy social component, since natural resources are the
supply mix. Continued growth could transform the foundation of economic opportunity and human
global energy market.5 While profitable production wellbeing. A recent U.S. study based on informa-
has yet to spread outside the United States and tion collected from experts in academia, industry,
Canada, governments, investors, and companies government, and nongovernmental organizations
have begun to explore the commercial potential of (NGOs) identified the 15 environmental impacts
shale resources around the world. China and Argen- from shale development most frequently identified
tina recently embarked on joint-venture projects and agreed upon as priorities for further regulatory
with multinational corporations, and Mexico lifted or voluntary action (Table 1).12 Many are not unique
the government’s 75-year-old monopoly on oil and to shale development, particularly those that take
gas production, opening some of the world’s largest place during site preparation or drilling activities,
shale formations for development.6 thus countries with mature hydrocarbon industries
may already have extensive corporate and govern-
The U.S. Energy Information Administration (EIA) ment policies to help mitigate them.
estimates that known shale gas deposits worldwide
add 47 percent to the global technically recoverable Of the 15 impacts identified, 12 relate to surface or
natural gas resources and that underground stores groundwater resources. This is because the develop-
of tight oil add 11 percent to the world’s technically ment of shale resources uses water so extensively,
recoverable oil.7 In 2012, shale resources consti- particularly during hydraulic fracturing (Figure
tuted 40 percent of U.S. natural gas production and 1), and because poor drilling practices, including
29 percent of U.S. crude oil production.8 If devel- wastewater management and disposal, can degrade
oped responsibly, this large, abundant, and newly water quality. However, 10 of the identified impacts
recoverable resource has the potential to catalyze are linked to concerns over water quality, compared
12 WRI.orgTable 1 | E nvironmental Impacts from Shale Gas Development Seen as Priorities by Government,
Industry, Academia, and NGO Experts
ACTIVITIES BURDENS IMPACTS
Development Burdens that could be created
Stage Aspects of the environment
Activities associated with the by a development activity
that could be affected by the
development of shale gas and that would have potential
shale gas development process
impacts that people care about
Storm water flows Surface water quality
Land clearing and infrastructure
Site preparation
construction
Habitat fragmentation Habitat disruption
Venting of methane Methane Air quality
Casing and cementing Methane Groundwater quality
Drilling
Casing accidents Methane Groundwater quality
Drilling fluids/cuttings
Cementing accidents Fracturing fluids Groundwater quality
Flowback and produced water
Surface water availability
Use of surface water and
Freshwater withdrawals
groundwater
Groundwater availability
Fracturing and
completion
Storage of fracturing fluids Fracturing fluids Surface water quality
Venting of methane Methane Air quality
Surface water quality
Flowback and produced water
On-site pit/pond storage Groundwater quality
Storage/
disposal of
Fracturing fluids Surface water quality
fracturing fluids
and flowback
Treatment by municipal wastewater
Flowback and produced water Surface water quality
treatment plants
Treatment by industrial wastewater
Flowback and produced water Surface water quality
treatment plants
Source: Alan J Krupnick, Managing the Risks of Shale Gas: Key Findings and Further Research (Resources for the Future, 2013), http://www.rff.org/rff/documents/RFF-Rpt-
ManagingRisksofShaleGas-KeyFindings.pdf.
Global Shale Gas Development: Water Availability and Business Risks 13with only 2 regarding water availability. This might The results also demonstrate the application of
explain why relatively little has been published on WRI’s Aqueduct Water Risk Atlas as a robust
how shale development impacts water availability decision-support tool to evaluate the water-energy
in North America,13 and even less worldwide.14 nexus at a global scale and increase public aware-
ness around water-related business risks.
To fill this gap, the World Resources Institute
(WRI) used data from the Aqueduct Water Risk This report is not intended to assess the perfor-
Atlas, West Virginia University, the National mance of the oil and gas industry in managing
Energy Technology Laboratory, and other sources water, but rather to demonstrate the usefulness of
to identify where freshwater availability might global tools like the Aqueduct Water Risk Atlas as
be a limiting factor to the development of shale a starting point to promote increased dialog among
resources. In this report, WRI provides comprehen- water users across industry, government, and civil
sive color-coded maps that: society in river basins around the world. The results
▪▪
of this report are published on an interactive online
Identify locations most in need of govern- platform (http://www.wri.org/resources/maps/
ment oversight and robust corporate policies water-for-shale) that provides open access to the
to ensure freshwater availability for industry, data and results, and enables frequent updates of
communities, agriculture, and the environment the information as new data are made available.
over time, if shale resources are developed, and
▪▪ Inform companies developing shale resources
of potential business risks associated with
freshwater availability, and build the case for
increasing water stewardship and early source
water assessment in the oil and gas sector.
14 WRI.orgFigure 1 | The Hydraulic Fracturing Water Cycle
1 2 3 4 5
Water Aquisition Chemical Mixing Well Injection Flowback and Wastewater Treatment
Produced Water and Waste Disposal
Natural gas flows from fissures into well
Source: Adapted from U.S. Environmental Protection Agency, “The Hydraulic Fracturing Water Cycle,” EPA’s Study of Hydraulic Fracturing and Its Potential Impact on
Drinking Water Resources, March 16, 2014, http://www2.epa.gov/hfstudy/hydraulic-fracturing-water-cycle.
Global Shale Gas Development: Water Availability and Business Risks 15SHALE RESOURCES
AND WATER
Large water withdrawals during the drilling and hydraulic fracturing
stages are necessary to extract shale resources. These withdrawals
are concentrated over shale gas and tight oil production areas,
making source water availability and the associated risks a critical
consideration when evaluating the potential for shale development.
Global Shale Gas Development: Water Availability and Business Risks 17BOX 1 | SHALE RESOURCES TERMINOLOGY an even lower permeability than tight gas or coal
bed methane reservoirs.16 Thus gas and fluid pass
through shale less easily than through brick, con-
▪▪ Natural gas liquids (NGLs): naturally occurring
hydrocarbons found in natural gas or associated
crete, or even granite.17 Because of its extremely low
permeability, shale must be cracked apart for oil and
with crude oil that are considered a byproduct in the
oil and gas industry and increasingly being targeted gas to flow up to the surface at a profitable rate; this
for extraction. is achieved by hydraulic fracturing.
▪▪ Shale basin: large shale formation defined by
similar geologic characteristics.
Extraction of Shale Resources
▪▪ Shale gas: natural gas deposits found in shale
reservoirs. Shale can, in places, be hydraulically fractured to
produce large quantities of natural gas, NGLs, and
▪▪ Shale play: the prospective areas of a shale basin
where gas and oil could potentially be commercially
tight oil. Hydraulic fracturing entails pumping fluid
composed of water, proppants, and chemicals into
extracted.
the ground at very high pressure. The pressurized
▪▪ Shale resource: hydrocarbon resources found in
shale plays, such as natural gas, natural gas liquids,
water and chemicals create and enlarge cracks in
the shale formation, which increases its permeabil-
and tight oil. ity by 100- to 1,000-fold, allowing the hydrocarbons
▪▪ Tight oil: oil trapped in fine-grained sedimentary
rocks with extremely low permeability, such as
to flow more easily to the wellbore.18 Depending on
many factors, a well might remain productive for 5
shale, sandstone or carbonate. to 40 years.
Sources: E.D. Williams and J.E. Simmons, Water in the Energy Industry.
After the hydraulic fracturing treatment, the water
An Introduction (United Kingdom: BP International Ltd, 2013), http://www. pressure in the well is reduced to allow the fracturing
bp.com/content/dam/bp/pdf/sustainability/group-reports/BP-ESC-water-
handbook-131018.pdf. L. Biewick, G. Gunther, and C. Skinner, “USGS National
fluid to flow back out of the well followed by the oil
Oil and Gas Assessment Online (NOGA Online) Using ArcIMS” (Denver, and gas. As the fluid flows back to the surface, a pro-
Colorado: U.S. Geological Survey, n.d.), http://proceedings.esri.com/library/ cess commonly referred to as “flowback,” the sand
userconf/proc02/pap0826/p0826.htm#contact.
and other proppants pumped into the formation are
left behind—like doorstops—to prop open the new
and enlarged cracks. As flowback continues, the
composition of the fluid carries higher and higher
proportions of hydrocarbons. Within the first few
weeks of flowback, some or most of the fracturing
fluid returns to the surface as wastewater. In North
America, estimates of the volume of flowback vary
between 10 to 75 percent of the fracturing fluid origi-
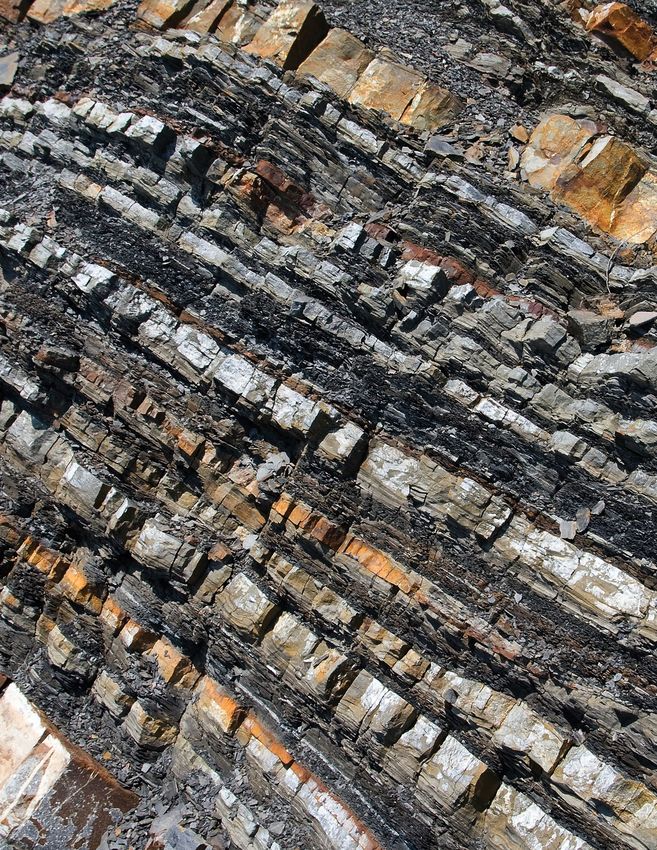
Shale is a fine-grained, fissile sedimentary rock nally injected.19 Because of its chemical content, this
composed primarily of clay and silt-sized particles. wastewater is recycled and treated for reuse, placed
It is the source rock, reservoir, and seal for shale into disposal wells, or treated and discharged into
gas and some tight oil. The shale hydrocarbons surface waters.20 If not managed properly, flowback
considered in this study, referred to as “shale water and other wastewater from hydraulic fractur-
resources,” include: shale gas, natural gas liquids ing operations can cause significant degradation
(NGLs), and tight oil (Box 1). to surface water and groundwater that could pose
serious risks to the ecosystems and communities that
Large shale formations defined by similar geologic depend on them.21
characteristics are often referred to as “shale basins.”
The prospective areas of the shale basin where gas
and oil could potentially be commercially extracted
are commonly referred to as “shale plays.” Shale
has extremely low permeability, equivalent to about
1 percent of an average conventional reservoir,15
18 WRI.orgWater Requirements
The life cycle of shale energy requires water during its
preproduction, production, and use stages,22 as well
as for refining oil to a grade fit for consumption.23 The
largest water withdrawals for shale resource extrac-
tion occur during the drilling and hydraulic fractur-
ing stages. In 2005, water withdrawals for mining
(which includes oil and gas extraction) represented
only 1 percent of U. S. water withdrawals (Figure 2).24
In 2010, water withdrawals for hydraulic fracturing
represented only 0.5 percent of the withdrawals in
Texas.25 However, water withdrawals for drilling and
hydraulic fracturing are unevenly distributed and con-
centrated over areas where shale resources and tight
gas are produced, potentially representing a much
higher fraction of the water withdrawn in the drilling
area.26 Additionally, much of the water required for
Figure 2 | P
ercentage of U.S Water Withdrawals
by Category, 2005
49
hydraulic fracturing is consumptive, thus it does not
all return to the surface or groundwater from which it
was abstracted.
Based on experience in the United States, drilling
31
Withdrawal (percent)
a single well can require between 0.2 million and
2.5 million liters of water and hydraulic fracturing
a well can require between 7 million and 23 mil-
lion liters of water,27 25 percent to 90 percent of
which might be consumptive use.28 The wide range
of values for consumptive water use indicates the
high levels of uncertainty about possible impacts
11
of hydraulic fracturing on freshwater availability.
The water required by a single well can be roughly
4 equal to the water consumed by New York City in 7
2 minutes, or by a 1,000-megawatt coal-fired power
1 1 0.5
plant in 12 hours.29 Drilling and fracturing multiple
Thermoelectric
power
Irrigation
Public supply
Industrial
Aquaculture
Mining
Domestic
Livestock
wells, multiple times, in the same area, can rapidly
escalate local water consumption. Furthermore, in
many areas of the world, the location of shale plays
coincides with areas of low availability and high
demand for water (Box 2), making access to local
Source: J.F. Kenny et al., “Estimated Use of Water in the United States in water resources a challenge for companies extract-
2005,” U.S. Geological Survey Circular 1344, (2009), http://pubs.usgs.gov/ ing shale resources.
fs/2009/3098/pdf/2009-3098.pdf.
Global Shale Gas Development: Water Availability and Business Risks 19BOX 2 | WATER FOR U.S. HYDRAULIC acteristics vary based on the formation geology. The
FRACTURING OPERATIONS IS A SMALL shale play’s depth, thickness, and porosity can also
PERCENTAGE OF TOTAL USE, BUT CAN BE influence water requirements.30
LOCALLY SIGNIFICANT
Many companies use freshwater for drilling and
fracturing, though brackish and recycled water
In the United States, water demands for hydraulic offer significant opportunities to reduce freshwater
fracturing and drilling activities account for only one demands.31 Information on the proportion of brack-
tenth of 1 percent of all U.S. water withdrawals. This ish, recycled, or reused water used as a substitute
demand, however, is concentrated around active shale
plays,a 26 percent of which are in areas with high and for freshwater in the United States is scarce.32 Avail-
extremely high water stress. Thus, although the national able data indicates that in 2011 brackish water use
percentage of water used for fracturing may be low by the oil and gas industry in Texas ranged between
relative to other water demands, the water requirements 0 and 80 percent, and recycled water between 0
for shale resources extraction in specific locations and 20 percent of the total water demand, depend-
can be significant and in competition with other
ing on the location.33 Additionally, although nearly
water uses. For example, in Johnson County, Texas,
water withdrawals for shale gas development in 2008 all fracturing treatments use water, alternatives
were responsible for almost one third of the county’s exist including liquefied petroleum gas and carbon
freshwater use.b In three contiguous counties in Texas’s dioxide fracture treatments.
Eagle Ford shale basin, freshwater demand of hydraulic
fracturing is expected to grow by 2020 to exceed the One of the limitations to recycling and reusing
2008 amount of all other water users combined.c
water is that the amount of flowback returned to the
These examples indicate that shale gas development surface varies between and within plays. However,
in semiarid regions, such as the southwestern United new projects are underway to support increased
States, could have a large impact on local surface and recycling and reuse to reduce freshwater withdraw-
groundwater availability and potentially displace other als and consumption by the oil and gas sector.34
users if the increased demand is not adequately managed.
Aside from drilling and hydraulic fracturing
Sources: (which can occur multiple times in the same well),
a. U.S. Environmental Protection Agency, “Draft Plan to Study the Potential
Impacts of Hydraulic Fracturing on Drinking Water Resources,” (Washington,
very little water is needed to prepare the site or
DC: U.S. Environmental Protection Agency, February 7, 2011). maintain the machinery for the well’s 5- to 40-year
b. Jean-Philippe Nicot and Bridget R. Scanlon, “Water Use for Shale-Gas
estimated lifespan.35
Production in Texas, U.S.,” Environmental Science & Technology 46, no. 6
(March 2012): 3580–86, doi:10.1021/es204602t.
c. Ibid.
Freshwater Availability Risks
Source water availability is a critical consideration
when evaluating the potential for shale develop-
ment. Shale resources are tied to geographic loca-
tions, creating very high location-specific demands
for water that must be met in order to successfully
extract the resource. Yet, fresh and brackish water
The amount of water required to complete a well are natural resources that must be shared among all
varies from well to well and play to play, making users, and that play a critical role in sustaining local
estimates of water demands for shale develop- ecosystems and socioeconomic development in the
ment uncertain for most unexplored plays around areas where shale development takes place.
the world. The variation in water requirements
depends on the geology and the well characteristics. Limited or unpredictable water availability can
For example, the number of horizontal segments jeopardize a project’s financial viability. In areas
hydraulically fractured, as well as the production with high demand relative to the available supply,
type, depth and length of the well, determine the added water withdrawals for drilling and hydraulic
amount of water required. In turn, these well char- fracturing operations can deplete water resources,
degrade the environment, and displace other users.
20 WRI.orgTable 2 | Potential Business Risks Associated with Water Availability
DESCRIPTION BUSINESS IMPACT EXAMPLES
FINANCIAL RISKS
Transportation: Water If not accounted for at the United States: Antero Resources Inc., backed by New York private
transportation costs, which initial stages of the project, equity firms, plans to spend more than half a billion dollars on
can dwarf the purchase price additional costs to transport an 80-mile pipeline that will transport water from the Ohio River
of water, are most often the water can significantly threaten to extract shale gas in West Virginia and Ohio.a The pipeline will
dominant financial risk. profitability. reduce water costs, mostly from trucking, by two-thirds, or around
US$600,000 per well.b This implies that Antero may be spending
around US$900,000 per well for water.
Pricing: High water demand Increased operating cost to United States: During the 2011 drought, oil and gas companies in
and diminishing supplies access alternative sources of parts of Colorado were paying as much as US$1,000 to US$2,000
drive up the price of water. water.c for the same amount of treated water from city pipes that farmers
would pay US$30 for on an average year or US$100 when water
was scarce.d
REPUTATIONAL RISKS
Social and environmental High water stress and other United Kingdom: Protests in the village of Balcombe concerning
concerns: Real or perceived environmental concerns can a host of hydraulic-fracturing-related environmental risks have
concerns over freshwater exacerbate public opposition caused the energy firm Cuadrilla to delay project development for
availability can threaten a to hydraulic fracturing,e months.f
company’s social license to causing a company to lose its
operate. social license to operate and/ South Africa: Shell faced significant social opposition to its plans
or undergo significant project to seek shale gas in South Africa’s semidesert Karoo region. Social
delays and asset downtime. concerns over water availability resulted in projected delays and a
temporary government ban on hydraulic fracturing.
REGULATORY RISKS
Regulatory uncertainty: Concerns over water supply United States: Severe droughts in 2011 caused restrictions and
Concerns over environmental availability can be one of many bans on the use of water for hydraulic fracturing in the Barnett and
degradation, including the reasons that national and Permian basins.h
depletion of water, can cause subnational governments ban or
governments to limit or even place a moratorium on hydraulic Bulgaria: Environmental concerns led Bulgaria to ban hydraulic
prohibit shale development. fracturing,g leading companies fracturing and revoke a shale gas permit granted to Chevron.
to lose their legal license
to operate, and/or undergo France: France banned hydraulic fracturing and canceled
significant project delays and exploration licenses held by companies including Total SA and the
asset downtime. U.S. firm Schuepbach Energy.i
a. Russell Gold, “Energy Firm Makes Costly Fracking Bet - on Water,” Wall Street f. BBC, “Balcombe Protests: Fracking Row Village Sees Fresh Plan,” BBC
Journal, August 2013, Online edition, sec. Business, http://online.wsj.com/ News Sussex, September 4, 2013, http://www.bbc.co.uk/news/uk-england-
article/SB10001424127887323420604578652594214383364.html. sussex-23944344.
b. Ibid. g. Matt Steinglass, “Fracking: Netherlands Moves Closer to Shale Gas
c. Melissa Stark et al., Water and Shale Gas Development: Leveraging the US Exploitation,” Financial Times, August 2013, http://www.ft.com/intl/cms/s/0/
Experience in New Shale Developments (Accenture, 2012), http://www. c20b1e24-0e66-11e3-bfc8-00144feabdc0.html#axzz2eQg9CIST.
accenture.com/SiteCollectionDocuments/PDF/Accenture-Water-And-Shale- h. Mike Lee, “Parched Texans Impose Water-Use Limits for Fracking Gas Wells,”
Gas-Development.pdf. Bloomberg Businessweek, September 2011.
d. Jack Healy, “For Farms in the West, Oil Wells Are Thirsty Rivals,” The New York i. Tara Patel and Gregory Viscusi, “France’s Fracking Ban ‘Absolute’ After Court
Times, September 2012, http://www.nytimes.com/2012/09/06/us/struggle-for- Upholds Law,” Bloomberg News, October 11, 2013, http://www.bloomberg.com/
water-in-colorado-with-rise-in-fracking.html?pagewanted=all&_r=2&. news/2013-10-11/fracking-ban-upheld-by-french-court-as-constitutional.html.
e. Alec Tang and Kristina Ringwood, “Water Sustainability Risk Assessments:
Lessons from Water Sensitive Industries,” in Offshore Technology Conference
(Houston, Texas, USA: Offshore Technology Conference, 2013), 1–6,
https://www.onepetro.org/conference-paper/OTC-23903-MS.
Global Shale Gas Development: Water Availability and Business Risks 21These externalities can translate into business risks
for companies developing shale resources, includ- Source water
ing: financial risks, reputational risks, and regula-
tory risks (Table 2). availability is a critical
These risks can translate into business disruptions
consideration when
and impact company profitability, as well as short-
and long-term investments in shale development,
evaluating the potential
particularly in arid regions such as those in China’s
Tarim basin and South Africa’s Karoo basin.
for shale development.
The technology exists to procure, treat, and
Shale resources are
transport water for nearly any shale development
operation. The question is: Has the cost of the tech-
tied to geographic
nology, as well as the social, environmental, and
regulatory implications, been adequately addressed
locations, creating very
in the early stages of the investment and decision- high location-specific
making process? Governments and companies need
to answer this question, in part, by assessing source demands for water that
water availability and the associated risks early on.
Furthermore, adequate water management policies, must be met in order to
plans, and strategies must be in place to allow for
long-term sustainable use of local water resources successfully extract
by all sectors, as well as by the environment.
the resource.
22 WRI.orgGlobal Shale Gas Development: Water Availability and Business Risks 23
ASSESSING
FRESHWATER
AVAILABILITY AND
BUSINESS RISK
Companies selecting freshwater to supply shale development
projects need to evaluate and understand the availability of local
and regional freshwater sources. In this report WRI uses seven
indicators to assess freshwater availability and business risks
across major shale plays worldwide. The results reveal areas
with potential challenges to accessing water, and highlight the
associated financial, reputational, and regulatory risks to companies
developing shale resources.

                                  Global Shale Gas Development: Water Availability and Business Risks   25
BOX 3 | HOW TO IDENTIFY AND ASSESS freshwater to supply their projects need to evaluate
A WATER SOURCE FOR OIL AND GAS and understand the availability of local and regional
OPERATIONS freshwater. Companies with large portfolios of
assets, as well as investors, need location-specific,
credible, and comprehensive information that can
The global oil and gas industry association for be compared across regions, countries, and basins,
environmental and social issues (IPIECA) recommends
shared publicly, and understood by all stakeholders.
six steps for companies to identify and assess a source
of water for oil and gas operations:
This report offers a set of quantitative indicators and
▪▪ Step 1: Engage stakeholder and regulatory organiza-
tions
maps to help stakeholders evaluate freshwater avail-
ability across major shale plays worldwide. The results
▪▪ Step 2: Understand current and future project water
requirements
reveal areas with potential challenges to accessing
freshwater, and the associated financial, reputational,
▪▪ Step 3: Identify water sources within the project area
and regulatory risks to companies developing those
shale resources. The results also highlight the areas
▪▪ Step 4: Evaluate the status of water quantity and quality
in the area
most in need of effective water governance to ensure
sustainable management and distribution of water
▪▪ Step 5: Assess impacts, risks, and uncertainty resources to meet the needs of communities, the
environment, industry, and agriculture.
▪▪ Step 6: Select the water source
Source: Adapted from IPIECA, Identifying and Assessing Water Sources Methodology
(London: IPIECA, 2014), http://www.ipieca.org/publication/identifying-and-
assessing-water-sources. To create the maps showing areas of high shale
resource potential and low water availability, WRI
overlaid maps of the world’s major shale plays
identified at the time this report was written with
data for seven water-related indicators: baseline
water stress, seasonal variability, drought severity,
groundwater stress, dominant water user, popula-
tion density, and reserve depth interval. The results
provide a comprehensive visual resource and
Companies that develop shale resources need to quantitative database to help evaluate the spatial
access and handle large quantities of water, and thus variation in water availability and the associated
are likely to be significant users and managers of business risks across shale plays.
water at the local and regional levels. As such, they
must identify and select their potential water sources The indicators and locations of shale plays were
within the broader context of local or regional water combined using geospatial tools. The resulting
management considerations.36 IPIECA, the global oil information is displayed in maps and provides
and gas industry association for environmental and coverage for each indicator, across each shale play,
social issues, recommends that in identifying and allowing the results to be aggregated and shared
assessing potential water sources (Box 3), operators at a play, country, region, or global level. In this
work with river basin stakeholders to evaluate the report, all summary results are calculated by area.
quantity and quality available for use, as well as the For example, a result that shows 38 percent of shale
associated impacts, risks, and uncertainties before resources are located in areas that are arid or under
selecting their water sources. high to extremely high levels of water stress means
that 38 percent of the global shale play area, not 38
Regulatory frameworks, freshwater constraints, and percent of the global technically recoverable shale
the economics of water treatment will determine resource volume, is under high or extremely high
the extent to which brackish water and wastewater levels of water stress.
are feasible substitutes for freshwater for hydraulic
fracturing.37 In the meantime, companies selecting
26 WRI.orgThis report summarizes the results at a global level, tions by the U.S. Energy Information Administra-
as well as by shale play for 11 countries. Countries tion, Journal of Petroleum Technology, China
were selected based on the size of their techni- University of Geosciences, Oil and Gas Journal,
cally recoverable shale resources, according to the national and subnational geological surveys, and
U.S. Energy Information Administration, current other academic, industry, and governmental
exploratory and production activity, likelihood of sources. The geo-database includes a number of
future development, and feedback from industry, attributes for each shale formation, including the
academia, and NGO experts. Countries include basin and play name, geologic age, depth interval,
Algeria, Argentina, Australia, Canada, China, reservoir pressure, thermal maturity, oil and gas in
Mexico, Poland, Saudi Arabia, South Africa, United place, and data source, among others. It is avail-
Kingdom, and the United States (Appendix A). able online (https://edx.netl.doe.gov/dataset/
All results and underlying data are available for unconventional-resources-atlas).
download from the project website (http://www.
wri.org/resources/maps/water-for-shale) and will The geo-database is not an all-inclusive collection
be updated as new data are available. of unconventional onshore formations, but rather a
collection of general information on the location of
shale basins and plays publicly available at the time
Geo-Database of Shale Basins and Plays of the analysis.
The West Virginia Geographic Information Sys-
tems Technical Center (WVGISTC) and West
Virginia University (WVU), in collaboration with Water Availability
the National Energy Technology Laboratory and and Business Risk Indicators
WRI, compiled a digital GIS geometry and attribute Seven indicators are used in this assessment (Table
geo-database of major onshore shale formations 3). Five were obtained from WRI’s Aqueduct Water
targeted for unconventional development of gas and Risk Atlas, a global database of publicly available
liquid hydrocarbon resources.38 The compilation water risk indicators and maps. The Aqueduct
excludes offshore shale formations. Water Risk Atlas leverages publicly available data,
to provide robust and science-based information for
The geo-database consists of 228 shale basins and decision makers. The data can be compared glob-
339 shale plays in the public domain in publica- ally across political and hydrological boundaries.
Global Shale Gas Development: Water Availability and Business Risks 27This global coverage enables users to consistently One indicator, population density, was obtained
evaluate exposure to water-related risks across a from Columbia University and Centro Internacional
portfolio of current or prospective assets, suppliers, de Agricultura Tropical. The seventh indicator,
commodities, or investments. Because of this, the the depth interval of the shale formation, was
Aqueduct Water Risk Atlas is not designed to char- obtained from WVGISTC. The depth of the shale
acterize water risks at any particular location; many formation has an impact on water requirements
of the local legal, social, and structural complexities because deeper formations require more water for
associated with managing water are not included drilling.40 All indicators were selected based on
in global models. Instead, the Aqueduct Water Risk their relevance for shale exploration and production
Atlas helps provide the context necessary to under- and feedback from industry, academic, and NGO
stand water-related risks at a portfolio-level, which, experts. Indicators make use of the most up-to-date
combined with local information and a deep under- and high resolution global datasets available in the
standing of a company’s management practices, public domain. The definitions, calculations, data
can help evaluate company risks. All indicators in sources, and scoring methodology are documented
the Aqueduct Water Risk Atlas were developed and and publicly available for download from the cited
published by WRI in 2013, in consultation with an sources and available on the project website.
external advisory group of experts from industry,
academia, government and NGOs.39
Table 3 | Indicators and Business Risks
INDICATOR LEGEND BUSINESS RISKS
Baseline water stress Low (80%)
Shiao, “Aqueduct Global Maps 2.0,” Working Paper,
(World Resources Institute, Washington, DC, 2013), Arid & low water use
available at http://www.wri.org/publication/aqueduct- No data
metadata-global.
Seasonal variability Low (1.33) additional transportation and storage,
“Aqueduct Global Maps 2.0,” Working Paper
(World Resources Institute, Washington, DC, 2013), available Arid & low water use and unanticipated changes in pricing or
at http://www.wri.org/publication/aqueduct-metadata-global. regulatory requirements.
No data
Drought severity Low (50)
Multi-Model, Multi-Scenario, IPCC AR4 Simulations,”
Climate Dynamics 31 (2008): 79–105; http://link.springer. Arid & low water use
com/article/10.1007/s00382-007-0340-z No data
28 WRI.orgTable 3 | Indicators and Business Risks (cont.)
INDICATOR LEGEND BUSINESS RISKS
Groundwater stress Low (20) supplies are often particularly important
Source: T. Gleeson, Y. Wada, M.F. Bierkens, and L.P. van
Beek, “Water Balance of Global Aquifers Revealed by Arid & low water use in developing shale resources because
Groundwater Footprint,” Nature 488, no. 7410 (2012): of their close proximity to wells and the
No data
197–200, doi: 10.1038/nature11295. potential for contamination.
Dominant water user Understanding the major water user
The sector (agricultural, municipal or industrial) with the Domestic within a play area helps (a) determine
largest annual water withdrawals. the largest sector competitor for water,
Source: F. Gassert, M. Landis, M. Luck, P. Reig, and T. and (b) predict the type of conflicts that
Shiao. “Aqueduct Global Maps 2.0.” Working Paper. may arise. For example, in some regions,
Agricultural agricultural water users have strong
World Resources Institute, Washington DC., 2013),
available at http://www.wri.org/publication/aqueduct- traditional, political, and social influence.
metadata-global.
Industrial
Population density Areas of high population density pose
The average number of people per square kilometer. complex barriers to shale development;
Source: CIESIN and CIAT, “Gridded Population of the Population such as logistical, environmental, and
World Version 3 (GPWv3): Population Count Grid,” Future Density 0.4 social challenges to accessing water.
Estimates, Palisades, NY: NASA Socioeconomic Data and (people/sqkm) High population density often indicates
Applications Center (SEDAC), 2005, available at http:// high competition for water and significant
dx.doi.org/10.7927/H4ST7MRB. regulatory and reputational risks.
Reserve depth interval The range of depths of the prospective
1,006
The range of depths (in meters) of the prospective shale area. shale area indicates if more or
The black line indicates the global average depth in meters. less water will be required. Deeper
Source: West Virginia University and The National formations generally require more
Energy Technology Laboratory. “Atlas of Unconventional water for drilling.
Hydrocarbon Resources.” 2014, available at https://edx.
netl.doe.gov/dataset/unconventional-resources-atlas. 5,029
Global Shale Gas Development: Water Availability and Business Risks 29You can also read