Supporting Rural Communities in West Dunbartonshire, Stirling and Clackmannanshire A Rural Development Strategy for the Forth Valley and Lomond ...
←
→
Page content transcription
If your browser does not render page correctly, please read the page content below
Supporting Rural Communities in West
    Dunbartonshire, Stirling and
          Clackmannanshire

 A Rural Development Strategy for the
Forth Valley and Lomond LEADER area
               2015-2020
Contents
Page
1. Introduction 3
2. Area covered by FVL 8
3. Summary of the economies of the FVL area 31
4. Strategic context for the FVL LDS 34
5. Strategic Review of 2007-2013 42
6. SWOT 44
7. Link to SOAs and CPPs 49
8. Strategic Objectives 53
9. Co-operation 60
10. Community & Stakeholder Engagement 65
11. Coherence with other sources of funding 70
Appendix 1: List of datazones
Appendix 2: Community owned and managed assets
Appendix 3: Relevant Strategies and Research
Appendix 4: List of Community Action Plans
Appendix 5: Forecasting strategic projects of the communities in Loch
Lomond & the Trosachs National Park
Appendix 6: Key findings from mid-term review of FVL LEADER
(2007-2013) Programme
Appendix 7: LLTNPA Strategic Themes/Priorities
Refer also to ‘Celebrating 100 Projects’ FVL LEADER 2007-2013 Brochure.
21. Introduction
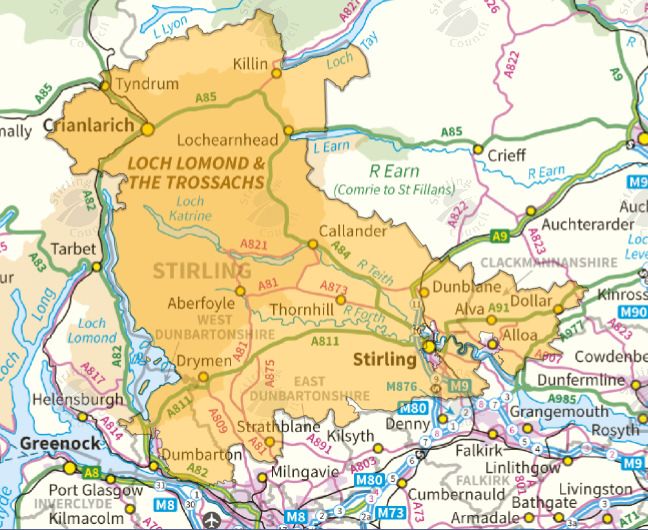
The Forth Valley and Lomond LEADER area encompasses the rural areas of Stirling,
Clackmannanshire and West Dunbartonshire. The area crosses three local authority areas,
two Scottish Enterprise regions, two Forestry Commission areas, two Rural Payments and
Inspections Divisions, one National Park and one VisitScotland Region. An area criss-crossed
with administrative boundaries, the geography crosses these boundaries, with the area
stretching from the spectacular Highland mountain scenery around Crianlarich and Tyndrum,
across the Highland boundary fault line, with its forests and lochs, down to the more rolling
hills of the Ochils, Campsies and the Kilpatrick Hills until it meets the fringes of the
urbanised central belt of Clydebank, Stirling and Alloa.
© Crown Copyright and database right 2014. All rights reserved. Ordnance Survey Licence number 100020780 [Stirling Council]
3The Forth Valley and Lomond area has a history of working together and has had three
LEADER programmes previously, the first being very small and centred on rural Stirling, the
second expanding to include part of West Dunbartonshire, and the third expanded again to
include Clackmannanshire and Falkirk. This current proposed area shifts west slightly to
include all of rural West Dunbartonshire, with Falkirk joining a newly expanded Kelvin Local
Action Group to the south and east of our area. Having planted the LEADER acorns in rural
Falkirk, we look forward to seeing those acorns grow and working with the new Kelvin
Valley and Falkirk LAG on some joint co-operation activity in our new programme.
The area also includes a large part of the Loch Lomond and the Trossachs National Park, the
largest of our strategic landscape assets, where tourism and micro businesses have become the
main economic drivers, attracting large numbers of visitors particularly during the peak
tourism seasons. Our other strategic landscape assets include the Ochils, the Kilpatricks,
Highland Perthshire and the Inner Forth which have yet to fully realise their economic and
recreation opportunities but are equally loved by the communities around them, keen to
explore this potential further.
This rural development strategy outlines the proposed strategic priorities and themes for the
area for the purpose of a new LEADER Programme for the 2014-2020 period, although the
stakeholder group which has produced this strategy welcomes the Scottish Government’s
encouragement to develop our strategy to be wider than just for LEADER funding purposes,
to show complementarity particularly with other EU funds, but also to demonstrate need for
other funding sources in our area.
The strategy is based on the identified socio-economic needs of the area, the priorities of our
respective partners’ strategies and the evidenced needs and aspirations of our communities.
Consultation and involvement of our communities have been key in the development of the
strategy, starting early in 2012 and led initially by the previous Local Action Group (LAG)
but soon expanded to include wider stakeholders and community networks not already
represented on the LAG. This consultation and involvement will continue during the
implementation stage of the strategy.
On behalf of the stakeholders listed below, we present to you our Rural Development Strategy
for the Forth Valley and Lomond LEADER area.
List of stakeholders
Business Gateway – STEP, CETERIS and West Dunbartonshire Council
Central Scotland Green Network Trust (was CSFT)
Clackmannanshire Alliance
Clackmannanshire Council
Clackmannanshire Third Sector Interface
Community Groups across rural Forth Valley and Lomond
Forestry Commission Scotland
Forth Environment Link
LANTRA
Loch Lomond and the Trossachs National Park Authority
Loch Lomond and the Trossachs National Park Community Partnership
National Farmers Union for Scotland
Ochils Landscape Partnership
4Rural Stirling Housing Association
Scottish Enterprise
Scottish Land and Estates
Scottish Natural Heritage
Stirling Community Planning Partnership
Stirling Council
Stirlingshire Voluntary Enterprise
VisitScotland
West Dunbartonshire Community Planning Partnership
West Dunbartonshire Council
West Dunbartonshire CVS
Lead Partner
We are particularly grateful to Stirling Council who has agreed to continue as lead partner and
accountable body for the purpose of administering the LEADER funding and hosting the
LEADER support team staff.
30 September 2014
5Summary of Strategic Objectives
Please refer to section 8 for more detail on the objectives, the measurable interventions and
expected outcomes.
Theme:
“Supporting local rural communities in West Dunbartonshire, Stirling and Clackmannanshire
to become more sustainable – economically, socially and environmentally.”
Strategic Objectives:
1. Strengthen the Rural Economy of Forth Valley and Lomond (SE)
2. Support the Communities of Forth Valley and Lomond Area to Become More
Sustainable (SC)
3. Support the Communities of the Forth Valley and Lomond Area to Become More
Resilient (RC)
4. Increase the Understanding of, and Access to, the Natural and Cultural Heritage
Environment in the Forth Valley and Lomond Area (NCH)
5. Realise the Economic and Community Potential of the Strategic Landscape Assets in
the Forth Valley and Lomond Area (SLA)
We will strengthen our rural economy by:
SE1 Supporting businesses in our priority sectors
SE2 Supporting joint community and/or business initiatives and joint marketing and
promotion initiatives related to the business sectors listed
SE3 Improving business services and infrastructure (broadband infrastructure, broadband
take-up and other ICT advances, access to shared services and equipment, business space)
SE4 Improving quality of available skills and other labour market supply issues
(complementing other EU funds available for training)
We will build more sustainable communities by:
SC1 Addressing outmigration from the area
SC2 Supporting employment opportunities for all
SC3 Encouraging the transfer of skills and expertise between different age groups
SC4 Encouraging the community ownership and management of assets (built or natural) for
the purpose of securing an essential service for the community
6SC5 Supporting communities to work co-operatively, including pooling resources and
skills, between communities and within communities
We will build more resilient communities by:
RC1 Supporting communities and local businesses to withstand fluctuations in the wider
economy which could impact on jobs, visitor numbers, visitor spend, higher transport costs,
heating costs
RC2 Supporting communities to become less dependent on non-renewable fuel sources
RC3 Supporting the development of cycling through targeted interventions that empower
and encourage cycling and through the development of safe, strategic access routes within and
between our communities.
RC4 Supporting communities and businesses to live with a changing (wetter) climate
We will increase the understanding of, and access to, our natural and cultural heritage
environment by:
NCH1 Improving access, facilities, management and interpretation of the environment
NCH2 Making links between communities, businesses, land managers and the natural
environment
NCH3 Supporting communities to instigate and manage environmental and heritage
projects which increase the visitor appeal of the area
We will realise the economic and community potential of our strategic landscape assets by:
SLA1 Supporting communities and businesses to develop projects across boundaries that
link with the strategic landscape assets of the area ( Loch Lomond and the Trossachs National
Park, the Ochils, the Kilpatrick Hills, Highland Perthshire and the River Forth)
72. Area covered by the Forth Valley and Lomond Strategy
2.1 Introduction
As stated in the Introduction, the area encompasses the rural areas of Stirling,
Clackmannanshire and West Dunbartonshire and is characterised by diverse geographical
features. The area stretches from the Highland mountain scenery around Crianlarich and
Tyndrum, down to the fringes of the urbanised central belt of Clydebank, Glasgow, Stirling
and Alloa, where the legacy of former industry and coal mining is still evident today. The
area also includes a large part of the Loch Lomond and the Trossachs National Park, where
tourism and micro businesses have become the main economic drivers, with large numbers of
visitors attracted to the many lochs, forested areas and mountains.
The area is similar to the previous Forth Valley and Lomond LEADER area although now
includes some additional datazones. Rural Falkirk will be joining with our neighbouring
Kelvin Valley LEADER area so will no longer be part of the Forth Valley and Lomond
LEADER area. As a result of discussions with communities and our stakeholders, the
Kilpatrick Hills and the villages of Milton and Bowling have now been included. A request
by the Community Council for Sauchie to be included was discussed by our stakeholder
group and its inclusion was agreed. A similar request was made by Bannockburn Community
Council resulting in Bannockburn now being included also.These changes to Forth Valley and
Lomond’s boundary have resulted in an overall decrease in population from 128,733 at the
start of the last LEADER programme to 110,953 at the start of this one (taken from most
recent census data).
Through the restructuring of the boundaries, the population has reduced by 17,780 but the
area, with the inclusion of the Kilpatrick Hills, has reduced by only around 100km² from over
2,600 km² in size to a little over 2,500km². Although the area has a varied geography, there
are unifying features such as larger settlements often being located on the edge of vast
expanses of open areas of land with visitor appeal, such as Clackmannanshire’s Hillfoot
villages at the base of the Ochils, Stirling as a gateway to the Loch Lomond and Trossachs
National Park and Alexandria and Balloch being at the edge of both the National Park and the
Kilpatricks. However, it is the socio-economic, demographic, and heritage of the area that is
possibly the most unifying characteristic. Across the Forth Valley and Lomond area, the
people and communities have broadly similar strengths and weaknesses, and face similar
challenges and opportunities, and most importantly are keen to share experiences and learn
from each other. These strengths, weaknesses, opportunities and threats were recorded over
the course of a number of community engagement events and are included in this strategy in
section 6.
A list of datazones included can be found in Appendix 1.
82.2 Key Settlements
Within Stirling Council area and the Loch Lomond and The Trossachs National Park:
Settlement Population
Aberfoyle 769
Balquhidder Glen 123
Callander 3,077
Crianlarich and surrounding area 258
Drymen 820
Gartmore and Cobleland 254
Killin 765
Kinlochard 65
Lochearnhead 144
Tyndrum 144
Within Stirling Council area but outwith the Loch Lomond & The Trossachs National
Park:
Settlement Population
Ardeonaig 81
Ashfield 101
Balfron 1,890
Bannockburn 6,769
Blanefield 602
Bridge of Allan 4,930
Buchlyvie 519
Cambusbarron 2,551
Cowie 2,649
Doune 1,633
Dunblane 8,811
Fallin 2,832
Fintry 446
Gargunnock 752
Killearn 1,701
Kippen 1,026
Plean 2,027
Strathblane 1,362
Thornhill 513
Within West Dunbartonshire Council area and within the Loch Lomond and the
Trossachs National Park:
Settlement Population
Alexandria* 4,571
Balloch, Haldane and Jamestown* 6,178
Gartocharn 275
9*these settlements straddle the National Park boundary
Within West Dunbartonshire Council area and outwith the Loch Lomond and the
Trossachs National Park:
Settlement Population
Bowling 429
Milton 506
Within Clackmannanshire Council area:
Settlement Population
Alva 4,773
Clackmannan 3,442
Coalsnaughton 848
Dollar 2,717
Fishcross 432
Forest Mill 185
Kennet 87
Menstrie 2,804
Muckhart 384
Sauchie 4271
Tillicoultry 5,120
Tullibody and Cambus 8,809
Table 1. Source: Census 2011.
102.3 Social Characteristics
2.3.1 Population
There have been some significant social changes in our area over the last 7 years since the
previous LEADER programme started. However, the population of this area has increased
only very slightly from 109,029 in 2007 to 110,953 with small increases in Clackmannanshire
and Stirling and a marginal drop in population in West Dunbartonshire as shown in Table 2
below. Rural Stirling remains the largest of our local authority areas.
Population of FVL LEADER area broken down into Local
Authority
70000
60000
50000
40000
2007
2011
30000
20000
10000
0
Clackmannanshire Stirling West Dunbartonshire
2007 35399 58207 15423
2011 36214 59344 15395
Table 2. Source: NOMIS (produced by Office for National Statistics) Feb 2014
While overall population levels across the area have remained relatively static, there has been
substantial change within the age demographic of the population of the area. The table below
shows that our area is characterised by a high number of 10 – 15 year olds (ie school age
population), followed by a drop in number of 15 -20 year olds, stabilising for 20 – 24 year
olds (in 2011 we actually see an increase in this age group), followed by a sharp drop in 25 –
35 year olds. The age profile then gradually increases with the 40 – 50 range being our
largest age group. Then follows a gradual decline in age profile, with the 2011 census figures
confirming a pattern with more older people in 2011 than in 2007.
11Change in population over FVL area according to
age
10000
9000
8000
7000
6000 2007
5000
4000 2011
3000
2000
1000
0
-4
5
4
4
4
4
4
4
4
-1
-2
-3
-4
-5
-6
-7
-8
0
10
20
30
40
50
60
70
80
Figure 1. Source: NOMIS
As shown in Figure 1 the age demographic of the Forth Valley and Lomond LEADER area is that
there are a lot of school age young people but there are far fewer young working age people in their
20s and early 30s. There are also many more people in their 40s and 50s than early 20s. This is a
trend that has continued since 2007 and is common to all local authority areas in the FVL LEADER
area and so is not solely due to the student population from the University of Stirling. There is also
a notable spike in number of 20 – 24 years olds that is also common across the local authorities.
Population by percentage of age groups
compared to Scotland
9.00%
8.00%
7.00%
6.00%
5.00%
4.00%
3.00%
2.00%
1.00%
0.00%
85+
0-4
5-9
10 - 15
16 - 19
20 - 24
25 - 29
30 - 34
35 - 39
40 - 44
45 - 49
50 - 54
55 - 59
60 - 64
65 - 69
70 - 74
75 - 79
80 - 84
FVL 2007 FVL 2011 Scotland 2011
Figure 2. Source: NOMIS – Office for National Statistics
12Figure 2 shows that the spike in 20-24 year olds was common to Scotland although not quite so
pronounced as Scotland does not suffer such an extreme loss of 25-34 year olds as the FVL
LEADER area. Scotland as a whole does not experience the increase in 10-15 year olds that the
FVL LEADER area does and the FVL area also has a higher proportion of older people from the
age grouping of 50-54 to 75-79, after which Scotland contains a higher proportion of 80+ year olds.
How does this inform FVL strategic objectives?
• Young adults are leaving the area.
• There is a growing number of older people in FVL area.
• There is a marked increase in number of 20-24 year old compared to
2007, but an equally marked ‘loss’ of 25 – 35 year olds.
• The FVL area has a striking increase in 10-15 year olds, which is not
matched by Scotland’s average and an equally striking decrease in
25-34 year olds, which is also not matched by Scotland’s average.
• The area has more 45 –50 year olds than any other age group.
Relevant to strategic objectives: SE4, SC1, SC2, SC3
2.3.2 Scottish Index of Multiple Deprivation
The Scottish Index of Multiple Deprivation (SIMD) identifies small area concentrations of multiple
deprivation across all of Scotland in a consistent way. It does this by providing statistical
information at a datazone level. Each datazone is made up of between 750-1,000 people. The
SIMD provides a ranking for each of the 6,505 datazones that make up the whole of Scotland from
most deprived (1) to least deprived (6,505). It is important to note, therefore, that any change in
datazone ranking is relative to all other datazones. It is also important to note that there are issues
in using datazone level statistics to describe rural areas because in a rural area 1,000 people could
cover a number of very different settlements and can ‘hide’ pockets of deprivation. For the
purposes of this strategy we are using this datazone data as an indicator of trends and issues, and
using our community consultation and review of strategies to confirm the detail. A full list of the
FVL datazones can be found in Appendix 1.
Looking at the Index of Multiple Deprivation we can see some key changes in deprivation
indicators across the FVL LEADER area. The current income indicator is based primarily on
number of adults receiving benefits such as Jobseeker’s Allowance, Income Support and Guarantee
Pension Credits. Figure 3 below shows how many datazones in the FVL area were in the category
of the three most income deprived deciles in 2006, 2009 and 2012 as a percentage of the number of
datazones in the FVL area. The table shows an increase in the number of datazones in the FVL area
being classified in the most deprived 10% with the number of datazones classified as between the
10% and 20% most deprived decreasing marginally and the number of datazones classified in the
most deprived 20% to 30% as reducing significantly.
13Percentage of datazones in FVL area in three most
deprived deciles for the current income domain
12
10
8
Percentage
2006
6 2009
2012
4
2
0
Most deprived 10% Most deprived 10 - Most deprived 20-
20% 30%
Figure 3. Source: NOMIS
How does this inform FVL strategic objectives?
• Percentage of datazones containing Scotland’s 10%
most benefit dependent households has increased
between 2006 and 2012.
Relevant to strategic objectives: SC2, RC1
Another key group of indicators that help to show the sustainability and resilience of the
communities in the FVL area are the employment indicators. These are primarily based on
unemployment counts and number of people claiming Incapacity Benefit or Severe Disablement
Allowance. Figure 4 shows that there has been a slight increase in the number of datazones in the
most employment deprived 10% (with the highest number of people out of work) with the number
in the most deprived 10% to 20% staying the same and the number in the most deprived 20% to
30% increasing slightly between 2006 and 2012.
14Percentage of datazones in FVL area in three most
deprived deciles for the employment domain
12
10
Percentage
8
2006
6 2009
2012
4
2
0
Most deprived 10% Most deprived 10 - Most deprived 20-
20% 30%
Figure 4. Source: NOMIS.
How does this inform FVL strategic objectives?
• Employment and jobs in the FVL area are not increasing
as fast as the rest of Scotland
Relevant to strategic objectives: SE1, SE2, SE3, SE4, SC2, RC1
One of the indicators in the Scottish Index of Multiple Deprivation relates specifically to rurality
and how accessible local services are to the population within each datazone. This rank is based on
a combination of factors such as drive-times to services like the GP, the Post Office, the school and
the nearest retail centre and the public transport times to the same facilities.
15Percentage of datazones in FVL area in the most
deprived three deciles for the geographic access to
services domain
25
20
Percentage
15 2006
2009
10 2012
5
0
Most deprived 10% Most deprived 10 - Most deprived 20-
20% 30%
Figure 5. Source: NOMIS.
How does this inform FVL strategic objectives?
• In 2012 almost 15% of all datazones in the FVL area are
in Scotland's 'remote from services' most deprived 10%
• Between 2006 and 2012, relative to the rest of Scotland,
the proportion of datazones most deprived by
geographical access to services increased.
Relevant to strategic objectives: SC1, SC4, SC5, RC1, RC3
2.3.3 Community Empowerment
The ability of communities to take on and develop assets of their own is a key indicator of an
ambitious and dynamic community. The Development Trust Association of Scotland researched
the scale and depth of community ownership assets in Scotland in 20121 and we have taken the
basis of this data and added to it with local research. The table below shows the number of key
community owned assets that we’ve been able to find out about through consultation in the FVL
LEADER area broken down into respective local authorities while the detail on each community
asset is contained in Appendix 2.
Number of key assets in community ownership or managed by community
groups by local authority area
No. of Community Owned No. of Community
Assets Managed Assets
Clackmannanshire 2 2
Stirling 20 4
West Dunbartonshire 3 3
1
http://www.dtascommunityownership.org.uk/content/publications/community-ownership-in-scotland-a-baseline-study
16Table 3. Source: FVL Local Research
Appendix 2 shows that there are pockets of activity where dynamic groups with ambition have
succeeded in taking on assets. It also shows that the most common asset type is community
woodland (where the asset is land) and village hall (where the asset is a building). There are some
examples of a more unusual type of asset such as a wind turbine, leisure centre and a paddle
steamer but these are a minority. The table also shows that managing without taking on ownership
is a popular form of community empowerment. Through discussions with local groups and
stakeholders we are also aware of a number of groups looking to take on community assets
including at least two new community renewables projects.
How does this inform FVL strategic objectives?
• Currently low numbers of community owned assets in the
FVL area, particularly in Clackmannanshire and West
Dunbartonshire.
• FVL community interest and ambition to take on more
community assets.
Relevant to strategic objectives: SC4, SC5, NCH1, NCH2, NCH3
2.4 Economic Characteristics
2.4.1 Industrial Profile
The FVL area relies on a broad base of industries without any single industry dominating.
Number of employees in industry sector throughout FVL LEADER area
(rounded to nearest 100)
Broad Industrial Groups Total %age of total
Agriculture, forestry and fishing 200 0.7%
Mining, quarrying and utilities 400 1.4%
Manufacturing 3,200 11%
Construction 1,200 4.1%
Motor trades 500 1.7%
Wholesale 1,100 3.8%
Retail 2,300 7.9%
Transport and storage (inc postal) 900 3.1%
Accommodation and food services 3,200 11%
Information and communication 300 1%
Financial and insurance 2,400 8.2%
Property 300 1%
Professional, scientific and technical 1,600 5.5%
Business, administration and support services 1,100 3.4%
Public administration and defence 1,000 3.4%
Education 4,400 15.1%
Health 3,700 12.7%
Arts, entertainment, recreation and other services 1,400 4.8%
Table 4. Source: Business register and employment survey
ONS Crown Copyright Reserved [from Nomis on 26 February 2014]
Analysis : standard 17
Date : 2012
Employment status: Employees www.nomisweb.co.ukWhile no single industry sector dominates employment in the FVL area, Public Administration and
Defence, Education and Health account for 31.2% of employment across the area, which is
primarily the public sector. There is a dependence of people in the FVL area on the public sector
for jobs. This compares to 11% for Accommodation and Services (part of the local visitor
economy) and 11% for manufacturing. Considering the savings anticipated over the next 5 years
from all 3 local authorities in the FVL LEADER area (Clackmannanshire - £25m2, Stirling - £29m3,
West Dunbartonshire - £10.5m [over three
years ]4 and an expected reduction in NHS Forth Valley expenditure of £10m per annum5, there is a
likelihood that these sectors will shrink and, unless other industries grow, or self-employment
grows, then employment will decrease further.
Number of employees in industry sector throughout FVL LEADER area
according to enterprise size (rounded to nearest 100)
By enterprise size (inc
owner/proprietor)
Micro Small Medium Large
Broad Industrial Groups 0-9 10-49 50-249 250+
Agriculture, forestry and fishing 100 100 100 0
Mining, quarrying and utilities 100 100 200 0
Manufacturing 300 800 1,600 600
Construction 900 500 100 0
Motor trades 200 200 200 0
Wholesale 300 600 300 0
Retail 1,000 900 600 0
Transport and storage (inc postal) 300 400 300 0
Accommodation and food services 800 2,000 700 0
Information and communication 300 0 0 0
Financial and insurance 100 0 100 2,200
Property 200 100 0 0
Professional, scientific and technical 1,000 300 400 0
Business, administration and support 400 600 200 0
services
Public administration and defence 100 200 300 400
Education 200 1,200 1,200 1,800
Health 400 1,300 1,300 800
Arts, entertainment, recreation and other 600 600 400 0
services
Percentage of total 23.5% 31.9% 25.8% 18.7%
Table 5. Source: Business register and employment survey
ONS Crown Copyright Reserved [from Nomis on 26 February 2014]
Analysis : standard
Date : 2012
Employment status: Employees www.nomisweb.co.uk
2
http://www.bbc.co.uk/news/uk-scotland-tayside-central-25399693
3
http://www.stirling.gov.uk/services/council-and-government/workingtogether
4
http://www.west-dunbarton.gov.uk/media/2194377/talk_winter_2013.pdf
5
http://nhsforthvalley.com/wp-content/uploads/2014/01/NHS-Forth-Valley-Integrated-Healthcare-Strategy-2011-
2014.pdf. p10.
18This shows there are few businesses in the FVL area employing large numbers of staff. At present
the most striking is the public sector and financial and insurance companies. The majority of
people (55.4% of total) in the FVL area employed in micro and small industries across all industries
(noting that all the employees in the information and communications sector are micro enterprises,
and most of the financial and insurance employees work for large enterprises).
How does this inform FVL strategic objectives?
• Large number of people employed in the public sector.
• Likely shrinkage in public sector could lead to greater
unemployment unless the private and third sectors grow
enough to accommodate.
• Micro and small businesses employ the majority of
people living in our rural area.
Relevant to strategic objectives: SE1, SE2, SE3, SE4, SC2, RC1
Over time there has been little change in the number of businesses as the table below shows:
Number of businesses in the FVL area broken down to enterprise size over time
(rounded to nearest 5)
Micro Small Medium Large
Total
0-9 10-49 50-249 250+
2011 3,145 265 40 10 3,465
2012 3,655 320 45 15 4,030
2013 3,560 360 35 15 3,980
Table 6. Source: NOMIS.
The above table shows that the FVL area is dominated by micro businesses and that there has been
a small increase in the number of businesses since 2011. Data for this is not available prior to 2011
so it is difficult to draw strong conclusions but the information can be used as baseline data, which
will be reported upon at the end of the LEADER 2015-2020 Programme.
Looking at the types of industry represented in the FVL LEADER area is a useful way of profiling
the labour market of the area but these tables do not give a picture of the area in terms of those not
in employment
2.4.2 Unemployment
The tables below contain figures covering the FVL area broken into the three separate local
authorities.
Unemployment numbers and rates based on claimants of Job Seekers
Allowance in January of each year for the Forth Valley and Lomond area
broken into individual local authorities with Scotland’s unemployment rate
Date Clackmannanshire Stirling West Scotland
Dunbartonshire
Number Rate Number Rate Number Rate Rate
2011 1,247 5.7% 1075 3.11% 435 5.41% 5%
2012 1,165 5.3% 1006 3.07% 429 5.24% 5.3%
2013 1,074 4.85% 927 2.68% 454 5.47% 5%
2014 911 Not 755 Not 391 Not 3.9%
available available available
19Table 7. Source: Scottish Neighbourhood Statistics (www.sns.gov.uk)
Taking the unemployment rate from the number of people claiming Job Seeker’s Allowance means
that those unemployed who are not claiming Job Seeker’s Allowance are not included, so with that
caveat the table shows that unemployment has been decreasing steadily since 2011. The table also
shows that rural Clackmannanshire and rural West Dunbartonshire have had unemployment rates
above the national average almost continually while rural Stirling has been well below.
An aspect of unemployment that has been raised during our consultations is a perception of the
seasonality of employment.
5 year timeline of unemployment broken into local authorities
1400
1200
1000
800
600
400
200
0
Jan-09
Apr-09
Jul-09
Oct-09
Jan-10
Apr-10
Jul-10
Oct-10
Jan-11
Apr-11
Jul-11
Oct-11
Jan-12
Apr-12
Jul-12
Oct-12
Jan-13
Apr-13
Jul-13
Oct-13
Clackmannanshire Stirling West Dunbartonshire
Figure 6. Source: Scottish Neighbourhood Statistics (www.sns.gov.uk)
Figure 6 shows that there is a cyclical nature to unemployment in our area, rising over the winter
period in Clackmannanshire and Stirling, although less noticeably in West Dunbartonshire.
2.4.3 Self Employment
There has also been an increase in self-employment numbers over a sustained period of time.
Self-employment percentages for Clackmannanshire and Stirling local
authorities
2007 2008 2009 2010 2011 2012
Clackmannanshire 9.1% 7.7% 9.0% 8.6% 9.1% 12.2%
Stirling 13.2% 13.3% 13.2% 15.6% 14.3% 17.9%
Scotland 10.4% 10.6% 10.6% 10.8% 11.5% 12.2%
Table 8. Source: Clackmannanshire Council
While the percentage of self-employed individuals seems to be increasing in number across both
local authority areas, there is a trend for Stirling to have higher than the national average rates of
20self-employment while Clackmannanshire is below. It is also useful to note the spike in self-
employment between 2011 and 2012 in Clackmannanshire and Stirling of 3.1% and 3.6%
respectively is far more significant than the national spike of only 0.7%.
How does this inform FVL strategic objectives?
• Unemployment is decreasing, but at a lower rate than the
rest of Scotland
• The proportion of people in self-employment is also
increasing
• Employment follows a seasonal trend over much of the
FVL area
Relevant to strategic objectives: SE1, SE2, SE3, SE4, SC2, RC1,
2.4.4 Tourism Businesses
Tourism is an important business sector for the FVL area. Rural Stirling contains 554 tourism
businesses, which works out as 39.6% of the total number of businesses operating in the area. They
include a variety of different business types but the principle tourism related business in the area is
accommodation with 69% of all tourism businesses being accommodation providers. There is a
prevalence of accommodation businesses and a low number of businesses in entertainment,
recreation and arts, a point recognised in the Stirling Tourism Development Framework which
recommends investment in attractions to improve the area’s visitor experience where these build on
the natural and heritage assets of the area.
Percentage of tourism businesses in industry sector in
rural Stirling
Accommodation
Food and Beverage services
Business Support Service
Activities
Entertainment, Recreation
8%
and the Arts
1%
22%
69%
Figure 7. Source: Stirling Enterprise Economic Development, December 2013
Further breakdowns of each tourism sector are as follows:
21Percentage of accommodation tourism companies
according to accommodation type in rural Stirling
Bed & Breakfast / Guest
13% Houses
Camping and Caravans
7%
2% Hostels
Hotels
59%
18%
Other accommodation
1%
Self Catering & Cabins
Figure 8. Source: Stirling Enterprise Economic Development, December
2013
There are 223 self-catering and cabin businesses in rural Stirling, which works out as 40% of the
total number of tourism businesses. In contrast, there are only 9 hostels in the area. FVL LEADER
supported a youth organisation to develop a hostel in Callander at the end of the last LEADER
programme on the basis of supporting a community organisation to explore new income generating
activities, but it was also recognised that there was a severe shortage of budget type accommodation
in the area.
Percentage of food and beverage services tourism
companies according to type in rural Stirling
Café
16%
27% Licensed Clubs
Public houses and bars
27% 3%
Restaurants
27% Take-away food shops and
mobile food stands
Figure 9. Source: Stirling Enterprise Economic Development, December 2013
22Percentage of entertainment, recreation and the arts
tourism companies according to type in rural Stirling
9%
Historical buildings and
monuments
22% Other Visitor Attractions
Safari Parks and Animal
62% Attractions
7% Sports and recreation
activities
Figure 10. Source: Stirling Enterprise Economic Development, December
2013
As Figure 10 shows, here is a clear strength to the sports and recreation sector within the paid
tourist attraction category. The sport and recreation sector is primarily made up of golf clubs and
livery yards.
Many people are therefore coming to the area and spending time here but there are not many
nationally run attractions with entrance fee (NTS or Historic Scotland) or privately run visitor
attractions. This suggests that a large proportion of people coming to the area are benefitting from
the much wider range of free attractions and outdoor recreation based on our natural environment,
which is supported by VisitScotland’s Scotland Visitor Survey 2012. The Visitor Survey for the
Loch Lomond and the Trossachs found that the three most popular activities on visits to the Loch
Lomond and the Trossachs National Park were sightseeing (41%), short walks (40%) and long
walks (36%)6.
How does this inform FVL strategic objectives?
• Accommodation services is the largest tourism industry sector
with more than two thirds of the tourism business sector
• There is demand for facilities which support visitor access to
the environment and outdoor activities including walking,
cycling
• There is an opportunity to develop facilities which compliment
these activities including events, food and drink provision,
creative industries especially where these address seasonality
• There are few nationally owned or run attractions in our area (ie
paid attractions).
• There are not many winter or wet weather attractions
• Most people visit the area to engage with natural heritage.
Relevant to strategic objectives: SE1, SE2, NCH1, NCH2, NCH3, SLA1
6
http://www.visitscotland.org/pdf/Loch%20Lomond%20Regional%20Factsheet%20-
%20Visitor%20Survey%202012%20final_pptx%20[Read-Only].pdf
232.4.5 Visitor Trends
Table 9 shows that the Forth Valley and Lomond area contains a number of popular natural heritage
visitor attractions that are free to access. There are also four country parks; two in Stirling and one
each in Clackmannanshire and West Dunbartonshire, which are also free to access. It is also
important to note that there are a number of large visitor attractions located just outside the FVL
area but within relatively easy reach for those staying within the FVL area (Alloa Tower,
Antonine’s Wall, Auchentoshan Distillery, Falkirk Wheel , the Forth and Clyde Canal, the Kelpies,
museums and galleries of Glasgow and Stirling Castle).
List of key visitor attractions in the Forth Valley and Lomond area
Free Attractions Entrance Fee/Paid
Attractions
Aberfoyle Woollen Mill Historic Kirkyards Trail Blairdrummond Safari
& Sheepdog Park
Demonstrations
Alva Glen Iconic smaller hills like Ben Can You Experience
Ledi and Dumyat (Outdoor experience
Antartex Village Loch Katrine, Loch Lomond, business based at Lomond
Loch Tay and Loch Shores)
Venachar
Balmaha – access to Loch Lomond Galleries Distilleries (Glengoyne,
Loch Lomond islands Deanston)
Balloch Castle Country Loch Lomond Shores (1.2 Dollar Castle
Park million visitors p.a.)
Balquhidder – Rob Long Distance Footpaths Doune Castle
Roy’s Grave (West Highland Way, Rob
Roy Way, John Muir Way,
Mary Queen of Scots Way, 3
Saints Way, Diamond
Jubilee Hillfoots Way, River
Leven Heritage Trail)
Balloch Castle Country Maid of the Loch Fir Park Ski Centre
Park
Balloch Steam Slipway Menstrie Castle Inchmahome Priory
Battlefields of Mountain Biking Tracks Loch Lomond Bird of Prey
Sauchieburn and (Mains Farm, Carron Valley, Centre
Sheriffmuir Aberfoyle Skills Area)
Bowling Basin (entrance Mugdock Country Park Loch Lomond Sea Life
to the Forth and Clyde (600k visitors p.a.) Aquarium
Canal)
Callander – Shops, Munro Mountains (Ben Moirlanach Longhouse
Bracklinn Falls, Crags Lomond, Ben Lui, Ben
Vorlich)
24Cambuskenneth Abbey Ochils Woodland Park Sweeney’s Cruises
Clackmannan Tower Plean Country Park Walter Scott Steamship
Cruise
Dollar Glen Queen Elizabeth Forest Park
and Lodge Visitor Centre
Drymen – Pubs + Sauchie Tower
Restaurants
Dunblane Cathedral Sterling Mills Retail Outlet
Dunglass Castle Strathyre – access to hills
Falls of Dochart - Killin Sustrans Route 76 (Round
the Forth) and Route 7
Flanders Moss Tyndrum – West Highland
Way, Green Welly Shop
Gartmorn Dam Country
Park
Table 9. Source: FVL Local Research
VisitScotland conducted a survey in 2012 of overnight visitors to the Loch Lomond and the
Trossachs National Park and the Stirling and Forth Valley area. The survey covered Falkirk,
Stirling, Alloa and the urban parts of West Dunbartonshire and only recorded the views of overnight
visitors but the area statistics are still useful in determining the behaviour of visitors to the area.
The key area facts the research found are contained in the Table 10:
List of area statistics about visitors to Loch Lomond and the Trossachs and
Forth Valley
• Visitors stay on average for 3.78 nights in Loch Lomond and the Trossachs
and 3.33 nights in the Forth Valley area.
• 25% of visitors to both areas were visiting Scotland for the first time.
• 15% of visitors are from overseas.
• 49% of visitors to Forth Valley visited historic attractions and 41% of Loch
Lomond and Trossachs visitors were there to sightsee.
• 38% and 48% of visitors to Forth Valley and Loch Lomond and the
Trossachs respectively were not satisfied by the availability of Wi-Fi and
broadband
• 35% of visitors to Forth Valley and 36% of visitors to Loch Lomond and
Trossachs were not satisfied with opportunities to attend local events and
festivals.
Table 10. Source: VisitScotland
Scotland Visitor Survey 2012.
Regional Results: Loch Lomond and the Trossachs National Park
Scotland Visitor Survey 2012.
Regional Results: Stirling and Forth Valley
Detail on the reasons for visiting the Loch Lomond and the Trossachs area specifically is further
revealed in the visitor survey for the National Park area. The survey states that the top reasons for
25choosing to visit Loch Lomond and the Trossachs National Park include a particular interest in the
scenery (39%), an area known to the visitor (23%) and a visit to a particular attraction (20%). Other
reasons included visiting to take part in specific activities (15%), or because of a recommendation
to visit (14%). More detail can be found on the VisitScotland Factsheet for the visitor survey.
VisitScotland’s Tourism in Scotland’s Regions 2013 research states that three of the top five visitor
attractions in Argyll and the Isles, Loch Lomond and the Forth Valley in 2013 were Loch Lomond
Shore with 1.14m visitors, the Queen Elizabeth Forest Park with 275,000 visitors and the Scottish
Wool Centre in Aberfoyle with 167,000 visitors. Occupancy rates across Argyll and the Isles, Loch
Lomond and the Forth Valley are averaged across the year at 58% for hotels and 38% for self
catering, which are substantially lower than occupancy rates for most other areas. This shows that
self-catering and hotel accommodation providers are available but are not being used to their
capacity.
How does this inform FVL strategic objectives?
The accommodation sector is dominated by self-catering and cabins type of
accommodation which is under occupied across the year and occupancy
rates are lower than the national average.
Hostels represent only 2% of the accommodation stock and therefore a gap
exists in the provision of low cost accommodation in the area.
Only self-catering developments are required which:
• are of a high quality,
• can demonstrate clear year round market demand
• strengthen and support cluster development in key activity areas
identified in the LDS
• do not displace existing provision
• provide innovative eco/low carbon solutions for low cost
accommodation provision
There are few winter or wet weather attractions in the area and priority will
be given to facilities which provide year round access in support of the
identified key sectors including food and drink, creative industries, outdoor
activity
Most people visiting the area come because of the high quality natural
heritage.
Relevant to strategic objectives: SE1, SE2, NCH1, NCH2, NCH3, SLA1
2.5 Environmental Indicators
2.5.1 Natural Environment
From an environmental perspective, one of the most striking aspects of the FVL area is that the
Loch Lomond and Trossachs National Park is located within it (with part extending into our
neighbouring Argyll LEADER area). Six of the eight National Park Visitor Hubs as identified in
26the National Park Partnership Plan 2012-20177 are located within the FVL LEADER area. Five of
the seven High Pressure Visitor Management Zones and four of the seven Medium Pressure Visitor
Management Zones are also located wholly or mostly within the FVL area. With most of the
National Park population and settlements in the FVL area, this means responsibility for looking
after some of the busiest and most environmentally sensitive areas as well.
List of SSSIs in the FVL LEADER area broken into relevant local authority
Clackmannanshire Stirling West Dunbartonshire
Backburn Wood Abbey Craig Glen Lochay Woods Aber Bog, Gartocharn Bog
and Meadows and Bell Moss
Craig Leith and Arnprior Glen Inneshewan Wood Auchenreoch Glen
Myrton Hill
Damhead Wood Balglass Corries Killorn Moss Boturich Woodlands
Devon Gorge Ballagen Glen Kippenrait Glen Caldarvan Loch
Dollar Glen Ballanucater Lake of Menteith Dumbarton Muir
Firth of Forth Ben A'An and Leny Quarry Haw Craig - Glenarbuck
Brenachoile Woods
Gartmorn Dam Ben Heasgarnich Lime Craig Quarry Inchmurrin
Linn Mill Ben Lomond Lochan Lairig Cheile Lang Craigs
Mill Glen Ben Lui Loch Lubnaig Loch Humphrey Burn
Marshes
Ben More - Stob Loch Macanrie Fens Portnellan – Ross Priory -
Binnean Claddochside
Black Water Loch Mahaick
Marshes
Brig o’ Turk Mires Loch Tay Marshes
Cambusurich Loch Watson
Wood
Collymoon Moss Meall Ghaordie
Coille Chriche Meall na Samhna
Conic Hill Mollands
Craig Royston Morenish Meadow
Woods
Cuilvona and Ochtertyre Moss
Craigmore Woods
Dalveich Meadow Offerance Moss
Double Craigs Pass of Leny Flushes
Drumore Wood Pollochro Woods
Edinample River Dochart
Meadow Meadows
Edinchip Wood Rowardennan
Woodlands
Endrick Mouth and Sauchie Craig Wood
Islands
Endrick Water Shirgarton Moss
Fairy Knowe and Stronvar Marshes
Doon Hill
Falls of Dochart Tynaspirit
7
http://www.lochlomond-trossachs.org/images/stories/Looking%20After/PDF/NP%20Plan/NPPPlan2012_final3.pdf
27Finlarig Burn Wester Balgair
Meadows
Flanders Moss Westerton Water
Meadow
Gartfarran Woods Wolfs Hole Quarry
Glen Falloch
Pinewoods
Table 11. Source: www.snh.gov.uk
One way to assess the landscape or environmental importance of an area is by the number of Sites
of Special Scientific Interest (SSSI) within any particular area. Table 11 above shows that there are
81 SSSIs in the FVL area, with the majority in rural Stirling. This is to be expected given that a
large proportion of rural Stirling is contained within the Loch Lomond and the Trossachs National
Park.
SNH has spent some time in recent years developing a methodology to identify and map wild land
in Scotland and audit what wild land resource there is in Scotland. All of the designated wild land
area of Ben More –Ben Ledi is contained within the FVL area and part of the wild land designated
Upper Almond, Breadalbane and Ben Lui – Beinn Ime8.
2.5.2 Built Environment
As referred to in the tourism section above, there are not many commercially run (fee-charging)
historic sites in the FVL LEADER area. However, this does not take into account numbers of
historic buildings and sites that are in the area but are free to visit, which includes important
features of built heritage, such as Cambuskenneth Abbey, Clackmannan Tower, Craigend Castle,
Dunblane Cathedral, Dunglass Castle, Logie Old Kirk, Mugdock Castle, Rob Roy’s Grave and
Sauchie Tower.
The table below shows the number of buildings on the Buildings at Risk Register in the FVL
LEADER area according to local authority. There is a significant number altogether, which
suggests that there is quite a strong built heritage resource in the FVL area but that it is largely
underused and is in a poor condition.
Number of buildings on Buildings at Risk Register in FVL LEADER area
Clackmannanshire 12
Stirling 32
West Dunbartonshire 2
Table 12. Source: Buildings at risk register March 2014
Throughout the FVL area there are only 3 Historic Scotland staffed properties and 3 National Trust
for Scotland properties, one of which is Menstrie Castle, which has very limited opening times9.
8
http://www.snh.gov.uk/protecting-scotlands-nature/looking-after-landscapes/landscape-policy-and-guidance/wild-
land/mapping/
9
http://www.nts.org.uk/Property/Menstrie-Castle/About/
28Aims of local groups to open potential tourist attractions like St Kessogs in Callander10, the Old
Mill in Killin11, Sauchie Tower12 and Clackmannan Tower suggest there is a community-led desire
to develop and/or manage iconic buildings for tourism purposes.
2.5.3 Archaeological Sites
Discussions with Stirling Council’s archaeologist has revealed a number of significant historic sites,
many of which are not popular visitor attractions through current lack of access, being in a ruinous
condition or are just not being well promoted. They are contained in the table below, which will be
added to following consultation with archaeologists from Clackmannanshire and West
Dunbartonshire Councils.
List of important archaeological sites and the reason for their value
Site Explanation
Bannockburn old village Bannockburn was an early producer or
tartan, continuing to produce the cloth
throughout the prohibition following the
‘45 rising.
Castle Law on Dumyat Remains of an Iron Age hillfort occupied
by the Maeatae tribe.
Clackmannan Tower Early Castle and likely very early remains
associated with it.
Fairy Knowe, Buchlyvie Remains of a 2,000 year old tower.
Killearn Glen Ruins of a 17th century designed
landscape.
Menstrie Glen Important remnants of pre-clearance
landscape.
Plean Country Park Rare upstanding World War 1 practice
trenches.
Sir John de Graham’s Castle and Sir John de Graham fought in the Wars of
associated cemetery Independence.
Table 13. Source: Consultation with Stirling Council archaeologist
How does this inform FVL strategic objectives?
• The FVL area contains a large number of SSSIs.
• The FVL area has sites of historic archaeological
importance.
• A large number of historically important buildings in the
FVL area are at risk of falling down.
Relevant to strategic objectives: NCH1, NCH2, NCH3, SLA1
10
http://www.callandercdt.org.uk/st-kessogs-index.html
11
http://www.killinwatermill.co.uk/#!projects/c10d6
12
http://www.clacksweb.org.uk/community/friendsofsauchietower/
29SUMMARY BOX : Section 2.3 SOCIAL CHARACTERISTICS
The population figures show that the FVL area has unusual trends that are not replicated to
the same degree in Scotland as a whole such as spikes in 10-15 and 20-24 year-olds and a
dramatic drop in the 25-34 demographic. We can also see that the FVL area’s population
has a larger proportion of people over 45 than Scotland as a whole. Analysis of the
Scottish Index of Multiple Deprivation shows that more datazones in the FVL area are
falling into the 10% most deprived for current income, employment and geographic access
to services domains. We can also see that the communities throughout the area are
ambitious and dynamic by taking on the management / ownership of buildings or land.
These characteristics of the area relate primarily to the Strategic Objectives of building
more sustainable communities and building more resilient communities as these are the
principal means by which we will be able to address the drops in key demographics and
enable communities to achieve their aims.
SUMMARY BOX : Section 2.4 ECONOMIC CHARACTERISTICS
Employment in the FVL area is heavily dependent on the public sector and in micro and
small industries and is also affected by seasonality. At the same time, unemployment does
not seem to be increasing as claimants of Job Seekers Allowance are decreasing across the
FVL area. The area supports a large number of tourism related businesses, which are
primarily accommodation providers, themselves primarily self-catering and cabin
accommodation. While there are a lot of accommodation providers, the hotel and self-
catering accommodation providers in particular have significantly lower occupancy rates
than comparator areas like Perthshire.
These economic characteristics support the need for the Strategic Objectives of
strengthening the rural economy and building more sustainable communities
primarily. The visitor trend statistics highlight the importance of the natural environment
to the FVL area and relate more to the Strategic Objectives involved in developing the
natural and cultural environment and improving the potential of the strategic landscape
assets.
SUMMARY BOX : Section 2.5 ENVIRONMENTAL CHARACTERISTICS
The tables reporting the extent of the natural and built heritage assets of the area show it is
strong in both. It also shows that some of the built heritage of the area is at risk.
These tables relate to the Strategic Objectives of increasing the understanding of, and
access to, our natural and cultural heritage environment and developing the potential
of the area’s strategic landscape assets, which will maximise the potential of the area’s
heritage and perhaps reduce any risk to that heritage.
303. A Summary of the Economies of the Forth Valley and
Lomond Area
The following information is a description of the differing economies of West Dunbartonshire,
Stirling and Clackmannanshire and is based on local discussions and a review of strategies and
research currently available.
Starting in the south-west of our area, the economies of the FVL West Dunbartonshire
communities are split between those that have plentiful tourism opportunities with Loch Lomond
and the wider National Park area on the doorstep, and the communities located further south who
face the legacy of the former employment havens provided by shipbuilding, and large scale heavy
industries which have declined over the last century. The decline of these industries have been to
such an extent that West Dunbartonshire as a whole is now ranked as one of Scotland’s most
deprived areas. But the ease of access and proximity of Clydebank and Glasgow to these areas
provide a strong day-visitor market, with tourism identified as a priority sector for growth within
the West Dunbartonshire Economic Strategy. The Forth and Clyde canal, the Bowling Basin, the
Kilpatrick Hills, Balloch, Lomond Shores, Balloch Castle Country Park and the National Park offer
significant tourism business potential, with the surrounding communities providing tourism support
services with the benefit of good access to transport networks, road access, broadband and
affordable business accommodation. Lomond Shores attracts 1.2 million visitors per annum.
The Third Sector is the third largest employment sector in the whole of West Dunbartonshire (rural
and urban), after the Local Authority and the NHS. There have been efforts to establish substantial
social enterprises in the area (mostly urban) which have had mixed results, but have provided
learning none-the-less.
Plans are in progress for an investment of £28m over 5 years, at the old Esso/Exxon site on the
River Clyde-side which is within the FVL eligible area . This will open up the site for further
development by dealing with decontamination, infrastructure and SSSI protection. This site
neighbours Bowling Basin, the western terminus to the Forth and Clyde Canal. The Basin has
benefitted from investment in recent years to open up the site for land and boat access, and further
regeneration is proposed through developing retail, commercial, leisure, industrial and residential
developments following a Bowling Basin Charrette and Masterplan led by Scottish Canals. .
Moving north and east to rural Stirling, this area is covered by “Open for Business” produced by
the Stirling Economic Partnership in 2009 (and is currently being updated). The strategy identifies
a need for quality business support and for activities to capitalise on the opportunities presented by
the knowledge base at Stirling University and Forth Valley College. The strategy notes that the
Stirling economy is diverse and has few clear business sectors of scale- apart from tourism which
contributes over £400m to the local economy (rural and urban). It also reports a high density of
jobs in the environmental sector across the full Stirling Council area, whilst also identifying a need
to enhance the skills base and earning potential of the tourism sector, and identifies competitive
advantage in the following sectors: food and drink, sport and leisure, cultural and creative
industries, and environmental and clean technologies.
A rural business space study was undertaken in 2011 which identified unmet demand for business
space, which was found to have constrained the growth and diversification of rural businesses.
Areas highlighted as requiring new business space or development sites were Drymen, Gartmore,
Callander, Balquhidder and Killin. The study also identified high level of demand for home
working units along with reliable high speed broadband.
31In response to increasingly vocal communities and businesses regarding the poor quality of
broadband in the rural area, Stirling Council produced a broadband strategy in March 2013, which
identified access to affordable broadband as a key priority for the Council due to its importance in
delivering economic and social benefits. Whilst the Council’s position was that it was not a
provider of broadband services, it committed to help facilitate and, in some cases, provide
additional funds to help improve the provision of services in the area. The strategy also refers to the
significant problems in the rural areas where a number of active rural communities have an
unusable broadband service which hampers development and threatens sustainability, resulting in a
commonly stated desire to widen access to usable broadband speeds rather than focus on further
increasing speeds for those already with a commercially available and usable service. However, the
point is made that with an ageing rural population, and depopulation in some areas, there is a need
to attract new, and retain existing, populations, particularly in the younger age groups. This will
require supporting infrastructure which includes high quality broadband. Rural areas without
access to high quality broadband, or even usable broadband, will remain at a disadvantage. Since
the publication of this strategy, the Scottish Government has started the roll-out of its Step-Change
programme which in the Stirling Council area will bring Next Generation Broadband to 93% of
households, although it is unclear by when.
The Single Outcome Agreement for Stirling notes the polarised nature of the Stirling area – with
areas of Stirling within the FVL LEADER area having some of the most affluent and successful
communities in Scotland (in terms of income, health and quality of life) In relative close proximity,
there are communities of concentrated deprivation where worklessness is significant and health
statistics are some of the poorest in the country. The former mining areas of Plean, Cowie, Fallin
and Bannockburn have lower than average economic indicators and the highest measures of
deprivation in the rural Stirling area. Elsewhere, pockets of rural poverty (deprivation and
unemployment) are lost within the datazone scale of collecting these statistics. This is backed up by
the experience of Rural Stirling Housing Association as reported through the FVL LEADER
Stakeholder discussions.
Rural Stirling contains a polarisation of employment from out-commuting managers and
professionals through to lower-paid workers in hospitality and retail. There is much more self-
employment and potential entrepreneurship in the rural area, especially further north. There is less
reliance on retail and public sector employment within the rural area, but still significant
employment of residents in these areas. Most of the northern part of Stirling’s rural area lies within
the most deprived 5% nationally for accessibility. It is currently not possible for anyone living north
of Callander to commute to a 9-5 job in Stirling by public transport.
One exciting, although slightly controversial development in this area is the proposed Cononish
Gold Mine near Tyndrum which has been approved by the planning authority. This has the
potential to bring much needed local economic benefit through job creation and a community-led
visitor attraction. At present, the ability to raise the investment required is holding back the
development, which in turn is affected by movements in the price of gold at a global level.
Moving east, Clackmannanshire has seen an improvement in a range of quality of life measures
and the gap is narrowing between the most and least advantaged communities. As a whole, there
has been a big growth in housing, and greatly improved physical connectivity (Stirling-Alloa-
Kincardine rail link to Stirling, and Clackmannanshire Bridge). Of the three local authority areas
within FVL, tourism plays the least important role in Clacks. The strategy is to build on the
attractiveness and centrality of the area to live and work to maximise economic benefits. It has one
of Scotland’s fastest growing populations. In the last ten years, the population of Clacks has grown
by 6%, nearly twice the rate of Scotland as a whole with, as in all areas an ageing demographic. In
32You can also read