State of Maine Renewable Energy Goals Market Assessment - Sponsored by the State of Maine Governor's Energy Office
←
→
Page content transcription
If your browser does not render page correctly, please read the page content below

State of Maine Renewable Energy Goals
        Market Assessment
        Sponsored by the State of Maine Governor’s Energy Office

         March 2021

Prepared by:
Project Team
This report was produced in a collaboration between Energy and Environmental Economics, Inc. (E3) and
The Applied Economics Clinic (AEC) and sponsored by the Maine Governor’s Energy Office (GEO). While the
GEO and other Maine market participants provided input and perspectives regarding the study scope and
analysis, all decisions regarding the analysis were made by E3 and AEC. Thus, this report solely reflects the
research, analysis, and conclusions of the E3 and AEC study authors.

E3 is a leading economic consultancy focused on the clean energy transition. E3’s analysis of clean energy
issues and the electric power sector is utilized extensively by utilities, regulators, developers, and
government agencies in leading-edge jurisdictions such as California, New York, and Hawaii. E3 has offices
in Boston, New York, San Francisco, Calgary, and Raleigh.

E3 Primary Authors: Saamrat Kasina, PhD; Bill Wheatle, PhD; Charlie Duff; Liz Mettetal, PhD; Lakshmi
Alagappan; and Nick Schlag

AEC is a nonprofit consulting group offering low-cost expert services from seasoned professionals while
providing on-the-job training to the next generation of technical experts. AEC makes its expertise available
to public service organizations working on topics related to the environment, consumer rights, the energy
sector, and community equity.

AEC Primary Authors: Bryndis Woods, PhD and Elizabeth A. Stanton, PhD

Acknowledgment
The report authors greatly benefited from the advice and feedback provided by a diverse group of Maine
stakeholders and experts for this project. Feedback was provided through public comments and follow-up
meetings as needed.

                                            www.ethree.com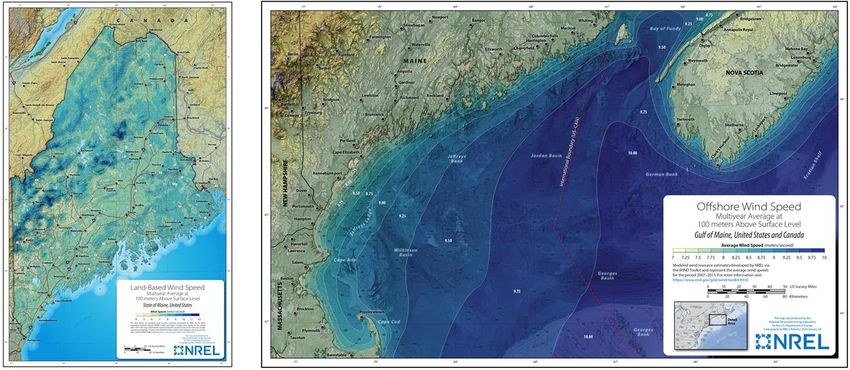
Maine Governor’s Energy Office

        Table of Contents
        Executive Summary............................................................................................................................1
        1     Introduction ................................................................................................................................4
            1.1     Study motivation ............................................................................................................................ 4
            1.2     GEO’s role in effort ......................................................................................................................... 4
            1.3     Public comment process ................................................................................................................ 4
            1.4     Objectives of this study .................................................................................................................. 5
            1.5     Report contents .............................................................................................................................. 5
        2     Background and context ..............................................................................................................6
            2.1     Maine’s renewable energy and climate goals ................................................................................ 6
            2.2     Regional context ............................................................................................................................. 7
            2.3     Historical renewable development and electricity mix in Maine .................................................. 9
            2.4     Benefits of renewable energy ...................................................................................................... 11
            2.5     Maine’s energy equity context ..................................................................................................... 12
        3     Modeling and scenario analysis approach .................................................................................. 14
            3.1     Modeling approach ...................................................................................................................... 14
            3.2     Scenarios ...................................................................................................................................... 15
            3.3     Key assumptions ........................................................................................................................... 19
        4     Scenario Analysis Results ........................................................................................................... 42
            4.1     Individual scenario results ............................................................................................................ 42
            4.2     Scenario comparisons................................................................................................................... 57
        5     Policy Implications .................................................................................................................... 64
            5.1     Planning & Resource Additions .................................................................................................... 64
            5.2     Transmission ................................................................................................................................. 66
            5.3     Offshore wind ............................................................................................................................... 69

Maine Renewable Energy Market Goals Assessment                                                                                                                            i
5.4     Distributed generation ................................................................................................................. 70
            5.5     Storage.......................................................................................................................................... 72
            5.6     Utility-Scale PV and Onshore wind ............................................................................................... 73
        6     Equity benefits and challenges of renewable transition .............................................................. 75
        7     Conclusions ............................................................................................................................... 78
        8     Appendix .................................................................................................................................. 81
                    Summary of stakeholder feedback............................................................................................... 81
                    Additional equity considerations in Maine .................................................................................. 82
                    Release notes for revised report – March 2021 …………………………………………………………………..… 87

Maine Renewable Energy Market Goals Assessment                                                                                                                             ii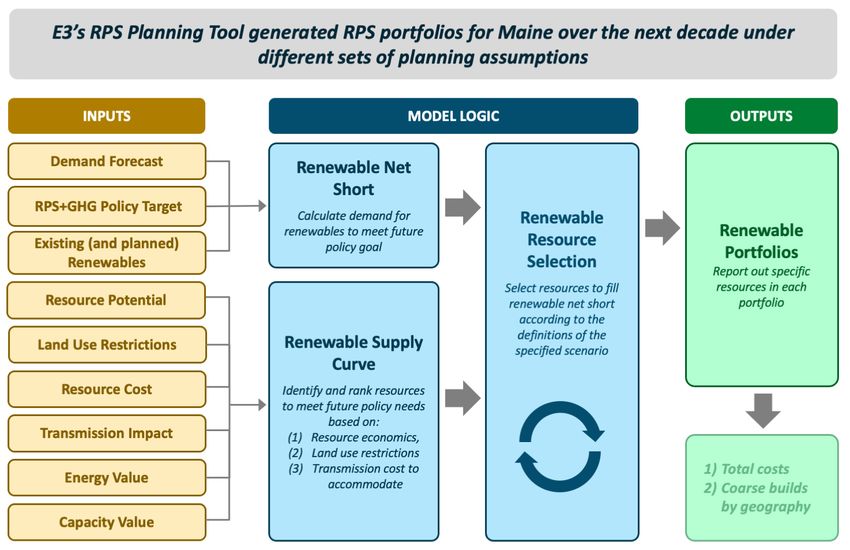
Abbreviations

         ACP                Alternative Compliance Payment
         AEO                Annual Energy Outlook
         AMP                Maine’s Arrearage Management Program
         AS                 Ancillary Services
         ATB                Annual Technology Baseline
         BAU                Business As Usual
         BYOD               Bring Your Own Device
         CES                Clean Energy Standard
         CF                 Capacity Factor (CF)
         CMP                Central Maine Power
         COVID-19           Coronavirus Disease 2019
         CREZ               Competitive Renewable Energy Zone
         EIA                Energy Information Agency
         ELCC               Effective Load-Carrying Capacity
         ERCOT              Energy Reliability Council of Texas
         EV                 Electric Vehicle
         FCA                Forward Capacity Auction
         GEO                Maine Governor’s Energy Office
         GHG                Greenhouse Gas
         HDV                Heavy-Duty Vehicle
         IC                 Interconnection
         ISO-NE             ISO New England, Inc.
         LCOE               Levelized Cost of Energy
         LDV                Light-Duty Vehicle
         MCC                Maine Climate Council
         MEOPA              Maine Office of the Public Advocate
         MPUC               Maine Public Utilities Commission
         MRIS               Maine Resource Integration Studies
         NEADA              National Energy Assistance Directors Association
         NEB                Net Energy Billing
         NECEC              New England Clean Energy Connect
         NESCOE             New England States Committee on Electricity
         Net CONE           Net Cost of New Entry
         NMISA              Northern Maine Independent System Administrator

Maine Renewable Energy Market Goals Assessment                                 iii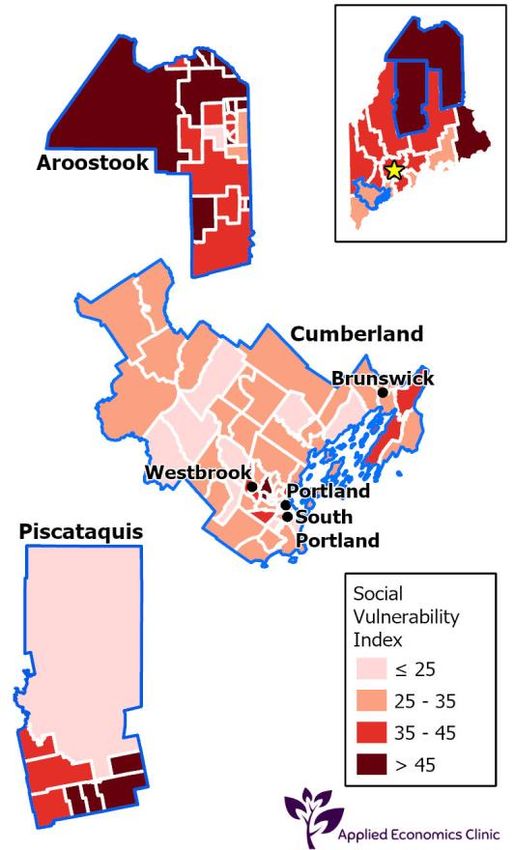
NQC                Net Qualifying Capacity
         NREL               National Renewable Energy Laboratory
         NSRDB              National Solar Radiation Database
         PPA                Power Purchase Agreement
         PPR                Public Policy Requirements
         PPTS               Public Policy Transmission Study
         PPTU               Policy Transmission Upgrade
         PUCT               Public Utilities Commission of Texas
         PV                 Photovoltaic
         REC                Renewable Energy Credit
         ReEDS              Regional Energy Deployment System
         REGMA              Renewable Energy Goals Market Assessment
         RETI               Renewable Energy Transmission Initiative
         RFP                Request for Proposal
         RNS                Renewable Net Short (in this study)
         RPS                Renewable Portfolio Standard
         RTO                Regional Transmission Organization
         SVI                Social Vulnerability Index
         VMT                Vehicle Miles Travelled
         WtE                Waste to Energy
         WTK                Wind Toolkit

Maine Renewable Energy Market Goals Assessment                         iv
Executive Summary
Executive Summary
In 2019, Governor Mills signed LD 1494, “An Act to Reform Maine’s Renewable Portfolio Standard (RPS),”
which sets ambitious renewable energy targets for the state. The act requires 80% of Maine’s electricity to
come from renewable resources by 2030 and sets a goal of having 100% of Maine’s electricity served by
renewables by 2050. In addition, the electric sector is expected to support rapid load growth due to
electrification of end uses, especially in the transportation and building sectors, to help meet the state’s
greenhouse gas (GHG) reduction goals.
Maine, like much of New England, has these dual goals to achieve – 1) serving growing and likely more
dynamic load due to electrification, and 2) increasing the share of renewables serving the state’s electricity
needs. Maine has an abundance of high-quality renewable resources available for development that
positions the state well to achieve both these goals. At the same time, Maine’s current resource mix,
geography, and population distribution pose unique considerations that need to be addressed through
intentional action and thoughtful policy support to the market to ensure that the renewable transition is
effective, affordable, and equitable.
This study, sponsored by the Maine Governor’s Energy Office (GEO) and conducted by Energy &
Environmental Economics (E3) and Applied Economics Clinic (AEC), fulfills the requirements of LD 1494,
which called for a Renewable Energy Goals Market Assessment (REGMA) to assess options for how to meet
the renewable transition in Maine over the next decade. It is meant to support policy discussions and
decision-making to achieve the state’s RPS. The analysis in this study is meant to complement the work of
the Maine Climate Council (MCC) in studying and supporting pathways to meeting Maine’s clean energy
and GHG reduction requirements.
The REGMA analyzes six future scenarios to explore plausible renewable portfolios that would enable
Maine to meet its 2030 RPS target. The scenarios were informed by stakeholder feedback and are meant
to reflect the characteristics that are unique to Maine – onshore resource potential, land use
considerations, transmission availability, offshore wind potential, and coordination with the rest of New
England. Comparing the resource portfolios, costs, and equity impacts across the scenarios provides insight
into the possible effects of each of these unique characteristics on Maine’s electric sector and population.
Taken together, these individual effects paint a larger picture of the opportunities and challenges that
Maine may face as it works towards achieving the RPS. As such, the scenarios and their results are not
meant to be prescriptive and are instead intended to highlight the considerations to support policy
discussions and decisions related to the RPS.
Key findings from the study that provide insight into how Maine may achieve its RPS target in the next
decade are found below.
Maine is on track to meeting its RPS until 2026, but new resources will be needed to meet
increasing goals thereafter. A combination of existing generation and resources procured
previously and through LD 1494 and LD 1711, “An Act To Promote Solar Energy Projects and
Distributed Generation Resources in Maine,” will be sufficient to meet the need for renewable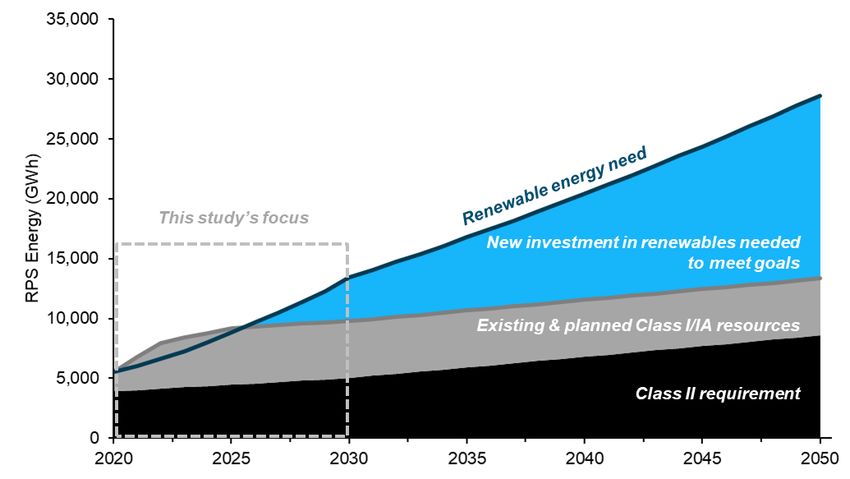
Executive Summary
energy credits (RECs) until 2026. Beyond this point, new resources will be needed to meet
increasing goals. Scenario analysis indicates a range of new builds between 800 and 900 MW by
2030 will be needed. This need can be satisfied by a number of resources, though each requires
the consideration of tradeoffs: Maine’s high-quality onshore wind potential is largely inaccessible
absent investments in transmission; small-scale solar may be developed in proximity to loads and
provides resiliency, but significant transmission and distribution upgrades are likely needed to
interconnect large amounts of these systems; and offshore wind is still in the nascent stages of
technological development but could emerge as a competitive source of renewable supply. Given
the challenges facing renewable development in the state – particularly with respect to
transmission – there is need for action well before 2026 so that the intervening years are used to
develop and implement plans to ensure enough new renewable generation is online and
operational by 2026. Further, given federal tax incentive expiration, there are cost savings to
advancing development to before 2026.
Transmission will be a key driver of renewable development. Building new transmission is difficult
in New England and can be challenging in Maine. At the same time, the report required by LD 14011
and subsequent findings show that key transmission pathways in Maine are severely congested
and constrained. This study highlights that many lower-cost pathways to meet Maine’s RPS
requirements in the next decade are achievable through the development of high-quality wind
resources in western and northern Maine, which in turn require new transmission investments.
The scale of these transmission investments, along with the longer development timelines as
compared to renewable projects, will make it difficult for any single wind project to shoulder the
development burden of these transmission projects. Limited transmission availability will present
similar challenges for the development of other generation sources, such as solar. A state-
sponsored anticipatory transmission planning process could help address this issue by identifying
the transmission needed to meet the RPS in advance of renewable development. Maine could look
to states like Texas (Competitive Renewable Energy Zone, or CREZ, process) or California
(Renewable Energy Transmission Initiative, or RETI) to see how other states in similar situations
have successfully approached this challenge.
A technologically diverse portfolio helps lower risk. Each resource type has its own set of
challenges that introduce risk into the resource portfolio. Onshore resources in western and
northern Maine require transmission upgrades and could face siting challenges. Floating offshore
wind is not yet deployed at scale and thus has a higher initial cost, which may decrease with
increasing penetration. Large penetrations of distributed generation, which are expected by 2025
(500 MW), will likely require distribution and transmission upgrades. There is also uncertainty
associated with the resource costs, as technologies are continuing to evolve. Pursuing a diverse
portfolio serves as a hedge against several uncertainties, including slower-than-expected cost
declines and the development of new transmission. This study explores one such diverse portfolio,
but the appropriate mix will be ultimately decided to meet multiple policy objectives.
1 “Resolve, To Study Transmission Solutions to Enable Renewable Energy Investment in the State Final Report,” 2020.
Maine Renewable Energy Market Goals Assessment 2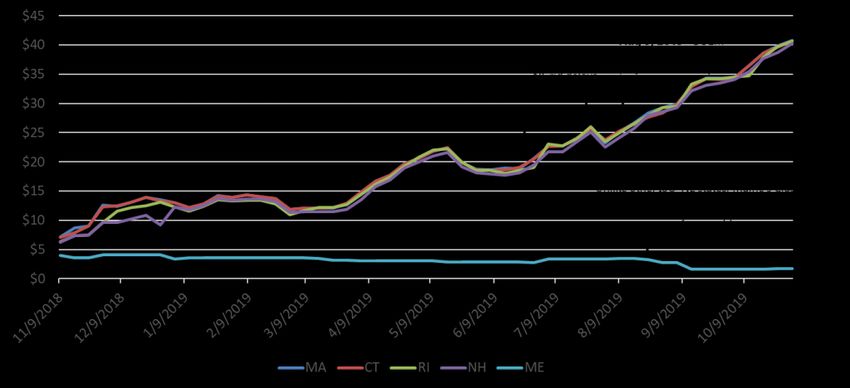
Executive Summary
Regional coordination can help lower the costs of meeting Maine’s RPS. In addition to having a
large amount of land for renewable development, Maine has some of the highest-quality wind
resources available in New England. If developed, these resources can help to meet both Maine
and the broader region’s clean energy goals. New transmission is required to access these
resources, however, due to their remote location. The study results show that coordination of
Maine with neighboring states can mitigate the “lumpiness” challenge of new transmission
investment—that transmission projects are generally large in size, are expensive, and the full
project has to be developed before any benefits can be realized—so that Maine’s customers do
not bear the full cost of transmission to access high-quality wind resources in the northern and
western parts of the state.
Storage paired with solar resources can provide value. Storage paired with solar was found to be
chosen economically alongside onshore wind. Maine’s winter peak is projected to increase with
heating electrification. Pairing solar with storage improves the combined generation profile of
these hybrid resources, enabling them to generate during evening peak demand, increasing their
value to the system. Storage has additional benefits, such as transmission and distribution deferral
value, resiliency, and ancillary services provision, which are not captured in this RPS-focused study.
Including these value streams is likely to further improve the economics of storage.
Energy equity challenges cut across four dimensions: resource diversity, customer-sited
resources, geographic resource distribution, and cost. Successfully achieving Maine’s renewable
energy goals may result in at least three benefits for its vulnerable communities: 1) reductions in
emissions resulting in corresponding improvements in air quality and human health, 2) renewable
resources increasing the energy supply’s resiliency, and 3) clean energy development creating
employment and community investment. Ensuring equity considerations are prioritized during
Maine’s clean energy transition requires careful attention to resource diversity, customer-sited
resources, geographic resource distribution, and the cost impacts experienced by vulnerable
communities. Thoughtful selection of a resource mix should be complemented with periodic
review and modifications to rate structure to ensure Maine’s vulnerable communities are not
adversely impacted. Investment in programs that provide resources to vulnerable communities
should also continue to be supported. Furthermore, siting of new resources should consider and
seek to minimize impacts to existing industries, stakeholders, communities, and natural resources.
This study finds that Maine has several economical pathways to meet its renewable goals. Each resource
option has its own set of challenges to overcome, with the primary challenge being building transmission
to access high-quality renewables in the state and the associated siting, permitting, and environmental
concerns. This study outlines potential policy implications of the renewable transition and is meant to
support policy considerations as the state charts its way to a high renewable future.
Maine Renewable Energy Market Goals Assessment 3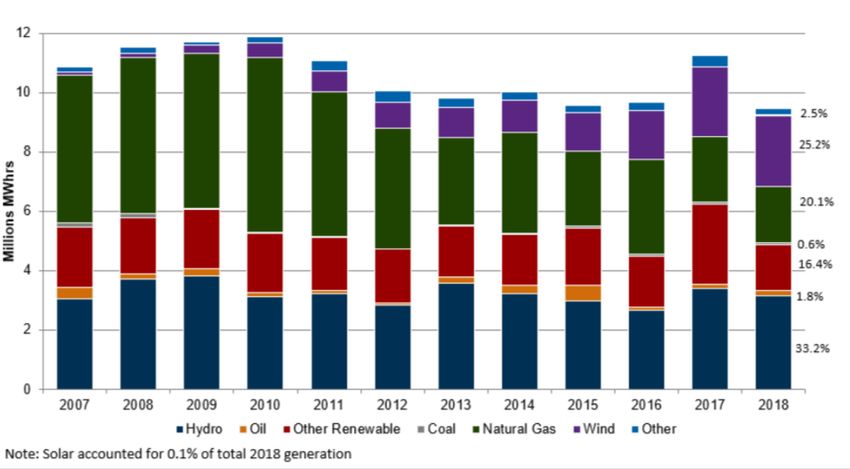
1 Introduction
                                                                                      1    Introduction

 The State of Maine has been a leader in both recognizing the potential impacts of climate change on the
 state and in enacting policy to mitigate and prepare for the risks associated with climate change impacts.
 In 2019, Governor Janet Mills signed landmark bipartisan legislation establishing the Maine Climate Council
 and mandating that Maine reduce GHG emissions 45% below 1990 levels by 2030 and 80% by 2050. This
 was followed by an Executive Order committing the state to a carbon-neutral target by 2045. In support of
 those targets, Governor Mills also signed LD 1494, “An Act to Reform Maine’s Renewable Portfolio Standard
 (RPS),” which sets ambitious renewable energy targets for the state through 2050. The act requires that
 80% of Maine’s electricity come from renewable resources by 2030 and sets a goal of a 100% RPS by 2050.
 The law also calls for a 10-year Renewable Energy Goals Market Assessment (REGMA).

 This study fulfills the market assessment requirement by evaluating the current renewable market in
 Maine, assessing the need for Renewable Energy Credits (RECs) until 2030 (based on the RPS targets
 established by LD 1494), and estimating the costs of multiple renewable resource portfolios that meet the
 2030 RPS targets, along with additional equity considerations.

 In addition to modeling renewable resource portfolios, this study also identifies areas that may require
 policy actions to meet the state’s RPS requirements and discusses options available to the state to enable
 a smooth and equitable transition to a high renewable future, while ensuring affordable and reliable
 electricity for the state’s ratepayers. The aim of this study is not to be prescriptive in determining the exact
 mix of resources that Maine must procure, but rather – through the modeling and analysis of example
 portfolios -- extract general themes of benefits, challenges, and barriers to renewable development in the
 state. As such, the analysis and policy options discussed in this study are intended to support policy
 discussions and decision-making to achieve the state’s RPS.

 The GEO is the sponsor of this study and selected E3 and the AEC to conduct this work. GEO worked with
 the consultants in designing the study, conducting public comment processes, facilitating, and participating
 in meetings between stakeholders and consultants, and preparing this report.

 As part of this study, GEO, E3, and AEC conducted a public comment process in which stakeholders were
 invited to participate in two webinars. In the first webinar, conducted on November 6, 2020, E3 presented
 the initial study design and solicited feedback from stakeholders. This feedback was then used to modify
 the study design and the scenarios modeled. Follow-up meetings to gather more data were scheduled as
 needed. A summary of the received feedback can be found in the Appendix.
The second webinar was conducted on February 17, 2021 and presented the final scenario analysis results
and key findings provided in this report. Stakeholders were invited to provide comments on the final report
following this webinar, the summary of which of will be posted online.
The key objectives of this study are to:
Assess Maine’s existing renewables to help quantify RECs expected to be generated and used to
meet Maine’s RPS through 2030 from existing resources.
Establish the need for RECs through 2030. Establish the need for incremental RECs through 2030,
after accounting for RECs from Maine’s existing resources.
Explore resource portfolios that help the state meet its renewable targets through 2030.
Determine portfolios of resources that can economically meet the incremental REC need through
2030 and determine the costs of such portfolios.
Explore the implications of regional coordination. Identify impacts of regional coordination
strategies on the achievement of the state’s RPS.
Consider the equity implications of renewable development on Maine’s population.
Explore policy options to support achieving Maine’s RPS by 2030 by reviewing analysis results
and stakeholder feedback.
The remainder of the report is organized as follows:
Section 2 provides background and study context, including an overview of Maine’s RPS and GHG
mandates and targets, and the relevant policy considerations assessed through the scenario
analysis. This section also identifies Maine’s socially vulnerable communities, which helps
contextualize the equity impacts of the results of this study (presented in Section 4).
Section 3 provides an overview of the modeling approach, scenarios modeled, and key assumptions
utilized in the scenario analysis.
Section 4 presents results from the scenario analysis and discusses the drivers of the results.
Section 5 describes the policy implications of the scenario analysis performed and includes a
discussion of the options to reduce challenges and barriers to renewable development in the state.
Section 6 summarizes the anticipated energy equity benefits and challenges of Maine’s transition
to a high renewable state on Maine’s most vulnerable populations.
Section 7 summarizes the key takeaways from the study.
Section 8 is an Appendix that provides a summary of stakeholder feedback collected as part of this
study and contains other supplemental material.
Maine Renewable Energy Market Goals Assessment 52 Background and Context
2 Background and context
This section provides background on the current energy policy, resource mix, and equity context under
which this study is conducted.
The State of Maine has set some of the most ambitious decarbonization policies in the country, aimed at
mitigating the worst impacts of climate change on the state and catalyzing the development of Maine’s
clean energy economy. Three important pieces of bipartisan legislation, signed by Governor Mills in 2019,
are central to the state’s decarbonization policy agenda:
LD 1679 (An Act To Promote Clean Energy Jobs and To Establish the Maine Climate Council): This
act established the Maine Climate Council, which is tasked with advising on strategies for Maine to
meet economy-wide emission reductions of at least 45% below 1990 levels by 2030 and 80% below
by 2050. These targets are based on 38 M.R.S.A. § 576. Since the signing of this legislation,
Governor Mills has also issued an Executive Order aimed at achieving economy-wide carbon
neutrality by 2045.
LD 1494 (An Act To Reform Maine’s Renewable Portfolio Standard): This act increased the share
of the state’s electricity coming from renewable resources to a total of 80% by 2030 and a goal of
100% by 2050. This law also requires the Maine Public Utilities Commission (MPUC) to procure
long-term clean energy generation contracts totaling 14% of Maine’s 2018 retail sales in two
rounds of procurement in 2020 and 2021. This act also provides the basis for the renewable energy
assessment developed in this study.
LD 1711 (An Act To Promote Solar Energy Projects and Distributed Generation Resources in
Maine): The policy levers within this bill are aimed at encouraging broader participation in the
renewable energy market. This act issues procurement orders for a total of 375 MW of distributed
generation, primarily expected to be small solar photovoltaic (PV) projects, by 2024, and creates
incentives for commercial, institutional, and community projects. The bill also removes caps on Net
Energy Billing (NEB), increases the eligible project size to 5 MW, and requires that community
projects support low- and moderate-income customers. As of the time of writing of this report,
Block 1 of the 375 MW distributed generation procurement was deemed not competitive by the
MPUC. Under current law, a new competitive procurement for Block 1 is required to occur by July
2021.2
These laws, and others, provide complementary policy support for economy-wide decarbonization. In
December 2020, the Maine Climate Council released its four-year climate action plan, Maine Won’t Wait,
to set the state on a path to achieve the ambitious economy-wide decarbonization targets outlined in LD
1679. The plan requires action across all emitting sectors of the economy, including transportation,
2 “Report on Renewable Distributed Generation Solicitation” (Maine Public Utilities Commission, 2020).buildings, industry, and power. In the action plan, low-carbon power generation plays a critical role:
reducing overall power sector emissions, while enabling beneficial electrification of transportation and
buildings. Thus, achieving the requirements of LD 1494 are not only essential for compliance with the law
– but will also ensure that overall economy-wide decarbonization is achieved.
The LD 1494 RPS targets give Maine one of the most ambitious RPS targets in the country. It is designed to
spur investment in new renewables while also incentivizing existing resources to generate and contribute
RECs to meeting the state’s RPS.
The majority of Maine’s electric grid is operated by ISO-NE, 3 an independent, non-profit Regional
Transmission Organization (RTO) that operates a regional wholesale power market. In 2020, Maine’s share
of ISO-NE’s annual load, which includes all six New England states, was 10%.4 Maine’s participation in this
market provides opportunities for coordinated decarbonization activities across the region that could lower
costs and provide benefits to Maine ratepayers. Similar to Maine, the other five New England states—
Massachusetts, Connecticut, New Hampshire, Rhode Island, and Vermont—are pursuing a range of policies
to dramatically reduce GHG emissions and increase renewable energy deployment. These include RPS,
Clean Energy Standards (CES), technology-specific deployment targets, and economy-wide emissions
reduction targets. Each state’s key policies and share of regional load are summarized below:
Massachusetts (MA):
o RPS: MA passed a mandate in 1997 for 35% Class 1 RECs by 2030, with an additional 1%
each year thereafter; results in 55% by 2050. Class 1 RECs are generated by eligible new
renewable resources (those developed after 1997).
o CES: in 2018, MA also passed a CES, which initially required 16% clean energy in 2018,
increasing 2% each year to 80% in 2050. While similar to the RPS, CES compliance can be
achieved with a wider range of technologies, including nuclear, large hydro imports, and
fossil generators with carbon capture and sequestration.
o Technology Specific: MA has mandated that 3,200 MW of offshore wind are procured by
2035.
o Emissions: The Global Warming Solutions Act of 2008 requires the state to set a target of
at least an 80% reduction in economy-wide emissions by 2050, relative to 1990 levels. In
April 2020, this target was increased to net-zero GHG emissions by 2050, including at least
85% direct emissions reductions.
3 About 5% of Maine’s load is in the Northern Maine Independent System Administrator (NMISA). NMISA is connected to the rest of Maine
indirectly through Canada.
4“ISO New England - Energy, Load, and Demand Reports,” accessed January 19, 2021, https://www.iso-ne.com/isoexpress/web/reports/load-
and-demand/-/tree/zone-info.
Maine Renewable Energy Market Goals Assessment 7o Percentage of Regional Load5: 45%
Connecticut (CT):
o RPS: CT passed an RPS mandate in 1998 for 40% Class I RECs by 2030, with an additional
4% from either Class I or Class II resources.
o Technology Specific: CT has mandated that 2,000 MW of offshore wind are procured by
2030.
o Emissions: The Act Concerning Connecticut Global Warming Solutions requires the state
to achieve an 80% reduction in emissions relative to 2001 levels by 2050.
o Percentage of Regional Load: 24%
New Hampshire (NH):
o RPS: NH passed an RPS mandate in 2007 for 25.2% REC procurement by 2030. This is an
aggregate target across renewable resource classes.
o Emissions: The state’s Climate Action Plan outlines a recommended goal of an 80%
reduction in GHG emissions below 1990 levels by 2050.
o Percentage of Regional Load: 10%
Rhode Island (RI):
o RPS: RI passed an RPS mandate in 2004, which escalates from 3% in 2007 to 38.5% in 2035.
o Emissions: The Resilient Rhode Island Act of 2014 set an economy-wide target of 80% GHG
reductions relative to 1990 levels by 2050.
o Percentage of Regional Load: 7%
Vermont (VT):
o RPS: VT passed an RPS mandate in 2015 for 75% by 2032.
o Emissions: The state’s Comprehensive Energy Plan establishes a goal of 80% to 95% GHG
reduction below 1990 levels by 2050.
o Percentage of Regional Load: 4%
5 “ISO New England - Energy, Load, and Demand Reports.”
Maine Renewable Energy Market Goals Assessment 8Figure 1. New England States’ Renewable Portfolio Standards in 2050
New Hampshire
25.2% by 2050
Maine
Goal of 100% by 2050
Vermont
75% by 2050
Massachusetts
55% by 2050
Connecticut
44% by 2050 Rhode Island
38.5% by 2050
As of 2018, Maine had an installed capacity of 4,864 MW6, as shown in Figure 2. Half of this capacity was
fossil fuel based (natural gas and petroleum) and the other half was made up of RPS-eligible resources such
as wind, biomass, wood-fired, solar, and hydroelectric facilities.
6“Maine - State Energy Profile Overview - U.S. Energy Information Administration (EIA),” accessed December 23, 2020,
https://www.eia.gov/state/?sid=ME.
Maine Renewable Energy Market Goals Assessment 9Figure 2. Maine’s installed capacity from 2014-2018
Though half of the state’s installed capacity is fossil based, 75% of Maine’s electricity generation was
obtained from renewable sources, as shown in Figure 3. The four largest sources of electricity generation
in Maine are hydroelectric (33%), wind (25%), natural gas (20%), and wood/biomass (16%). Together, these
supply 94% of Maine’s electricity.7 The rest is supplied by relatively small amounts of petroleum, solar, coal,
and storage.
Figure 3. Maine’s electric generation mix by fuel8
7 “Maine - State Energy Profile Overview - U.S. Energy Information Administration (EIA).”
8Maine Public Utilities Commission, “2019 Annual Report,” February 1, 2020,
https://www.maine.gov/tools/whatsnew/attach.php?id=2074549&an=1.
Maine Renewable Energy Market Goals Assessment 10The amount of wind in the electricity mix has increased over the years, as seen in both installed capacities
and electric generation mix figures. Additionally, the amount of electricity generation from natural gas has
significantly decreased. Over 2019 and 2020, the amount of wind has increased further, spurred on by a
slew of clean energy bills passed into legislation such as the ones described in Section 2.1, among others.
The electric generation mix shown above is not the same as the state's RPS requirements. The RPS is a
mechanism that requires compliance to a renewable standard through REC purchases that represent the
environmental attributes of electric generation.
Renewable Portfolio Standard (RPS) compliance can offer a variety of benefits to states. A transition away
from fossil fuel resources to low- and zero-carbon renewable resources can significantly reduce greenhouse
gas emissions, mitigating the impacts of climate change. This reduction in emissions, including of particulate
emissions from burning fossil fuels, can offer improvements in public health. 9 The growth of the clean
energy sector through policies like the RPS presents economic development opportunities throughout the
associated supply chains, and the potential of innovative solutions to create additional products and
services for the state, regional, and even global markets. The development of clean energy projects can
provide various community benefits, from financial benefits in the form of property or income taxes,
community benefits agreements, and workforce opportunities.10 As the growth progresses, the associated
job creation presents workforce opportunities across a broad range of positions with varying education and
experience requirements. Jobs in the clean energy sector tend to be higher paying for relatively lower
educational requirements – though often requiring training credentials – and are more likely to offer health
care and retirement benefits than the rest of the private sector. 11 While not an inclusive analysis of
associated benefits, this overview is illustrative of the types of benefits associated with growing the clean
energy sector through policies like RPS.
Fossil fuels often experience price volatility that is influenced by a global market. In contrast, renewable
energy generation can provide price stability through its ability to utilize existing non-purchase fuels such
as solar, wind, water, and geothermal after development. The overall costs of building and generating
electricity from renewable sources have shown to be stable or decreasing over time, compared to the
fluctuating costs of fossil fuels. Not only can in-state generation resources provide more stable energy
costs, but the economic benefits and payments for purchase of these sources of energy can stay within the
state, rather than going to out-of-state fossil fuel providers.12 In 2018, Maine spent $4.4 billion on out-of-
state fossil fuels, with the majority of that spending going to out-of-state fossil fuel providers.13 As the state
9
United States Environmental Protection Agency, State and Local Energy and Environment Program. Public Health Benefits per kWh of Energy
Efficiency and Renewable Energy in the United States: A Technical Report. July 2019. Retrieved from
https://www.epa.gov/sites/production/files/2019-07/documents/bpk-report-final-508.pdf
10Maine Governor’s Energy Office. Strengthening Maine’s Clean Energy Economy.
https://www.maine.gov/energy/sites/maine.gov.energy/files/inline-files/StrengtheningMainesCleanEnergyEconomy_Nov92020.pdf
11 https://e2.org/reports/clean-jobs-better-jobs/
12Dan Lieberman and Siobhan Doherty. Commission for Environmental Cooperation. Renewable Energy as a Hedge Against Fuel Price
Fluctuation. 2008. http://www3.cec.org/islandora/fr/item/2360-renewable-energy-hedge-against-fuel-price-fluctuation-en.pdf
13“U.S. Energy Information Administration - EIA - Independent Statistics and Analysis,” accessed February 3, 2021,
https://www.eia.gov/state/seds/.
Maine Renewable Energy Market Goals Assessment 11moves to beneficial electrification and biofuels developed from resources in Maine, these energy dollars
can stay within Maine’s economy.
As Maine transitions to decarbonizing its grid, the state is working to ensure that this transition is equitable
and that it brings benefits to Maine’s most vulnerable communities. To help understand the equity
implications of the renewable portfolios considered in this study’s analysis, AEC conducted an energy equity
assessment alongside the renewable modeling to identify the equity benefits that people in Maine are likely
to gain from the renewable transition and the corresponding equity challenges that need to be
preemptively avoided through careful policy action. AEC developed a Social Vulnerability Index (SVI) for
Maine – an index to identify the state’s most socially vulnerable populations – which provides an equity
lens through which to interpret the analysis results presented in Section 4. It is also useful to contextualize
the equity benefits and challenges that Maine is likely to face during the renewable transition and the
corresponding policy implications, which are discussed in Section 6. This section explains the SVI and the
key takeaway from the SVI analysis as applied to Maine’s current population. The full development of the
SVI can be found in the Appendix.
Vulnerable communities are those that contain populations that are disproportionately burdened by
existing inequities—for example, people of color experience more pollution from fossil fuel generation than
their white counterparts across the United States 14 —and/or lack the capacity to withstand new or
worsening burdens. AEC calculated an SVI for Maine 15 that combines values from six categories of
vulnerability, each expressed as a share of population: children (17 and younger), limited English-speaking
households, older adults (65 and older), people of color, people with disabilities, and low-to-no income
individuals.16
Population shares for the six vulnerable groups are combined into a single measure of vulnerability in each
local area (by counties and “census tracts”17). A higher SVI score (darker color) indicates a greater degree
of vulnerability (see Figure 4). The key takeaway for Maine’s population is:
Vulnerability is not evenly distributed across Maine and the three most socially vulnerable
counties are located in the northern and eastern parts of Maine. Piscataquis and Aroostook
counties in the north, and Washington County in the east (see Figure 4) are the three most socially
vulnerable counties in the state. Large portions of Piscataquis and Aroostook counties are served
by the Northern Maine Independent System Administrator (NMISA) and utilizes electricity
14C.W. Tessum, Inequity in Consumption of Goods and Services Adds to Racial–Ethnic Disparities in Air Pollution Exposure, vol. 116
(Proceedings of the National Academy of Sciences of the United State of America (PNAS, 2019), https://www.pnas.org/content/116/13/6001.
15Note that while the criteria used to calculate Maine’s SVI are widely used in development of similar vulnerable indices, the numerical values of
the SVI calculated in this study are for internal comparison among Maine jurisdictions and are not meant to be compared to ones calculated for
other jurisdictions.
16 Defined as income that is 150 percent of the federal poverty level or less.
17 Census tracts are small statistical subdivisions of a county that are updated prior to each decennial census, and typically have a population
size between 1,200 and 8,000 people, see: U.S.Census Bureau n.d, Glossary, n.d., https://www.census.gov/programs-
surveys/geography/about/glossary.html#par_textimage_13.
Maine Renewable Energy Market Goals Assessment 12predominantly from New Brunswick rather than Maine. Washington County is served by Eastern
Maine Electric Cooperative and Versant Power.
Figure 4. Maine Social Vulnerability Index18
18
U.S. Census Bureau, 2019 American Community Survey 1-Year Estimates. “Earnings in the Past 12 Months” (Table S2001), “Limited English
Households” (Table S1602), “Disability Characteristics” (Table S1810), “Age and Sex” (Table S0101), “Race and Population (Table B02001).
Maine Renewable Energy Market Goals Assessment 133 Modeling and Scenario Analysis Approach
3 Modeling and scenario analysis approach
This study’s analysis identifies potential least-cost renewable resource portfolios under a range of
assumptions regarding policy and market conditions. This section describes the modeling approach used in
this study, the scenarios evaluated, and key modeling assumptions.
The model used in this study is a spreadsheet tool that aims to extract portfolios that meet Maine’s REC
needs over the next decade. The model is not meant to be a power-flow tool that analyzes the operational
reliability of the resultant portfolios. The focus is, rather, on defining multiple scenarios, determining
portfolios that are policy compliant across those scenarios, and understanding the economic and policy
implications of such portfolios.
The goals of the modeling approach are: 1) to identify the need for renewables to meet future policy goals
(referred to as the Renewable Net Short (RNS) in this study); 2) to curate a set of candidate renewable
resources to fill the identified need (the “Renewable Supply Curve”); and 3) to select the least-cost portfolio
from the renewable supply curve to fill the identified need. This approach is illustrated in the ‘Model Logic’
portion of the model schematic shown in Figure 5. A variety of inputs are needed to develop both the RNS
and the Renewable Supply Curves. Key inputs are shown in the ‘Inputs’ section of the schematic. In
particular, a demand forecast, an RPS target, and existing renewables all go into establishing the RNS.
Figure 5. Model SchematicThe model calculates the “net cost” for each candidate resource, taking the following factors into account:
Cost of the resource;
An estimate of the transmission upgrades (if any) needed to interconnect and deliver the resource;
Energy value of the resource; and
Capacity value of the resource.
Once the net cost has been calculated for each resource, the model fills in the RNS with a portfolio of
resources19 that, together, have the lowest total cost to the system while meeting the RPS policy goals and
scenario parameters. More details of the assumptions of the model are given in Section 3.3.
The analysis studied six scenarios: 1) a base scenario that assumed current market trends through 2030
and 2) five scenarios that varied key input assumptions from the base scenario to explore how renewable
resource portfolios and their costs change under plausible future conditions. The list of scenarios
considered in this analysis is shown in Table 1; each is described in further detail below. The input
assumptions for these scenarios were derived from discussions with stakeholders and publicly available
data sets.
Table 1. Scenarios studied in this report
Scenarios
Policy-compliant Business-As-Usual (BAU) case; uses current trends through 2025 and
1. Base Case then meets need with least cost resources after including land use restrictions; lower
loads tested as a sensitivity
2. Unconstrained Land
Similar to Base Case without additional land-use restrictions imposed
Use
3. High Offshore Wind Assumes the addition of up to 1 gigawatt (GW) of offshore wind by 2030
4. Existing Assumes only existing onshore transmission can be used to deliver resources to meet
Transmission the RPS
5. Regional Scenario where Maine coordinates with the broader New England region through the
Coordination use of out-of-state RECs and shared onshore transmission costs
A diverse portfolio consisting of onshore wind, offshore wind, utility solar paired with
6. Diverse Portfolio storage, distributed generation resources, out-of-state RECs, and mechanisms for cost-
sharing of onshore transmission by 2030
All scenarios are consistent with existing clean energy and decarbonization policy in Maine and include load
growth from building and vehicle electrification likely needed to achieve Maine’s economy-wide GHG
19
In addition to in-state resources, in some scenarios, out of state RECs are also eligible to meet the RNS. Out of state RECs that are currently
meeting a portion of Maine’s REC requirements are assumed to continue doing so through the study horizon.
Maine Renewable Energy Market Goals Assessment 15emissions targets.20 In addition, the scenarios assume that some existing hydroelectric facilities,21 planned
procurements of Class IA resources,22 and a percentage of distributed resources procured per Maine law
or in executed NEB agreements with Central Maine Power (CMP) or Versant Power will all qualify for and
contribute to the state’s RPS targets.23 Any remaining Class I/IA REC need is assumed to be met from either
new in-state generation or out-of-state RECs24. Identifying these new resources is the focus of this study.
For the purposes of this study, Class II RECs are assumed to continue to be available to Maine and are not
expected to drive significant investment in new renewables in the short term. An overview of each scenario
is provided in Sections 3.2.1 through 3.2.6 that follow.
This scenario represents a future in which Maine meets its RPS targets through least-cost resources, based
on current market trends and policy implemented in Maine and the broader New England region. This
scenario allows the development of onshore resources as well as offshore wind resources to the extent
they are cost effective during the 2020-2030 window.
To construct realistic estimates of potential renewable availability within Maine, this analysis starts with
the solar and wind technical potential values available from the National Renewable Energy Laboratory’s
(NREL’s) Regional Energy Development System (ReEDS) model, which represents all potential resources
available for development after land-use screens that remove land area that is either protected or already
developed (e.g., national parks or cities).25 However, NREL’s total resource potential likely still far exceeds
what can feasibly be developed in the state. Thus, this analysis adds additional land use constraints to
reflect the practical challenges around land use for renewable development and the impact this would have
in reducing the resource potentials of renewable resources. This scenario layers on restrictions that limit
onshore wind technical potential to 2% farmland and 2% forest, 26 and utility-scale solar to 4% of
20
Jamie Hall et al., “Volume 3: Maine Emissions Analysis Consolidated Energy Sectors Modeling Results,”
https://www.maine.gov/future/sites/maine.gov.future/files/inline-files/ERG_MCC_Vol3_MaineEmissionsAnalysisSynapse_11-9-2020.pdf.
21 “MRS Title 35-A, Section 3210. Renewable Resources,” n.d., https://mainelegislature.org/legis/statutes/35-A/title35-Asec3210.html.
22 “S.P. 457 - L.D. 1494: An Act to Reform Maine’s Renewable Portfolio Standard,” 2019.
23 “CMP Response to Docket No. 2020-00199” (Central Maine Power, 2020), https://mpuc-
cms.maine.gov/CQM.Public.WebUI/MatterManagement/MatterFilingItem.aspx?FilingSeq=109306&CaseNumber=2020-00199; “Versant
Response to Docket No. 2020-00199” (Versant Power, 2020), https://mpuc-
cms.maine.gov/CQM.Public.WebUI/MatterManagement/MatterFilingItem.aspx?FilingSeq=109323&CaseNumber=2020-00199.
24 Depending on scenario definitions. See sections 3.2.1 - 3.2.6 for more detail.
25The resource potential within NREL ReEDS for solar includes land located on large parcels outside urban boundaries, excluding federally
protected lands, inventoried “roadless” areas, U.S. Bureau of Land Management areas of critical environmental concern, and areas with slope
greater than 5%. For onshore wind, the resource potential excludes areas considered unlikely to be developed for environmental or technical
reasons: federal and state protected areas (e.g., parks, wilderness areas, and wildlife sanctuaries), areas covered by water, urban areas,
wetlands, airports, and rough terrain. Areas classified as non-ridge-crest forest, U.S. Forest Service and U.S. Department of Defense lands, and
state forests are 50% excluded.
26 2% of farmland corresponds to 26,000 acres and 2% of forest land corresponds to 403,000 acres.
Maine Renewable Energy Market Goals Assessment 16farmland.27,28 This report is not suggesting the implementation of these specific land-use screens but is
including these screens to better understand land use restrictions’ overall impact on development
opportunities.
Currently, the standard load assumptions represent high levels of beneficial electrification consistent with
Maine achieving its GHG emissions goals. However, it may be possible for Maine to achieve these goals
with lower load growth through strategies such as more aggressive building weatherization, reduced
vehicle miles traveled (VMT), grid flexibility or demand management. To test such a future, a Low Load
sensitivity on the Base Case was evaluated to investigate the influence of different load trajectories on the
resource and transmission build and costs.
This scenario investigates the impact of removing the additional land use restrictions on utility-scale
renewables, particularly onshore wind and utility-scale solar construction. This is meant as a mechanism to
better understand what additional constraints are binding if these additional land use restrictions are
removed.
The Gulf of Maine is characterized by its vast offshore wind resource, and up to 5 GW of offshore wind
development have been contemplated by 2030.29 The high offshore wind scenario studies the impact of
including up to 1 GW of offshore wind in Maine’s resource portfolio to meet the 2030 RPS. This includes up
to 144 MW from the State of Maine-proposed floating offshore wind research array beginning in 2025.30
Offshore wind costs are projected to drop, especially beyond 2030 as technology advances (see Section
3.3.2 for more details). As a result, offshore wind is expected to play a greater role in the 2030 and beyond
timeline.
Transmission was overwhelmingly identified by stakeholders in this study’s public comment process as a
key obstacle to renewable energy development in Maine. At the same time, transmission projects regularly
face a number of siting, permitting, land-use, legal, and environmental challenges. This scenario is meant
to simulate an extreme scenario where no onshore transmission is built in the state. The resultant portfolio
will point to an alternative mix of resources that could be used to meet the state’s RPS requirements in
27These indicative numbers were previously used in another New England renewable transition study and those numbers in turn are loosely
derived by back-calculating the total percentage of available land that would be used for renewable development in California that would
enable the state to reach its 100% by 2045 clean-energy goal (https://www.ethree.com/wp-
content/uploads/2019/06/E3_Long_Run_Resource_Adequacy_CA_Deep-Decarbonization_Final.pdf)
28“Net-Zero New England: Ensuring Electric Reliability in a Low-Carbon Future” (Energy and Environmental Economics, Inc., 2020),
https://www.ethree.com/wp-content/uploads/2020/11/E3-EFI_Report-New-England-Reliability-Under-Deep-Decarbonization_Full-
Report_November_2020.pdf.
29“Final Report of the Ocean Energy Task Force,” 2009, https://umaine.edu/offshorewindtestsite/wp-
content/uploads/sites/303/2017/02/OETF_FinalReportAppendices.pdf.
30“Gulf of Maine Floating Offshore Wind Research Array | Governor’s Energy Office,” accessed January 5, 2021,
https://www.maine.gov/energy/initiatives/offshorewind/researcharray.
Maine Renewable Energy Market Goals Assessment 17such an extreme scenario. The Base Case and this scenario are meant to represent two extreme
transmission futures – one where onshore transmission face no significant hurdles and another where it is
extremely challenging to build more onshore transmission.
As noted above, stakeholders have identified that transmission can be a key component of renewable
energy development, particularly in Maine, where the transmission system experiences significant
congestion and constraints that impact the ability and cost of building new generation in the state. In this
scenario, building new transmission can be facilitated by sharing costs between Maine and out-of-state
entities, such as other New England states. Such cost sharing is motivated by the fact that Maine is currently
already a net exporter of energy31 and its existing solar and wind resources sell their RECs out-of-state.32
Given the role today of Maine’s current renewable generation in supporting other New England states’ RPS
requirements and energy needs, there is continued potential for Maine’s in-state resources to support not
only its own but also New England’s renewable energy requirements, facilitated by sharing the costs of
transmission upgrades in Maine between Maine itself and the rest of New England. This type of approach
has the potential to offer lower-cost options to meet Maine’s goals, as well as additional economic,
community, and workforce benefits for Maine communities.
Further, Maine currently partially relies on RECs produced by out-of-state biomass generators to meet its
REC needs. 33 Throughout the study period, Connecticut is planning to reduce the number of biomass
generators that can qualify for its Class I requirement. 34 This creates the possibility that Maine could
purchase additional Class I RECs on top of those it acquires today, instead of building new generation in-
state to meet its renewable goals.
In this scenario, the effect of two elements of regional coordination on Maine’s compliance with its
renewable energy requirements are modeled: 1) cost-sharing of transmission upgrades with the rest of
New England, and 2) the potential availability of additional out-of-state RECs for purchase by Maine (in
addition to those available today).
Informed by the results of the five previous scenarios, a hand-crafted diverse portfolio is modeled. This
portfolio consists of onshore wind, offshore wind, utility solar paired with storage, distributed generation
resources, out-of-state RECs, and mechanisms for cost sharing of onshore transmission. While this is not a
suggestion of the ideal resource mix, it provides insight into the downstream portfolio and cost impacts of
a mixed resource scenario.
31
“Maine - State Energy Profile Overview - U.S. Energy Information Administration (EIA).”
32 “Annual Report on New Renewable Resource Portfolio Requirement: Report for 2017 Activity” (Maine Public Utilities Commission, 2019).
33 “Annual Report on New Renewable Resource Portfolio Requirement: Report for 2017 Activity.”
34“Connecticut to Phase down Value of Biomass, Landfill Gas RECs | Biomassmagazine.Com,” accessed January 6, 2021,
http://biomassmagazine.com/articles/15065/connecticut-to-phase-down-value-of-biomass-landfill-gas-recs.
Maine Renewable Energy Market Goals Assessment 18You can also read