Integration of renewable energies in NZEBs - AZEB
←
→
Page content transcription
If your browser does not render page correctly, please read the page content below
Integration of
renewable energies
in NZEBs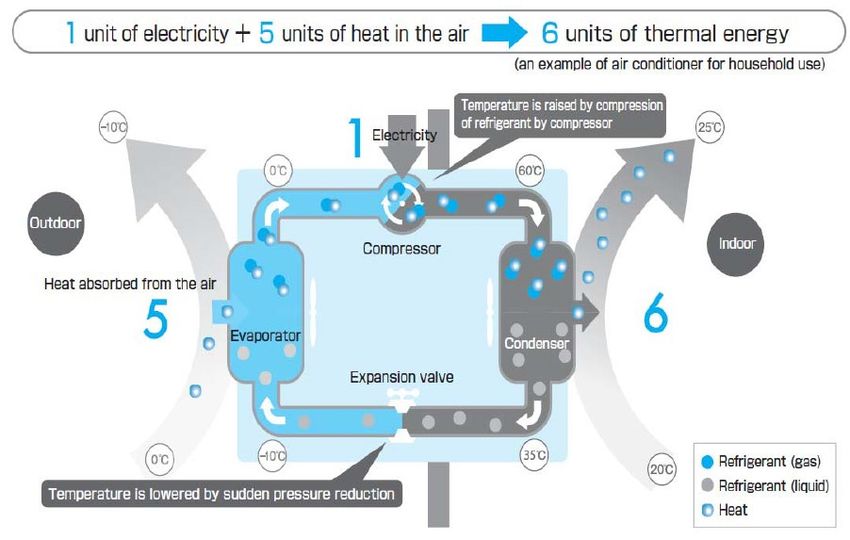
Integration of renewable
                     energies in NZEBs

                                                   Work            (number and title)
                                                   package

                                                   Deliverable     D1.4 | Integration of renewable energies in NZEBs

                                                   Project title   Affordable Zero Energy Buildings

                                                   Responsible     TECNALIA

                                                                   Beatriz Sanchez, Iñigo Urra, Julen Hernández, Mercedes
                                                                   Gómez de Arteche, Patxi Hernández (TECNALIA)
                                                   Author(s)
                                                                   *plus national inputs for specific renewable technologies supplied by
                                                                   corresponding AZEB partners

                                                   Date of issue   15/01/2018, revised 17/12/2019

                                                   Status          Final

                                                   Security        public

Page 2

1.4 | Integration of renewable energies in nZEBs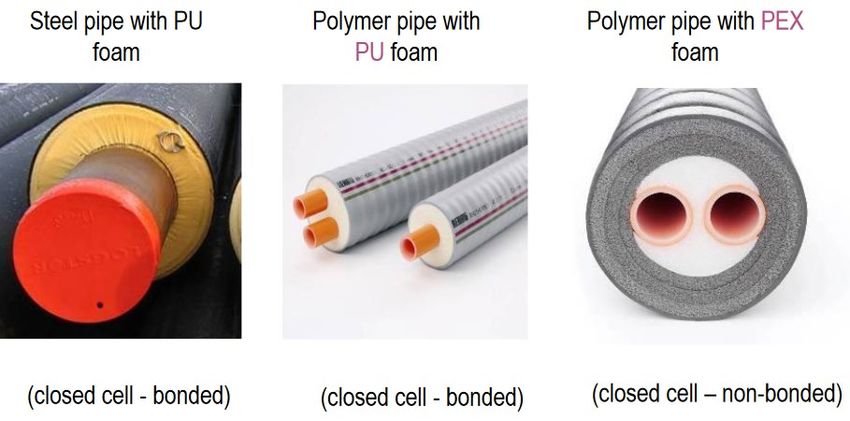
Index
Index ..................................................................................................... 3
List of figures .............................................................................................. 4
List of tables ............................................................................................... 6
1|Introduction ............................................................................................ 7
1.1 | Summary ...................................................................................................... 7
1.2 | Objectives of the report .............................................................................. 7
1.3 | Contributions of the partners ..................................................................... 8
2 | How renewable energy contributes to NZEBs? ................................. 9
3 | Building level renewable energies ..................................................... 11
3.1 | Photovoltaic solar technology ................................................................... 11
3.2 |Biomass .......................................................................................................21
3.3 | Heat Pumps ............................................................................................... 34
3.4 | Solar Thermal............................................................................................ 46
4 | Integration of renewable energy technologies into district energy
systems. .................................................................................................... 56
4.1 | District heating and cooling system for integration of renewable energy
sources .............................................................................................................. 56
4.2 | Waste heat recovery ................................................................................. 57
4.3 | Biomass ..................................................................................................... 59
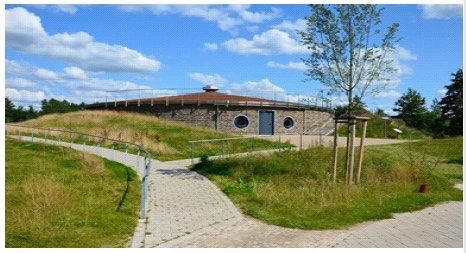
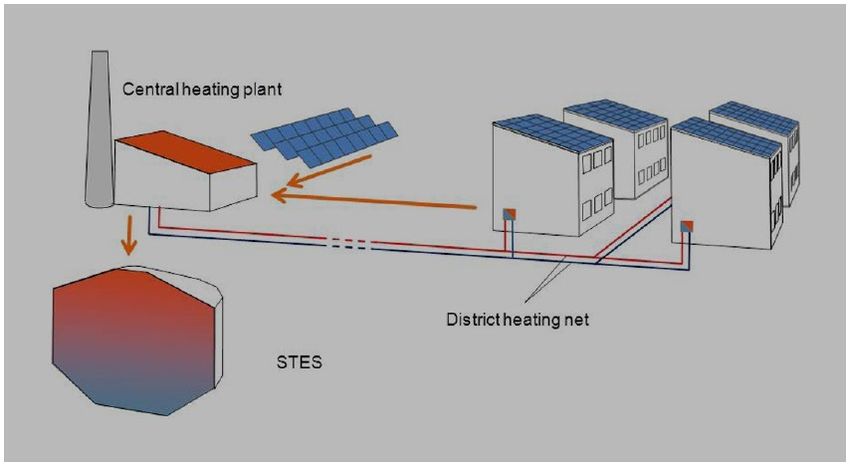
4.4 | Seasonal Thermal Energy Storage (STES) ............................................... 62
4.5 | Large heat pumps ..................................................................................... 66
4.6 | Solar thermal ............................................................................................ 68
5 | Discussion of integration of renewable energies in nZEBs in
stakeholder workshops ........................................................................... 71
6 | Consideration of RES within the AZEB methodology ..................... 72
6 | References ........................................................................................... 74
Page 3
1.4 | Integration of renewable energies in nZEBs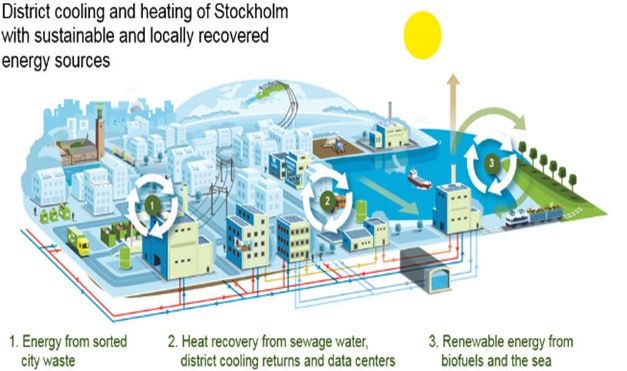
List of figures
Figure 1 Overview of possible renewable supply options which were found in descriptions for
nearly zero energy buildings. [01]...................................................................................................... 9
Figure 2 Example of assessment boundaries from EN ISO 52000-1 ................................................ 10
Figure 3 Load match index as a function of the time step for balancing [1] ................................... 11
Figure 4 Common photovoltaic installation..................................................................................... 12
Figure 5 Percentage of annual installed capacity in Germany ........................................................ 19
Figure 6 Global weighted average total system costs breakdown of utility-scale solar PV systems,
2009-2025 [09] ................................................................................................................................. 20
Figure 7 850kW biomass boiler for district heating application [10] .............................................. 22
Figure 8 250kW medium size biomass boiler and storage bunker [10]. ......................................... 22
Figure 9 250kW biomass boiler for a single-family house and polypropylene silos for pellet (2-5t
capacity) [10].................................................................................................................................... 23
Figure 10 Application of woody biomass [11]. ................................................................................ 24
Figure 11 Biomass boiler application to cover all the demand [13]. ............................................... 25
Figure 12 Cascade installation scheme for high demands [13]. ...................................................... 25
Figure 13 Pellet biomass boiler [14]. ............................................................................................... 26
Figure 14 Evolution of the installed biomass boilers ≤ 50kW in Spain [12]..................................... 32
Figure 15 Evolution of the installed biomass boilers > 50kW in Spain[12]. .................................... 32
Figure 16 Evolution of the installed stoves in Spain [12] ................................................................. 32
Figure 17 Mechanism of air source heat pump [19]........................................................................ 34
Figure 18 Typical current efficiency ranges for heat pumps in heating and cooling modes by
technology [26] ................................................................................................................................ 35
Figure 19 Heat pump application areas [21].................................................................................... 36
Figure 20 Market evolution during the last years, by technology (Unit/year) Development of heat
pump sales in Europe 2005–2014, by category [21] ....................................................................... 42
Figure 21 RES from 2014 heat pump stock, by country (in TWh) [21]. ........................................... 43
Figure 22 Actual trend of renewable Energy from heat pumps (in blue) compared with the
National renewable Energy action plans NREAP (in Ktoe) [21]. ...................................................... 45
Figure 23 Temperature classification of solar thermal energy ........................................................ 47
Figure 24 Components of a solar thermal panel. ............................................................................ 49
Figure 25 Collector production costs development for high – efficient flat plate collector panel of
about 2.2 to 2.5 m2 gross collector area manufactured in Europe based on market expectations
of the National Renewable Energy Action Plans (NREAPs).[23] ...................................................... 50
Figure 26 Solar thermal market in Germany from 2005 to 2014.[29] ............................................. 53
Figure 27 Solar thermal market in Spain from 2005 to 2014. [29] .................................................. 54
Figure 28 Analysis of 2020 targets for solar thermal energy [23] [23]. ........................................... 54
Figure 29 Solar thermal production in Spain from 2009 to 2016 [27]............................................. 55
Figure 30 District cooling and heating of Stockholm with sustainable and locally recovered energy
sources.[30] ...................................................................................................................................... 57
Figure 31 Layout of district cooling using free cooling with sea water.[30] .................................... 57
Figure 32 Layout of district cooling using free cooling with sea water.[31] .................................... 58
Figure 33 Conceptual scheme for waste heat recovery in an steel mill for electricity and district
heat generation.[32] ........................................................................................................................ 59

Page 4

1.4 | Integration of renewable energies in nZEBs
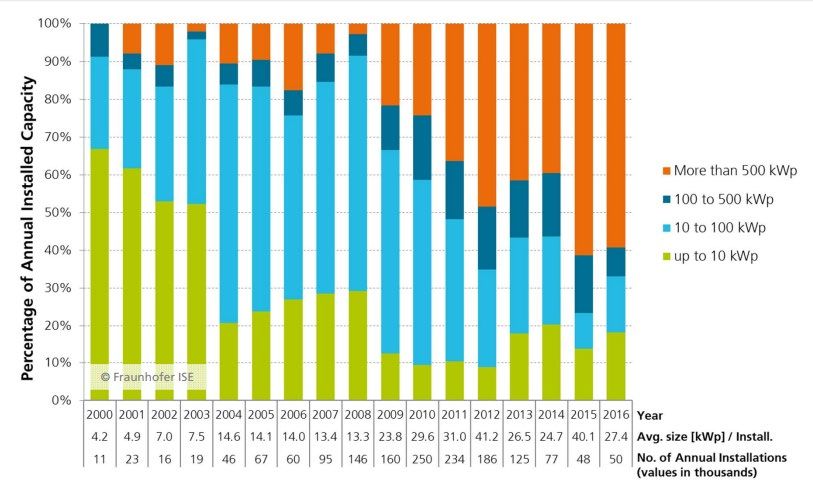
Figure 34 Circuits in a district heating system.FOREST. A guide specifying biomass heating
systems. FOREST stands for “Fostering Efficient long term Supply partnerships”. The project is
funded by the European Commission through Intelligent Energy Europe (IEE).
www.forestprogramme.com.[34] .................................................................................................... 60
Figure 35 Twin pipes for a district heating network. [34]................................................................ 61
Figure 36 Options of pipe material for district heating networks.[35]............................................ 61
Figure 37 Domestic heat interface unit. Envinox. [34] .................................................................... 62
Figure 38 Solar heat supply in the summer [36] .............................................................................. 62
Figure 39 Heating demand in the winter [36].................................................................................. 63
Figure 40 Historical development of STES [36]. .............................................................................. 63
Figure 41 Schematic diagram of STES system [36] .......................................................................... 64
Figure 42 Seasonal thermal energy storage in Hamburg (2010) [36].............................................. 64
Figure 43 STES system integrated within a district heating [36]. .................................................... 65
Figure 44 Central Solar Heating Plant with Diurnal Storage (CSHPDS) [40] .................................... 68
Figure 45 Central Solar Heating Plant with Seasonal Storage (CSHPSS) [40] .................................. 68
Figure 46 Installed solar thermal energy plants in Europe [39]. ..................................................... 69
Figure 47 Okotoks’ facility’s monthly performance [39] ................................................................. 70

Page 5

1.4 | Integration of renewable energies in nZEBs
List of tables
Table 1 Standard cost associated to PV technology in Bulgaria ...................................................... 14
Table 2 Standard cost associated to PV technology in France ........................................................ 14
Table 3 Standard cost associated to PV technology in Germany .................................................... 15
Table 4 Standard cost associated to PV technology in Italy ............................................................ 15
Table 5 Turnkey Prices of Typical Applications in Spain [06] ........................................................... 16
Table 6 Cost of residential roof PV system < 10kW in Spain [06] .................................................... 16
Table 7 Biomass boiler efficiencies [10]........................................................................................... 23
Table 8 Cost associated to biomass in France ................................................................................. 27
Table 9 Cost associated to biomass technology in Italy [15] ........................................................... 28
Table 10 Biomass prices in Spain [10]. ............................................................................................ 28
Table 11 Main economic parameters to value a biomass heating installation for a typical
apartment in Spain [16] ................................................................................................................... 28
Table 12 Main economic parameters to value a biomass centralized installation in Spain [17] . .. 29
Table 13 Installation cost of biomass boilers [10] ........................................................................... 29
Table 14 Cost associated to HP technology in Bulgaria ................................................................... 38
Table 15 Cost associated to HP technology in France ..................................................................... 38
Table 16 Cost associated to HP technology in Italy ......................................................................... 38
Table 17 Cost associated to HP technology in Spain ....................................................................... 39
Table 18 Cost associated to solar thermal in France. ...................................................................... 50
Table 19 Cost associated to solar thermal in Italy. .......................................................................... 50
Table 20 DH system average production data. [32] ....................................................................... 59
Table 21 Technical data of different thermal storage technologies.[36] ........................................ 66
Table 22 Typical Heat pump´s cost and COP data for different ranges of temperature network
[37] ................................................................................................................................................... 67
Table 23 Approximation of the economic performance, GHG emissions and regulatory barriers
and risks of renewable energy technologies ................................................................................... 72

Page 6

1.4 | Integration of renewable energies in nZEBs
1|Introduction

                                                   1.1 | Summary
                                                   AZEB (Affordable Zero Energy Buildings) is a European funding project framed
                                                   into H2020–Energy efficiency program. The AZEB project focuses on the lifecycle
                                                   cost reductions of new nZEBs (Nearly Zero Energy Buildings) through integral
                                                   process optimization in all construction phases. AZEB aims to deliver a general
                                                   methodology and to provide supportive structures and material that will
                                                   encourage the relevant stakeholders in the building sector to actually adopt
                                                   available solutions and cultivate a cost-efficient and highly performing (in terms of
                                                   energy need, comfort, environmental impact) nZEB-practice.
                                                   This deliverable summarizes the main solutions that are on the market for
                                                   renewable energies at building and district level. State of the art solutions are
                                                   analysed and information on each solution is presented regarding technology
                                                   description, performance, scale of application, price (analysed for the different life
                                                   cycle phases whenever possible), market share and trends, and related regulation.

                                                   1.2 | Objectives of the report

                                                   The information in this report is intended to serve as input for the development of
                                                   the AZEB methodology during the AZEB project. Gained insights on the available
                                                   solutions for renewable energy sources as well as the various criteria which are
                                                   relevant when selecting these, will be combined with the other relevant solution
                                                   sets within AZEB to create a common methodology. Also, the information
                                                   gathered in this report will in time be transformed into (e-)learning material for
                                                   the AZEB online learning environment and possibly for live trainings and
                                                   workshops on the AZEB methodology.

                                                   The report can however already be used stand-alone. The basic information
                                                   condensed in the report should help decision makers (in particular building
                                                   developers, project managers and designers) at the initial stages of the project,
                                                   both to help setting requirements for the building and to aid on the conception
                                                   and selection of building alternatives.

                                                   This report describes existing technological solutions for renewable energies,
                                                   including their current regulatory and market structure, in order to explore their
                                                   potential and put in perspective the opportunities for further integration of cost-
                                                   effective renewable energy technologies into nZEBs.

                                                   Life cycle costs evaluation of some of the solutions with data from the different
                                                   countries are presented whenever possible, in order to facilitate initial
                                                   comparisons of up-front financing efforts and conditions with exploitation and
                                                   operation benefits. Regulatory and market conditions for the integration of
                                                   renewables are also part of the analysis, where data was available, in order to give
                                                   information regarding potential barriers and cost-effectiveness of the solutions for
                                                   integration of renewables.

Page 7

1.4 | Integration of renewable energies in nZEBs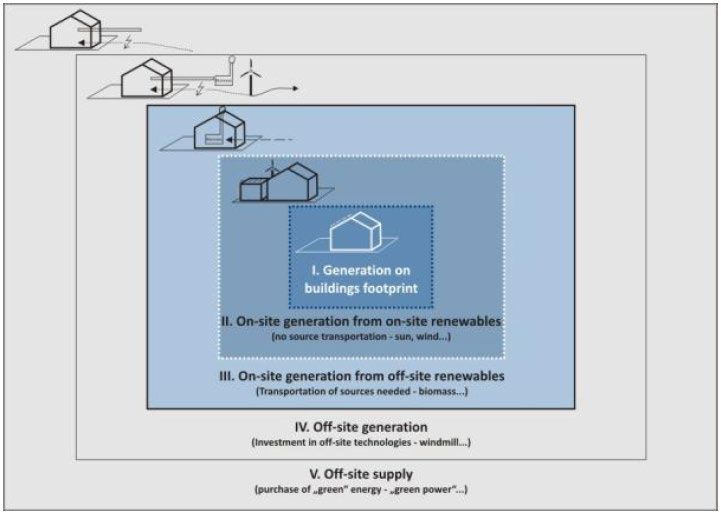
1.3 | Contributions of the partners

   No         Short name          Work Planned                                                                          Effort

                                     •     Define a reporting template for renewable technologies, and circulation of
                                           questionnaire to request contributions from the partners.
                                     •     Integrate responses and discussion of potential technologies and their
                                           application depending national characteristics (climate, building codes,
                                           regulation, building typologies, technology market etc.), and national
                                           regulations and energy market.
   3          TECNALIA
                                     •     Prepare input (information notes, presentation) for discussion in LEAN
                                           workshops.
                                     •     Extract conclusions from LEAN workshops regarding renewable energy
                                           technologies
                                     •     Prepare D1.4 Integration of renewable energies in nZEBs

                                     •     Collect information and respond to questionnaire from TECNALIA regarding
                                           national characteristics for renewable energy, and regulatory and market
   5          PHI                          characteristics.

                                     •     Collect information and respond to questionnaire from TECNALIA regarding
   6          ARMINES                      national characteristics for renewable energy, and regulatory and market     0.5
                                           characteristics.

                                     •     Collect information and respond to questionnaire from TECNALIA regarding
   8          EERG                         national characteristics for renewable energy, and regulatory and market
                                           characteristics.

                                     •     Collect information and respond to questionnaire from TECNALIA regarding
                                           national characteristics for renewable energy, and regulatory and market
   7          OKB                          characteristics.

                                     •     Collect information and respond to questionnaire from TECNALIA regarding
                                           national characteristics for renewable energy, and regulatory and market
   1          DNA                          characteristics.

Page 8

1.4 | Integration of renewable energies in nZEBs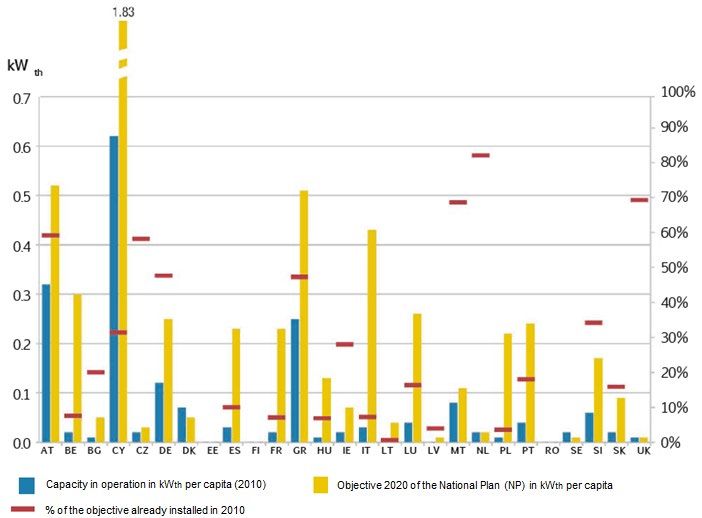
2 | How renewable energy contributes to NZEBs?
                                                   The AZEB project has been developed under the framework of the Energy
                                                   Performance Building Directive (EPBD) in order to promote the improvement of
                                                   the energy performance of buildings within the EU through cost-effective
                                                   measures.

                                                   By the year 2021, all new buildings in the European Union shall be nearly Zero
                                                   Energy Buildings (nZEB). Also globally, in North America and East Asian countries
                                                   such as Japan, the objective of net Zero Energy Buildings shall be implemented
                                                   within timeframes between 2020 and 2030. However, the definition of nZEB in the
                                                   EU and other countries is still under development and existing definitions are not
                                                   harmonised yet, but vary both in criteria and limits. According to article 2 of the
                                                   EPBD, “‘nearly zero-energy building’ means a building that has a very high energy
                                                   performance, as determined in accordance with Annex I. The nearly zero or very
                                                   low amount of energy required should be covered to a very significant extent by
                                                   energy from renewable sources, including energy from renewable sources
                                                   produced on-site or nearby”
                                                   While this definition is quite ambiguous, and is currently under discussion under
                                                   the revision process of the EPBD, it already highlights a key issue when discussing
                                                   renewable energy integration in new buildings, which is the balance between
                                                   building and system efficiency on the one hand and renewable energy production
                                                   on the other hand. The extent to which building energy needs through passive
                                                   measures is reduced is a fundamental pre-requisite for nZEB, and systems
                                                   efficiencies and the need for renewable energies should complement the required
                                                   energy needs to achieve a near-zero energy balance.
                                                   Countries might have however different consideration of the various renewable
                                                   energies in the total building energy balance. The assessment boundary and the
                                                   accountancy methods for primary energy are of key importance on the analysis of
                                                   how renewable energies can be used to satisfy thermal or electricity demands of
                                                   buildings. Different renewable energy supply options exist, as described by
                                                   Marszal et al [02] (Figure 1), which can be generated on-site and off-site.

Figure 1 Overview of possible renewable supply options which were found in descriptions for nearly zero energy buildings. [01]

Page 9
1.4 | Integration of renewable energies in NZEBs
In this report, the generation of renewable energy on the building footprint and
                                                   on-site will be analysed, in line with the AZEB project of cost reduction through
                                                   construction processes of new buildings.
                                                   District solutions are also analysed as grouping buildings offer new possibilities for
                                                   renewable energy generation and optimization, and for interaction with the
                                                   electricity grid. This approach is also in line with the standard EN ISO 52000-1
                                                   Energy Performance Of Buildings - Overarching EPB Assessment - Part 1: General
                                                   Framework And Procedures , where district heating/cooling solutions are within
                                                   boundaries for on-site assessment. (see figure 2).

      Figure 2 Example of assessment boundaries from EN ISO 52000-1

                                                   While the calculation of primary energy factors of the different energy sources is
                                                   not going to be discussed in this report, it has to be noted that it is a key point of
                                                   discussion within the EPBD revision, and also on the energy efficiency and
                                                   renewable energy directives.
                                                   As it is described in the EN ISO 52000-1 standard, “energy weighting factors (e.g.,
                                                   primary energy, CO2) are defined for each energy flow delivered or exported through the
                                                   assessment boundary, taking into account the origin for delivered and the destination of
                                                   exported energy”.
                                                   The interaction with the electricity grid will also be discussed, particularly in
                                                   relation of the regulatory situation for exchanging electricity from building
                                                   integrated renewable energies. As it can be observed in Figure 2, depending on the
                                                   time step for the electricity balance (and of course on the particular energy demand
                                                   characteristics and renewable electricity produced), the load matching of demand
                                                   and production can be reduced to 25% with hourly balance. How electricity
                                                   markets are regulated to deal with this single issue is vital for the economic
                                                   viability of building integrated renewable electricity generation,

Page 10
1.4 | Integration of renewable energies in NZEBs
Load match index (%)
1
0,75
0,5
0,25
0
Annual Monthly Daily Hourly
Figure 3 Load match index as a function of the time step for balancing [1]
3 | Building level renewable energies
This part included a description of renewable energy technologies at building level
and seeks to compare the different aspects existing between different countries.
3.1 | Photovoltaic solar technology
The photovoltaic effect (the physical phenomenon responsible for converting light
to electricity) is exploited by Photovoltaic solar technologies in order to generate
electricity. Light shining on a semiconductor generates electron-hole pairs that are
separated spatially by an internal electric field created by introducing special
impurities into the semiconductor on either side of an interface known as a p-n
junction.
A PV System consists in one or several PV modules, typically rate between 50W and
350W,connected to either an electricity network (grid-connected PV) or to a series
of loads (off-grid). It comprises various electric devices aiming at adapting the
electricity output of the module(s) to the standards of the network or the load:
inverters, charge controllers or batteries. A wide range of mounting structures has
been developed especially for BIPV; including PV facades, sloped and flat roof
mountings, integrated (opaque or semi-transparent) glass-glass modules and “PV
roof tiles”.. In general, cells can be classified as either wafer-based crystalline
(single crystal and multicrystalline silicon), compound semiconductor (Thin-film),
or organic.
Photovoltaic (PV) systems can be grouped into stand-alone systems and grid
connected systems. In standalone systems the solar energy yield is matched to the
energy demand. Since the solar energy yield often does not coincide in time with
the energy demand from the connected loads, additional storage systems
(batteries) are generally used. If the PV system is supported by an additional power
source, this is known as a photovoltaic hybrid system.
Page 11
1.4 | Integration of renewable energies in NZEBsFigure 4 Common photovoltaic installation.
Figure 3 shows a PV installation using electric batteries to store electrical energy
and this electrical energy can be converted to DC or AC using an inverter. In this
example, photovoltaic systems are not connected to the electrical grid, which is
not the most common solution. While the connection to the grid is technically very
easy, nevertheless in some countries, the administrative barriers are more difficult
to reach than the technical solutions.
3.1.1 | Scale of application
Photovoltaic technology based solutions are successful from very small scale
applications (to supply batteries of all kind of electronic devices), to very large PV
power stations of larger than 1GW. Modularity and scalability is one of its main
advantages, and for buildings PV installations can be design and optimized to
specific electrical loads.
3.1.2 | Main applications
In nZEBs, the main application of PV technology consists in the electrical
generation for self-consumption and to export to the electricity grid. For self-
consumption, generation could be used to many appliances and electrical devices,
lighting, and in recent times, increasingly for building heating, cooling and DHW
production when coupled to a heat pump.
The load matching between electricity demand and production is a key issue for
the system design and for the economic viability of the system. While solving the
time gaps between PV production and building electricity use could be done
through on-site electrical storage, it is generally much more cost-efficient to use
the electricity grid as regulation element. This way , the excess of the PV generation
injected to the grid, and when PV generation is not enough to cover the building
electricity demand, grid can supply to match building requirements.
3.1.3 | Limitations of its application
Three key limitations for photovoltaic technology can be highlighted.
Page 12
1.4 | Integration of renewable energies in NZEBsFirst of all, the surface limitation. Surface availability is not always guaranteed and
sometimes this limitation could affect the design of the system and the covered
solar rate.
The efficiency of the photovoltaic units is the second limitation. Although new
generations of photovoltaic cells are growing in their efficiencies, the values that
can be reached are no very high, (theoretically 30% efficiency rates could be
exceeded but only in multilayer cells)
The last limitation relates to regulatory and administrative uncertainties. In
certain countries, PV installations , which is a handicap for the investors in this
technology.
3.1.4 | Current technologies
Currently, crystalline silicon technologies account for more than 94% of the overall
cell production in the IEA PVPS countries. Single crystal silicon (sc-Si) PV cells are
formed with the wafers manufactured using a single crystal growth method and
have commercial efficiencies between 16% and 25%. Multicrystalline silicon (mc-
Si) cells, usually formed with multicrystalline wafers manufactured from a cast
solidification process, have remained popular as they are less expensive to produce
but are less efficient, with average conversion efficiency around 14-18%. III-V
compound semiconductor PV cells are formed using materials such as GaAs on the
Ge substrates and have high conversion efficiencies of 40% and more. Due to their
high cost, they are typically used in concentrator PV (CPV) systems with tracking
systems or for space applications. Thin film cells are formed by depositing
extremely thin layers of photovoltaic semiconductor materials onto a backing
material such as glass, stainless steel or plastic. Thin-film modules used to have
lower conversion efficiencies than basic crystalline silicon technologies but this has
changed in recent years. They are potentially less expensive to manufacture than
crystalline cells. Thin-film materials commercially used are cadmium telluride
(CdTe), and copper-indium-(gallium)- diselenide (CIGS and CIS). Amorphous and
micro morph silicon (a-Si) used to have a significant market share but failed to
follow both the price of crystalline silicon cells and the efficiency increase of other
thin film technologies. In terms of efficiencies, in 2016, CdTe cells reached 22% in
labs. Organic thin-film PV cells, using dye or organic semiconductors, have created
interest and research, development and demonstration activities are underway. In
recent years, perovskites solar cells have reached efficiencies higher than 20% in
labs but have not yet resulted in stable market products.
3.1.5 | Main advantages
The main advantages of this technology have been summarized below:
- Solar energy is energy supplied by nature – it is thus free and abundant
and can be made available almost anywhere there is sunlight
- Solar Panels cost is currently on a fast reducing track and is expected to
continue reducing for the next years – consequently solar PV panels has
indeed a highly promising future both for economic viability and
environmental sustainability.
- Operating and maintenance costs for PV panels are considered to be low,
almost negligible, compared to costs of other renewable energy systems
- PV panels are totally silent, producing no noise at all; consequently, they
are an adequate solutionfor urban areas and for residential applications.
Page 13
1.4 | Integration of renewable energies in NZEBs- Because solar energy coincides with energy needs for cooling PV panels
can provide an effective solution to energy demand peaks – especially in
hot summer months where energy demand is high.
3.1.6 | Main disadvantages
Among the main disadvantages of this technology, the following have been
highlighted:
- As in all renewable energy sources, solar energy has intermittency issues;
not only being unavailable at night but also during daytime there may be
cloudy or rainy weather.
- Consequently, intermittency and unpredictability of solar energy makes
solar energy panels less reliable a solution to match specific building
load.
- Solar panels efficiency levels are relatively low (between 14%-25%) ,
compared to the efficiency levels of other renewable energy systems, so
the required area is considerable.
- Though PV panels have no considerable maintenance or operating costs,
they are fragile and can be damaged relatively easily; additional
insurance costs are therefore of ultimate importance to safeguard a PV
investment.
3.1.7 | Economic information
The economic information has been collected from the different countries by the
AZEB´s partners.
Bulgaria
Table 1 Standard cost associated to PV technology in Bulgaria
Cost category Value
Initial design cost 450 € installed (for up to 30kWinstalled)
Product cost 900 €/kW installed
Installation cost 200 €/kW installed
Operational energy use revenues ( from 184 €/kW installed year (for up to 5 kWp) 1
electricity sold to the grid)
France
Table 2 Standard cost associated to PV technology in France
Cost category 2 Value
Installation cost 2.8 € (without VAT) / Wp
Grid connection cost 1200-3000 € HT
Operational energy use revenues ( frommodules used instead of roof tiles, cladding,
solar protection...)
Germany
Table 3 Standard cost associated to PV technology in Germany
Cost category Value
Product cost 1270 €/kWp (typical 10 to 100 kWp PV rooftop-
system) 3
Power generation cost 50-60 cents/kWh [04]
Italy
Table 4 Standard cost associated to PV technology in Italy
Cost category 4 Value
Installation cost 1500€/kWp
Grid connection cost PBefore the publication of Royal Decree 900/2015 which regulates the installation of
on self-consumption systems, all installations in development during 2015 in
Spain, were approved to be connected directly to the main switch board of the
electrical installation in low voltage.
When the new regulation entered into force, all installations had to be modified to
fulfil all the mandatory requirements established. Among others, each installation
has to submit a new application to the Distributor System Operator (DSO) to be
connected to the grid and to be granted with a point of connection. Plus, it is
mandatory to install a new energy meter, to measure the power production, in a
location accessible from a public way to warranty 24/7 access to the DSO.
Currently, the technical conditions to be connected to the grid have not been
approved yet by the National Authorities and each DSO has developed different
and particular rules to be connected to their networks. This situation means that
there are different costs depending on the regional area in the country.
Table 5 Turnkey Prices of Typical Applications in Spain [06]
Category/Size Typical application and brief Current prices (per W)
details
Off-grid up to 1kW Streetlight, telecommunication 2.5-3 €/W (can be higher
system, taximeter, camping, with batteries)
shelter...
Off grid > 1 kW Farming, irrigating system , 2-2.8 €/W (can be higher
pumping, agricultural sector, with batteries)
rural electrification
Grid connected rooftop up to Service sector, PYMES, Domestic 1.4-1.5 €/W
10kW (residential) sector
Grid connected rooftop from Hotels, big industries, cinemas 0.8-1.2 €/W
10kW to 250 kW (commercial)
Table 6 Cost of residential roof PV system < 10kW in Spain [06]
Cost category Average (€/W)
Hardware
Module 0.675
Inverter 0.2
Other (structure, racking, wiring...) 0.48
Soft costs
Installation 0.11
Operation and Maintenance 0.02
Subtotal hardware 1.355
Subtotal soft costs 0.13
Total 1.5
3.1.8 | Regulatory framework and legislation applied
The Energy Performance in Buildings Directive (EPBD) wrequirements on nZEB by
2020 might become an important driver of PV development in the building
sector,pushing PV as the main possibility to reduce the net energy consumption in
buildings after energy efficiency. While the final effect will have to be scrutinized
after 2020, it represents a major opportunity for the building sector and PV to work
together.
Page 16
1.4 | Integration of renewable energies in NZEBs Bulgaria
In Bulgaria, is necessary distinguee between PV systems which are either
autonomous and the systems connected to the grid. The autonomous PV system
can be installed absolutely free and do not underline any regulations.
If the system has to be connected to the grid, the project for it has to be aligned
with the municipality, which then leads to permit to install the system and connect
it to the grid. In this case, the generated energy can be used for:
- Self needs: only the excess energy is sold.
- For selling: all the energy generated is sold. The prices at the moment are
~0, 14 €/kWh (up to 5 kWp) and 0, 12 €/kWh (up to 30 kWp).
France
PV systems are accounted for in the energy regulation, allowing the plus energy
level to be reached. The cost of grid connection billed by the electricity distribution
company is very high. There are two feed in tariffs: one if the whole electricity
production is sold, one if a part is self-consumed and the rest is sold.
Investment aid of 0.4 €/Wp in case of self-consumption
Germany
Communities and cities can determine that you have to include renewable
energies into your building concept.
The Erneuerbare-Energien-Wärmegesetz (EEWärmeG) a law on renewable
energies requires a minimal level renewable energies for new buildings and
retrofits with an increase of living are of more than 50m² [07] . The requirements
do not include photovoltaics but solar thermal panels.
The German government pays a feed-in remuneration for electricity including
photovoltaics of around 10 to 12 cents/kWh [08].
Italy
The annex 3 of the current Italian legislation about the promotion of renewable
energy (Dlgs 28/11), coherent with the Directive 2009/28/CE, describes the
minimum mandatory amount of energy provided via the exploitation of renewable
sources for new buildings or major renovations. In particular:
the electrical power [kW] of the plants powered by renewable sources,
compulsorily installed on or within the building or its perimeter, is calculated
according the following formula:
P=1/K*S
where S is the floor surface of the building at ground level, measured in m2, and K
is a coefficient (m2/kW) which is equal to 50, from 1st January 2017.
For public buildings, the obligations are increased by 10%.
It is important to underline that these systems are low-density produced energy
per unit of surface: this inevitably entails the need to identify criteria related to soil
consumption and landscape protection.
Spain
.
Consecutive Spanish governments put in place a legal framework allowing that the
revenues coming from the price of retail electricity were below total system costs,
which created the tariff being paid by electricity consumers. The cumulated deficit
amounts now to 15 BEUR and it is estimated that the cost of renewables paid by
electricity consumers has contributed to around 20% of this amount. In order to
Page 17
1.4 | Integration of renewable energies in NZEBsreduce this deficit, retroactive measures have been taken to reduce the FiTs already
granted to renewable energy sources but no other significant measures have been
taken to reduce the deficit.
In the summer of 2013, the Government announced a new reform of the electricity
market. Under the 24/213 Power Sector Act, the FiT system was stopped in July 2013
and the new schemes are based on the remuneration of capacities rather than
production.
The new system is based on estimated standard costs, with a legal possibility to
change the amounts paid every four years. This has caused many projects to be in a
state of default. The biggest projects have changed hands, since international
investors found interests in the acquisition of these projects.
The 24/2013 Power Sector Act considers very restrictive forms of self-consumption.
During 2015 the regulatory framework for self-consumption was developed under
Royal Decree (RD) 900/2015.
This RD established that the maximum capacity of the self-consumption
installation must be equal or below the contracted capacity. It also specifies two
types of self-consumers:
- Type 1: maximum capacity installed of 100 kW – there is no
compensation for the electricity surplus fed in the grid.
- Type 2: no limit to the allowed capacity – the surplus can be sold in the
wholesale market directly or through an intermediary. A specific grid tax
of 0.5 EUR/MWh has to be paid together with a 7% tax on the electricity
produced.
Regulation indicates that self-generated power above 10 kW is charged with a fee
per kWh consumed as a “grid backup toll”, commonly known as the “sun tax”.
Adding battery storage to the installation also implies an additional tax.
Geographical compensation is not allowed, and self-consumption for several end
customers or a community is not allowed.
However, grid parity has been reached in Spain thanks to two factors: rich solar
irradiation resource and good prices for components. Given the context of no feed-
in-tariff, the future of the Spanish PV market lies in the deployment of big PV
plants , and specifically for the building sector, on appropriate regulation and
elimination of the self-consumption barrier.
3.1.9 | European and national Markets for PV systems
Europe led PV development for almost a decade and represented more than 70%
of the global cumulative PV market until 2012. Since 2013, European PV
installations went down while there has been rapid growth in the rest of the world,
and particularly in China. Europe accounted for only 17% of the global PV market
with 8.5 GW in 2015. European countries installed 98 GW of cumulative PV capacity
by the end of 2015, still the largest capacity globally, for the last year. It is important
to distinguish the European Union and its countries, which benefit from a common
regulatory framework from part of the energy market, and other European
countries which have their own energy regulations.
Bulgaria
Page 18
1.4 | Integration of renewable energies in NZEBsAccording to national statistics in September 2017 6, there are currently 819 MWp
installed in Bulgaria, as follows:
- Installations up to 30 kWp – 3,69 MWp
- Installations up to 5 MWp - 682,72 MWp
- Installations over 5 MWp – 132,59 MWp
Concerning the data from the national electricity provider for all the domestic
electricity, the electricity generated from PV installations accounts for ~ 8% of the
total electricity consumption in 2016.
France
The installed power in France is around 6.9 GW, and the annual production 8.5
TWh, around 1.7 % of the electricity consumption.
Half of building integrated systems are in the residential sector, and half in public
buildings (large area of modules). Silicium modules represent 90% of the market,
the rest being thin films.
Germany
The figure below shows the number of PV systems annually installed in Germany
(% of annual capacity) [01] .
Figure 5 Percentage of annual installed capacity in Germany 7
Italy
The company GSE (Gestore Servizi energetici) reports in the year 2016 an overall
value of energy produced by PV systems (732053 installed systems) equal to 22104
GWh, while the installed power is 19283 MW.
6
http://vei-bg.org
7
Data: up to 2008: extrapolation from utilities data; since 2009: Bundesnetzagentur. Graph : PSE AG 2017
Page 19
1.4 | Integration of renewable energies in NZEBs79% of the installed systems belongs to household use while 51% of the power is in
the industry sector.
At national level, 73% of the installed power is made of polycrystalline silicon, 21%
monocrystalline silicon and 6% in thin film or in different materials.
Spain
In 2007 and 2008, Spain’s a feed-in-tariff (FiT) programme triggered a rapid
expansion of the PV market. After a moratorium in October 2008 that made the
market go down, in January 2012 a new moratorium was put in place for all the
renewables projects with FiT. In 2015, only 49 MW were installed in Spain where a
total installed capacity tops more than 4,8 GW which can be explained by the
difficult economic environment and the constraining PV policies. In 2017, there
was a turnaround of the situation for large PV installations, with increasing
installations both at large scale ( 3,000 MW renewable energy auction launched
with significant percentage of PV winners) and at building scale.
3.1.10 | Implementation trends
With the right regulatory and policy frameworks, solar technologies can still unlock
significant additional cost reductions out to 2025 and beyond. There is significant
potential for this technology to see continuous installed cost reductions and
performance improvements, leading to lower life cycle costs of PV electricity.[09]
Figure 6 8 Global weighted average total system costs breakdown of utility-scale solar PV systems, 2009-2025 [09]
The steep decline in total installed costs of solar PV
8
IRENA analysis and Photon Consulting, 2016
Page 20
1.4 | Integration of renewable energies in NZEBs Bulgaria
Steady development and increase in the number of installations. There is no
indication that this will change soon.
France
According to the French Energy and environment Agency (ADEME), 800 MWp will
be installed yearly in the next years.
Italy
EU countries have already agreed on a new renewable energy target of at least 27%
of final energy consumption in the EU as a whole by 2030 as part of the EU's energy
and climate goals for 2030. Within this renewables-target: electric (48-50%),
thermal (28-30%), transportation (17-19%). To this end, the following instruments,
operating at national level, is nowadays active for PV technology:
- 50% tax credit until 31/12/2017 during renovation works (Bonus
ristrutturazioni). This is also applicable to the purchase and the
installation of accumulation systems to be incorporated into existing
photovoltaic plants;
- 10% VAT facilitation measure.
According to the GSE Report [2015], technological progress will further reduce PV
costs by 40 to 70% per year. This costs reduction suggests an important
development of this technology whose production should increase more than
double within 2030.
Spain
Since 2011the national PV market has been affected by non-favourable regulatory
measures, which have resulted in very small installed capacity in 2016 and 2016.
The publication of the Royal Decree 900/2015 on the 5th of October 2015, which
regulates the installation of on self-consumption systems,further decreased sthe
development and promotion of new projects , particularly in the building sector.
However, interest on self-consumption in many economic sectors is still alive, and
a timid recovery of the self-consumption sector has been seen in 2017, and is
expected that the sector will steadily grow from 2018 onwards.
3.2 |Biomass
Biomass is a fuel developed from organic materials, a renewable and sustainable
source of energy, and used to generate heat and/or electricity (industry).
A wide range of technologies have been developed to utilize the biomass resource.
These vary from direct combustion in burner systems, to the production of more
advanced biofuels, such as pyrolysis, through a variety of processing techniques
(fermentation, gasification).
As with burning of fossil fuels, burning biomass releases carbon dioxide and other
pollutants. Because the carbon in biomass has quite recently been absorbed from
the atmosphere, if the biomass resource is managed sustainably there may be little
net-emissions of carbon dioxide. This closed carbon cycle, however, does not
necessarily include any energy needed to cultivate, harvest, and process the
biomass.
Two categories of biomass fuels, woody fuels and animal wastes, comprise the vast
majority of available biomass fuels. Most biomass used today is home grown
energy. Wood-log, chips, bark, pellets and sawdust- accounts about 44% of
biomass energy. Other biomass fuels include agricultural waste products. On the
Page 21
1.4 | Integration of renewable energies in NZEBsother hand, there is the possibility of burning solid waste (one ton of garbage
contains as much heat as 500 pounds of coal) and landfill gas and biogas, through
which methane gas is generated as long as the waste decays.
Regarding AZEB, the biomass technology will be focused on the combustion of
woody biomass (wood chips, pellet, etc.), which is the most extended and mature
technique.
Biomass heating systems include different technologies and feeding structures
regarding the installation size and number of end-users. Depend on the power
rates, different alternatives exist:
- Heating generation through district heating
District heating plants based on biomass boilers present an installed
power > 500kW, being the normal values between 600-2.500 kW. These
systems are used for heating and hot water generation for some
apartment buildings, neighbourhoods or villages. The structure of this
system is divided into 3 parts; Biomass supply, biomass power plant and
distribution network and heating supply to the end-users.
Figure 7 850kW biomass boiler for district heating application [10]
- Medium size biomass systems (50-500 kW)
Medium size boilers are designed to supply heating and hot water to a
building (flats, offices, hotels). The type of boiler applied for this
application is the fired-grate boiler (fixed/ cascade) or the bottom
feeding system, which permit high efficiencies (>85%) and a low
maintenance cost. The best benefit from this application is a lower price
in the energy supply (between 50-100%), noise reduction and
improvement of environmental conditions.
Figure 8 250kW medium size biomass boiler and storage bunker [10].
One of the main aspects of this application is the biomass storage. It
mandatory having a storage and a biomass feeding system, located near
the biomass boiler. The storage system which is usually used are silos,
Page 22
1.4 | Integration of renewable energies in NZEBswhich are normally located inside the building to be heated. The space
required shall be enough to store the biomass needed for at least 1-2
weeks.
These systems also require a biomass feeding system, which has to feed
the boiler periodically.
- Biomass boilers for single-family house (95%
heating
Medium size biomass systems 50-500 kW ̴92%
Biomass boilers for single-family 90%
house
Pellet boiler (condensation3.2.1 | Scale of application
The small scale heating systems are usually installed in single private households.
Heat appliances range from small scale stoves for room heating, to boiler of few
kW to heat houses or buildings. Domestic batch-fed wood burning appliances
include “high-efficiency” pellet stove and central heating boilers.
Wood biomass boilers (firewood, wood chips and wood pellets) up to 500 kW
typically can both heat sanitary water and the whole house heating system.
Wood pellet stoves typically can be air appliance (single room heating) or water
heating (heating system).
Biomass boilers can also supply mainly heat and sanitary heat water to flat
buildings in terms of central boiler or in district heating scale. It shall depend on
heat and water demand and district configuration.
3.2.2 | Main applications
As it has been explained before, in nZEB the main application of biomass boilers is
to generate sanitary hot water and heat in single houses, flat buildings, tertiary
buildings (offices, hotels, etc.) or district heating systems.
Figure 10 Application of woody biomass [11].
It has to be highlighted that heat /hot water production applications through
combustion of pellets, are extended applications in Europe. In some of them as
Sweden, Finland or Germany the installation of domestic biomass boilers has
increased significantly since 2004. The main biomass consumer countries (per
capita) are Nordic and Baltic countries, together with Austria and Finland.
In Austria, for example, the number of installations (Figure 11 Biomass boiler application to cover all the demand [13].
If the intentions is covering 100% the demand of a new building or disable the old
ones, the scheme to be followed is described in Figure 11. Depending on each
installation, a buffer tank shall be needed depending biomass boiler efficiency at
low modulations.
On the other hand, when the demand to be cover is high, it is recommended to
install cascade systems, generally two. This brings many advantages as: the
increased of the lifetime of the installation; having two boilers in order to operate
both of them in parallel or having one operating and the other one stopped
(maintenance operations).
Figure 12 Cascade installation scheme for high demands [13].
This growth of biomass technology and the increase of pellet production has lead
into a biomass European market, in which countries with biomass excess supply
biomass consumer countries.
In case of Spain, the main biomass fuel comes from the forestry sector, which has
been mainly used in the domestic sector to produce heat and hot water.
3.2.3 | Limitations of its application
The main barriers are described below:
- Lack of a developed biomass logistic market.
- Competition with other traditional fuels in terms of prices and service.
- Specialized staff to manage and store the biomass.
Page 25
1.4 | Integration of renewable energies in NZEBs- Lack of specific regulation to use biomass for domestic issues.
- Requirement of space for the biomass installation and storage.
- In some cases, biomass fuel can be perishable.
3.2.4 | Current technologies
Biomass technologies are divided into:
- Adapted boilers to biomass: they used to be coal boilers adapted to be
used with biomass or gasoil boilers with a biomass burner. Although they
are cheap, their efficiency is low (75-85%). Normally, they are semi-
automatic without clean and maintenance systems.
- Biomass boilers: specific designed boilers to a specific biomass fuel
(pellets, wood chips, mainly). Their efficiency is higher near 92% with
automatic biomass feeding system, heat exchanger clean system and ash
extraction system.
- Pellet boiler power are normallyestablished between 2-3 years, depending on the equipment and the
space to be heated.
- Pellet biomass can be easily stored.
- Biomass technology highly developed with high efficiencies and low
emissions. These applications show more savings regarding GHE
emissions compared with fossil fuels.
- Producing electricity from biomass is too expensive compared to PV and
heat pumps. Since the market in Bulgaria is very price-sensitive, this
automatically makes biomass electricity unattractive.
3.2.6 | Main disadvantages
- In 2010, a report drafted for the European Commission (known as the 'EU
wood' study) estimated that although demand for wood for material and
energy use could probably be met by 2020, supply would be insufficient
to meet demand by 2030.
- Lack of subsidies in order to cover part of the initial investment and to
assure the biomass supply.
- More technical and operating complexity on biomass management.
Under-developing sector.
- Higher initial investment compared with fossil fuels installations.
- High space requirements to biomass storage and supply assurance.
- Higher maintenance costs.
- More difficulties on biomass storage and management.
- Seasonality and agro-climatology dependence to obtain certain biomass.
3.2.7 | Economic information
France
Table 8 Cost associated to biomass in France
Cost category 9 Value
Product cost 1,600 € VAT excluded for a 10 kW stove
1,680 for a 10 kW fireplace insert
4,620 € for a 20 kW wood boiler
Installation cost 440 € VAT excluded for a 10 kW stove
375 € for a 10 kW fireplace insert
1,270 € for a 20 kW wood boiler
9
The following assumptions have been taken for costs calculation. Standard electricity cost: 14.16 c€/kWh and 100 €/year fixed cost
for 6 kW. Standard gas cost : 7.05 c€ / kWh and 100 €/year fixed cost for 6,000 kWh
Page 27
1.4 | Integration of renewable energies in NZEBsOperational energy costs 340 € per ton of pellets, delivered on site (i.e. 7 c€ /
kWh)
115 € per m3 wood logs (i.e. 3.3 c€ / kWh)
Italy
Table 9 Cost associated to biomass technology in Italy [15]
Cost category 10 Value
Product cost 500 €/kW PPellet biomass price (+ VAT -21%) 3,50 €/15kg
Unit price 0,23
Price €/kWhth 0,046
Yearly consumption (100m2)-heat 2.880kg; 14400kWh
Initial investment 9.800
Boiler+ feeding system 4.000
Installation 3.000
Heater 2.800
Costs (€/year) 662
Yearly increase (last 8 years) 6,07
Increase in 5 years 3.784
Increase in 10 years 9.018
Increase in 15 years 16.256
Cost in 5 years 13.584
Cost in 10 years 18.818
Cost in 15 years 26.056
- Biomass centralized heating network case:
Table 12 Main economic parameters to value a biomass centralized installation in Spain [17] .
Heating generation through district heating
Gross thermal power 6.000 kW
Thermal efficiency 85%
Transport efficiency 90%
Lifetime 20 years
Operating hours 820 h/year
Biomass consumption 1580 t/year (PCIh: 3500 kcal/kg)
Biomass costs 224 €/tep 94.800 €/year
Operating costs 384 €/tep 162.450 €/year
Investment 2825 €/kW 1,69 M€
Energy production 423 tep/year
- Another comparison that can be made, is between biomass boilers from
50-325 kW (data from 2005):
Table 13 Installation cost of biomass boilers [10]
50kW 100kW 325kW
Biomass boiler 4.500 6.000 16.210
Automatisms (system for biomass supply to loading hopper; bank for 1.800 2.250 8.550
combustion system, comburent supply system, automatic start-up
system and automatic ash removal).
Connection to stack 758 947 3.600
Hydraulic system 696 870 3.305
Piping; cold water, filling, emptying and expansion pipelines, expansion
vessel; instrumentation.
Circulation pump to heating system 353 441 1.676
Electrical installation 1.000 1.251 4.752
Ventilations 394 492 1.871
Fire control system 151 188 715
Control system 722 903 3.431
Insulation 260 325 1.235
Total investment (no VAT included) 10.634 13.667 45.345
Total investment (VAT included) 12.335 15.854 52.600
Page 29
1.4 | Integration of renewable energies in NZEBsYou can also read