Renewable energy: Facts and Futures - the energy future we want 2017 - Stellenbosch ...
←
→
Page content transcription
If your browser does not render page correctly, please read the page content below
This report was
         made possible
         with the support of

report
  za

2017

Energy

 Renewable Energy: Facts and Futures
The energy future we want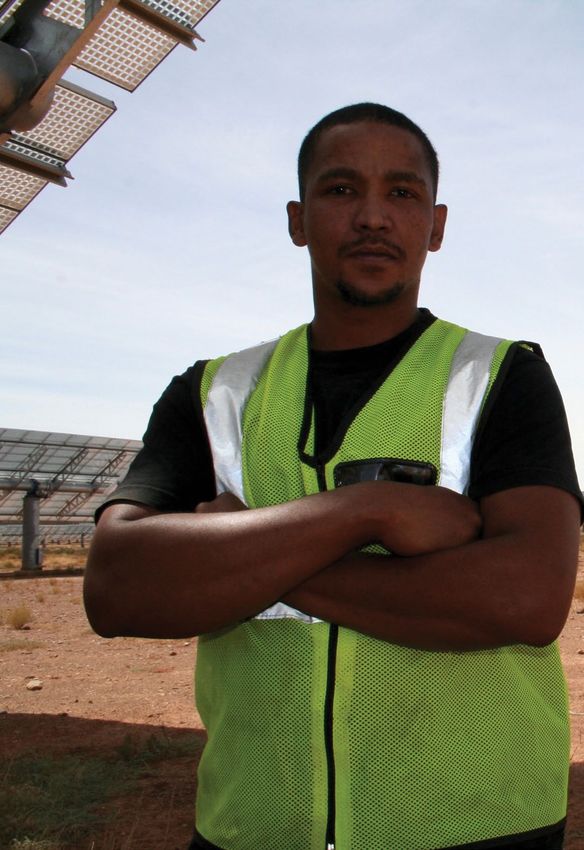
WWF is one of the world’s largest and most experienced independent conservation
organisations, with over 6 million supporters and a global network in over 100 countries.

WWF’s mission is to stop the degradation of the planet’s natural environment and to
build a future in which humans live in harmony with nature, by conserving the world’s
biological diversity, ensuring that the use of renewable natural resources is sustainable,
and promoting the reduction of pollution and wasteful consumption.

Authors: Louise Scholtz and Khodani Muluadzi (WWF); Karin Kritzinger and Mbali Mabaso (Stellenbosch University,
CRSES); Stephen Forder (Energy Blog)

Contributors: Saliem Fakir (WWF); Gaylor Montmasson-Clair (TIPS); Justin Smith (Woolworths);
Tasneem Essop (Energy Democracy Initiative); Leonie Joubert (freelance editor)

Design: Design for development, www.d4d.co.za
Front cover photo: Woolworths
Citation: WWF, 2017. Renewable Energy: Facts and Futures
Available online at: www.wwf.org.za/renewable-energy-facts-and-futures

©Text 2017 WWF-SA All rights reserved

wwf.org.za

Contents
abbreviations and ACRONYMS                                                                                      4
QUICK FACTS                                                                                                     5
CONTEXT                                                                                                         7
1. 	RENEWABLE ENERGY: WHAT MAKES IT A CRITICAL RESOURCE?                                                        8
1.1 Introduction                                                                                                8
1.2 An abundant resource                                                                                        8
1.3 Early policy successes                                                                                     10
Renewable energy technologies                                                                                  11

2. eskom vs re and the sway of history                                                                         15
2.1 		Introduction                                                                                             15
2.2 		The years of plenty                                                                                      15
2.3		The years of scarcity                                                                                     16
2.4		The emergence of renewable energy                                                                         16
Think piece: Rethinking the role of coal                                                                       17

3. putting re policy into action                                                                               19
3.1 Introduction                                                                                               19
3.2 The Integrated Resource Plan                                                                               19
3.3 The future: the IRP re-optimised                                                                           21
3.4 Other key policies and legislation                                                                         22
3.5 Government mandates                                                                                        23
Think piece: Electricity supply in South Africa: Path dependency or decarbonisation?                           25

4. rei4p successes and challenges                                                                              26
4.1 Introduction                                                                                               26
4.2 Overview of key outcomes to date                                                                           27
4.3 Future challenges                                                                                          29

5. the rooftop pv revolution                                                                                   32
5.1 Introduction                                                                                               32
5.2 Increased uptake                                                                                           33
5.3 The business case                                                                                          34
5.4 Challenges for municipalities                                                                              35
Think piece: A private sector perspective: Good for business, good for the climate                             37

6. Going forward                                                                                               38
Think piece: A just transition to a renewable energy future in South Africa                                    40

BIBLIOGRAPHY                                                                                                   42

                                                                         Renewable Energy: Facts and Futures    3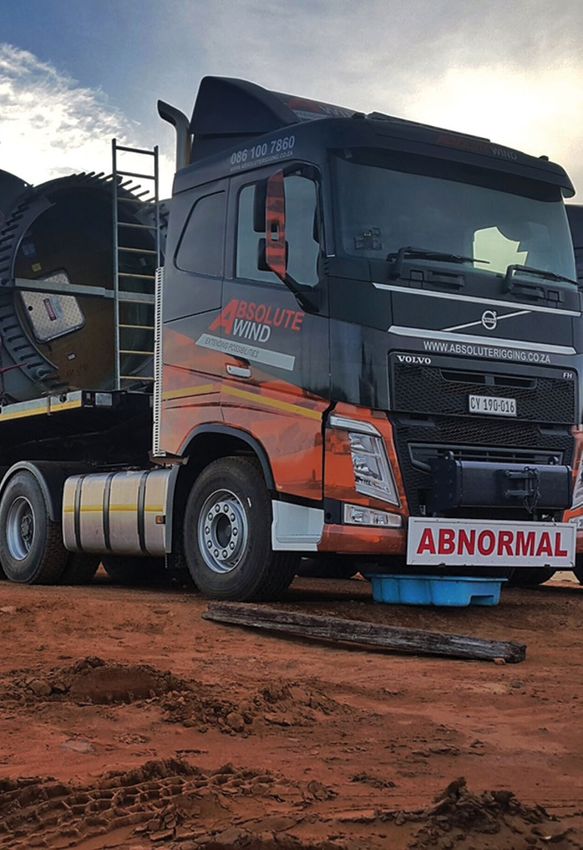
abbreviations AND ACRONYMS
BAU              business as usual                                       MV                medium voltage
B-BBEE           broad-based black economic empowerment                  MW                Megawatt
BEE              black economic empowerment                              MWh               Megawatt hour
BW               bid window                                              MWp               Megawatt peak
CSIR             Council for Scientific and Industrial Research          NDP               National Development Plan
CSP              concentrated solar power                                NEMA              National Environmental Management Act 107 of 199
DE               distributed energy                                      NERSA             National Energy Regulator of South Africa
DEA              Department of Environmental Affairs                     NUM               National Union of Mineworkers
DG               distributed generation                                  NUMSA             National Union of Metalworkers of SA
DoE              Department of Energy                                    PPA               power purchase agreement
DPE              Department of Public Enterprises                        PV                photovoltaic
DTI              Department of Trade and Industry                        RE                renewable energy
ERA              Electricity Regulation Act 4 of 2006                    REFIT             Renewable Energy Feed-In Tariff
GW               Gigawatt                                                REI4P             Renewable Energy Independent Power Producer
INDC             Intended Nationally Determined Contribution                               Procurement Programme
IPPs             independent power producers                             REIPPPP           Renewable Energy Independent Power Producer
IRP              Integrated Resource Plan                                                  Procurement Programme
kW               kilowatt                                                SANEDI            South African National Energy Development
kWh              kilowatt hours                                                            Institute
kWp              kilowatt peak                                           SAWEA             South African Wind Energy Association
LV               low voltage                                             SSEG              Small Scale Embedded Generation
MEC              Minerals Energy Complex                                 TWh               Terawatt hours

    LIST OF RELEVANT WWF-SA PUBLICATIONS
    •     Renewable Energy Vision 2030 – South Africa. Available at: www.awsassets.wwf.org.za/downloads/a16369_wwf_reip_
          report_online.pdf.

    •     Feasibility of the WWF Renewable Energy Vision 2030 – South Africa. Available at: www.wwf.org.za/media_room/
          publications/?14461/Feasibility-of-the-WWF-Renewable-Energy-Vision-2030---South-Africa.

    •     Potential for integration of distributed solar photovoltaic systems in Drakenstein Municipality. Available at: www.wwf.org.za/
          media_room/publications/?14841/Drakenstein-solar.

    •     Concentrated Solar Power – a strategic industrial development opportunity for South Africa. Available at: www.wwf.org.
          za/media_room/publications/?14462/Concentrated-Solar-Power---A-strategic-industrial-development-opportunity-for-
          South-Africa.

    •     Exploring the role of retirement funds in achieving Renewable Energy Vision 2030. Available at: www.wwf.org.za/media_
          room/publications/?14323/Exploring-the-role-of-retirement-funds-in-achieving-Renewable-Energy-Vision-2030.

    •     A review of the local community development requirements in South Africa’s renewable energy procurement. Available
          at: www.wwf.org.za/media_room/publications/?14322/A-review-of-the-local-community-development-requirements-in-
          South-Africas-renewable-energy-procurement-programme.

    •     Enabling renewable energy in South Africa: Assessing the Renewable Energy Independent Power Producer Procurement
          Programme. Available at: www.wwf.org.za/media_room/publications/?13181/Enabling-renewable-energy-in-South-
          Africa-Assessing-the-renewable-energy-independent-power-producer-procurement-programme.

4        Renewable Energy: Facts and Futures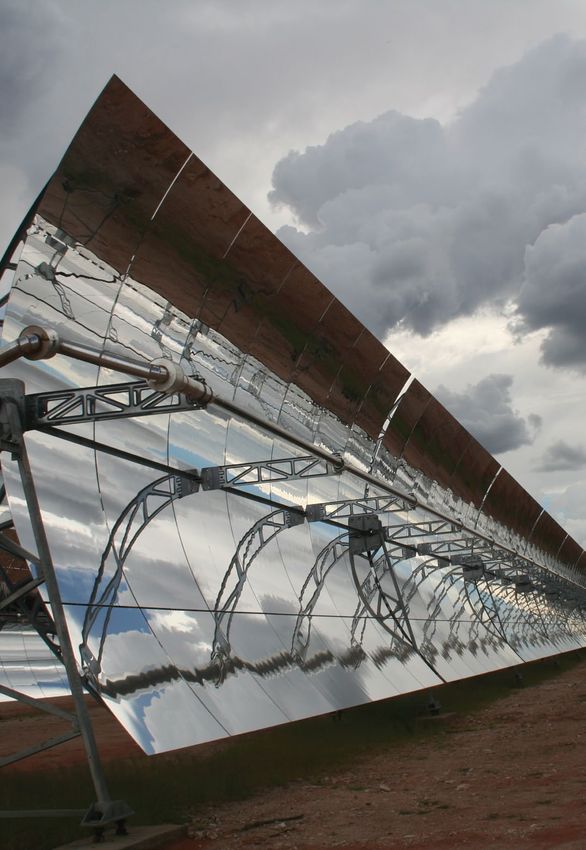
quick facts

RENEWABLE ENERGY   Renewable energy is the energy that is derived from a limitless source, in contrast to fossil fuels,
                   which are derived from a finite source.

                   Types of renewables include solar energy (power from the sun), wind energy, tidal energy (power
                   from the seas) and geothermal energy (power in the form of heat from within the earth).

                   In 2016, newly installed renewable power capacity set new records with 161 GW added, increasing
                   the global total by almost 9% relative to 2015.

                   Solar PV was the star performer in 2016, accounting for around 47% of the total additions – the
                   equivalent of more than 31 000 panels installed hourly – followed by wind power at 34% and
                   hydropower at 15.5%.

                   In 2016 the world added more renewable power capacity annually than it added (net) capacity from
                   all fossil fuels combined.

                   For the fifth consecutive year, investment in new renewable power capacity (including all
                   hydropower) was roughly double the investment in fossil-fuel generating capacity, reaching
                   $249.8 billion.

                   2016 was the third year in a row where global energy-related CO2 emissions from fossil fuels
                   and industry remained stable despite a 3% growth in the global economy and an increased demand
                   for energy.

                   In 2016 South Africa was ranked first for its addition in concentrated solar power.

                   By the end of 2015, renewable capacity in place was enough to supply an estimated 23.7% of global
                   electricity, with hydropower providing about 16.6%.

                   Wind power was the most cost-effective option for new grid-based power in 2015 in South Africa.

                   South Africa is the first country on the African continent to achieve 1 GW of solar PV and helped
                   to push the continent’s wind power capacity above the 3 GW mark.

       the re14p   The Renewable Energy Independent Power Producer Procurement Programme (REI4P) has attracted
                   R195 billion in large investments to South Africa, 25% of which came from foreign investors and
                   R31.6 billion from South Africa’s development finance institutions and state-owned enterprises.

                   Renewable energy contributed a total net benefit of R4 billion (or R2 per kWh of renewable energy)
                   to the South African economy in 2014 and 2015 through avoided costs.

                   It is reported that in a three-year period the REI4P created 26 790 jobs for South Africans, mostly
                   during the construction and operations phases of the plants (IPP Office, 2016).

                   R65.5 billion has been procured from B-BBEE firms for the REI4P projects that have signed up
                   and R32.1 billion has been spent on local content.

                   31% shares of the procured REI4P projects are held by black South Africans, of which 31% are held
                   by local communities.

                   By 2016, the REI4P had already successfully procured 43% or 6 376 MW of generation capacity
                   since 2011.

                   Sources: www.ren21.net/wp-content/uploads/2017/06/GSR2017_Highlights_FINAL.pdf; IPP Office, 2016

                                                                                                                          5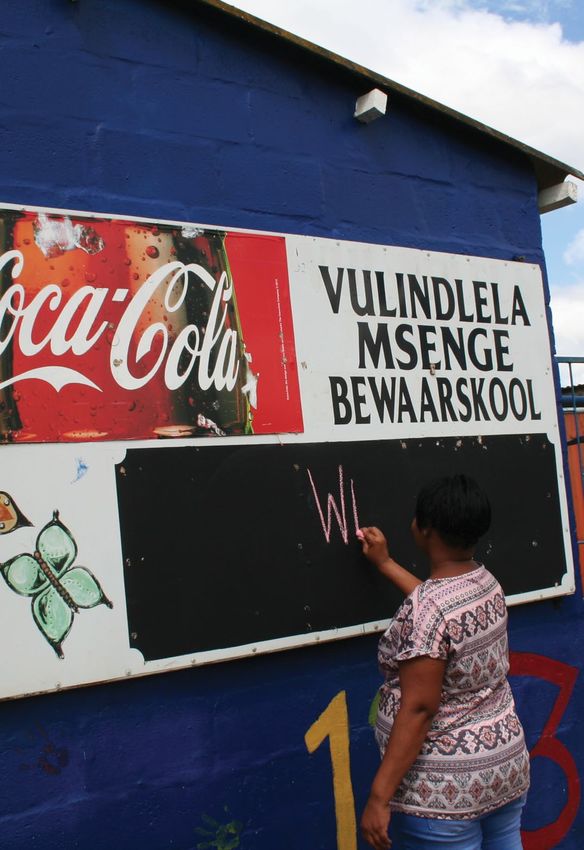
© Leonie Joubert
    Renewable energy working for women

    A new hydro power plant on the Orange River creates
    employment in communities around Kakamas in the
    Northern Cape.

    ‘My day-to-day job is becoming more like running the plant,’
    electrician Vania Heyns says, laughing.

    She is one of the electricians at the Kakamas Hydro Electric
    Power (KHEP) plant on the outskirts of this remote Northern
    Cape town, and her boss, Johan Benade, agrees that
    she pretty much runs the show. Vania’s knowledge of the
    community means that she’s ideally placed to also co-
    ordinate the plant’s social and enterprise development work.
    Since KHEP’s revenues started flowing in 2015, the plant
    has supported various projects, including helping a local
    school and two day-care centres for the elderly and disabled,
    providing them with things like computers for learning, office
    equipment, furniture and cooking facilities.

    Born and bred in the Northern Cape, Vania understands why
    it is difficult for micro-enterprises here to be viable.

    ‘When people start a business here, the money they make
    today is the money they are going to use to feed themselves
    tonight,’ she says, describing how vulnerable small
    businesses can be.

    The 10 MW KHEP plant is one of the 96 renewable energy
    power plants commissioned by the Department of Energy
    since 2011, as part of its utility-scale Renewable Energy
    Independent Power Producer Procurement Programme.
    Through the REI4P, the state has outsourced some of its
    energy infrastructure needs to the private sector. One of the
    stipulations in the contract between the state and the private
    firms is that they will invest a percentage of the revenue
    they earn from selling power to the grid, into development
    initiatives in communities living within 50 km of each plant.
    This work spans the 20-year period of the contract in this
    public-private partnership.

6         Renewable Energy: Facts and Futures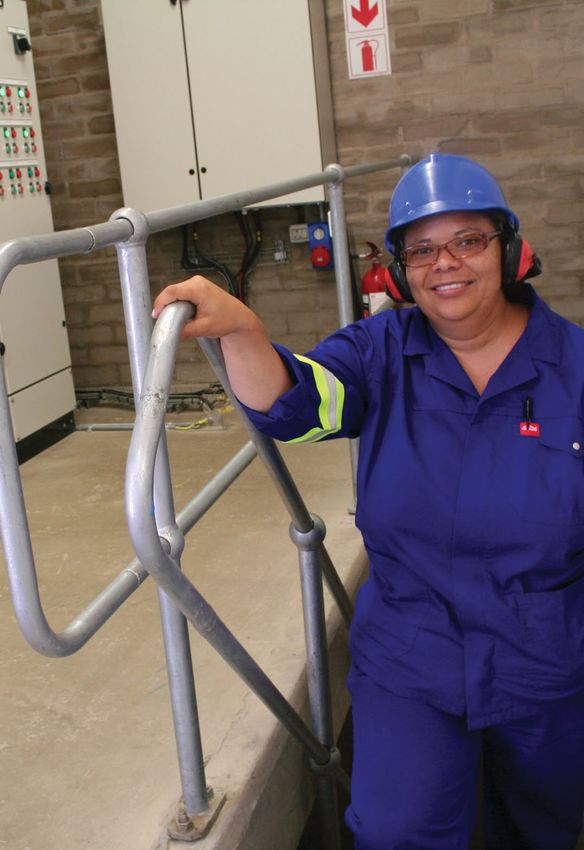
context                       Worldwide there is an energy transition
                                                            under way with countries moving away
                                                            from fossil-fuel generated electricity to
                                                            renewable energy sources.

“The world now adds        The world now adds more renewable power capacity every year than it adds in net new capacity
                           from all fossil fuels combined (REN21, 2017). Although this shift is underpinned by the need to
      more renewable       ensure future energy security, it is given momentum by the realisation that replacing fossil fuels
power capacity every       with renewable energy is one of the most effective measures to reduce greenhouse gases (GHGs)
     year than it adds     and mitigate climate change.
  in net new capacity
                           For the third year in a row in 2016, economic growth was decoupled from the growth in CO₂
   from all fossil fuels   emissions. This was largely owing to the combined growth in renewable energy capacity and a
           combined.”      decline in coal consumption (REN21, 2017). A further leading impetus is the decreasing cost of
                           renewable energy technology, particularly wind and photovoltaics (PV), which make renewables
                           increasingly cost competitive with electricity generated from fossil fuels (REN21, 2017).

                           South Africa’s dependence on coal to generate about 90% of our electricity has made it the
                           biggest carbon emitter in Africa (Baker, 2016). The Department of Energy (DoE) states that,
                           at present the electricity sector is responsible for 45% of the country’s greenhouse gas emissions.
                           Reducing the dependence on coal for electricity generation and increasing the percentage of
                           renewables in the energy mix are low-hanging fruits ripe for the picking.

                           South Africa is in the fortunate position that it has an abundance of renewable energy resources,
                           particularly solar and wind. In addition, these resources are complementary in nature, which
                           means a power generation system with a high degree of renewables is possible (Gauchè et al.,
                           2015). South Africa should therefore think long and hard about the feasibility of investing in
                           expensive new nuclear power to provide for base-load electricity when the wind is not blowing
                           and the sun is not shining.

                           Through the Renewable Energy Independent Power Producer Procurement Programme

 R195 billion
                           (REI4P), South Africa has also demonstrated that it can successfully and rapidly implement a
                           large-scale, world-class renewable energy programme. The REI4P not only addresses energy
                           security and the reduction of greenhouse gas emissions but also includes a number of socio-
        ATTRACTED INTO     economic prescriptions to ensure local community ownership and socio-economic development
          SOUTH AFRICA     in the vicinity of the renewable energy power plants. Through local content stipulations,
                           the programme has also managed to provide the market for a number of renewable energy

            26 790
                           manufacturing facilities. The REI4P constitutes a public-private initiative on a massive and
                           unprecedented scale, attracting R195 billion into the country and creating 26 790 jobs in
                           construction and maintenance of plants (IPP Office, 2016).
          JOBS CREATED
                           The private sector, both at household and industry level, is the primary force behind embedded
                           generation developments, in essence PV installed on rooftops. This positive development,
                           however, presents a challenge to municipalities that have to manage a future decrease in revenue
                           from electricity sales. Municipalities are responding to the changing landscape and many
                           have implemented guidelines and feed-in tariffs for privately owned PV systems to feed excess
                           electricity into the grid. In addition, some of the metros and large municipalities are exploring
                           options to procure power from sources other than Eskom, such as independent power producers
                           (IPPs). The major challenge in this regard is the present regulatory environment that does not
                           allow municipalities to procure from sources other than Eskom (Montmasson-Clair et al., 2017).

                           However, the South African renewable energy landscape is in danger of being derailed by vested
                           interests, like Eskom’s refusal to sign off-take agreements with IPPs, mobilisation around coal
                           and coal mining in particular, and the inclusion of expensive new nuclear capacity and retention
                           of coal-fired capacity in the Draft Integrated Resource Plan 2016.

                             WWF-SA argues that South Africa should rather build on the early success of the REI4P
                             by extending the programme beyond the initial five bid windows, which will demonstrate
                             the government’s long-term commitment to the roll-out of renewables. Choosing this
                             route will provide South Africa with clean, affordable energy, avoid perpetuating coal-
                             generated electricity that is highly carbon intensive and polluting, and obviate investment
                             in expensive nuclear power plants that are not necessary.

                                                                                                                            7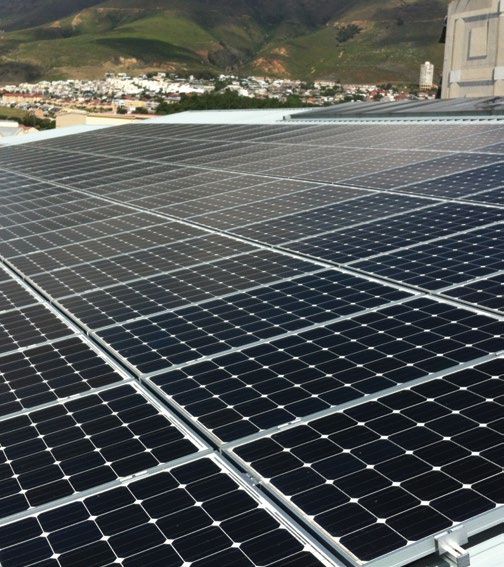
1. renewable energy:                                            Apart from its many socio-economic
                                                                    benefits, renewable energy is a

         what makes it a                                            critical part of reducing global carbon
                                                                    emissions and setting us on a path to

       critical resource?                                           a low-carbon economy.

                                 1.1 Introduction
                                 South Africa was one of the first developing countries to pledge emissions reductions – despite
                                 not being obliged to do so – when, in 2010, it set emissions reduction targets of 34% by 2020
                                 and 42% by 2025 below an unspecified ‘business as usual’ level (Fakir, 2015).

                                 Reducing South Africa’s dependence on coal for generating electricity and increasing the
                                 percentage of renewable energy sources in the country’s energy mix is a so-called ‘low-hanging
                                 fruit’ – a goal that can most easily be achieved. The potential of renewable energy sources
                                 to mitigate climate change was highlighted in the National Climate Change Response White
                                 Paper, which pointed out the investment in renewable energy programmes as one of the most
                                 promising options of climate change mitigation in the electricity sector (DEA, 2015).

                                 1.2 an Abundant resource
                                 South Africa is endowed with some of the best solar and wind resources in the world. In terms
                                 of South Africa’s theoretical wind potential, research from the Council for Scientific and
                                 Industrial Research (CSIR) suggests that to generate the equivalent of South Africa’s current
                                 yearly electrical energy demand of 250 terawatt hours (TWh), only 0.6% of the available
                                 South African land mass would have to be dedicated to wind farms with a cumulative installed
                                 capacity of approximately 75 GW. In addition, the total technical theoretical potential for
                                 wind power in South Africa, if wind farms were to be installed all across the country except in

           what is re?           exclusion zones such as national parks and settled areas, amounts to 6 700 GW. This wind fleet
                                 would be large enough to supply the entire world’s electricity demand (CSIR in Forder, 2016).
          Renewable energy       Figure 1.1 illustrates the technical theoretical potential for wind power in the southern parts
   is derived from a limitless   of the country. Red indicates the highest and blue the lowest mean wind speed.
source, whereas fossil fuels,
     are derived from a finite
        source such as coal.
                                                                                                                                   Source: www.wasaproject.info/docs/metadataApril2014.pdf

           Solar energy
       (power from the sun)
                                   Latitude

            Wind energy

                                                                            Longitude

                                 Figure 1.1: The technical theoretical potential for wind power in the
         HYDRO ENERGY            southern parts of South Africa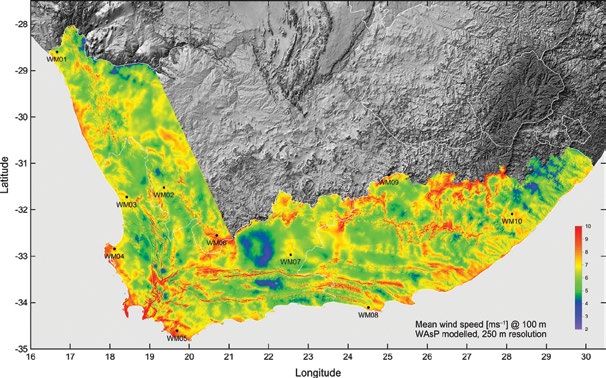
South Africa has some of the highest solar irradiance in the world and experiences some
                                      of the highest levels of yearly horizontal solar irradiation globally (Figure 1.2). The average
                                      daily solar radiation in South Africa is between 4.5 and 6.5 kWh/m2/day (Figure 1.3)
                                      compared to about 3.6 kWh/m2/day for parts of the USA, and about 2.5 kWh/m2/day for
                                      Europe and the United Kingdom (Gulati & Scholtz, 2017). When compared to industrialised
                                      countries that are using solar thermal technology on a much larger scale, even South
                                      Africa’s provinces with the lowest potential have higher levels of solar irradiation than these
                                      countries. Yet South Africa lags behind countries with a lesser solar resource such as Spain
                                      and Germany in the adoption of solar energy (Sager, 2014).

                                                                                                                                          Source: Solar GIS, 2016
                                      Figure 1.2: Global horizontal irradiation

                                                                                                                                          Source: Solar GIS, 2016

      Wind power consumes no
 fuel and emits no air pollution,
          unlike fossil-fuel power
sources. Wind power available
     in the atmosphere is much
      greater than current world                                                                                0   100   200 km
  energy consumption. Energy
 consumed in manufacturing a                 Average annual sum, period 1994-2013
    wind power plant is equal to
   the new energy produced by                < 1450    1600   1750   190   2050     2200   2350 KW h/m2
  the plant within a few months
                     of operation.                                                                   GHI Solar Map © GeoModal Solar
             (www.wasaproject.info)

                                      Figure 1.3: Global horizontal irradiation for South Africa

                                                                        Renewable Energy: What makes it a critical resource?          9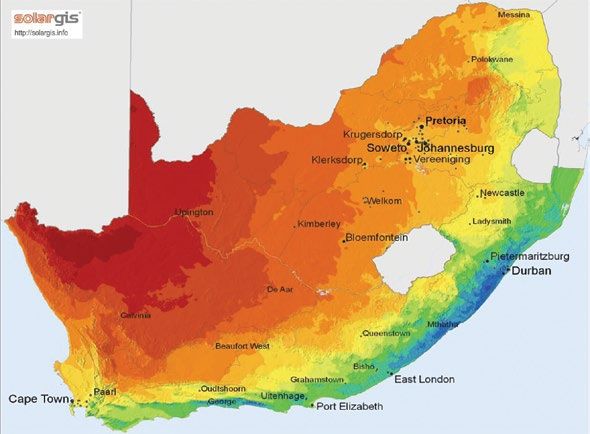
In addition to the country’s excellent wind and solar potential, South Africa’s climatic
                           conditions tend to result in a complementary power generation profile for wind and solar
                           energy. Wind supply peaks in the evening and solar photovoltaic (PV) potential peaks
                           at midday. Wind and solar output also has low seasonality, i.e. is hardly affected by the
                           seasons. A combination of these climatic factors and the wide geographical area over
                           which wind and solar plants can be distributed results in lower volatility and less variability
                           and intermittency, making wind and solar energy more dependable options than in other
                           countries, and cheaper to deploy (CSIR in Forder, 2016).

                           The CSIR findings also reinforce earlier findings from a modelling study by WWF
                           (Gauchè et al., 2015), which found that a low-cost and resilient power generation system
                           can be achieved by using a high share of renewable energy (Forder, 2016). This can be
                           achieved through the right geographical distribution of solar and wind generation facilities
                           and the installation of storage and flexible peaking plants that can power up at short notice
                           (‘load-following’) for times of high demand.

                           1.3 early policy successes
                           Given the abundance of South Africa’s solar and wind resources, there is a compelling
                           and strategic case for a high share of renewables in the South African electricity generation
                           mix. The first official document to acknowledge the need to secure energy supply through
                           diversifying energy sources was the White Paper on Energy Policy of the Republic
                           of South Africa (1998). This document acknowledged that the ‘rapid development of
                           renewable energy technologies was imminent, and that they would become cost competitive
                           and cost effective’. This would create numerous opportunities for South Africa, which has
                           great renewable energy potential (DoE, 2015).

                           This was followed by the White Paper on the Renewable Energy Policy of the
                           Republic of South Africa (2003), which dealt exclusively with renewable energy in
                           South Africa. The aim of this document was to create conditions for the development and
                           commercial implementation of renewable technologies. This was also the first document
                           to refer to the procurement of renewable energy from independent power producers (IPPs)
                           (Baker, 2016). However, while the paper set precedence for renewable energy policy in the
                           country, it had little impact on the development of the renewable energy sector because
                           it was only published in 2012, by which time the 2010 Integrated Resource Plan (IRP) for
                           electricity had already been promulgated (Eberhard et al., 2014; Baker, 2016). For the first
                           time, the IRP included renewable energy in South Africa’s electricity mix – see Chapter 3
                           for more details.

                           The table was now set to start procuring and integrating renewables into the South
                           African electricity mix as a first step in decarbonising South Africa’s electricity system
                           and transitioning to a low-carbon economy. However, and as will become apparent,
                           although the roll-out of large-scale renewables was particularly successful at the outset,
                           it increasingly faced challenges. Many would argue that these challenges were primarily
                           owing to South Africa’s high dependence on coal, which stretched much wider than the
                           dominant role of coal in South Africa’s power generation system. The challenges were
                           compounded by the growth and consolidation of the large and powerful state-owned
                           and vertically integrated monopoly, Eskom (Eberhard, 2007: 215).

10   Renewable Energy: Facts and Futures
Renewable energy technologies
Converting solar energy
(heat) into electricity
Converting solar energy
(light) into electricity
Solar thermal power plants convert the solar heat into
electricity by heating water to produce steam that feeds into
using photovoltaic systems
turbines, which generates electricity.
The benefit of CSP plants such as the one at Bokpoort in the
Northern Cape is that, unlike PV where the electricity must
Source: CRSES, 2017
be used immediately, it has the ability to store electricity. The
Bokpoort plant (see page 24) can store thermal energy for up to
9.3 hours, which means it can provide electricity at night. More
load importantly, it can feed into the grid to assist Eskom to cover
the country’s evening peak demand (17:00 to 21:00).
current
sunlight
Source: CRSES, 2017
a
n-type
silicon
junction
p-type
silicon
b
Absorber
photons
electron flow Tube
Reflector
Absorber
“hole” flow Reflectors
Tube
c
Photovoltaic (PV) panels consist of two types of Radiation from the sun
semiconductors: one is positively charged and the Absorber
other one negatively. When the sun shines on the Reflected radiation
semiconductor, the electric field across the junction
between these two layers causes an electric current.
The greater the intensity of light, the greater the flow
of electricity. d
Reflector
Absorber
Schematic of a PV system
Small-scale PV systems can generate electricity for
households and businesses that can power all electrical
appliances. These systems are normally installed on the
roofs of buildings. If the system produces more electricity
than needed, the excess electricity can be stored in batteries Reflectors
or it can be fed back into the grid (see Chapter 5).
In CSP plants, solar energy is concentrated on a point
Utility-scale PV power plants built in terms of the REI4P or line in one of the following configurations:
consist of a large number of panels erected in areas that
a. a parabolic trough c. a parabolic dish
have good solar resources (see Figure 1.3 in Chapter 1). b. a fresnal d. a central receiver
They feed electricity directly into the national grid at an
agreed tariff and are paid by Eskom (see Chapter 4).
The different configurations for CSP receiversUsing wind to generate electricity
Wind turbines use the patterns of wind direction and wind speeds to turn generators and
generate electricity. They usually have two or three thin blades of up to 50 m or longer that
are fixed to the top of a tower. Towers can range from quite short to very tall. Wind speed
increases with height above the earth’s surface owing to surface drag. Taller wind turbines
utilise the higher-speed winds above the earth’s surface.
Source: ESN in CRSES, 2017
Rotor
Swept area blade
of blades
Nacelle with
Rotor gearbox and
diameter generator
Hub
height
Tower
Underground electrical Foundation
connections (front view) (side view)
Drawing of the rotor and blade of a wind turbine
Similar to PV, smaller applications can be installed in and around structures that generate
electricity for residential use (off-grid and on-grid), telecommunication towers, small
businesses, farming activities and rural areas. These applications are usually installed in
conjunction with battery storage systems because wind energy resources are highly inconsistent
in some areas.
Utility-scale wind farms, like large-scale PV plants, have been erected in terms of the REI4P
and feed electricity directly into the grid (see Chapter 4).
Source: All the above sourced from the website of the Centre for Renewable and Sustainable Energy Studies, University of Stellenbosch (CRSES).
Available at: www.crses.sun.ac.za/files/services/schools/wind_energy/Wind%20Energy%2017%20ppt.pdf.
12 Renewable Energy: Facts and FuturesUsing water (hydro) to generate electricity
The kinetic energy of flowing water can be used to drive machinery, including electricity
generators. Gravity makes water flow from a high to a low place and the moving water
contains kinetic energy. Hydroelectric power stations are able to transform the kinetic
energy in moving water to electrical energy. Eskom operates hydroelectric power stations
at the Gariep Dam (360 MW) and the Vanderkloof Dam (240 MW).
Source: ESN in CRSES, 2017
GENERATOR DAM
Turned by the Raises river level
turbine – produces creating drop of water
electrical energy
TURBINE
Turned by the force
of falling water
TRANSMISSION LINES
Carry electricity to homes
and businesses
RESERVOIR
Stores water
Schematic of a hydroelectric power station
One can also use pumped storage plants to store electricity on a large scale, by using surplus
electricity to pump water to a mountain-top reservoir and then allowing it to flow down
when you need electricity. An example is the Ingula pumped-storage power station on the
border of KwaZulu-Natal and the Free State.
Source: ESN in CRSES, 2017
Upper
Upper
reservoir
reservoir
Lower Lower
reservoir reservoir
Schematic of a pumped storage scheme
Small-scale hydro power plants are part of the REI4P (see Chapter 4). They operate on the
same principle as large-scale hydro power plants and are generally smaller than 10 MW.
Source: All the above sourced from the website of the Centre for Renewable and Sustainable Energy Studies (CRSES), University of Stellenbosch.
Available at: www.crses.sun.ac.za/files/services/schools/hydro_energy/Hydro%20Energy%2017%20ppt.pdf.
Renewable Energy: What makes it a critical resource? 13© ABSOLUTE RIGGING
eskom’s re delays threaten
transport investments
The survival of a BEE company working in the
renewables sector is threatened by Eskom delays.
Delays by Eskom to sign off the next round of
state-commissioned wind farms have cost a local
black-owned transport and rigging company 30 jobs
since November 2016.
Absolute Rigging, a transport specialist in abnormal
loads, invested R60 million in equipment since 2014
in order to haul wind turbine components for new wind
farms, and increased its staff by 50. Eskom delays
threaten this investment.
14 Renewable Energy: Facts and Futures2. eskom vs RE and No discussion of renewable energy
will be complete without touching on
the sway of history
Eskom’s role in South Africa’s carbon-
intensive electricity landscape.
2.1 introduction
“Eskom, South Eskom, South Africa’s state-owned and vertically integrated power utility, controls the
country’s electricity transmission infrastructure. It currently supplies approximately
Africa’s state-owned
95% of South Africa’s electricity and 45% of electricity used on the continent (Eskom,
and vertically 2017a). The organisation was established in 1923 under the Electricity Act 42 of 1922
integrated power (Eskom, 2017b) with the mandate to establish generation and distribution undertakings
utility, controls the to supply electricity at the lowest possible cost (Eberhard, 2007).
country’s electricity As the main producer and distributor of electricity in the country, Eskom has been the
transmission key player and beneficiary of the Minerals Energy Complex (MEC). The MEC is the system
infrastructure.” of accumulation in which the South African minerals and energy sectors are intertwined.
Eskom’s generation undertaking was built around the availability of cheap, abundant coal
resources, with power stations located adjacent to coal mines. These mines, which were
privately owned, entered into long-term supply contracts with Eskom (Eberhard, 2007).
2.2 The years of plenty
By the 1970s, Eskom was the sole national electricity producer with the exception of a
few industrial, mining and municipal self-generators. Before this, most municipalities
generated their own electricity (Eberhard, 2007; see also Eskom, 2017b). The oil shocks
in the 1970s, which saw oil prices rising, led to an increase in the demand for electricity
as oil became more expensive. One of the consequences was South Africa’s reliance on
coal (Eberhard, 2007). During 1973 and 1974, electricity demand grew by 12% and 13%
respectively (Eskom, 2017b). All indications were that demand would soon outstrip
Eskom’s capacity at the time. In light of anticipated growth, Eskom increased its capacity
by building more coal-fired power stations.
The cost of the expansions led to an increase in the price of electricity, causing criticism
of Eskom. Furthermore, it became apparent that the anticipated growth in demand had
been over-estimated. (This is relevant to Eskom’s current expansion plans, particularly
related to new nuclear capacity.) This left Eskom with surplus generation capacity (Eskom,
2017c). Following the findings of the De Villiers Commission that was appointed in 1983
to investigate Eskom’s inefficiencies, the Electricity Acts of 1987 (Eskom Act 40 of 1987;
Electricity Act 41 of 1987) were promulgated. These Acts allowed Eskom to recover revenue
and created a new organisation with a two-tier structure (Eskom, 2017c). In a dramatic turn
of events, the newly established Eskom worked on getting rid of surplus generation capacity
through measures such as price-incentive policies, delaying construction of new plants and
mothballing and decommissioning older plants from 1987 to the early 1990s.
During this period, Eskom introduced policies to promote load growth through low-
cost electricity contracts to energy-intensive users, particularly those in the mineral
beneficiation industry (Eberhard, 2007). The low-cost electricity contracts set a precedent
for the energy-intensive industrial sector in South Africa. This had a permanent impact
on South Africa’s electricity planning and contributed significantly to South Africa’s high
carbon emissions in the years to follow. Then, in 2001, Eskom was converted from a
statutory body to a public company with the government as its only shareholder under
the Eskom Conversion Act of 2001 (Baker, 2016).
152.3 The years of scarcity
The years of plenty were followed by capacity constraints. These were caused by a
confluence of circumstances: strong economic growth that stimulated stronger electricity
demand following the 1994 democratic election, which continued until the global economic
crisis in 2008; the continuation of the historical management practices and investment
decisions followed under the apartheid government up until 1994; and investment decisions
taken by the new democratic government after 1994.
After 1994 the national grid was also extended to mostly black households, increasing
connected households from 35% under the apartheid government to 85% in 2015 (DoE,
2016; Marquard et al., 2007). However, the biggest consumers of electricity remained
energy-intensive industries as a result of the price-incentive policies during the years
of surplus. This remains the case today: it is estimated that 40% of electricity is used by
energy-intensive industries such as steel manufacturing in South Africa (EIUG, 2017).
How did the government’s indecision lead to the electricity crisis in 2007/08? In 2001,
the national government prevented Eskom from investing in new generation capacity
because it wanted to introduce competition in the electricity generation sector and slowly
move away from the Eskom monopoly. However, the government failed to put effective
policy and regulatory frameworks in place to support private sector participation. When
it became clear that the private sector would not be able to assimilate into the South
African electricity sector, Eskom was finally, in 2005, given the go-ahead to invest in new
generation capacity (Baker, 2016).
“Delayed policy In 2005, Eskom commenced with plans to build two coal-fired power stations, Medupi
(near Lephalale, Limpopo province) and Kusile (near Witbank, Mpumalanga), and a
resulted in a hydro pumped storage scheme, Ingula (near Ladysmith on the border of KwaZulu-Natal
national electricity and the Free State). However, these interventions came too late and the 2007 blackouts
crisis and in could not be avoided. This resulted in a national crisis and in early 2008 the government
early 2008, the declared a national emergency. Eskom was forced to resort to country-wide rotational
‘load shedding’ to protect the power system from a total shutdown. Load shedding lasted
government from 2007 until March 2008. Although Eskom put temporary interventions in place, the
declared a national country experienced another round of load shedding and blackouts in 2015. The temporary
emergency.” intervention in the form of diesel generators cost Eskom an estimated R22.8 billion during
the 2013/14 period, which affected the utility’s cash flow and its operations (Sesant, 2016).
2.4 The emergence of renewable energy
These challenges, coupled with South Africa’s voluntary pledge at the COP 15 climate
conference in Copenhagen in 2009 to reduce its carbon emissions from a ‘business-as-
usual’ scenario, opened the doors for the integration of renewable energy in South Africa’s
electricity mix. In August 2011, the Renewable Energy Independent Power Producer
Procurement Programme (REIPPPP or REI4P) was announced. After decades of control
by Eskom, the power generation part of the equation was about to shift formidably. The
way was now clear for the entrance of independent power producers into the power
generation market (Forder, 2016).
However, the South African electricity sector has been described as something of a paradox
(Baker, 2016). On the one hand it continues to build large coal-fired power plants that
underpin the country’s carbon-intensive electricity sector, while on the other hand it
pursues renewable energy, to the extent that South Africa has been labelled the leading
destination for renewable energy investments (DoE, 2015). Further complicating matters
is the fact that Eskom still holds the monopoly historically bestowed on it and has
‘significant interests vested in maintaining the status quo and little incentive to treat
competition [such has the IPPs] fairly’ (Montmasson-Clair, 2017). These aspects will be
discussed in more detail in Chapter 4.
16 Renewable Energy: Facts and FuturesEskom and RE and the sway of history 17
Think piece
Rethinking the Role of Coal
Saliem Fakir, Head of the Policy and Futures Unit, WWF-SA
South Africa’s high dependence on coal is a result of a natural endowment and
has been critical to the development of its industrial capability and economic
diversification. Historically, coal was a cheap energy source and cheap energy was
critical to the mining sector and other energy-intensive industries such as steel
making, smelting and the development of the railways. Coal is also important
in other ancillary industries such as heavy manufacturing and the chemical
industries. Although coal use has enabled South Africa to become the most
industrialised economy in Africa, it has also created a certain path-dependent form
of industrialisation and exports. The decision path South Africa has historically
followed continues to limit present scenarios, even though past circumstances have
changed. In this way, heavy industry and mining still remain at the heart of South
Africa’s industrial trajectory and exports.
Because the abundance of coal has allowed energy to become an essential feature
of production and the economy in general, there is a tight link between coal and
the South African economy. Coal has been used as an industrial development policy
tool to harness the enormous wealth and diversity of South Africa’s rich mineral
endowment. This has subsequently developed links into downstream industries,
creating a broad and loosely defined MEC. The MEC has been described by some
as a unique feature of a system of accumulation in which the minerals and energy
sectors are intertwined.
Given that the MEC sectors are by nature capital intensive, policies have
structured incentives in a manner that has further enhanced the capital intensity
of the economy. Today there are renewed policy attempts to stimulate economic
development by improving the beneficiation streams and linkages between mining
and industrial development. However, the extent to which these linkages can be
fostered in a significant way remains a challenge.
“Many factors are Path dependence will remain a strong feature of the coal economy given the
extensive cross-linkages with various components of the economy as a whole
narrowing the and the financialisation of coal assets on the Johannesburg Stock Exchange. Coal
window for coal to is also a significant contributor to job creation and export earnings. Thus coal will
remain the preferred not be easily matched by other energy carriers without significant effort and
fuel for energy.” resource availability.
However, the high use of coal, which has marked the South African legacy, will be
much more constrained in the future. Many factors are narrowing the window for
coal to remain the preferred fuel for energy, despite its domestic abundance, diverse
uses and cheapness. These factors vary from declining reserves, supply constraints,
quality and the global impact of coal on climate change issues. Large coal deposits
may even remain unexploited owing to a lack of financing and infrastructure. Coal
production and transport costs will also increase because poor quality coal needs
more washing, and new mines will not be located in close proximity to coal-fired
power stations.
These challenges – or what one may call headwinds for coal – mean that, as natural
and non-natural factors suggest, we need to find a way out of our path dependence
on coal to make the South African economy more resilient.
Eskom vs RE and the sway of history 17Eskom and RE and the sway of history 18
timeline
Electricity policies, legislation and key events that have shaped
and enabled the roll-out of renewable energy
Democratic The White Paper
elections The Constitution on Energy Policy
Cabinet memo
1994 1994 1998
preventing Eskom
from investing in
2001 new generating
capacity
2006 2003
30% of generation
from IPPs
Electricity White Paper on Renewable
Regulation Energy Policy
2007
Conceptualisation Act 4 of 2006
of REFIT by NERSA Cabinet approves further
generation capacity
2008 Integrated Energy Plan
National Energy Act Department of Energy
34 of 2008 formed
Load shedding 2009 COP 15
White Paper on Climate
2010 National emissions
reduction target
Change
Green Economy Accord REFIT
consultation
REI4P launch
2011
COP 17
Regulation on IRP
2014
IRP 2010 promulgated
2013 IRP Revision
South Africa’s
2015
Load shedding Intended Nationally
Determined
Contribution (INDC)
2014
Renewable Energy (Solar
Park) Programme 2016
(Government Gazette 603)
Draft IRP 20163. PUtting RE Key policy documents and legislation
guide and regulate the renewable
policy into action
energy sector in South Africa
under the auspices of various
government departments.
3.1 introduction
In the first chapter two seminal policy documents that initiated the roll-out of renewable energy
were mentioned, namely the White Paper on Energy Policy (1998) and the White Paper on
Renewable Energy Policy (2003). This chapter builds on these papers, highlighting key policy
documents and legislation that guide and regulate the renewable energy sector in South Africa,
as well as the key government departments responsible for the roll-out of renewable energy.
3.2 The Integrated Resource Plan
The key policy document determining the future of renewable energy in South Africa is the
Integrated Resource Plan (IRP), a subset of the Integrated Energy Plan (see 3.4 on page 22 for
more information). The IRP details potential scenarios for the types of electricity resources
and technologies in which South Africa should invest to meet national demand projections, and
the cost of each scenario, until 2030. It was created with the intention that it would be a ‘living
plan’ to be revised every two years by the Department of Energy (DoE). The process followed
is that the DoE releases a draft document for public participation during which different
stakeholders provide feedback on the content and make suggestions for the updated report.
The updated report is then promulgated into an official government plan upon approval. Three
IRP drafts have been published to date since its inception in 2010 but only the IRP 2010–2030
document has been approved and gazetted as an official government plan (Figure 3.1).
irp 2010 irp 2010 (updated) draft irp 2016
2010–2030 2013–2050 2020–2050
Gazetted (official) Not gazetted Revision 1
25 March 2011 21 November 2013 October 2016
Figure 3.1: Timeline of IRPs to date
3.2.1 IRP 2010
This document details the electricity plan for the 2010–2030 period and introduces RE-based
generation capacity. The context of this version is important because it came at a time when
South Africa was facing security-of-supply challenges following national load shedding in
2007/08. As a result, the report calls for 52.2 GW of new additional capacity from 2010
until 2030. In terms of the document, coal remains dominant but its share of energy production
will fall from 90 to 65% by 2030, while the renewable energy share will increase from 0 to
9%. The nuclear energy share is envisaged to increase from 5 to 23% (DoE, 2011; see also
Joffe, 2012).
Critical to note, however, is that this does not translate into an absolute decline, or even
the stabilisation of coal-based electricity. Coal-based electricity generation is still expected
to grow in capacity from 235 GWh to 295 GWh per annum over the 2010–2030 period,
largely owing to the completion of the two large-scale power plants, Medupi and Kusile
(Montmasson-Clair, 2017).
193.2.2 IRP 2010 update (2013)
This document is an update of the IRP 2010 document and is often also referred to as the IRP
2013. The planning horizon was extended to include the years 2013 to 2050, but the IRP 2013
was never adopted as a government policy document. However, the document acknowledges
that the cap of 275 Mt CO2e per annum for electricity, set in the IRP 2010, is not sufficient for
the electricity sector to align with the country’s climate change commitment (Montmasson-
“The 2013 review Clair, 2017). While keeping the IRP 2010 target as its base, the 2013 review proposes
proposes more more aggressive scenarios aimed at setting the electricity sector on a genuine low-carbon
aggressive scenarios development path compatible with the country’s climate objectives (Montmasson-Clair, 2017).
aimed at setting the
In general, solar photovoltaic (PV) and wind energy sources are pursued across all the
electricity sector on a scenarios, except for the ‘Big Gas’ scenario, which assumes an increase in the availability of
genuine low-carbon shale gas and imported gas for generation. The best scenario for renewables in this IRP is the
development path ‘High Nuclear Cost’ scenario, where newly built nuclear power stations are assumed to cost
approximately R56 000 per kilowatt (kW). As a result, the nuclear fleet is replaced with a
compatible with the
mixture of coal, gas and renewables. This scenario is especially favourable for new wind and
country’s climate concentrated solar power (CSP) developments. Under this scenario CSP capacity shoots up
objectives.” to 38 GW (Figure 3.2).
Source: Montmasson-Clair, 2017
100 000
120 000
130 000
110 000
10 000
20 000
30 000
40 000
50 000
60 000
70 000
80 000
90 000
0
irp 2010 (2030 plan)
2013 irp (Constant emissions 2030)
2013 irp (Moderate decline 2030)
2013 irp (Advanced decline 2030)
2013 irp (Carbon budget 2030)
WWF (High scenario 2030)
WWF (Low scenario 2030)
2013 IRP (Constant emissions 2050)
2013 IRP (Moderate decline 2050)
2013 irp (Advanced decline 2050)
2013 irp (Carbon budget 2050)
Coal ccgt OCGT / Gas engines Hydro Nuclear Solar PV CSP Wind Other
Figure 3.2: Electricity mix (in MW of generation capacity) in 2030 and 2050
according to different scenarios
3.2.3 Draft IRP 2016
This document is still under consultation and therefore only the base case scenario can be
considered (Figure 3.3). Regarding renewable energy new-build options, this draft only makes
allocations for solar PV, wind and landfill gas technologies. Unlike previous versions, solar CSP
is excluded from new-build options. This means only CSP projects committed to in the REI4P
project up until bid window 4.5 are considered.
20 Renewable Energy: Facts and FuturesSource: DoE (2016)
solar pv WIND landfill gas
Source: Montmasson-Clair, 2017
Figure 3.3: Renewables base case new-build options in the IRP 2016 draft
Much criticism has been aimed at the IRP 2016, ranging from erroneous inconsistent
technology costs used for renewable energy in the draft base case presented, to the arbitrary
and artificial constraints on the delivery of renewable energy, namely 1 000 MW per year
for solar PV, and 1 600 MW per year for wind power. Critics have pointed out that there is
no justification for these constraints, other than the fact that these same constraints were
contained in the previous IRP in 2010, albeit at a time when there was no South African
renewable energy industry, utility-scale solar PV or wind power plants in South Africa, and
when international solar PV and wind prices were significantly higher compared to what they
are now. In spite of not having commissioned any large renewable integration study to support
their contention, Eskom cites as reasons for these constraints limitations on the ability of the
grid to accommodate more than a fixed amount of renewable energy capacity per year. Further
limiting the potential of increased renewable energy to address climate change concerns is
the inclusion of a carbon emission constraint for the years ahead to 2050, in the form of the
‘moderate peak-plateau-decline’ carbon emission trajectory (Scholtz & Fakir, 2017).
3.3 The future: the IRP re-optimised
The CSIR developed the ‘least-cost electricity mix for South Africa by 2030’, which was
published in November 2016 at around the same time that the IRP 2016 draft was published.
This document is an updated analysis of the IRP 2010 for the planning period 2020–2040.
The primary aim is to update two main assumptions since the IRP 2010 was published, namely
that the demand that was forecast has dropped significantly since then, and that the costs of
solar PV and wind technologies are lower than those used in forecast predictions.
The research demonstrates that the most cost-optimal expansion is a >70% renewable energy
share by 2050, which will also be R80 billion ($6 billion) per year cheaper by 2050 than the
current base case scenario. It also reduces CO2 emissions by 65% (-130 Mt/yr) compared to the
“The CSIR research base case scenario. This means that South Africa can de-carbonise its electricity sector without
demonstrates that having to trade off clean energy against lowest cost. The CSIR recommends, similar to the
solar PV, wind Ministerial Advisory Council on Energy, that the base case scenario should be least-cost, and
free of any artificial constraints. Limits of building new renewable energy developments should
and flexible power be lifted, relative costs of wind and PV should be updated, and the unconstrained re-optimised
generators are the case should form the base case scenario of IRP 2016. If this option is implemented, the lowest-
cheapest new-build cost option for South Africa’s energy mix is a 70% share of renewables by the year 2040 with
a cost reduction of R90 billion annually by 2040. In addition, this scenario will use less water
mix for the South
and has a higher number of employment opportunities. Most importantly, there is no need to
African power bring expensive nuclear plants into the system that forms a large part of the proposed future
system.” energy mix (Wright et al, 2016; see also Scholtz & Fakir, 2017).
Putting RE policy into action 21Source: DoE, 2016
1. Business-as-usual 2. Re-optimised
Total installed net Total installed net
capacity in GW capacity in GW
200 200
Solar PV
175 175
CSP
150 150
Wind
125 125 Other RE
100 100 Peaking
2040 Peak: Other
75 68.7 GW 75 68.7 GW (incl. cogen)
Gas
(CCGT)
50 2030 Peak: 50 53.2 GW Hydro
(incl. PS)
53.2 GW
25 25 Nuclear
0 0 Coal
2016 2020 2025 2030 2035 2040 2016 2020 2025 2030 2035 2040
Electricity sector CO2 Electricity sector water
emissions in Mt CO2/yr use in billion litres/yr
300 70
275 275
61
250
60 56 55
250 231
216
49
195 50
200
-150 Mt/yr -40 billion litres/yr
(-60%) 40 (-60%)
150
30
BAU
100
Re-optimised
99 20 22
CO2 Cap
50
10
0 0
2015 2020 2025 2030 2035 2040 2015 2020 2025 2030 2035 2040
Figure 3.4: The re-optimised scenario for renewables by the CSIR
compared to a ‘business-as-usual’ scenario
3.4 other key policies and legislation
The National Development Plan (NDP) outlines the 2030 vision for South Africa’s energy
sector and envisages a sector that will promote, inter alia, ‘economic growth and development
through adequate investment in energy infrastructure and the provision of quality energy
services that … promote environmental sustainability through efforts to reduce pollution and
mitigate the effects of climate change’ (NDP, 2011). In particular, it proposes that renewable
energy and gas should make up 20 000 MW of the electricity supply by 2030 (GCIS, 2016).
The Green Economy Accord is an agreement between government, business and labour
sectors which focuses on the need to stimulate the green economy and the critical need to create
jobs. This document commits to achieving low-carbon-based economic development growth
through renewable energy and green jobs (Department of Economic Development, 2011).
22 Renewable Energy: Facts and FuturesMore energy specific is the Integrated Energy Plan (IEP) (2016), which provides a roadmap
for the future energy landscape in South Africa, and guides future energy infrastructure
investments and policy development (DoE, 2015a). It has still not been approved by the Cabinet
(Baker, 2016) and is currently out for public comments.
Energy-specific legislation includes the National Energy Act 34 of 2008, which provides
(in the Preamble to the Act) ‘for energy planning, increased generation and consumption of
renewable energies, contingency energy supply, holding of strategic energy feedstocks and
carriers, adequate investment in, appropriate upkeep and access to energy infrastructure’.
“In particular The Electricity Regulation Act 4 of 2006 empowers the Minister of Energy to
determine, approve and procure new electricity generation capacity. A licence for generation
it proposes that
capacity is subject to ministerial approval. Renewable energy projects by IPPs that are larger
renewable energy than 1 MW need a generation licence (DoE, 2015b). In view of the rapid rise of embedded
and gas should make generation (primarily PV on rooftops), in particular project developers who are increasingly
up 20 000 MW of developing large renewable energy generation facilities, it has been necessary to review existing
regulations relating to these facilities. (The amendments contained in the Draft Licencing and
the electricity supply Registration Notice published for public comment in December 2016 will be discussed in more
by 2030.” detail in Chapter 5.)
3.5 Government mandates
Over and above Eskom, there are a multitude of government departments and stakeholders
whose decisions and actions impact on the development and implementation of renewable
energy. Key players include the DoE, the Department of Public Enterprises (DPE), the South
African National Energy Development Institute (SANEDI), and the National Energy Regulator
of South Africa (NERSA). Each of these bodies has a different role and intervenes at a different
stage in the electricity value chain (Table 3.1).
Table 3.1: Key role players and their mandates
Role player Mandate
Department of Energy (DoE) Custodian of policy and planning for the energy sector, focusing on energy security through
diversifying the country’s energy mix to include renewable energy sources
National Energy Regulates the energy sector in the context of national policy and planning, license new
Regulator of South Africa energy infrastructure and regulate electricity and hydrocarbons infrastructure tariffs
(NERSA)
National Treasury Governs fiscal and procurement policies
Department of Trade Develops local industries and trade with particular focus on green industries and
and Industry (DTI) job creation; works to attract foreign investment
Department of Public Shareholder in Eskom, the sole power off-taker
Enterprises (DPE)
Department of Economic Sets and develops economic policy, economic planning and economic development;
Development focuses on employment creation and the green economy
Department of Sustainable development and environmental integrity; grants environmental authorisations
Environmental Affairs (DEA) in terms of the National Environmental Management
Act (NEMA)
Provincial departments Regulate private renewable energy generation (embedded generation)
and municipalities through by-laws and policies
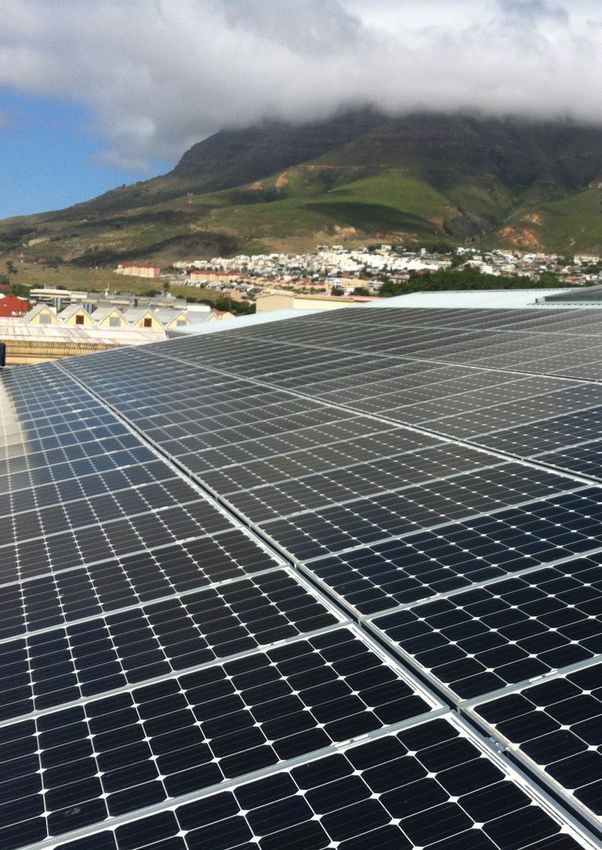
Putting RE policy into action 23© Leonie Joubert
Renewables revitalise rural areas
The Bokpoort solar thermal power plant south of Upington
is creating thousands of jobs in local communities.
The 50 MW Bokpoort concentrated solar thermal power
plant outside Groblershoop, an hour south of Upington,
has eight ‘solar fields’, which means rows and rows of
mirrors that need cleaning each week. The operational
jobs associated with this and similar renewable power
plants around the country will benefit communities living
near the plants for the 20-year life-span of each plant.
At its construction peak, over 1 300 jobs were created at
the plant, filled largely by the local community previously
dependent on farm work.
An analysis of the job opportunities associated with the
state’s renewable energy programme by the University of
Cape Town’s Graduate School of Business estimates that
the number of construction and operational jobs across all
96 plants in the REI4P programme will be close to 110 000
in total. Nearly 85 000 of these will be specifically for black
South Africans, and nearly 58 000 for people living in the
vicinity of the sites.
24 Renewable Energy: Facts and FuturesYou can also read