Rapid Country Assessment: South Africa The impacts from a COVID-19 shock to South Africa's economy and labour market - ILO
←
→
Page content transcription
If your browser does not render page correctly, please read the page content below
August / 2020 Rapid Country Assessment: South Africa The impacts from a COVID-19 shock to South Africa’s economy and labour market. Authors / Ilan Strauss, External consultant Gilad Isaacs, Co-Director of the IEJ Josh Rosenberg, Research assistant, IEJ Patieene Passoni, External consultant on input-output modelling
Copyright © International Labour Organization 2020

This is an open access work distributed under the Creative Commons Attribution 3.0 IGO License (http://creativecom-
mons.org/licenses/by/3.0/igo). Users can reuse, share, adapt and build upon the original work, even for commercial
purposes, as detailed in the License. The ILO must be clearly credited as the owner of the original work. The use of the
emblem of the ILO is not permitted in connection with users’ work.

Translations – In case of a translation of this work, the following disclaimer must be added along with the attribution:
This translation was not created by the International Labour Office (ILO) and should not be considered an official ILO
translation. The ILO is not responsible for the content or accuracy of this translation.

Adaptations – In case of an adaptation of this work, the following disclaimer must be added along with the attribution:
This is an adaptation of an original work by the International Labour Office (ILO). Responsibility for the views and opinions
expressed in the adaptation rests solely with the author or authors of the adaptation and are not endorsed by the ILO.

All queries on rights and licensing should be addressed to ILO Publications (Rights and Licensing), CH-1211 Geneva 22,
Switzerland, or by email to rights@ilo.org.

ISBN: 978-92-2-0328828 (web PDF)

The designations employed in ILO publications, which are in conformity with United Nations practice, and the
presentation of material therein do not imply the expression of any opinion whatsoever on the part of the International
Labour Office concerning the legal status of any country, area or territory or of its authorities, or concerning the
delimitation of its frontiers.

The responsibility for opinions expressed in signed articles, studies and other contributions rests solely with their
authors, and publication does not constitute an endorsement by the International Labour Office of the opinions
expressed in them.

Reference to names of firms and commercial products and processes does not imply their endorsement by the
International Labour Office, and any failure to mention a particular firm, commercial product or process is not a sign of
disapproval.

The impacts from a COVID-19 shock to South Africa’s economy and labour market. Preface The objective of the rapid country assessments launched by the Employment, Labour Markets and Youth Branch (EMPLAB) of the ILO around the world is to provide constituents and other stakeholders with a practical tool for the real-time diagnosis of the employment impacts of the COVID-19 pandemic to inform policy responses. The assessments examine the dramatic effects of the pandemic on economic growth and employment and how it has exacerbated labour market vulnerabilities and inequalities. They also show the importance of a prompt and targeted policy response and the value of social dialogue. Given the large number of jobs lost in the wake of the 2008 global financial crisis (GFC), and the larger size of the COVID-19 crisis, via health and economic channels, we can expect at least as many job losses, if not more. South Africa has been the hardest-hit African country; globally, it has the 5th highest number of Covid-19 cases, despite some of the strictest lockdown regulations. Compounding this situation, the pandemic has come at a difficult time for South Africa. Last year the economy was already slowing, leading to increasing unemployment. As a result, the Covid-19 crisis has led to a fall in formal employment and 9 out of 10 South African businesses have reported losses in turnover. This assessment investigates the short-term impact of the COVID-19 crisis on the South African economy and labour market, as well as exploring the effectiveness of measures related to the containment and reopening stages of the crisis. The results present a somber picture on employment outcomes, revealing that groups, who were already disadvantaged before the crisis, have been disproportionately affected. The response to the COVID-19 pandemic needs a combination and sequencing of measures related to the containment, reopening and eventual recovery once the global pandemic has been brought under control. The four pillars of the ILO Covid-19 policy framework highlight the importance of maintaining stimulus, continuing support to enterprises, jobs and incomes, protecting workers in the workplace, especially for those at the frontline and using social dialogue to arrive at more effective policy solutions. Over the longer term, policymakers around the world need to address the persistent inequalities that have been exacerbated by the COVID-19 crisis and work towards building a better future of work and a more resilient labour market. Sukti Dasgupta Chief Employment, Labour Markets and Youth Branch 1
The impacts from a COVID-19 shock to South Africa’s economy and labour market. 1. Overview As GDP collapsed over the first half of 2020, the COVID-19 crisis has evolved into the worse economic downturn since the Great Depression, severely impacting labour markets around the world, including in South Africa. 1 The expected contraction of GDP in South Africa will, according to the South African Reserve Bank (SARB), be worse than during the Great Depression in 1930. 2 The OECD’s June 2020 forecast is for unemployment rates to nearly double in OECD economies as a whole. 3 In a “single-hit” scenario, the OECD forecast is that South Africa’s narrow unemployment rate will increase from 29.7 per cent in Q4 2019 to 34.5 per cent by Q4 2020. 4 By limiting both consumers’ ability and confidence to spend and that of producers to provide goods and services, COVID-19 severely impairs the maintenance of production and employment levels. Governments have responded by attempting to sustain incomes, as consumption collapses, through transfer payments and increased unemployment benefits, and by maintaining employer– employee working relations through furlough schemes. In advanced economies with meaningful rescue packages, such schemes have attempted to be proportionate to the estimated incomes lost because of temporary and other job losses. Developing economies, although facing more limited fiscal space, are trying to raise external financing in an attempt to implement similar support measures. A higher number of informal sector workers, precarious workers and already unemployed workers means that such interventions are being designed differently in developing economies. The pandemic has come at a difficult time for South Africa’s highly unequal economy. South Africa was already in recession prior to the arrival of COVID-19, having experienced three quarters of continuous contractions to its GDP between Q3 2019 and Q1 2020. 5 South Africa’s level of unemployment is already among the highest in the world, at 30.1 per cent as of Q1 2020. Large proportions of the working population earn below various measures of poverty. Of those employed, 6 60.5 per cent earn below the working poverty line of R5 086 ($300) per month, while 13 per cent earn below the Upper Bound Poverty Line (UBPL) of R1 183 ($70) per month; employment (including waged and self-employment) is a crucial means of tackling poverty. As a result, the virus risks exacerbating the already incredibly high levels of inequality and working poverty in South Africa’s labour market. In addition, a fall in tax revenue from a contracting economy, together with limited COVID-19 spending, is putting added strain on government finances, with regard to which the debt-to-GDP ratio is projected to increase rapidly, from 63.5 per cent in early 2020 to 81.8 per cent by year end, 7 with a budget deficit of up to 16 per cent of GDP in 2020. This rapid assessment investigates the short-term impact of the COVID-19 crisis on the South African economy and the specific features of its labour market. It assesses the immediate impact of three possible contractions in final demand of 5 per cent, 10 per cent, and 15 per cent, on South Africa’s gross output, value-added, wages, and employment, focusing on the impact on employment by industry, gender, level of skill, formality, and wage earning level. This in turn allows us to assess the extent to which current policies are able to stem or ameliorate the impacts of the pandemic on the South African labour market. As a short-run model, it assumes fixed prices and technology. As a result, we do not comment on the long-run impact of these shocks; for example, how long it will take the South African economy to regain the lost jobs. 8 1 See latest blog by IMF Chief Economist Gita Gopinath. Available at: https://blogs.imf.org/2020/06/24/reopening-from- the-great-lockdown-uneven-and-uncertain-recovery/ 2 Lesetja Kganyago. Lecture. “The coronavirus shock, and ‘the age of magic money’”. Wits School of Governance Johannesburg 18 June 2020. The South African Reserve Bank. Available at: https://www.resbank.co.za/Lists/Speeches/Attachments/563/The%20SARB%20the%20coronavirus%20shock%20and% 20the%20age%20of%20magic%20money.pdf 3 OECD, 2020. Economic Outlook, June 2020. Available at: http://www.oecd.org/economic-outlook/june-2020/ 4 Unless otherwise stated, the broad unemployment rate is used throughout the rest of the paper. 5 0.8 per cent in Q3 2019, 1.4 per cent in Q4 2019 and 2 per cent in Q1 2020. In Q1 2019 the economy contracted by 3.2 per cent. These are quarter-on-quarter contractions. 6 Persons in employment are defined as all those of working age who, during a short reference period, were engaged in any activity (even for only one hour) to produce goods or provide services for pay or profit. It thus includes wage or salaried work, own-account work, and self-employment, as well as informal employment across all sectors of the economy. 7 South African National Treasury, 2020. Supplementary Budget Review 2020. 8 This paper uses a short-run model and does not assess how the economy adjusts to the initial shock over time; in other words, how and what sort of equilibrium it returns to 2
The impacts from a COVID-19 shock to South Africa’s economy and labour market.

 South Africa recorded its first COVID-19 case on 5 March 2020, just over three months after the
 outbreak was reported to the regional World Health Organization (WHO) office in Wuhan. At the
 time, Italy’s death toll was nearing 80, with global cases rapidly approaching 100 000. On 15 March
 2020, South African President Cyril Ramaphosa declared a National State of Disaster, with measures,
 including the closure of schools and travel restrictions, commencing just three days later. A 21-day
 national lockdown of all but essential workers began on 26 March 2020 with around 400 cases,
 although testing was sparse. The lockdown was extended for a further 14 days beyond its expected
 end, with minor business emergency relief measures announced. On 21 April 2020, a R500 billion
 emergency rescue package – including additional health and related spending, wage support,
 expanded social security, business loans and tax deferments – was announced, amounting to around
 10 per cent of GDP. Much of this has not been effectively implemented, however, and the subsequent
 budget consists largely of resources reallocated from other pre-existing, already committed
 expenditure (discussed further below). A slight easing of restrictions began on 1 May 2020, with a
 further easing starting at the beginning of June. As of 9 July 2020, South Africa’s case numbers were
 reported as 238 339, an increase of 79 006 from the start of the month, with the highest proportion
 of cases (34.2 per cent) in Gauteng province. The number of tests administered amounts to a little
 over 2 million, with the public (46 per cent) and private (54 per cent) sectors’ contribution to these tests
 nearly equal. There had been 3 720 deaths as of 9 July 2020, with a mortality rate of 1.6 per cent; an
 increase of 35 per cent since the start of July 2020. 9

 Given the large number of jobs lost in the wake of the 2008 global financial crisis (GFC), and the
 larger size of the COVID-19 shock to GDP, job losses are expected to be greater in 2020. Following
 the GFC, South Africa experienced three continuous quarters of economic contraction, 10 equal to
 approximately –2 per cent of GDP, before recovering quickly due to a strong recovery in commodity
 prices. During that crisis, used for illustrative purposes as South Africa’s most recent acute economic
 crisis, it took 24 months for employment to bottom, during which time a total of 1.12 million jobs were
 lost. 11 In the wake of the crisis it took almost five years for South Africa’s labour market to surpass its
 previous absolute jobs peak in Q4 2008. 12 In contrast, the current shock to South Africa’s GDP from
 COVID-19 is forecast to be several times larger than the GFC shock, while the recovery in South Africa
 is expected to be extremely gradual, according to both the IMF and the OECD, 13 as commodity prices
 and global demand (including tourism) remain muted. Based on these current projections it is highly
 unlikely that job losses will be less than those experienced in the wake of the 2008 global financial
 crisis, and indeed they are expected to be far greater.

 The economic contraction resulting from COVID-19 differs from previous economic crises. For
 example, consumption spending has been reduced in an unusual manner. While it is not possible to
 estimate what would have happened without lockdown, this has occurred, in part, due to a deliberate
 decision to slow the spread of the virus through various forms of lockdown and containment
 measures. The distribution of its impact across sectors will therefore be uneven. In particular,
 consumer-facing service sectors have, and will continue to be, hard hit due to restrictions on
 consumers’ movements; regulations limiting non-essential retail, entertainment, cultural events and
 so on; and falling disposable incomes. This is taken into account in the modelling used here.

 The estimates of jobs at risk presented here are conservative in several respects. This
 conservativism is highlighted by the estimates here being below the recently published outcomes of
 the NIDS-CRAM survey. The survey revealed an 18 per cent decline in employment between February
 and April 2020, meaning that 3 million fewer people were employed in April compared with February.
 In addition, one in three income earners did not earn in April 2020. 14 These results are almost double
 the jobs at risk shown here. Although many workers report permanent job loss, it is likely that the

 9
 All data and statistics are from the South African COVID-19 Online Resource & News Portal. Available at:
 www.sacoronavirus.co.za
 10
 Statistics South Africa. Measuring South Africa’s Economic Growth. Available at:
 https://www.statssa.gov.za/economic_growth/15%20Measuring%20GDP.pdf
 11
 Based on QLFS data, total employment (formal and informal) declined from a peak of 14.768 million jobs in Q4 2008 to
 a trough of 13.647 million in Q3 2010.
 12
 South Africa surpassed its Q4 2008 total employment peak only in Q3 2013 (QLFS).
 13
 “[A]nd the recovery is projected to be more gradual than previously forecast”, See IMF. World Economic Outlook. June
 2020 Update. Available at: https://www.imf.org/en/Publications/WEO/Issues/2020/06/24/WEOUpdateJune2020 .; and
 for South Africa in particular see: OECD South Africa June 2020 forecast note. Available at: https://www.oecd-
 ilibrary.org//sites/0d1d1e2e-en/1/3/3/41/index.html?itemId=/content/publication/0d1d1e2e-
 en&_csp_=bfaa0426ac4b641531f10226ccc9a886&itemIGO=oecd&itemContentType=#
 14
 Spaull et al., 2020. NIDS-CRAM Wave 1 Synthesis Report: Overview and Findings. Available at:
 https://cramsurvey.org/wp-content/uploads/2020/07/Spaull-et-al.-NIDS-CRAM-Wave-1-Synthesis-Report-Overview-
 and-Findings-1.pdf
 3
The impacts from a COVID-19 shock to South Africa’s economy and labour market.

 severity of the lockdown showed a significant short-term skewing upwards of the number of
 unemployed. Our findings refer to a longer time period than covered by the NIDS-CRAM survey.
 However, these may be conservative in the medium term also because: (i) we do not take into account
 second-round effects – the large induced falls in employment that would follow from how the fall in
 total output will further reduce consumption and investment spending. In this respect, our results
 only account for the initial annualized fall in consumption, investment spending, and exports from a
 one-off contraction of final demand (rather than how shrinking total output may feed back into even
 lower final demand). (ii) We also modify our headline figure of jobs at risk to focus on immediate jobs
 at risk. This assumes that all skilled workers in the economy are unable to lose their jobs in 2020 and
 instead experience adjustments through, for example, working hours or pay. (iii) We assume that the
 Government will act such that its spending increases in 2020 in absolute terms relative to its 2019 level
 (leading to a percentage increase in its fiscal expansion). 15 This works to support employment in the
 economy.

 We primarily use the term “jobs at risk” because jobs may not be “lost” permanently when an
 economic shock hits an economy. Moreover the labour market will adjust through other mechanisms
 in addition to outright job losses, such as furloughs, reduced hours, pay cuts, and so on. The term
 “jobs lost” is also used because technically that is what the model is showing.

 Based on a 10 per cent initial one-off shock to final demand 16 1.77 million jobs are at risk of being
 lost over the next 24 months or so. This would result in a fall of total wage income of 7.6 per cent,
 amounting to R185 billion in lost wages, which the Government would need to attempt to offset
 through direct household transfers, government employment schemes, and furlough subsidies. This
 loss occurs in response to an induced fall in “gross” (total) output (that is, including intermediate
 production) of 16.3 per cent and in value added of 9.6 per cent. 17

 Looking at immediate jobs at risk (over the next 12 months or so), we remove skilled workers
 from headline job loss estimates (although, for model consistency, retain them when
 disaggregating – see below). This assumes relatively fixed labour contracts and the ability to work
 remotely for these workers. This includes a large portion of government workers with strong union
 contracts. Based on a median shock to final demand of 10 per cent we find 1.485 million jobs at
 immediate risk (with 1.77 million jobs at longer-term risk, including skilled workers). If lost, this would
 be 50 per cent more job losses than from the total GFC contraction and amounts to 9.1 per cent of the
 16.42 million jobs (formal and informal) in the South African economy in Q4 2019. This risks raising
 South Africa’s narrow unemployment numbers to 36.47 per cent, thereby undoing all job growth since
 2008.

 Jobs at risk are concentrated in the formal private tertiary sectors of the South African
 economy. The service sector, along with agriculture, is experiencing large contractions because they
 are most driven by consumption spending. Under a 10 per cent shock to final demand, the eight
 hardest-hit sub-sectors are wholesale and retail trade (–409,405 jobs, –12.8 per cent of this sector’s
 jobs), followed by other community, social, and personal services (–289,364, –14.1 per cent); business
 activities (–187,072, –12.9 per cent); agriculture (–131,661, –13.5 per cent; construction (–120,808, –
 12.9 per cent); professional business services (–124,471, –12.5 per cent); transport and storage (–
 83,075, –13 per cent); and catering and accommodation (–75,551, –13.6 per cent). These sectors
 account for 80 per cent of all jobs at risk.

 15
 Because government is not well “connected” to (or integrated with) the rest of the economy in the Quantec tables used,
 expansionary government fiscal policy leads to government employment increasing by 91 287 jobs in our mid-range
 (10 per cent) scenario, although in practice these jobs will be more widespread throughout the economy. If
 government linkages were better articulated in the Quantec input-output tables then the number of jobs saved and
 expanded through government fiscal policy would also be greater.
 16
 Final demand consists of exports, investment spending, and consumption spending. GDP is equal to final demand plus
 imports. Assuming that final imports contract by a similar amount to imports then the initial contraction of final
 demand will be roughly similar to the contraction in GDP. This is broadly in line with OECD forecasts, which see final
 demand in South Africa falling by –7.5 per cent in 2020 and GDP falling by 8.2 per cent because it projects export
 demand for South African–produced items to shrink more than South Africa’s import demand. See OECD, June 2020.
 South Africa Country Note. Available at: https://www.oecd-ilibrary.org//sites/0d1d1e2e-
 en/1/3/3/41/index.html?itemId=/content/publication/0d1d1e2e-
 en&_csp_=bfaa0426ac4b641531f10226ccc9a886&itemIGO=oecd&itemContentType=#
 17
 Equal to the sum of wages, profits, and government taxes. Government taxes = government net indirect taxes on
 production + government net indirect taxes on products.
 4
The impacts from a COVID-19 shock to South Africa’s economy and labour market. The majority of immediate jobs at risk are lower skilled. Based on a 10 per cent shock to final demand, 83.7 per cent of all jobs at risk are less-skilled employment (only 16.3 per cent of jobs at risk are highly skilled, before these are deducted), while 51.4 per cent of jobs at risk are in the lowest and the “basic” skill categories (which comprises all informal sector work) – see Appendix for definitions. These skill levels tend to include the lowest paying jobs, and are found more frequently in the informal sector. As a result, 510 852 informal-sector jobs are at risk, although our estimates of informal employment are highly uncertain given the uncertainty with which the data source forces us to define informal sector employment. 18 Informal-sector workers are hit hard because value chains with a high concentration of informal workers tend to be in subsectors driven by consumption-heavy areas of the economy, such as retail, catering and accommodation, transport and storage, and business activities. Men and women are impacted largely equally in terms of their relative proportions of employment. Women, who represent 44 per cent of total employment, risk shedding 707 518 jobs, equivalent to 9.8 per cent of the total number of employed women, representing 40 per cent of job losses under a 10 per cent shock. Men risk losing 1 066 514 jobs, or 11.6 per cent of all men employed at the end of Q4 2019. However, this is against a backdrop of a pre-existing higher broad unemployment rate for women of 39.9 per cent (34.2 per cent for men) as of Q4 2019. The largest number of jobs are at risk for both women and men in the trade sector, at 178 277 (25 per cent of all jobs at risk for women) and 231 129 (22 per cent of all jobs at risk for men) jobs at risk, respectively. Other community, social, and personal services – which includes domestic work – have a considerably higher potential loss of jobs for women than for men, and are also the second highest source of job losses for women (–163 707), accounting for roughly one-quarter of all female job losses. This is not surprising, given that this sector includes domestic work and other social care functions. For men, job losses are concentrated in wholesale and retail trade; other community, social, and personal services; business activities; agriculture; and construction. These sectors account for 62 per cent of all male job losses. Those in poverty have been impacted most by the COVID-19 shock. Assuming a 10 per cent contraction of final demand, 11.6 per cent of those in working poverty (earning below R5 086 per month) are at risk of job losses, compared with 9.8 per cent of workers earning above the working poverty line. Those in working poverty also comprise 64.6 per cent of total job losses. Some 15 per cent of all workers impacted are earning below the UBPL of R1,183 per month, even though they only represent 13 per cent of total workers. Around 35 per cent of job losses for those earning below the UBPL are in the other community, social and personal services sub-sector, most likely as domestic workers, gardeners, cooks or other similarly low-wage precarious workers. These workers require targeting for specific relief, given their precariousness. This rapid assessment expands and analyses the key findings laid out above. Section 2 provides a brief look at the current state of the South African economy and estimates how the wider economy will be impacted by COVID-19. Section 3 provides estimates on the impact on labour of a COVID-19 shock to final demand, beginning by presenting existing estimates for employment losses on the South African economy from COVID-19, before proceeding to the modelling used here. Section 4 looks at the policy implications of our findings in light of the current orientation of South Africa’s rescue package for the economy, with some suggested interventions by government. Section 5 concludes. A separate Appendix contains graphs relevant to the rapid assessment, as well as a more detailed overview of our input-output model, and variable and data definitions. 2. The South African economy COVID-19 has hit South Africa at the time of a considerable build-up in economic vulnerabilities, making its economy less resilient to external shocks. South Africa was in a technical recession in 2019, before the COVID-19 crisis. GDP growth peaked at 3.19 per cent in 2008 before consistently falling to below 3 per cent since 2012, and below 2 per cent since 2014. 19 Meanwhile, GDP per capita growth 18 The Quantec input-output tables used draw from two employment surveys, QES and QLFS, and give a different number for informal-sector employment than is typically the case in academic and policy research that uses only the QLFS – see Appendix for further details. 19 World Bank Group, 2020. World Development Indicators [dataset]. Available at: https://databank.worldbank.org/source/world-development-indicators/ 5
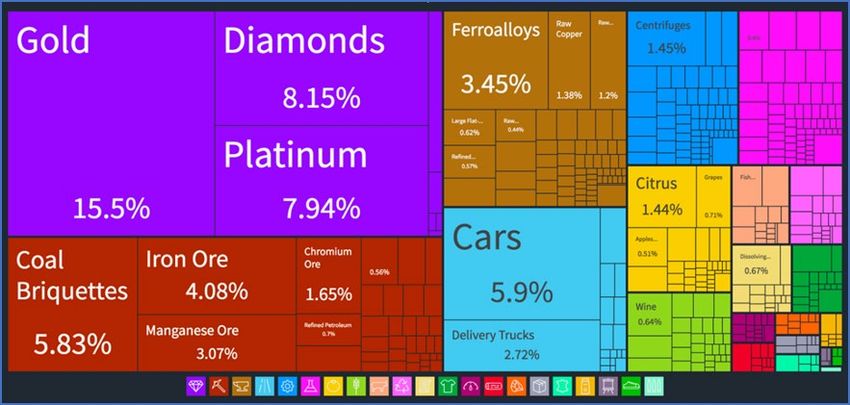
The impacts from a COVID-19 shock to South Africa’s economy and labour market.

 has been less than 1 per cent, or negative, since 2012. 20 GDP contracted by 0.8 per cent in the third
 quarter of 2019, followed by 1.4 per cent in the fourth quarter of 2019, and 2 per cent in Q1 2020 (all
 quarter-on-quarter contractions). 21 Slowing (and now negative) GDP growth has in turn fed into South
 Africa’s broad unemployment rate, rising rapidly since 2018, after increasing at a growing rate since the
 fall in commodity prices and global demand from 2014. These trends in unemployment are shown in
 Figure 1.

 Figure 1. Broad unemployment rate relative to log of GDP (2000-2019)

 Note: Unemployment rate is highly cyclical in South Africa, increasing and then declining during the commodity boom from
 2003, before increasing steadily from 2014.
 Source: South African Reserve Bank (GDP) and QLFS for employment. Broad unemployment includes discouraged workers and
 the informal sector.

 South Africa’s macroeconomic problems are structural in nature, related to an over-reliance on
 commodity exports, an unequal and “cheap” labour structure, and slow growth rates in both
 public and private fixed capital investment, including in education, health care, essential
 infrastructure, R&D, and software and hardware. Export growth has slowed since 2014, while human
 capital investment remains weak (see, for example, the World Bank’s Human Capital Index). South
 Africa’s economy is – classically – constrained by a lack of technological sophistication in its production
 structure from driving higher rates of employment-absorbing economic growth. This causes a balance
 of payments constraint that potentially hampers attempts to stimulate domestic employment. This is
 evident in South Africa’s ranking seventh out of 219 countries for imports per capita in 2018. 22 Since
 2000 the complexity of South Africa’s export structure has constantly declined, exacerbated perhaps by
 higher commodity prices. 23 Since the drop in commodity prices, South African export growth in goods
 and services has fallen to less than 4 per cent per annum since 2011, becoming negative in 2017.

 Slow growth since 2014, a reduced tax intake exacerbated by tax cuts, growing government
 employment expenditures, and state-owned enterprise expenditures (and contingent liabilities)
 have put strain on the budget. The pre-COVID-19 2020 National Budget projected the fiscal deficit to
 widen from –4.2 per cent of GDP in 2018 to –6.8 per cent in 2020. High borrowing costs play a major
 role, with Moody’s recent downgrading of South African local-currency sovereign credit rating, and the
 country’s subsequent loss of membership in the World Government Bond Index, potentially adding
 additional pressure. This has resulted in a rising debt trajectory, with the pre-COVID-19 2020 National
 Budget projecting government debt to increase from 56.7 per cent of GDP in 2018 to 69.1 per cent of
 GDP in 2021, with the cost of borrowing relatively high. The 2020 National Budget provided minimal
 impetus for advancing inclusive growth and structural transformation, with expenditure growing at a
 negative rate in real terms. This is visible in Table 1, in which planned medium-term expenditure is

 20
 This reverses the trend of positive growth in GDP per capita between 1995 and 2007.
 21
 Statistics South Africa, 2020. GDP in the fourth quarter of 2019 decreased by 1.4%. Press Statement. Available at:
 http://www.statssa.gov.za/?p=13065
 22
 MIT Observatory for Economic Complexity. Available at: https://oec.world/en/profile/country/zaf/
 23
 Relative to countries with a similar GDP, South Africa’s export structure compares poorly. But compared with countries
 with a similar GDP per capita it compares well, although it remains less complex than a country such as Brazil.
 6
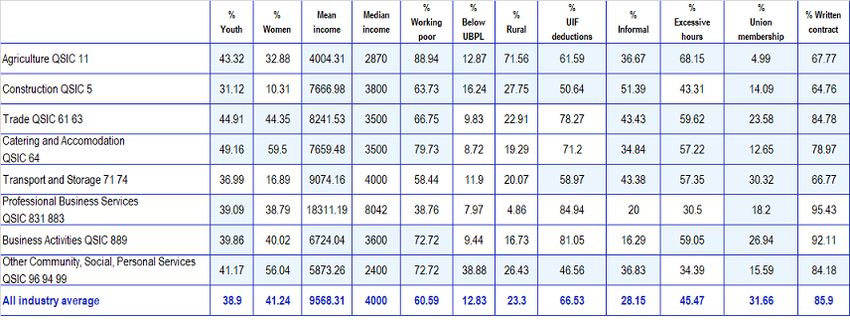
The impacts from a COVID-19 shock to South Africa’s economy and labour market.

 negative. Leaving aside borrowing, non-interest government expenditure is significantly lower.

 Table 1. Trends in government expenditure for COVID-19

 2019/20 2020/21 2021-22 2022/23 Real average
 R billion growth
 Revised estimate Medium-term estimates

 Revenue 1,517.0 1,583.9 1,682.8 1,791.3 -0.0031%

 % of GDP 29.4% 29.2% 29.2% 29.2%

 Expenditure 1,843.5 1,954.4 2,040.3 2,141.0 -0.0141%

 % of GDP 35.7% 36.0% 35.4% 34.9%

 Budget balance -326.6 -370.5 -357.5 -349.7 -0.0641%

 % of GDP -6.3% -6.8% -6.2% -5.7%

 Real GDP growth 0.3% 0.9% 1.3% 1.6%
 Note: Expenditure is expressed in Rands in nominal terms. Real average growth in real terms (adjusted for inflation projections)
 Source: FFC Briefing to the Standing Committee on Appropriations 26/05/2020, slideshow.

 The expected COVID-19-induced economic contraction means rising debt and deficit levels. The IMF
 projects that the fiscal deficit will widen from –4.2 per cent of GDP in 2018 to –13.3 per cent in 2020.
 Similarly, government debt is projected to increase from 56.7 per cent of GDP in 2018 to 85.6 per cent
 of GDP in 2021.

 Any shock to South Africa’s economy will be transmitted to a highly precarious, unequal, and
 segmented domestic labour market. South Africa’s labour market is characterized by very high pre-
 existing levels of unemployment: the “narrow” definition of the unemployment rate was 29.1 per cent
 at the end of Q4 2019, while the “broad” definition, including discouraged job seekers and the informal
 sector, neared 37 per cent. 24 There is a high skills wage premium, 25 a large number of seasonal workers
 in agriculture, and notable levels of informality. Informal sector workers are concentrated in the retail
 and wholesale trade sub-sector, with community and social services, construction, transport, finance,
 and manufacturing also featuring prominently. 26 Women are overrepresented in the informal sector,
 earn less than men for most informal (and formal) jobs, and have higher poverty risk across the
 spectrum of informal employment types. 27 As such, jobs at risk in the informal sector are most likely to
 impact women disproportionately. Other important characteristics are growing public sector
 employment share, youth (15–24 years of age) unemployment of 58 per cent as of Q4 2019, 28 and
 increasing precariousness through flexible contracts and labour-brokered employment. 29 Wage
 earnings of employees are low, with only 39.5 per cent earning above the working poverty line of R5,086
 per month in 2018, while 13 per cent of employees earn below the upper bound poverty line of R1,183
 per month.

 The Appendix contains further details on key labour market trends for South Africa, which we plot
 using the PALMS dataset (QLFS linked dataset). A few key findings stand out:
 • GDP growth generates employment growth: there is no “jobless growth” in the South African
 economy.
 • The labour force has grown more quickly than total employment growth since 2017, leading to
 a growing unemployment rate (all our unemployment rates are “broad”).

 24
 Statistics South Africa, 2020. Quarterly Labour Force Survey, Quarter 1: 2020.
 25
 Bhorat, Goga, Stanwix, 2014. Skills-biased labour demand and the pursuit of inclusive growth in South Africa. UN-WIDER
 Working Paper 2014/130
 26
 Statistics South Africa, 2019. Quarterly Labour Force Survey, Quarter 4: 2019.
 27
 Michael Rogan and Laura Alfers, 2019. Gendered inequalities in the South African informal economy. Agenda: Empowering
 women for gender equity. Volume 33 (4).
 28
 This is the narrow unemployment rate for those aged 15–24. The Quarterly Labour Force Survey data for Q4 2019 do
 not allow for the calculation of the broad rate.
 29
 Haroon Bhorat et al., June 2016. Demographic, employment, and wage trends in South Africa. Online:
 https://www.brookings.edu/wp-content/uploads/2016/07/06-demographic-employment-wage-trends-south-
 africa.pdf
 7
The impacts from a COVID-19 shock to South Africa’s economy and labour market.

 • The broad unemployment rate in Q4 2019 was 36.8 per cent, approaching the high in Q1 2003
 of 37.2 per cent (though the data are not directly comparable).
 • Weak job growth for young people compared with older workers has been a strong feature of
 the South African labour market since the 2008 global financial crisis.
 • The composition of South Africa’s employment has changed as its output structure has
 changed: the primary sector has shrunk in relative terms, largely resulting in a relative increase
 in tertiary sector output (constant 2010 prices). Manufacturing output has declined somewhat,
 too. Relative employment shifts largely mirror these trends. Movements in relative wage
 shares between the three sectors are much more modest, however, with a large clear absolute
 loss in wage income away from manufacturing and towards services.

 The distribution of employment in our model is detailed in Table 2. Mining and hard commodities are
 no longer major sectors of employment for the South African economy, even though they continue to
 generate a large share of foreign exchange earnings. Instead, employment in South Africa now largely
 resides in tertiary subsectors: wholesale and retail trade; other community, social, and personal
 services; business activities; transport and storage; catering and accommodation; health and social
 work (private); and finance and insurance. The other major employer is government: national and
 provincial government, and local government. Finally, agriculture remains a major sector of
 employment.

 Table 2. Largest sectors of employment in the South African economy, in accordance with our
 model

 Final Output per
 Sector Employment
 output worker

 Wholesale and retail trade [QSIC 61-63] 3,208,227 565,359 0.18

 Other community, social and personal services
 2,051,155 153,454 0.07
 [QSIC 94-96, 99]

 National and provincial government [QSIC 911] 1,645,024 839,245 0.51

 Business activities n.e.c. [QSIC 889] 1,447,513 88,551 0.06

 Professional business services [QSIC 831-883] 993,524 334,761 0.34

 Agriculture [QSIC 11] 972,838 136,074 0.14

 Construction [QSIC 5] 935,352 421,698 0.45

 Transport and storage [QSIC 71-74] 637,281 374,492 0.59

 Catering and accommodation services [QSIC 64] 555,467 68,213 0.12

 Health and social work (Private) [QSIC 93] 469,309 156,966 0.33

 Finance and insurance [QSIC 81-82] 410,315 275,940 0.67

 Local government [QSIC 913] 338,005 274,988 0.81
 Note: Final output in millions of Rands; Output per worker: Final output per person employed
 Source: Model based on Quantec data. See appendix for further details.

 8
The impacts from a COVID-19 shock to South Africa’s economy and labour market. 3. Estimating the impact of COVID-19 on South African economy and labour market. 3.1 Exiting estimates Estimating the economic impact of COVID-19, and the measures taken to stem its spread, is not easy, given the novel and fast-changing environment. Current forecasts for South Africa’s 2020 GDP are constantly changing (usually downwards). Recent forecasts, shown in Figure 2, are for a contraction of between 7 and 8.2 per cent of GDP. This equates to a roughly similar percentage contraction of final demand (assuming that final export demand and final import demand contract by a similar amount). In South Africa’s case the expected contraction of GDP will, according to the SARB, be worse than during the Great Depression in 1930. 30 Figure 1. Association between share of temporary employment and growth of registered unemployment by economic activity -6.4% IMF SA Treasury and World Bank OECD* OECD** Reserve Bank -6.6% -6.8% -7.0% -7.0% -7.1% -7.2% -7.4% -7.5% -7.6% -7.8% -8.0% -8.0% -8.2% -8.2% -8.4% Source: June 2020 Forecasts. OECD* is for a single-hit scenario, and OECD** is for a double-hit scenario (where the virus returns for a second wave of high infections in 2020). Global forecasts for South Africa’s GDP and employment losses tend to be higher than South African government forecasts. IMF June 2020 forecasts for GDP contractions for advanced economies and sub-Saharan Africa indicate that employment losses will be the worst since the 1929 Great Depression, and since at least 1970 for many Sub-Saharan African economies, especially those reliant on tourism. According to current OECD forecasts, France, Italy, and the United Kingdom will all experience GDP contractions in excess of 10 per cent and approaching 15 per cent. The second wave of July infections hitting the United States, several months before winter season begins, means that global demand will already be far weaker than many forecasts. The OECD’s June 2020 forecast is for unemployment rates to nearly double for OECD economies as a whole. 31 In a “single-hit” scenario, the OECD forecasts that South Africa’s unemployment rate will increase from 29.7 per cent in Q4 2019 to 34.5 per cent by 2020 Q4, leading to over a million job losses in 2020 alone. (For the OECD this is driven by a contraction in fixed capital investment spending, while in our model all components play a role in the contraction, but especially a loss of consumer spending.) 30 Lesetja Kganyago. Lecture. “The coronavirus shock, and ‘the age of magic money’”. Wits School of Governance Johannesburg 18 June 2020. The South African Reserve Bank. Available at: https://www.resbank.co.za/Lists/Speeches/Attachments/563/The%20SARB%20the%20coronavirus%20shock%20and% 20the%20age%20of%20magic%20money.pdf 31 OECD, 2020. Economic Outlook, June 2020. Available at: http://www.oecd.org/economic-outlook/june-2020/ 9
The impacts from a COVID-19 shock to South Africa’s economy and labour market.

 In contrast to projections by global multilaterals, forecasts by South African state institutions
 tend to project much lower job losses. Key estimates are that job losses will be about as severe as
 during the 2008 global financial crisis, even though the annualized contraction of South Africa’s GDP
 from COVID-19 is expected to be at least five times larger in 2020 alone. The National Treasury has
 forecast job losses of between 690,000 and 1.79 million for 2020, a downward revision from its original
 3 to 7 million job-loss projections because it is now using a full-time equivalent measure and adjusting
 for furloughs and other measures to mitigate the impact on jobs. 32

 The generally accepted relationship between GDP growth and unemployment growth helps in the
 assessment of existing forecasts of employment loss in South Africa. In existing forecasts, employment
 projections are out of sync with corresponding GDP forecasts, even though we observe, over time, a
 clear relationship between GDP and employment in the case of South Africa (see Appendix) and for
 other economies during COVID-19. In advanced economies, COVID-19-related trends and forecasts
 show that this relationship is clearly present, with observed movement in changes in GDP and
 employment several orders of magnitude larger than during the global financial crisis. The United
 States Congressional Budget Office forecasts that it will take until 2029 for the United States to reach
 its previously projected level of GDP for 2021. In sync with this, by April 2020 the United States had lost
 all gains to employment since 2000, with a 13.8 per cent contraction in reported total employment from
 December 2019 to April 2020 alone. 33 Available evidence from the United States and the European
 Union indicates that the employment impact of COVID-19 is likely to be larger than other shocks
 because of the particular impact on employment-intensive sectors (such as retail, hospitality, and close-
 quarters production and consumption processes). This is because they are at the highest risk of
 spreading the virus.

 “Real time” data of the kind available for the United States are not available for South Africa. But in the
 aftermath of the global financial crisis, South Africa’s real GDP contracted by –0.7 per cent during Q4
 2008 and by –1.8 per cent during 2009. 34 This contraction lasted only three quarters (Q4 2008–Q2 2009),
 partly because of a recovery in commodity prices and relatively strong export demand. 35 Despite some
 bounce-back in GDP during this period (a V-shaped recovery relatively speaking), around 1.1 million jobs
 were lost (see Appendix). Given that forecast annualized GDP contractions for South Africa in 2020 are
 expected to be several orders of magnitude worse (with the IMF forecasting, as of June 2020, an 8 per
 cent contraction for South Africa) the immediate employment shock should expected to be much worse,
 too.

 3.2 Our 2019 input-output model
 The basics

 The estimates provided in this rapid assessment are based on a model built using Quantec’s 2019 input-
 output tables of the South African economy, 36 which we supplement with additional 2018 QLFS
 household survey data (see Appendix for a lengthier discussion). These supplemental matrices allows
 us to model how employment impacts vary by worker type. The input-output model allows us to
 estimate employment and wage impacts for the South African economy by sector arising from an
 exogenous COVID-19 “shock”. This in turn tells us how total output changes as final demand contracts.
 Based on changes in total output we can assess how employment changes, using calculated
 employment coefficients for each sector.

 32
 Lameez Omarjee, 2020. Treasury now estimates nearly 1.8 million job losses. News24. Available at:
 https://www.fin24.com/Economy/treasury-now-estimates-nearly-18-million-job-losses-20200601-2
 33
 The exact impact on employment is more ambiguous than this suggests. Changing labour force participation rates, as
 job search patterns change and the inability to search increases, play an important role not captured in these
 statistics. A large share of workers who have lost their jobs will very likely not be actively looking for work and so will
 not be counted in the official unemployment rate. The unemployment rate would be higher if all the people who lost
 their jobs had actually remained in the labour force. Furthermore, the Bureau of Labor Statistics has warned that
 many workers they would otherwise have counted as unemployed will be reported as “employed but not at work”. If
 we count these workers as unemployed, along with those who have left the labour force, the unemployment rate
 would have been 23.5 per cent in April 2020. The composition of hourly wages is also changing. Aggregate weekly
 work hours – which captures both the job losses plus the drop in hours worked – fell off a cliff in April 2020, dropping
 14.9 per cent in just one month.
 34
 South African Reserve Bank, 2010. Quarterly Bulletin: March 2010: No. 255. Available at:
 https://www.resbank.co.za/Lists/News%20and%20Publications/Attachments/3638/Full%20Quarterly%20Bulletin.pdf
 35
 South African Reserve Bank, 2009. Quarterly Bulletin: December 2009 No. 254. Available at:
 https://www.resbank.co.za/Lists/News%20and%20Publications/Attachments/4041/Full%20Quarterly%20Bulletin.pdf
 36
 A number of potential inconsistencies surround these tables, but they are the best available resource.
 10
The impacts from a COVID-19 shock to South Africa’s economy and labour market.

 We assume that under a COVID-19 shock certain components of final demand will contract by more
 than others, and in particular consumption spending contracts the most, both absolutely and in relative
 terms. Three scenarios are modelled based on different expected contractions in expenditure on goods
 and services in South Africa:
 • Scenario 1: final demand contracts by 5 per cent.
 • Scenario 2: final demand contracts by 10 per cent.
 • Scenario 3: final demand contracts by 15 per cent.

 This is approximately equal to the equivalent percentage contraction in GDP in each scenario. 37 They
 draw from the expected economic contractions outlined above and represent low, middle, and high
 possibilities.

 In line with these final demand projections, we focus on Scenario 2 in our discussion, which assumes an
 exogenous annual contraction of 10 per cent in final demand in 2020. Final demand consists of
 consumption spending, government spending, fixed capital investment spending, and gross exports f
 = C + I + G + X. 38 (Further details on the model and nature of the shock are given in the Appendix.) A
 roughly 10 per cent contraction of final demand is now seen as a likely scenario for the South African
 economy in 2020.

 Designing the shock: model assumptions

 Final demand will not fall evenly across all sectors from a COVID-19 shock. Unfortunately, the
 distribution of the contraction across sectors based on previous crises provides only limited guidance.
 COVID-19 is unique because it has been accompanied by a deliberate and often targeted closure of the
 economy by sector. Because of this, some researchers have made choices about the distribution of the
 economic shock based on the past or present lockdown regulations and how these impact particular
 sectors. However, these regulations are constantly changing and so the choices of which sectors are to
 contract, and exactly by how much, become somewhat arbitrary.

 Our modelling assumes that under COVID-19, at least for 2020, consumption spending contracts
 by more than the other components of final demand (Table 3). 39 This assumption is premised on a
 review of available contraction estimates elsewhere in the world. This is part of our rules-based
 approach to determining which subsectors are impacted the most by COVID-19 and by how much. This
 approach also ensures that the initial shock to all sectors adds up to the assumed overall contraction. 40
 It means that those subsectors that are more reliant on consumption spending for final demand are
 more adversely impacted. As it happens, these are often the sectors with greater human-to-human
 contact and so more at risk of contraction. This is because consumption spending tends to drive
 employment in low productivity, consumer-facing, service sub-sectors. It is also important to note that
 the shock results in changes to the number of people employed, rather than changes to workers’ wages,
 working hours, or via furloughs. This is acknowledged as a limitation. The scenarios all assume that the
 government enacts fairly expansionary fiscal policy; because of data-source limitations this leads to an
 expansion of government employment, rather than a distribution of benefits across the economy. 41

 There is no precise way to know the time period over which our model’s employment and wage losses
 are likely to occur. Based on historical trends, large shocks to an economy tend to take several years to
 fully work their way through. This should encourage policymakers to exercise caution when tempted to

 37
 GDP is, by definition, a domestic concept and it adjusts for the fact that some final demand expenditure will go towards
 imports. But if final imports contract by a similar amount to final exports then the relative percentage fall in final
 demand can be assumed to be roughly equal to the percentage fall in GDP (even if the absolute magnitudes differs).
 We cannot model a contraction in GDP precisely as we do not have a matrix of final import demand components by
 sector.
 38
 We undertake an empirical adjustment by removing a balancing item and inventory adjustments. This amounts to less
 than 0.01 per cent of total final demand. It allows us to specific our shock more precisely.
 39
 Consumption contracts by 55 per cent, investment by 20 per cent, exports by 35 per cent, and government spending
 increases by 10 per cent. See Appendix for further details.
 40
 Amounting to a contraction of GDP of around 8–13 per cent.
 41
 Note that because government is not well “connected” to (or integrated in) the rest of the economy in the Quantec
 tables, expansionary government fiscal policy leads to government employment increasing by 91,288 jobs, although
 in practice these jobs will be more widespread throughout the economy. If government linkages were better
 articulated in the Quantec input-output data then the number of jobs saved and expanded through government
 fiscal policy would also be greater. Similarly, a contraction of gross fixed capital formation (GFCF) or “I” (investment
 spending) for the short term has fewer total knock-on effects with regard to output because investment spending as
 a source of demand for output in the South African economy is not strong. This reflects data limitations and also the
 importation of capital goods from abroad.
 11
The impacts from a COVID-19 shock to South Africa’s economy and labour market.

 look only at present conditions as a barometer of the health of the economy. The collapse in fixed capital
 investment spending by firms which has followed the contraction in consumption spending during the
 COVID-19 lockdown will also lead to a drop in the long-term employment generating capacity of every
 economy, including South Africa’s. Unless more factories are built and new technologies are introduced
 into production through investment spending, employment and wage growth will be severely
 constrained. This model does not address these longer-term dynamic impacts on employment from
 COVID-19 and instead focuses on the short-term, more immediate, impacts on the economy from a
 reduction in final expenditure. It also does not look at the induced impact on employment from how
 changes in output lead to the second-round effects of changes in consumption and in turn employment
 (a so-called “endogenous” household sector model).

 3.3. Our findings
 The assumed contraction in final demand leads to an estimated fall in employment, wages, output and
 value added from our model (summarized in Table 3). Except for the second estimate of employment
 losses – where this is explicitly stated – the other estimates include all workers.

 Table 3. Model assumptions and key impacts, 2019 South African economy (Rand million)

 S1 S2 S3

 The shock

 Final demand** -5% -10% -15%

 Consumption* –6.5% –13.0% –19.4%

 GFCF* –6.6% –13.2% –19.8%

 Government* 2.7% 5.3% 8.0%

 Exports* –5.7% –11.4% –17.0%

 The impact

 Gross output (%) –5.3% –10.6% –15.9%

 Gross output –516,479 –1,032,958 –1,549,437

 Value-added (%) –4.8% –9.7% –14.5%

 Value-added –218,539 –437,078 –655,617

 Employment (%) –5.4% –10.8% –16.2%

 Employment –887,016 –1,774,032 –2,661,048

 Employment (%) excl. skilled losses –4.5% –9.1% –13.6%

 Employment excl. skilled losses –742,538 –1,485,075 –2,227,613

 Wages (%) –3.8% –7.7% –11.5%
 Wages (R millions) –92,731 –185,462 –278,193
 Note: Starred items (*) are assumed by the researcher (that is, not a model result), while non-starred items are results of the
 model. All starred items (*) are components of final demand (**).
 Source: Input-output model results based on 2019 Quantec and QLFS data.

 The results of Table 3 are discussed below.

 Aggregate job loses

 For a contraction of 10 per cent of final demand, approximately 1.77 million jobs are at risk over
 the next 24 months or so, amounting to 10.8 per cent of total employment.

 The number of jobs immediately at risk is slightly lower: 1.485 million are at risk, or 9.1 per cent
 of total employment. This figure assumes that workers in skilled jobs (“skilled workers”), under strong
 union contracts, characterized by structural power in the economy, and a higher likelihood of working
 from home, are much less likely to be at risk during 2020 and so are removed from the original total of

 12
The impacts from a COVID-19 shock to South Africa’s economy and labour market.

 1.77 million jobs or 10.8 per cent of all jobs. A portion of this (reduced) total of at-risk jobs in 2020 may
 be subject to adjustments in wages or hours, or job furlough schemes, instead of retrenchments. This
 would further reduce the total, although it is difficult to say, at present, by what magnitude.

 These estimates are consistent with the data we have available in South Africa. A StatsSA survey
 conducted in early May 2020 42 reported that 8.1 per cent of respondents had already lost their jobs or
 had to close their businesses. The estimates are also consistent with actual job loss numbers released
 by advanced economies. For example, in the United States, 13.8 per cent of all jobs were lost between
 December 2019 to April 2020 alone (arguably labour market flexibility is much higher in the United
 States, especially in state employment). These estimates are larger than jobs lost as a result of the last
 crisis, the global financial crisis, in which around a million jobs were lost and job growth was driven
 almost exclusively by growth in the public sector in the years after 2008. 43 As noted, the contraction of
 GDP is likely to be five times larger in the COVID-19 crisis (–1.8 vs 8–10 per cent), although the nature of
 the shocks are different. Our estimates are approximately 1.8 times larger than after the global financial
 crisis because the model does not account for the second-round impact of reduced output, lowering
 final demand components even further (than the initial shock), and in turn spending and employment.

 Impact on wages

 Although the proportion of jobs lost is high, assuming a 10 per cent reduction in final demand,
 “only” 7.7 per cent of total wage income in the economy is lost, amounting to –R185 billion or
 around 3.6 per cent of 2019 GDP. This may appear lower than expected, for two main reasons: value
 added declines by –9.7 per cent (from which new incomes are generated) and 44 per cent of incomes
 go to profits in our model (“gross operating surplus”), followed by 2.2 per cent to government through
 net indirect taxes on production and products. The concentration of job losses among low-income
 workers likely accentuates this.

 Fall in output and value added

 Assuming a –10 per cent “shock” to final demand, “gross” (total) output, inclusive of intermediate
 production, contracts by –10.6 per cent. This highlights the multiplied impact on production of an initial
 shock to the economy, as a contraction of demand triggers a ripple effect, impacting sectors that supply
 inputs to other sectors, leading to a reversal in the circular flow of income through the production
 sectors of the economy.

 At –9.7 per cent, value added (the sum of wages and profits, and government net indirect taxes on
 production) contracts by less than total output, such that total incomes in the economy shrink by around
 7.7 per cent. This is less than the initial –10 per cent contraction of final demand spending, partly
 because some of the burden of lost incomes will be borne by overseas workers whose intermediate
 imports South Africa demands. Around 6 per cent of gross (total) output in the South African economy
 comes from intermediate imports.

 Impact by sector

 Certain types of service sector jobs have been hit particularly hard by the COVID-19 shock, along
 with agricultural jobs. The service sector, along with agriculture, has experienced major contractions
 because they are most driven by consumption spending. They are also sectors with close human-to-
 human contact and so susceptible to closure with the spread of the virus. Under a 10 per cent shock to
 final demand, the eight hardest hit sub-sectors are wholesale and retail trade (–409,405 jobs), followed
 by other community, social, and personal services (–289,364), business activities (–187,072); agriculture
 (–131,661); construction (–120,808); professional business services (–124,471); transport and storage (–
 83,075); and catering and accommodation (–75,551). These sectors account for 80 per cent of all jobs at
 risk. These sectors are the major employers in the economy and might be expected to bear the brunt
 of the job losses. This also reflects the fact that consumption spending is a major source of demand for
 these sectors (rather than investment spending or exports), and it is consumption spending that
 contracts the most in our model.

 Note that business activities is a fairly heterogeneous subsector, consisting of packaging activities, debt
 collection, security, employment and recruitment activities, photographic work, cleaning activities for
 buildings and industrial plants, and quite prominently outsourcing activities via labour brokers.

 42
 Stats SA. 2020. Results from Wave 2 survey on the impact of the COVID-19 pandemic on employment and income in South
 Africa. Available at: http://www.statssa.gov.za/publications/Report-00-80-03/Report-00-80-03May2020.pdf
 43
 South African Reserve Bank, 2010. Quarterly Bulletin: December 2010 No. 258. Available at:
 https://www.resbank.co.za/Lists/News%20and%20Publications/Attachments/3641/Full%20Quarterly%20Bulletin.pdf
 13
You can also read