Bioeconomy in Catalonia - Sector Report - Catalonia Trade & Investment
←
→
Page content transcription
If your browser does not render page correctly, please read the page content below

Bioeconomy in
                          Catalonia
                          June 2018

                                                 Sector Report

                                      Strategy and Competitive Intelligence Unit
In collaboration w ith:
Bioeconomy in Catalonia

Catalonia Trade & Investment
Government of Catalonia

The contents of this document are subject to a Creative Commons licence. Unless otherw ise stated, it may be reproduced,
distributed and divulged in public provided that the author is cited, no commercial use is made of it and no w orks deriving f rom
it are distributed. You may see a summary of the terms and conditions at: https://creativecommons.org/licenses/by-nc-nd/4.0/

Prepared by
IDOM

Coordinated and supervised by
Strategy & Competitive Intelligence Unit

Barcelona, June 2018

*This study is part of the European project S3Chem (PGI00010) and is co-funded by
 the Interreg Europe programme

                                                                                                                                 Strategy and Competitive Intelligence Unit
                                         In collaboration w ith:
Bioeconomy in Catalonia | Sector report                                                                                        3

             Index
        1.     Project goals                                                                                        04

        2.     Main concepts, actions & strategies                                                                  06

        3.     Worldwide data                                                                                       19

        4.     Trends                                                                                               34

        5.     The Catalan chemical sector                                                                          50

        6.     Opportunities for the Catalan chemical industry related to bioeconomy                                56

        7.     Success stories                                                                                      63

        8.     Conclusions & policy recomendations                                                                  80

        9.     Annex I. Interviews & visits                                                                         83

                                                                                       Strategy and Competitive Intelligence Unit
                                          In collaboration w ith:
Bioeconomy in Catalonia | Sector report                                                                     4

1. Project goals

                                                                    Strategy and Competitive Intelligence Unit
                                          In collaboration w ith:
Bioeconomy in Catalonia | Sector report                                                                                    5

Project goals
The aim of the project is to define the bioeconomy sector in Catalonia and its relationship with the circular
economy and the chemical industry. It also aims to analyse the tendencies and future challenges of these two
paradigms, as well as their deployment in Catalonia.

 More specifically, the project focuses on:
         Description, definition, scope and characterization of the
         Bioeconomy and the Circular Economy and the role of
         industrial chemistry in Catalonia.
         Definition of the concept of Bioeconomy in Catalonia,
         and identification of its main demand sectors.
         Identification of business and innovation opportunities,
         as well as strategic challenges that bioeconomy can
         generate for Catalan companies.
         Links between the concepts of Bioeconomy and the
         Circular Economy.

                                                                                   Strategy and Competitive Intelligence Unit
                                          In collaboration w ith:
Bioeconomy in Catalonia | Sector report                                                                     6

2. Main concepts, actions &
strategies

                                                                    Strategy and Competitive Intelligence Unit
                                          In collaboration w ith:
Bioeconomy in Catalonia | Sector report                                                                      7

Main concepts
Circular Economy & Bioeconomy

A circular economy is a regenerative system in which
resource input and waste, emission, and energy
leakage are minimized by slowing, closing, and
narrowing material and energy loops. This can be
achieved through long-lasting design, maintenance,
repair, reuse, remanufacturing, refurbishing, and
recycling.

As part of its continuous effort to make Europe's
economy more sustainable and to implement the
ambitious Circular Economy Action Plan, in January
2018 the European Commission adopted a new set of
measures.     The     potential   socio-economic  and
environmental benefits are impressive. However, these
benefits will be truly felt if the bioeconomy – the
renewable part of the circular economy concept – is
made to play its important and growing role.

                                                                                   Source: Refinity, 2017.

                                                                    Strategy and Competitive Intelligence Unit
                                          In collaboration w ith: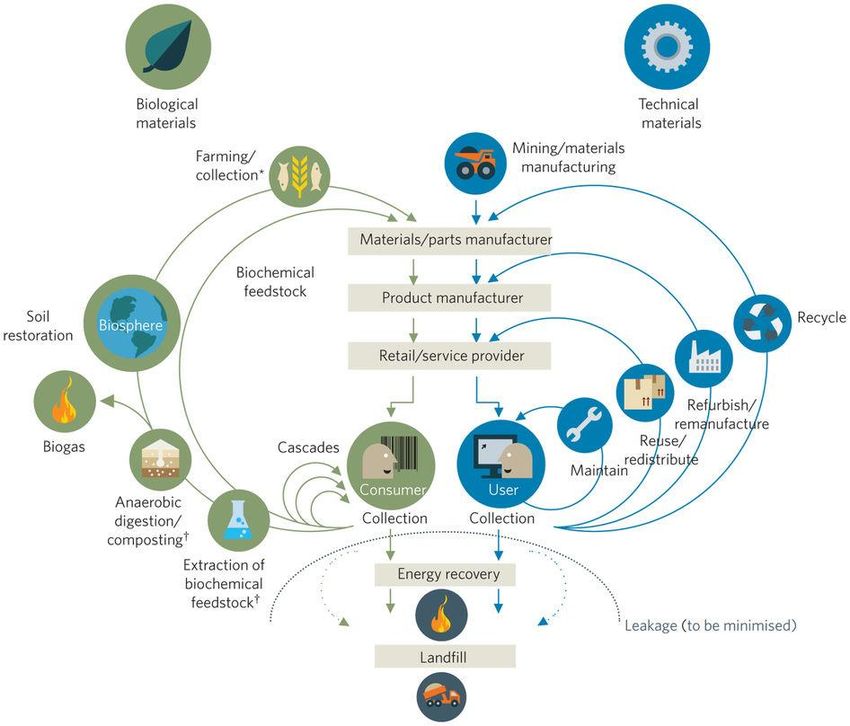
Bioeconomy in Catalonia | Sector report                                                                                                         8

Circular economy: characteristics
The following fundamental characteristics describe a pure circular economy :
    Design out waste: Products are designed to fit within a biological or technical materials cycle in order not to produce waste.
    The biological materials are non-toxic and can be simply composted. Technical materials -polymers, alloys and other man-
    made compounds- are designed to be reused with minimal energy expenditure and highest quality retention.

    Build resilience through diversity: Nowadays systems are required to be efficient but other features such as modularity,
    versatility, and adaptiveness also need to be prioritized in a fast-evolving world. Diverse systems with many connections and
    scales are more resilient to external shocks than systems built simply for efficiency -throughput maximization driven to extreme
    results in fragility.

    Work towards energy from renewable sources: Systems should ultimately aim to run on renewable energy -enabled by
    the reduced energy threshold levels required by a restorative, circular economy.

    Think in systems: The ability to understand how parts within a whole influence one another, and the relationship of the whole
    to the parts, is crucial. Elements are considered in relation to their environmental and social contexts. While a machine is also a
    system, it is clearly narrowly bounded and assumed to be deterministic. Systems thinking usually refers to the overwhelming
    majority of real-world systems: these are non-linear, feedback-rich, and interdependent.

    Think in cascades: For biological materials, the essence of value creation lies in the opportunity to extract additional value
    from products and materials by cascading them through other applications. In biological decomposition, material is broken
    down in stages by microorganisms like bacteria and fungi that extract energy and nutrients from the carbohydrates, fats, and
    proteins found in the material.

                                                                                          Source: According to The Ellen MacArthur Foundation

                                                                                                      Strategy and Competitive Intelligence Unit
                                          In collaboration w ith: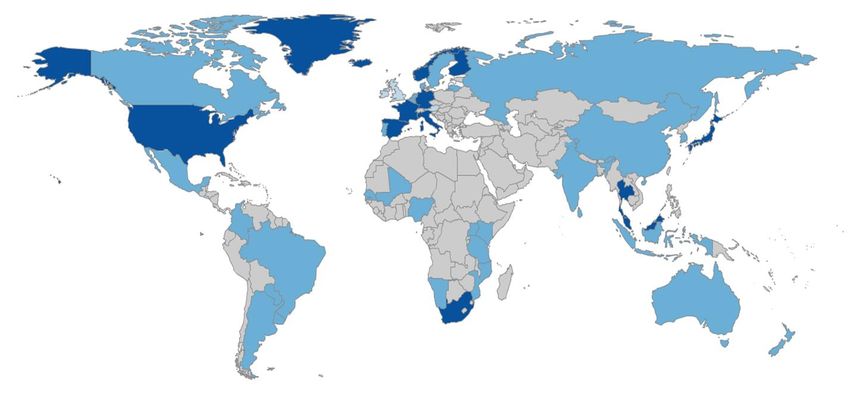
Bioeconomy in Catalonia | Sector report                                                                                                9

Circular economy: principles
According to The Ellen MacArthur Foundation, the circular                 Principle 1: Preserve and enhance natural capital
economy provides multiple value creation mechanisms that
are decoupled from the consumption of finite resources. In a              Principle 2: Optimize resource yields
true circular economy, consumption only takes place in                    Principle 3: Foster system effectiveness
effective      bio-cycles;     elsewhere     use      replaces
consumption. Resources are regenerated in the bio-cycle or
recovered and restored in the technical cycle. In the bio-cycle,    Principle 1: Preserve and enhance natural
life processes regenerate disordered materials, despite or
                                                                    capital
without human intervention. The set of business activities that
entail the bio-cycle are the ones considered in the concept of      Preserve and enhance natural capital by controlling
Bioeconomy. In the technical cycle, with sufficient energy          finite stocks and balancing renewable resource flows.
available, human intervention recovers materials and recreates
order. Maintaining or increasing capital has different              This starts by dematerializing utility -delivering utility virtually,
characteristics in the two cycles.                                  whenever possible. When resources are needed, the circular
                                                                    system selects them wisely and chooses technologies and
The circular economy rests on three principles, each                processes that use renewable or better-performing resources,
addressing several of the resource and system challenges that       where possible. A circular economy also enhances natural
industrial economies face:                                          capital by encouraging flows of nutrients within the system and
                                                                    creating the conditions for regeneration of, for example, soil.

                                                                                               Strategy and Competitive Intelligence Unit
                                          In collaboration w ith: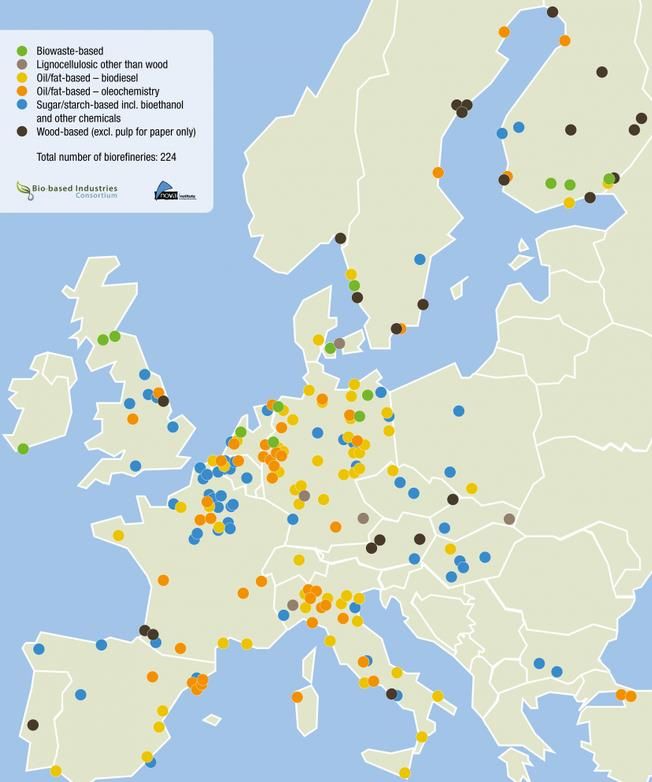
Bioeconomy in Catalonia | Sector report                                                                                                                           10

Principle 2: Optimize resource yields

Optimize resource yields by circulating products,
components, and materials at the highest utility at
all times in both technical and biological cycles.

This means designing for remanufacturing,
refurbishing, and recycling to keep components and
materials circulating in and contributing to the
economy.

Principle 3: Foster system effectiveness
Foster system effectiveness by discovering and
designing out negative externalities.

This includes reducing damage to human utility, such
as food, mobility, shelter, education, health, and
entertainment, and managing externalities, such as
land use, air, water and noise pollution, release of toxic
substances, and climate change.

                                                                        Source: Ellen MacArthur Foundation; McKinsey Center for Business and Environment; Stiftungsfonds für
                                                                        Umw eltökonomie und Nachhaltigkeit (SUN); Draw ing from Braungart & McDonough, Cradle to Cradle (C2C)

                                                                                                                               Strategy and Competitive Intelligence Unit
                                              In collaboration w ith:
Bioeconomy in Catalonia | Sector report 11
Circular economy: business actions
The Ellen MacArthur Foundation has broadly identified a set of six actions that businesses and governments
can take in order to foster the transition towards a circular economy: Regenerate, Share, Optimise, Loop,
Virtualize, and Exchange – together, the ReSOLVE framework. The ReSOLVE framework offers businesses and
governments a tool for generating circular strategies and growth initiatives.
Shift to renewable energy and Remanufacture products or
materials. components.
Reclaim, retain, and restore health of Recycle materials.
REGENERATE ecosystems. LOOP Digest anaerobically.
Return recovered biological resources Extract biochemicals from organic
to the biosphere. waste.
Share assets (e.g., cars, rooms, Dematerialize directly (e.g., books,
appliances) CDs, DVDs, travel)
SHARE Reuse/second hand VIRTUALISE Dematerialize indirectly (e.g., online
Prolong life through maintenance, shopping)
design for durability, upgradability, etc.
Increase product Replace old with advanced non-
performance/efficiency. renewable materials.
OPTIMISE Remove waste in production and
EXCHANGE Apply new technologies (e.g., 3D
supply chain. printing).
Leverage big data, automation, remote Choose new products/services (e.g.,
sensing and steering. multimodal transport).
Source: Grow th Within: a circular economy vision for a competitive Europe”, Ellen MacArthur Foundation, SUN, McKinsey & Co. ( June 2015)
Strategy and Competitive Intelligence Unit
In collaboration w ith:Bioeconomy in Catalonia | Sector report 12
Bioeconomy
‘The bioeconomy […] encompasses
the production of renewable
biological resources and the
conversion of these resources and
waste streams into value-added
products, such as food, feed, bio-
based products and bioenergy’.
The bioeconomy is the
biological motor of the circular
economy as it brings the
renewability aspect into the cycle,
puts carbon ‘back in the loop’, and
brings additional dimensions to the
circular economy discussion,
moving beyond waste.
Source: Communication from the Commission to the European Parliament, the Council, the European Economic
and Social Committee and the Committee of the Regions: A Bioeconomy for Europe, COM(2012) 60.
Strategy and Competitive Intelligence Unit
In collaboration w ith:Bioeconomy in Catalonia | Sector report 13
Bioeconomy: Europe’s strategy
The threat: The global food crises of 2008 and 2011 were striking reminders of the importance of
innovation in agriculture to address global challenges such as population growth as well as the
consequences of climate change such as droughts.
The opportunity: A transition to the use of renewable resources, including the sustainable use of biomass,
can contribute to reducing emissions and circumventing resource scarcity. A healthy bioeconomy is crucial
for a successful and sustainable transition.
The role of the chemical sector: The chemical industry is exploring ways to create products -traditionally
produced from fossil fuels- using biomass through novel value chains such as fermentation and
biocatalysis. However, biomass availability is limited, which leads to potential competition for biomass
between different biomass-consuming sectors.
The action plan: In order to support bioeconomy and bioeconomy-related policies, the European
Commission’s Bioeconomy Observatory collects and analyses data and information about bioeconomy.
Source: Innovating for sustainable grow th, a bioeconomy for Europe (2012), European Commission.
Strategy and Competitive Intelligence Unit
In collaboration w ith:Bioeconomy in Catalonia | Sector report 14
Bioeconomy: European public & private
initiatives
European Bioeconomy Strategy
The recently reviewed ‘Innovating for sustainable growth: a bioeconomy strategy for Europe’, launched
and adopted on 13 February 2012, addresses the production of renewable biological resources and
their conversion into vital products and bio-energy.
European Bioeconomy Alliance (EUBA)
The EUBA, a cross-sectoral alliance that aims to mainstream and release the potential of the
bioeconomy in Europe, highlighted that bio-based feedstocks and materials can be used to produce a
wide range of products. The EUBA emphasizes the importance of biorefineries, where biomass from a
range of sources such as crops, wood, forest and agricultural residues is converted into everyday
products and materials.
RoadToBio Project
The RoadToBio project focused on how globally competitive bio-based chemicals will help shape the
future of the Europe’s chemical industry and help to secure jobs in Europe’s rural and less developed
regions.
Bio-Based Industries Consortium
The Bio-Based Industries Joint Undertaking is a €3.7 billion Public-Private Partnership between
the EU and the Bio-based Industries Consortium. Operating under Horizon 2020, it is driven by the
Vision and Strategic Innovation and Research Agenda (SIRA) developed by the industry.
Strategy and Competitive Intelligence Unit
In collaboration w ith:Bioeconomy in Catalonia | Sector report 15
Bioeconomy: agents related to RoadToBio
project
BIC – Bio-based Industries CEFS – European Association of CEPI – Confederation of
Consortium Sugar Producers European Paper Industries
EUFA – European Fisheries EuropaBio – The European EUBP – European Bioplastics
Alliance Association for Bioindustries
FTP – Forest-based Sector FEDIOL – The European Vegetable
PFP – Primary Food
Technology Platform Oil and Protein Meal Industry
Processors
COPA-COGECA – European Farmers ePURE – European Renewable Starch Europe – European Starch
and European Agri-Cooperatives Ethanol Producers Association Industry Association
Source:Roadmap for the Chemical Industry in Europe tow ards a
Bioeconomy, RoadToBio.
Strategy and Competitive Intelligence Unit
In collaboration w ith:Bioeconomy in Catalonia | Sector report 16
Bioeconomy: EU policy strategies
The European Bioeconomy Strategy is supported by others actions and policies such as: Food 2030, Blue Growth, Bio-
based products and processing policies, the Bioeconomy Knowledge Centre and the Bioeconomy Panel, an advisory body to give
policy guidance. The strategy actions are directed at sectors that supply Biomass (agriculture, forestry, fisheries, waste,
aquaculture and algae ) and sectors that use it (food security, bioenergy and bio-based industries).
Sectors supplying
biomass EU policy strategies Implications
‘The CAP towards 2020: meeting the food, natural resources and
territorial challenges of the future’ (EC 2010)
Agriculture ‘The agriculture, forestry, fisheries,
aquaculture and algae sectors are the
‘A new EU forest strategy: for forests and the forest-based sector’ main suppliers of biomass. The goals
(EC 2013). of these three sectors are very similar
‘Multiannual implementation plan of the new EU forest strategy’ and all include sustainable and inclusive
Forestry (EC 2015). growth, stimulating innovation, the
sustainable exploitation of resources,
‘Reform of the common fisheries policy’ (EC 2011) resource efficiency, rural development
‘Blue growth: opportunities for marine and maritime growth’ and climate change mitigation and
Fisheries, aquaculture (EC 2012). adaptation.
and algae ‘Strategic guidelines for the sustainable development of EU
aquaculture’ (EC 2013)
‘Towards a circular economy: a zero waste programme for A further, increasingly important
Europe’ (EC 2014) source of biomass is waste coming
‘Closing the loop – An EU action plan for the circular economy’ from the agricultural, forestry and
(EC 2015) fisheries sectors, but also from other
Waste
‘The role of waste-to-energy in the circular economy’ (EC 2017) sources such as households or
manufacturing.
Strategy and Competitive Intelligence Unit
In collaboration w ith:Bioeconomy in Catalonia | Sector report 17
Bioeconomy: EU policy strategies
Sectors using EU policy strategies Implications
biomass
‘An EU policy framework to assist developing countries in The bioeconomy strategy stresses the
addressing food security challenges’ (EC 2010). need to reconcile the competition of
‘The EU approach to resilience: learning from food different sectors (food, feed and
Food and feed security crises’ (EC 2012). industrial uses) for biomass.
‘Energy 2020 – A strategy for competitive, sustainable
and secure energy’ (EC 2010). Bioenergy is expected to play an
‘Energy roadmap 2050’ (EC 2011). important role in achieving GHG
‘A policy framework for climate and energy in the period emissions reduction goals. To do
from 2020 to 2030’ (EC 2014). so, investments in new renewable
technologies are needed, such as
‘Accelerating Europe’s transition to a low-carbon economy’
ocean energy, concentrated solar
(EC 2016).
‘The role of waste-to-energy in the circular economy’, power and second and third
Bioenergy generation biofuels.
(EC 2017).
‘A stronger European industry for growth and economic Priority should be given to granting
recovery’ (EC 2012). access to sustainable raw materials for
‘For a European industrial renaissance’ (EC 2014) the production of bio-based products.
Future strategy on plastics use, reuse and recycling (EC This will require the application of the
Bio-based industries cascade principle in the use of
2016).
(e.g Chemical Industry) biomass.
Strategy and Competitive Intelligence Unit
In collaboration w ith:Bioeconomy in Catalonia | Sector report 18
Bioeconomy: the link with the Chemical
Sector
The bioeconomy offers an opportunity for the che mical industry to diversify its raw
material base. The chemical industry’s contribution is also critical for the success of bioeconomy Bio-based
as many bioeconomy-enabling products and solutions are based on chemicals. industries
The European chemical industry is gradually increasing its production, integrating bio-based processes and the
conversion of renewable biological resources and associated waste streams. This marks a transition towards a
more sustainable chemical industry.
Chemistry enables Bioeconomy
Utilization of bio-based raw materials Medicines, cosmetics, packings, paints, adhesives,
chemicals, detergents, rubber products, ...
Processing of biofractions Tall oil products
Bioethanol, renewable diesel, biogas, ...
Fracturation of biomasses Separation resins
Chemicals and enzymes
Micro-organisms
Cultivation of biomasses Fertilizers and nutrients
Plant protecting agents
Recycling of bioproducts Bioreactors
Composting
Source:RoadToBio.
Strategy and Competitive Intelligence Unit
In collaboration w ith:Bioeconomy in Catalonia | Sector report 19
3. Worldwide data
Strategy and Competitive Intelligence Unit
In collaboration w ith:Bioeconomy in Catalonia | Sector report 20
Worldwide data: bioeconomy
Bioeconomy policies around the world
Dedicated bioeconomy strategy
Bioeconomy-related strategy
BE-related strategy: dedicated
BE-strategy is under development
Dedicated BE-strategy is under
development Source:German Bioeconomy Council (2017).
Strategy and Competitive Intelligence Unit
In collaboration w ith:Bioeconomy in Catalonia | Sector report 21
Worldwide data: bioeconomy
Bio-based raw materials use in the chemical industry
Bio-based chemical raw materials distribution in the EU
(As a percentage of total 7.8 million tonnes, 2016)
7%
Starch and sugar
6%
20% Vegetable oils
6%
Natural rubber
Bioethanol for ETBE
7%
Bioethanol
18% Animal fats
8% Chemical pulp
Glycerol
Others
13% 15%
Source: Cefic Chemdata International, 2017.
Strategy and Competitive Intelligence Unit
In collaboration w ith:Bioeconomy in Catalonia | Sector report 22
Worldwide data: bioeconomy
Bioeconomy employment in Europe
Employment in the bioeconomy sectors of the EU
(million persons employed, 2014)
Source: ‘JRC Science for Policy Report, Bioeconomy report’ Joint Research Centre, (2016).
Strategy and Competitive Intelligence Unit
In collaboration w ith:Bioeconomy in Catalonia | Sector report 23
Worldwide data: bioeconomy
Bioeconomy turnover in Europe
Development of sectorial turnovers in the EU bioeconomy
(in million EUR, 2008-2014)
Source: ‘JRC Science for Policy Report, Bioeconomy report’ Joint Research Centre, (2016).
Strategy and Competitive Intelligence Unit
In collaboration w ith:Bioeconomy in Catalonia | Sector report 24
Worldwide data: bioeconomy related demo-
cases (Waste) gas into value: Turning C1 gas Bio Aviation Fuel: Promoting larger
streams (from biogas production, biomass scale aviation biofuel production.
gasification or industrial emissions) into Värmland – Paper Province (Sweden)
chemicals or fuels. Ghent Bio-energy Valley
(Belgium)
Biobased Aromatics: Interregional value
chains and joint demonstration on biomass
valorization to aromatics. Flanders – VITO
(Belgium) Production of bulk and fine chemicals
and fuels from lignocellulose biomass:
Set-up of a European value chain from
lignocellulose to end products using
Food & Feed from Agrofood Waste: biotechnology (refinery) Biobased Delta
Extracting functional foods and feed from (Netherlands)
different waste streams, such as fish,
domesticated animals and cereals. Scottish
Enterprise (UK)
Lignocellulose Refinery - Biogas
Beyond Energy: Advancing the state of
the art of biogas production towards more
and higher value added outputs.
Food and Feed ingredients from Algae: Lombardy – Green Chemistry
Extraction of high value products from Association (Italy)
microalgae for the food & feed sector.
Asturias (Spain)
Source: Vanguard Initiative (2016).
Strategy and Competitive Intelligence Unit
In collaboration w ith:Bioeconomy in Catalonia | Sector report 25
Worldwide data:
chemical industry
Biorefineries in Europe
The che mical sector related to Bioeconomy
depends on the existence of Biorefineries.
Biorefineries are processing facilities that convert
biomass into food, food ingredients, feed, chemicals,
materials, fuels and energy using a wide variety of
conversion technologies in an integrated manner. A
common goal for biorefineries is to use all parts
of the biomass raw material as efficiently as
possible.
Therefore, the existence of Biorefineries is key for
ensuring a robust bio-based che mical industry in
the region.
Catalonia has a strong industrial oleochemistry
and bioethanol network.
Source: Bio Based Industries consortium (2017).
Strategy and Competitive Intelligence Unit
In collaboration w ith:Bioeconomy in Catalonia | Sector report 26
Worldwide data: chemical industry
Employment in the EU chemical industry
1,80
1,54
1,60
1,49 1,46 1,45
Employment level stabilized since 2010
1,42 1,39
1,40
1,37
1,29
Employment (in millions)
1,27 1,25 1,24
1,19 1,17 1,18 1,17 1,16
1,20 1,15 1,14 1,14
1,00
0,80
0,60
0,40
0,20
0,00
1998 1999 2000 2001 2002 2003 2004 2005 2006 2007 2008 2009 2010 2011 2012 2013 2014 2015 2016
Source: Cefic Chemdata International 2017.
Strategy and Competitive Intelligence Unit
In collaboration w ith:Bioeconomy in Catalonia | Sector report 27
Worldwide data: chemical industry
Petrochemicals and speciality chemicals account for half of the EU chemical sales
Sales 2016 (€507 billion)
13.6%
25.9% Petrochemicals
Other inorganics
Basic Inorganics
Industrial gases
11,7 %
Fertilizers
15.1% Plastics
Polymers
Synthetic rubber
21,6 %
Man-made fibres
Dyes & pigments
4.5% speciality Crop protection
Chemicals
Paints & inks
7.7% 27,2 %
2.6% Auxiliaries for industry
Consumer chemicals
4,6%
2.1%
2.3%
1.5% 1.2%
0.9%
Source: Cefic Chemdata International, 2017.
Strategy and Competitive Intelligence Unit
In collaboration w ith:Bioeconomy in Catalonia | Sector report 28
Worldwide data: chemical industry
Asian Chemical production outpaces other regions
World total Chemical sales in 2016 (€3,360 billion)
Source: Cefic Chemdata International, 2017.
*Rest of Europe: Switzerland, Norway, Turkey, Russia
and Ukraine.**North American Free Trade Agreement.
***Asia excluding China, India, Japan and South Korea.
Strategy and Competitive Intelligence Unit
In collaboration w ith:Bioeconomy in Catalonia | Sector report 29
Worldwide data: chemical industry
Asian Chemical production dominance is expected to continue
1.1%
12.0% EU28
16.6%
3.3% Rest of Europe
17.7% 15.1%
1.2%
NAFTA
2.7%
4.0% Latin America
4.2%
1… China
Sales 2030 Sales 2016
(€6.3 trillion) (€3.4 trillion) 15.7%
Japan
Rest of Asia
3,8% 5.0%
Rest of the world
39.6%
Source: Cefic Chemdata International, 2017.
44.0% *Rest of Europe: Sw itzerland, Norw ay, Turkey, Russia and Ukraine.
**North American Free Trade Agreement.
***Asia excluding China, India, Japan and South Korea.
Strategy and Competitive Intelligence Unit
In collaboration w ith:Bioeconomy in Catalonia | Sector report 30
Worldwide data: chemical industry
China dominates world chemicals investment, US spending surges ahead
Source: Cefic Chemdata International, 2017.
Strategy and Competitive Intelligence Unit
In collaboration w ith:Bioeconomy in Catalonia | Sector report 31
Worldwide data: chemical industry
China outspends industrial and emerging countries in chemicals R&D
Source: Cefic Chemdata International, 2017.
Strategy and Competitive Intelligence Unit
In collaboration w ith:Bioeconomy in Catalonia | Sector report 32
Worldwide data: chemical industry
26% growth potential for chemical products
In spite of the reduced demand for some products that would result from the increased circulation of molecules, overall
demand for chemical products is likely to grow -driven by the need for products that enable circularity downstream in
the value chain.
Energy consumption in a 2030 circularity scenario (in Mtoe)
The chemical industry is a supplier to
almost every industry.
It is in a position to enable circular
economy models for its downstream
customers.
The chemical industry itself accounts for
only approximately 5 percent of
Europe’s energy consumption, but
with its extended impact across
industries, che micals could help
reduce overall European energy
consumption by up to 37 percent.
Source: Accenture, 2017.
Strategy and Competitive Intelligence Unit
In collaboration w ith:Bioeconomy in Catalonia | Sector report 33
Worldwide data: chemical industry
Hazardous waste generated 1
Value yield =
volume yield * price
Hazardous waste is waste that can cause yield, where volume
yield = output
substantial threats to our health and the volumes/input
environment. volumes.
More than 400 million tonnes are Price yield = USD
produced each year. per tone of
reprocessed
material/USD per
15% of all hazardous waste in the US is tone of virgin
generated by the Chemical Industry. material.
Extrapolating that percentage to the whole
2
world, the che mical industry’s Current situation
based on 14%
worldwide waste generation reaches 60 recycling rate, 72%
million tonnes every year. volume yield and
50% price yield.
Total volume of
Polymers plastic packaging of
78 Mt, given a
weighted average
Today, 95% of plastic packaging material price of 1,100–1,600
value or $80–120 billion annually is lost USD/t.
to the economy after a short first use.
Source: World Economic Forum, 2016.
Strategy and Competitive Intelligence Unit
In collaboration w ith:Bioeconomy in Catalonia | Sector report 34
4. Trends
Strategy and Competitive Intelligence Unit
In collaboration w ith:Bioeconomy in Catalonia | Sector report 35
Trends Potential shifts in the industry fundamentals
The chemical industry’s strong performance during recent decades is closely linked to the following factors:
Although the sector may look fragmented, two decades of portfolio restructuring have created a highly
concentrated industry structure in many segments. This has put chemical companies in a strong bargaining
position relative to customers and suppliers.
Although their home markets were stagnated, Western European and North American chemical companies
have grown during the last two decades due to China’s economic growth. Since China’s capacity could not be
built fast enough to meet domestic demand, chemicals had to be imported.
The chemical industry has a wide range of links with other industries, from manufacturing to healthcare. Thus, the
chemical sector is well positioned to benefit from many different trends (e.g., sustainability, e-mobility, major
changes in consumer behaviour, …)
There are also some events that have had a positive effect on the industry, such as the availability of
stranded gas in the Middle East and shale gas in North America, and the upward trend in many agricultural-
commodity prices from 2000 to 2013.
How have these factors changed and how are they shaping the future of the industry?
Source: According to McKinsey & Company, 2017.
Strategy and Competitive Intelligence Unit
In collaboration w ith:Bioeconomy in Catalonia | Sector report 36
Trends
CHEMICAL INDUSTRY CIRCULAR ECONOMY BIOECONOMY
1 4 E n v i r o n me n t a l
F RAM EW O RK
N ationalism &
B U S I N ES S
policy & he alth
O ffshor ing
conce r ns
3
2 D e ma n d
C once ntration & & G r o wt h
C o mp e t i t i v e n e ss
I N D U S T R Y’ S
EV O L UT I O N
6 5
R e thinking
c o mme r c i a l C o mmo d i t i z a t i o n
mo d e l s
7 9
T ECHNO L O G I CAL
N e w plastics
I NNOV ATI ONS
B iote chnology
e c o n o my
& B i o r e f i n e ry
8
M ole cule
C irculating loops
Strategy and Competitive Intelligence Unit
In collaboration w ith:Bioeconomy in Catalonia | Sector report 37
Trends Business framework
1
N a t io n a lis m &
Of f s h o r in g Nationalist markets: Not only have the trade and investment policies of a
number of emerging-market countries always been somewhat protective (and
may have become even more so recently), but the US administration and Brexit
appear to embrace a similar attitude. In parallel with this resurgence of nationalism,
state-owned enterprises (SOEs) are taking an increasing share in the chemical
industry. Private and listed companies may find it difficult to compete with SOEs,
specially when it comes to the development of new technologies.
Offshoring: The imbalances in raw-material prices (the
cost of stranded and shale gas versus oil), labour costs
(China versus developed economies), or just regional
mismatches in supply and demand (China’s growth)
resulted in a significant internationalization of the
chemical industry in the past, but given the context of oil
prices moving to lower levels since 2014 and Chinese labour
costs rising, it is fair to speculate that this development
might go into reverse in the coming years.
Strategy and Competitive Intelligence Unit
In collaboration w ith:Bioeconomy in Catalonia | Sector report 38
Trends Business framework
2
C o n c e n t r a t io n
&
C o m p e t it iv e n e s s On the basis of total returns to shareholders (TRS), in the long term the chemical sector
has outperformed not only the overall market but also most of its customer industries and
raw-material suppliers. This strong performance is likely to change:
While the industry’s 15-year performance still looks good, a closer look at the past five years is less
favourable: not only have chemicals lagged the total stock market since 2011 in TRS performance but the
industry’s return on invested capital (ROIC) performance has flattened, and for some chemical subsectors,
decreased.
The industry is finding it increasingly difficult to hold onto the benefits of its productivity-improvement
efforts, despite of the fact that the implementation of digital approaches and modern analytics are creating new
opportunities to increase productivity. Thus, the decrease in productivity might be a consequence of increasing
competitiveness.
The industry’s structure is increasingly concentrated: During the last decade many segments of the industry
have been increasingly competitive due to the large number of new entrants, mostly Chinese. Besides,
overcapacity in some product areas is hampering productivity improvements. In the last year, the industry
seems to be leaning towards new waves of M&A in order to gain market dominance and greater economies of
scale.
Source: According to McKinsey & Company, 2015 and 2017.
Strategy and Competitive Intelligence Unit
In collaboration w ith:Bioeconomy in Catalonia | Sector report 39
Trends Business framework
3
D emand
& Gr o w t h Decrease in Chinese demand: Both global demand (led by China) and the Chinese
GDP growth rate are declining and the trend seems to be downward. China has moved
from its investment stage -built up infrastructure across the country while much of its
population has equipped itself with new homes, consumer durables, automobiles, and other
possessions- to an economy characterized rather by services and “upgrades,” which
provide far less demand for chemicals.
Chemical companies stablished in China
Less growth: McKinsey & Company (2017) estimates that
the last decade’s 3.6 percent growth rate for
petrochemicals may decrease by between 0.5 and 2.0
percentage points over the next ten years, depending on
assumptions for regional GDP growth. Other sectors are
likely to see similar reductions in growth rates -
although the growth in overall chemical demand will
continue to outpace GDP. In agrochemicals, for example,
changes in diet as well as the potential to tap enormous
productivity reserves in the existing food chain could
suppress overall chemical demand. In terms of growth,
experts from McKinsey argue that Chinese supply needs
broad and drastic consolidation.
Source: Greenpeace, 2016
Strategy and Competitive Intelligence Unit
In collaboration w ith:Bioeconomy in Catalonia | Sector report 40
Trends Business framework
4
E n v ir o n m e n t a l
p o lic y & h e a lt h Environmental and health concerns: Governments and corporations are being pushed
concerns both from within and without by activists and consumers to pay more attention to the
maintenance of our natural resources and the impact of chemicals on our health.
Innovation constraints: Public awareness is exerting pressure on many of the day-to-day actions routinely undertaken
by corporations, government and non-profit agencies. The uncertainty of the impact of chemicals on the environment and
our health might hamper the most ambitious and innovative investments in the industry.
Towards a non-toxic environment strategy: The 7th Environment Action Programme (7th EAP), mandated the
European Commission to develop by 2018 "a Union strategy for a non-toxic environment that is conducive to
innovation and the development of sustainable substitutes including non-chemical solutions."
Plastics: Since plastics consume the majority of petrochemical products, there is potentially an industry-wide impact.
Future environmental policies consider reducing the use of plastics in many aspects and there is no consensus concerning
how plastics affect public health. Given the sector’s rather low forecast growth rates, such regulation could potentially
result in a scenario in which the need for plastic would not only stop growing but might even (though not in the
short term) shrink.
"No data, no market": REACH (EC 1907/2006) aims to improve the protection of human health and the environment
through better and earlier identification of the intrinsic properties of chemical substances. This is carried out by the
four processes of REACH, namely the registration, evaluation, authorization and restriction of chemicals. The Regulation
also calls for the progressive substitution of the most dangerous chemicals (referred to as "substances of very high
concern") when suitable alternatives have been identified. The REACH Regulation places responsibility on
industry to manage the risks from chemicals and to provide safety information on the substances.
Strategy and Competitive Intelligence Unit
In collaboration w ith:Bioeconomy in Catalonia | Sector report 41
Trends Industry evolution
5
C o m m o d it iz a t io n
The commodity frontier continues to move to the right
Chemical companies are
facing a progressively harsher
environment as growing
segments of the industry are
becoming increasingly
commoditized.
According to McKinsey (2017),
production technology for
chemicals has become more
broadly available, and there
has been a rapid build-up of
capacity, particularly in
emerging markets.
Liquefied petroleum gas1, Natural gas liquids2, Butadiene, butylenes3, Benzene,
toluene, xylene 4 ,Ethylene oxide 5, Propylene oxide6, Polyvinyl chloride 7,
Polystyrene 8, Polyethylene terephthalate 9, Polymethyl methacrylate10,
Acrylonitrile butadiene styrene11, Polycarbonate12, Engineering thermoplastics13.
Source: McKinsey & Company, 2017.
Strategy and Competitive Intelligence Unit
In collaboration w ith:Bioeconomy in Catalonia | Sector report 42
Trends Industry evolution
6 R e t h in k in g
c o m m e r c ia l
m o d e ls Nowadays the type of engagement with customers is different from that of a traditional
chemical producer, which would have originally developed a chemical to meet its
customer’s need: Now products are simply sold on price due to commoditization.
Different approaches are available to serve different commercial requirements
The new market reality
requires an overhaul of
models for marketing and
sales. Companies that are
able to align their
commercial business
models with the market
environment can harness a
substantial payback. Apart
from the traditional
commercial structure, others
have been proved to be not
only appropriate, but
necessary.
Source: McKinsey & Company, 2017.
Strategy and Competitive Intelligence Unit
In collaboration w ith:Bioeconomy in Catalonia | Sector report 43
Trends Technological innovations
7 N e w p la s t ic s
a n d t e x t ile s
Examples of Promising Enabling Technologies for the New Plastics
economy
Economy and their Level of Maturity
Source: World Economic Forum, (2016) The New Plastics Economy: Rethinking the future of plastics
Innovation Description Current state
Removing Separating additives from recovered polymers to Lab stage: Some technologies exist but with
additives increase recyclate purity limited application.
Reversible Recycling multi-material packaging by designing Conceptual stage: Innovation needed to
adhesives “reversible” adhesives that allow for triggered develop cost-competitive adhesive.
separation of different material layers.
Finding a super-polymer that combines Conceptual stage: Innovation needed to
Super-polymer functionality and cost with superior after-use develop cost-competitive polymer with
properties. desired functional and after-use properties.
Lab stage: Proven technically possible for
Depolymerization Recycling plastics to monomer feedstock polyolefins. Limited adoption: Large scale
(building blocks) for virgin-quality polymers. adoption of depolymerization for PET
hindered by processing costs.
Chemical Sorting plastics by using dye, ink or other additive Pilot stage: Food-grade markers available
markers markers detectable by automated sorting but unproven under commercial operating
technology. conditions.
Strategy and Competitive Intelligence Unit
In collaboration w ith:Bioeconomy in Catalonia | Sector report 44
Trends Technological innovations
7 N e w p la s t ic s
a n d t e x t ile s
Examples of Promising Enabling Technologies for the New Plastics
economy
Economy and Their Level of Maturity
Source: World Economic Forum, (2016) The New Plastics Economy: Rethinking the future of plastics
Innovation Description Current state
Sorting plastics by using automated Fragmented adoption: Large scale adoption limited by capex
Near infrared optical sorting technology to distinguish demands.
polymer types.
Benign in Design plastics that are less harmful to Lab stage: First grades of marine degradable plastics (one
marine marine environments in case of spill. avenue towards benign materials) already certified as marine
environments degradable - impact of large scale adoption to be proved.
Benign in Design plastics that are less harmful to Lab stage: Marine degradable plastics theoretically fresh water
fresh fresh water environments in case of spill. degradable. One certified product - impact of large scale
water adoption to be proved.
Sourcing plastics from carbon in Pilot stage: CO2-based proved cost competitive in pilots;
GHG-based greenhouse gases released by industrial methane-based being scaled up to commercial volumes.
or waste management processes.
Bio-based Sourcing plastics from carbon in Limited adoption: Large scale adoption hindered by limited
biomass. economies of scale and sophistication of global supply chains.
Strategy and Competitive Intelligence Unit
In collaboration w ith:Bioeconomy in Catalonia | Sector report 45
Trends Technological innovations
7 N e w p la s t ic s
a n d t e x t ile s It is estimated that more than half of fast fashion production is disposed of in under a
economy year, and one refuse lorry full of textiles is landfilled or burnt every second. This factor
combined with a very low rate of recycling - less than 1% of material used - leads to ever-
expanding pressure on resources. The vision of the report ‘A new textiles economy’ drafted
by the Ellen Macarthur Foundation, hinges around four ambitions that would harness
opportunities missed by the current linear textiles system:
Creating a new textiles Phase out substances of concern and
economy microfibre release, by aligning industry efforts and
coordinate innovation to create safe material cycles.
Transform the way clothes are designed, sold
and used to break free from their increasingly
disposable nature, by scaling up clothing rental
schemes; making durability more attractive; and
increasing clothing utilization through brand
commitments and policy.
Radically improve recycling by transforming
clothing design, collection and reprocessing;
pursuing innovation to improve the economics and
quality of recycling;
Make effective use of resources and move to
renewable inputs.
Source: Ellen Macarthur Foundation, (2017) A New Textiles Economy: Redesigning fashion's future
Strategy and Competitive Intelligence Unit
In collaboration w ith:Bioeconomy in Catalonia | Sector report 46
Trends Technological innovations
8 M o le c u le
c ir c u la t in g According to Accenture (2017), to understand the impact that the circular economy could have
lo o p s on the chemical industry, it is useful to look at the issue from two perspectives: circulating
molecules and enabling the circular economy in downstream industries.
Circularity in chemicals has two aspects:
2) Circulating molecules
1) Enabling circularity
Enabling maximum utility in end usage
(e.g., higher durability of goods, making products
suitable for sharing and increasing energy efficiency)
Maximizing utility of existing molecules
(e.g., reusing/recycling molecules such as through the reuse
of PET bottles)
Source: Accenture, 2017.
Strategy and Competitive Intelligence Unit
In collaboration w ith:Bioeconomy in Catalonia | Sector report 47
Trends Technological innovations
8 M o le c u le
c ir c u la t in g
How would the circulation of molecules be accomplished?
lo o p s
There are five fundamental molecule-circulating loops in the chemical industry. Each of
the five loops has its own requirements and each could have a significant impact on the
consumption of carbon-based raw materials:
Substituting raw materials: The industry could substitute some portion of fossil feedstocks with renewable
feedstocks such as biomass material (e.g., bioethanol, lactic acid, bio C2/C4). Re-thinking the raw materials loop would require
investment in new feedstock infrastructure and conversion assets.
Increased reuse of end-user products: The industry could focus on developing full suites of new products and
solutions that can essentially be reused “as is,” such as durable PET bottles. To do so, the industry might consider
establishing “design to reuse” partnerships involving suppliers, original equipment manufacturers (OEMs), and companies that
have close relationships with end-customers.
Mechanical recycling: This involves reusing existing materials without modifying their chemical bonds. In essence, end-
use materials could be collected, processed and reinserted into the upstream value chain for use in similar or downgraded
applications.
Chemical recycling: When molecules cannot be reused in their intact structure, chemical companies could modify the
material’s molecular bonds to recover hydrocarbons. This would involve breaking up long-chain hydrocarbons into
precursors via processes such as catalytic cracking or plasma gasification. For this loop, the industry would need to invest in
further research and development in cracking and gasification processes, as well as invest in required large scale assets.
Energy recovery and carbon utilization: This involves recovering the energy contained in molecules by oxidizing
hydrocarbons to CO2, harnessingit and then building new chemical feedstocks via a catalytic reaction.
Source: According to Accenture, 2017.
Strategy and Competitive Intelligence Unit
In collaboration w ith:Bioeconomy in Catalonia | Sector report 48
Trends Technological innovations
9
B io t e c h n o lo g y
& B io r e f in e r y
Biorefinery is a biotechnological process which aims to produce renewable feedstock in a bid to provide
alternative solutions for petroleum-based products that are used rampantly in the world. If the biotechnological route is used
and the biorefinery concept implemented, chemicals will be produced with glucose as the starting material obtained, of
course, from cheaper natural raw materials.
The economics of chemical manufacture from petroleum refineries is threatened with the increasing shortage
and rising prices of petroleum, and biorefineries can repair the economic situation:
Incremental use of agricultural produce for chemical manufacture will also provide alternative domestic
markets for agricultural produce when exports are declining in developed countries.
Companies that have been building up their biotech capabilities will have advantages while those who
are slow to adopt biotech capabilities may miss out on some long-term opportunities.
Value will be derived through the creation of new business opportunities, such as developing synthetic
compounds that were previously inaccessible through classic chemistry, adding value to processes by
shortening time to market, reducing process costs by cutting out steps in synthesis or vastly increasing
yields, and through the use of cheaper raw materials, for example, making the transition from oil to corn and,
ultimately, corn stover.
Source: According to Chemical Weekly, 2016.
Strategy and Competitive Intelligence Unit
In collaboration w ith:Bioeconomy in Catalonia | Sector report 49
Trends Technological innovations
9
B io t e c h n o lo g y
& B io r e f in e r y Advantages of Biotechnology in Chemical Production:
Cleaner production since fewer waste will be generated. It can eliminate environmental concerns over the disposal
of chemical processing waste.
Increased product yield.
Reaction steps will be reduced, usually compressed into one synthesis and one isolation step in a biotech process.
The outcome is a 75% saving in capital equipment costs and a 50% cut in operating costs.
Cost-effective routes and new chemical entities possible.
Low-cost raw materials. Use of cellulose and biomass will reduce the cost. We will see the first biorefineries in a few
years.
No by-products generated which have undesirable colour or odour.
High regio- and stereoselectivity of biocatalytic reactions.
Using plant biomass as feedstock means feedstock grows, and it consumes CO2 — one of the greenhouse gases.
Use of plant biomass, if done successfully, will provide primary feedstock as well as energy. Today at least 5
billion kilograms of commodity chemicals are produced annually only in the United States using plant biomass as the
primary feedstock.
Unlike many chemical reactions that require very high temperatures and pressures, reactions using biological
molecules work best at ambient temperatures under 100°F, atmospheric pressure and in water-based solutions.
Therefore, manufacturing processes that use biological molecules can lower the amount of energy needed to
generate reactions.
Source: According to Chemical Weekly, 2016.
Strategy and Competitive Intelligence Unit
In collaboration w ith:Bioeconomy in Catalonia | Sector report 50
5. The Catalan chemical sector
Strategy and Competitive Intelligence Unit
In collaboration w ith:Bioeconomy in Catalonia | Sector report 51
The Catalan chemical sector
The following facts sum up the main characteristics of the industry in the region:
Catalonia’s turnover amounts to 42.6% of the High national chemical consumption. Catalonia
total of Spain’s chemical business volume. has the largest gas infrastructure in Europe and has
Tarragona has one of southern Europe’s biggest great potential for shale gas. Besides, the sector
petrochemical clusters and generates 23% of this has a National Competitiveness Plan for the
volume. The sector provides direct employment to Chemical Industry.
32,679 people in the region (2014).
Easy market access to high growth regions in It is the largest chemical cluster in the
Northern and Western Africa, Mediterranean Mediterranean. There are ongoing rail
Countries and Latin America. Catalonia is a investments to introduce the UIC standard gauge
gateway to the EU chemicals market. and develop the Mediterranean, Central and North
corridors to connect the region with the
European market.
Flexible labour market and competitive labour Close collaboration between authorities,
costs. There are strong links between universities, universities and businesses in the development
business schools, research centres, chemical of national R&D&I strategies and programmes.
engineers and professional associations.
Source: UIC ‘International Union of Railw ays’. Informe anual sobre la indústria a Catalunya (2016), Generalitat de Catalunya
Strategy and Competitive Intelligence Unit
In collaboration w ith:Bioeconomy in Catalonia | Sector report 52
The Catalan chemical sector
Industry subsectors
Basic chemistry: Activities for the manufacture of basic chemical products, nitrogen compounds,
fertilizers, plastics, synthetic rubber in primary forms, industrial gases, dyes and pigments, other basic
inorganic chemistry products and other basic organic chemistry products.
Chemistry for agriculture or agrochemicals: Fertilizers of all kinds, as well as insecticides and
pesticides -fumigants, fungicides, seed disinfectants, herbicides, molluscicides, etc.
Industrial chemistry: Compressed gases -hydrogen, nitrogen, oxygen, liquid air, etc.-, dyes and
pigments, paints, varnishes and lacquers, printing dyes, oils and greases for industrial use, auxiliary
products for the textile, leather and rubber industries, and various other products.
Chemistry for consumption: Soaps, detergents and dyes, articles of perfumery and cosmetics, waxes
and paraffin, sensitive photographic material, pyrotechnic articles, etc.
Other chemical products: Explosives, aromatic substances, etc.
Artificial and synthetic fibres: Manufacture of fabrics, papermaking, plastics, structural products
designed to resist stress, insulators, filters, cosmetics, etc.
Strategy and Competitive Intelligence Unit
In collaboration w ith:Bioeconomy in Catalonia | Sector report 53
The Catalan chemical sector
Industry subsectors
Structure of the industry’s turnover Structure of employment
Total: €16,268 million Total: 30,667 people
Basic chemistry
12% 17%
Agrochemicals
34%
Industrial chemistry
23%
58% Chemistry for
consumption
36% 1%
Other chemical
6% products and artificial 12%
1% fibers
Source: Informe anual sobre la indústria a Catalunya (2016), Generalitat de Catalunya
Strategy and Competitive Intelligence Unit
In collaboration w ith:Bioeconomy in Catalonia | Sector report 54
The Catalan and state-level chemical sector
The domestic chemical industry, in numbers:
12.8 % 4.5% 5th
OF CATALAN GDP SECTOR GROWTH PLACE IN EUROPE
comes from the chemical sector is expected annually until 2030, and 12th place worldwide in the
(2014), which contributes about According to the VCI Prognos classification of the chemical sector.
1.7% of the Catalan total gross Study. The chemical sector is the This position, however, is highly
added value and 10.3% of second largest exporter of the vulnerable to changes in oil prices
industrial gross added value in Spanish economy and it exports and depends heavily on the
2014. more than a half of its production. automotive industry, its biggest client.
€38,174 m €16,268 m 4.6%
TURNOVER IN SPAIN (2014) TURNOVER IN CATALONIA PRODUCTION GROWTH
(2014)
The sector’s turnover is Consolidated in Catalonia during
expected to grow at a slow but 2016. This growth was supported by
Catalonia had the largest share the recovery of domestic
steady pace (1.7%) in the
of the Spanish turnover by consumption and industrial activity.
coming years.
region (42.6%) in 2016. The sector grew more in Catalonia
than in Spain.
Source: Informe anual sobre la indústria a Catalunya (2016),
Generalitat de Catalunya
Strategy and Competitive Intelligence Unit
In collaboration w ith:Bioeconomy in Catalonia | Sector report 55
Regional impact
Potential benefits for the Catalan economy
€3.7 billion will be injected into the The chemical industry could generate
European economy between 2014 additional wealth for Catalonia worth
and 2024 - €975 million from the €270 million by 2020 if a bioeconomy
European Commission and €2.7 approach is adopted.
billion from the Bio-based
Industries Consortium (BIC) Both upstream and downstream bio-based che mical
production have been found to generate significant
wealth effects:
…to develop an e merging bioeconomy sector. Through €190 million for the industry’s suppliers.
the financing of research and innovation projects, the €80 million for the Catalan chemical industry’s
BBI (Bio Based Industries) will create new and novel clients.
partnerships across sectors, such as agriculture, agro-
food, technology providers, forestry/pulp and paper, The bio-based share of all chemical sales in Catalonia could rise to
15% by 2020.
chemicals and energy.
*Estimation: As a basis for quantitatively assessing the macroeconomic
The aim of the BBI is to use Europe's untapped biomass contribution of the bio-based industries, a common feature of these studies is
and waste as feedstock to make fossil-free and the usage of economy-wide supply and use tables (SUT) or social accounting
greener everyday products. At the heart of it are matrix (SAM) national accounts data (United Nations, 1999). This study
advanced biorefineries and innovative technologies that provides multiplayers for the EU countries and bioeconomy sectors in
the form of backward- (2.23) and forward-looking (0.91) linkages. This
will convert renewable resources into sustainable bio- means that for each million euro of additional demand, the regional economy
based chemicals, materials and fuels. generates €2.23 million for upstream supply industries and €0.91 million for
downstream sectors and retailers.
Strategy and Competitive Intelligence Unit
In collaboration w ith:You can also read