OVERBERG REGIONAL ECONOMIC DEVELOPMENT AND TOURISM STRATEGY (2018-2028) 2018
←
→
Page content transcription
If your browser does not render page correctly, please read the page content below
OVERBERG REGIONAL ECONOMIC
            DEVELOPMENT AND TOURISM
               STRATEGY (2018-2028)
                      2018

OVERBERG REGIONAL ECONOMIC DEVELOPMENT AND TOURISM STRATEGY (2018-2028)   Pg 1
The Overberg Regional Economic Development and
                                 Tourism Strategy
                     Guides the long-term sustainable planning and development of the
                   Overberg’s regional economy to lead to inclusive growth for all within
                                 the Overberg through the years 2018-2028.
                     The Strategy assesses the current operating environment, outlines
                    strategic goals for this ten-year period, then recommends a series of
                    actions that achieves those goals by leveraging existing assets and
                  strengths, overcoming existing weaknesses and threats and developing
                                           new assets and strengths.
                    The Strategy was produced after extensive community consultation,
                      asset mapping, SWOT Analysis and data analysis throughout the
                                                   Overberg.

OVERBERG REGIONAL ECONOMIC DEVELOPMENT AND TOURISM STRATEGY (2018-2028)                     Pg 2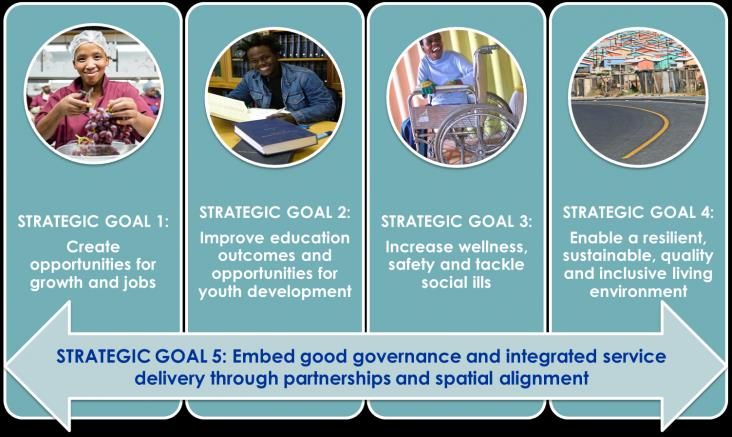
TABLE OF CONTENTS
       Foreword from the Mayor……………………………………………………………………………4
       1. Background…………………………………………………………………………………………5
       2. Introduction…………………………………………………………………………………………6
       3. The need for a regional approach………………………………………………………………..7-8
               3.1 Overview…………………………………………………………………………………..7
               3.2 Advantages of adopting a Regional Approach……………………………………..…8
       4. Policy Context…………………………………………………………………………………….…8
               4.1 National Development Plan…………………………………………………………..…8
               4.2 Medium Term Strategic Framework……………………………………………………9
               4.3 SPLUMA………………………………………………………………………………..…9
               4.4 LUPA…………………………………………………………………………………..…..9
               4.5 Integrated Urban Development Plan…………………………………………….…….10
               4.6 Provincial Strategic Plan…………………………………………………………….….10
               4.7 Western Cape Provincial Spatial Development Framework…………………….…10
               4.8 OneCape 2040…………………………………………………………………………..10
               4.9 Western Cape Tourism Development Framework…………………………………..11
               4.10 Western Cape Infrastructure Framework…………………………………………….11
               4.11 Western Cape Green Economy Strategy Framework……………………………...11
               4.12 Overberg IDP 2018-2022………………………………………………………………11
               4.13 Overberg Spatial Development Framework…………………………………………11-12
               4.14 Overberg Integrated Transport Plan…………………………………………………..12
       5. Methodology………………………………………………………………………………………..13
       6. Economic Analysis……………………………………………………………………………..….14
               6.1 Global Economic Outlook……………………………………………………………….14
               6.2 South African Growth Outlook……………………………………………………........14-15
               6.3 Provincial Economic Analysis…………………………………………………….……16
               6.4 District Economic Outlook……………………………………………………..………16-23
       7. Swot analysis of the region…………………………………………………………….………..24-25
       8. Some key socio-economic trends, Challenges and Key considerations………….……..…26
       9. Local Municipal Economic Analysis………………………………………………….…………27-30
       10. RED and Tourism Strategy………………………………………………………………….….30
               10.1 Strategic Vision………………………………………………………….…………….30
               10.2 Strategic Goals………………………………………………………………………..30-35
       11. The roles and responsibilities in economic development planning and implementation..36-37
       12. Implementation Plan……………………………………………………………………………..38-41
       13. Funding Opportunities……………………………………………………………………….…..41-42
       14. Monitoring and Evaluation………………………………………………………………..……..42-43
       15. List of references……………………………………………………………………………..….43-44

OVERBERG REGIONAL ECONOMIC DEVELOPMENT AND TOURISM STRATEGY (2018-2028)                          Pg 3
FOREWORD BY DISTRICT MAYOR                           The strategy aims to be the catalyst for
                                                            sustainable regional economic growth, to
                                                            positively impact all facets of life in our region
                                                            and beyond our borders. As we are aware,
                                                            tourism cannot be restricted to our boundaries
                                                            and borders. This strategy aims to promote
                                                            and enhance tourism, ensure tourism safety
                                                            and improve the tourism experience/s in the
                                                            region and beyond. It intends to foster and
                                                            strengthen inter-municipal and municipality
                                                            cooperation and relations.
                                                            It is of great importance that business owners
                                                            find within the strategy opportunities for
                                                            investment and job creation. During the
                                                            consultation process a strong emphasis has
                                                            been laid on community and stakeholder
                                                            participation this we will continue.

       As Executive Mayor of the Overberg District          This strategy is in no way cast in stone, as it is
       Municipality, I am extremely honoured and            developed for a vibrant and growing region the
       proud to have been part of the journey in            need for adjustment and adaption has been
       developing      this  Regional   Economic            very central to the development process of the
       Development and Tourism Strategy for the             product, thus during the review periods your
       Overberg Region.                                     further inputs and participation will be
                                                            appreciated.
       It has been a long and arduous journey, taking
       up many hours of work and consultations. The         We envisioned that this strategy will assist the
       meticulous, dedicated and consistent work by         Overberg Region and all its partners to pursue
       our officials and partners has produced the          an upward trajectory in the quest to improve
       result encapsulated in this strategy.                the lives and wellbeing of all in this beautiful
                                                            region.
       During 2017 the Overberg District Municipality
       has decided that a regional approach to Local        I take the privilege to express my gratitude and
       Economic Development is the direction to go.         appreciation to all that have so generously
       The municipality approached SALGA to assist          contributed to developing this strategy. I wish
       in drafting a Regional Economic Development          to thank SALGA, our officials and partners for
       and Tourism Strategy. The strategy objective         their commitment and diligent work towards
       is to positively impact the lives of all those who   realising this strategy for the Overberg Region.
       live, work, do business and visit the Overberg.      Ald. AE Franken
       Through the strategy the municipality aims to
       achieve its vision of being “the opportunity         Executive Mayor
       gateway to Africa”.

OVERBERG REGIONAL ECONOMIC DEVELOPMENT AND TOURISM STRATEGY (2018-2028)                                  Pg 4
1.       BACKGROUND
       1.1      Overberg Regional Economic Development and Tourism Strategy
                Traditional Local Economic Development1 (LED) strategies have their origins in the high-
                income countries in developed countries. They emerged in the last 30-40 years as a
                response to the social and economic problems that resulted from the persistence of locality-
                specific development problems (Nel 2001, 1004) as cited in Rodríguez-Pose & Tijmstra (n.d).
                The disappointing results of this traditional top-down, supply-side sectoral development
                strategies in combating the resulting rise in unemployment and regional inequality has driven
                the search for alternative development strategies that would offer opportunities for growth to
                all areas (Roberts,1993). In order to achieve dynamic local development, all aspects of local
                communities such as the economy, social, welfare, environmental and political issues need
                to be addressed in an integrated and holistic manner (Meyer, 2014).

                Regional development in SA is key but an underdeveloped space for action in the economy.
                It calls for a great deal of influencing for a collaborative approach to enable economic
                development. Whilst there should be a balance between pro-growth and pro-poor economic
                development, ultimately, economic development policy should focus on an increase in the
                number and variety of job opportunities and diversification of economic activities (Blakely &
                Bradshaw, 2002 as cited in Meyer, 2014).

                To this end, the Overberg District Municipality (ODM) requested SALGA’s support in the
                development of a Regional Economic Development (RED) and Tourism Strategy, which
                would enable collaboration amongst municipalities and private sector.

                The Overberg District is known for its coastline and vast farmlands. The ODM is bordered by
                the Garden Route District, the Cape Winelands District and the City of Cape Town. The
                Overberg District is the second smallest economy in the Western Cape and made a 3.5%
                contribution to the Provincial GDPR in 2016. The four local municipal areas in the OBD
                include the Theewaterskloof, Overstrand, Cape Agulhas and Swellendam municipal areas.

                         Figure 1: Map illustrating the Overberg District Municipality

       1
        Within this strategy, tourism is considered an economic industry falling within tertiary sector. Therefore it is a force
       for regional development.

OVERBERG REGIONAL ECONOMIC DEVELOPMENT AND TOURISM STRATEGY (2018-2028)                                                     Pg 5
2.     INTRODUCTION
              At the heart of the Overberg Regional Economic Development and Tourism Strategy is
              collaboration and partnerships. The Strategy undertook a whole of government approach
              through the three spheres of government working together to in its development. This was in
              the form of collaboration between the Overberg District Municipality (together with Cape
              Agulhas, Swellendam, Overstrand and Theewaterkloof), SALGA, Western Cape
              Government (WESGRO, Department of Economic Development and Tourism, Western
              Cape Economic Development Partnership, Department of Transport and Public Works,
              Department of Environmental Affairs and Development Planning), and Department of
              Agriculture) and National Government (Department of Cooperative Governance and
              Traditional Affairs, Department of Economic Development, and Statistics South Africa).

              Furthermore, the Strategy development process also included extensive stakeholder
              consultation with the private sector, civil society groups, and non-government organisations
              across the Overberg. The purpose of the consultations was to collectively develop the
              Overberg Regional Economic Development and Tourism Strategy to ensure the whole of
              society buy-in improving the lives of all.

              The Overberg Regional Economic Development and Tourism Strategy begins with providing
              a clear rational for the Regional Approach. It explains that to ensure success in the
              implementation of this Strategy it is imported that is embedded in organisational, economic
              and social context. This includes analysis of the global, national, district and local context.
              Through the stakeholder consultation, a thorough SWOT analysis was developed to inform
              vision, strategic goals key interventions. Importance is also placed on the policy context as
              the Strategy needs to be aligned to both national and provincial policy prescripts.

              It is through a widely shared vision for the future development of the Overberg can the goals
              of the strategy be achieved by all. Last the Strategy also places great importance on
              monitoring and evaluation, as a well functioning monitoring and evaluation system that is
              critical for project and programme management and accountability in the implementation of
              the Overberg Regional Economic Development Framework

OVERBERG REGIONAL ECONOMIC DEVELOPMENT AND TOURISM STRATEGY (2018-2028)                                 Pg 6
3.     THE NEED FOR THE REGIONAL APPROACH
               Key Points
               • Overview
               • Advantages of adopting a Regional Approach

       3.1    Overview
              Embracing a regional approach entails multi stakeholder agreement on its parameters and
              utility. A regional approach must be embedded in local policies and processes. A favorable
              local policy context, which includes the National Spatial Development Framework (SDF), the
              Provincial SDF and the Overberg SDF are shown to be overtly supportive of a regional
              approach. Regional approaches vary in form. Typically they include an analysis of what is
              happening at regional level; the development of a vision and a set of long range goals for the
              region and the articulation of a plan of how public, private, civic, and other organisations will
              work together to help deliver the vision for the future of the region. Regional development
              strategies often set 10- 20 year time horizons.

              The alternative to a regional approach is to manage all inputs as sectoral policies of national
              ministries and state enterprises as if there were no links between the services they provide
              and the impacts that they have. The costs of this approach are formidable and include global
              invisibility, the fiscal costs of silo infrastructure management and the inability to deal with
              issues that are inherently regional, especially spatial planning and ecological management.
              Rather than overburden an already loaded policy environment, working regionally can help
              achieve national development objectives of accelerated shared growth through the
              collaboration of multiple partners at the regional level.

              A regional approach calls for the integrated management of space, economies and people.
              It further acknowledges that regional connectivity and economic value chains are the main
              conduits that enable economic development on a larger scale. By approaching development
              with a regional outlook, it is possible to attain optimal economic benefits through inclusive
              and equitable development. This new approach will culminate in a paradigm shift in the way
              economic regions are conceptualised - from administrative regions to economic and
              functional regions. Understanding the economic regions within which the municipalities are
              located presents a real opportunity for cross boundary municipal collaboration, cooperative
              spatial governance and joint planning for achieving shared economic futures. It also assists
              municipalities to make the necessary adjustment and investments towards diversifying their
              economies and subsequently reducing the risk inherent in global downturns and economic
              shocks.

              An effective regional development strategy is embedded in its organisational, economic and
              social context. It establishes a widely-shared vision for the future development of the region
              and engages stakeholders in an open and productive manner during preparation of the
              strategy. Through this process it is prudent that clear mechanisms for delivery is identified;
              sequencing key investments and actions and establishes a simple but effective framework
              for monitoring.

              Local leadership is therefore essential for regional economic development success.
              Government leaders are expected to take the lead in coordination and facilitation, but other
              leaders from the community and business must contribute. Under the term “local leadership”,
              two other terms are also listed namely “local champions” and “local drivers”. Local leaders
              and champions must work together as partners to maximise local resources and actions.
              Local leaders must make sure the local economy is driven and to create momentum. Local
              government must take quick and effective decisions to the benefit of the local community.

OVERBERG REGIONAL ECONOMIC DEVELOPMENT AND TOURISM STRATEGY (2018-2028)                                   Pg 7
3.2    Advantages of adopting a Regional Approach
              Regional development approaches are now being pursued implicitly or explicitly by many
              people because they make a positive contribution to development and facilitate collaboration
              between parties. A regional approach is effective because:

                     Key Points
                     • The geographical focus enables the cumulative effects of different policies to be
                        more visible, the impacts of larger drivers to be recognised, and the gaps better
                        understood.
                     • The emphasis on institutional collaboration provides for a more optimal use of
                        resources and for other efficiencies such as shared use of intelligence and
                        resolution of implied tensions between policy goals.
                     • Better between governmental and private sector organisations
                     • What it can contributes, what its goals and needs are, and how they can get
                        involved.

       4.     POLICY CONTEXT
               •   National Development Plan
               •   Medium-Term Strategic Framework (MTSF)
               •   The Spatial Planning and Land Use Management Act, 2013 (Act 16 of 2013) (SPLUMA)
               •   Land use planning principles
               •   Integrated Urban Development Framework
               •   Provincial Strategic Plan
               •   Western Cape Provincial Spatial Development Framework
               •   OneCape 2040
               •   Western Cape Tourism Development Framework (WCTD Framework)
               •   Western Cape Infrastructure Framework
               •   Western Cape Green Economy Strategy Framework
               •   District Integrated Development Plan
               •   Overberg Spatial Development Framework
               •   Overberg Integrated Transport Plan

       4.1    National Development Plan 2030
              It is a plan for a better future; a future in which no person lives in poverty, where no one goes
              hungry, where there is work for all, a nation united in the vision of our Constitution. The
              approach to tackling poverty and inequality is premised on faster and more inclusive
              economic growth, higher public and private investment, improving education and skills,
              greater use of technology, knowledge and innovation and better public services all leading to
              higher employment, rising incomes and falling inequality. Figure 2 below illustrates the focus
              areas of the NDP:

OVERBERG REGIONAL ECONOMIC DEVELOPMENT AND TOURISM STRATEGY (2018-2028)                                   Pg 8
Figure 2: NDP (2030) Key Focus Areas

              The National Planning Commission's approach is to address living standards inclusively for
              all South Africans. It recognises that government on its own cannot improve living standards.
              We require determined and measurable action by all social actors and partnerships across
              society to raise living standards.

       4.2    Medium-Term Strategic Framework (MTSF)
              The MTSF 2014–2019 flows from the NDP, synthesises national government's strategic
              plans across all sectors and informs provincial policy development. The MTSF prioritises the
              following goals:
                   • Radical economic transformation, rapid economic growth and job creation.
                   • Rural development, land and agrarian reform and food security.
                   • Ensuring access to adequate human settlements and quality basic services.
                   • Improving the quality of and expanding access to education and training.
                   • Ensuring quality health care and social security for all citizens.
                   • Fighting corruption and crime.
                   • Contributing to a better Africa and a better world.
                   • Social cohesion and nation building.

              These eight goals are elaborated in 14 outcomes with targets and activities for the five-year
              strategic period.

       4.3    The Spatial Planning and Land Use Management Act, 2013 (Act 16 of 2013) (SPLUMA)
              SPLUMA introduced a three-sphere system of integrated planning at the national, provincial
              and municipal sphere and allows for the creation of Provincial Legislation and Municipal By-
              laws, to make provision for matters dealt with in the regulations in a manner that relates to
              the specific context in a province or municipality.

       4.4    Land Use Planning Principles set out in SPLUMA and the Western Cape Land Use
              Planning Act, 2014 (Act 3 of 2014) (LUPA) apply to all organs of state responsible for the
              implementation of legislation regulating the utilisation and development of land and guide
              spatial development frameworks, zoning schemes or any policy concerning land use
              planning, any steps to ensure sustainable development and the consideration of applications
              that impacts on the utilisation and development of land.

OVERBERG REGIONAL ECONOMIC DEVELOPMENT AND TOURISM STRATEGY (2018-2028)                                Pg 9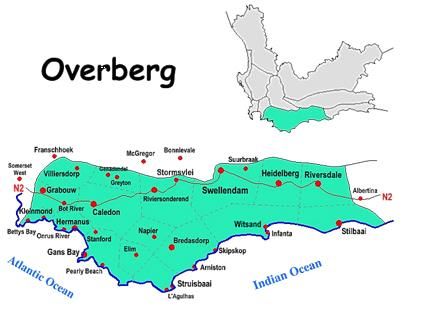
4.5    Integrated Urban Development Framework (2016)
              The Integrated Urban Development Framework (IUDF) is a policy framework of the country,
              which was approved by Cabinet in April 2016. It seeks to foster a shared understanding
              across government and society about how best to manage urbanisation and achieve the
              goals of economic development, job creation and improved living conditions for our people
              through ensuring that our cities and towns become more inclusive, resource efficient and
              good places to live, work, shop and play in, as per the vision outlined in the National
              Development Plan.

       4.6    Provincial Strategic Plan (2009-2019)
              The only sustainable way to reduce poverty is by creating opportunities for growth and jobs.
              This insight informed PSP 2009-2019, which sought to shift resources and energy into
              creating a context for growth and job opportunities without compromising the state’s ability to
              deliver better outcomes in health, education and social development, and while refocusing
              efforts to promote social inclusion. The Western Cape Government has identified the five
              Provincial Strategic Goals (PSGs) to deliver on its vision and to help realise the objectives of
              the NDP over its five-year term. See Figure 3: The 5 PSGs:

              Figure 3: The 5 Provincial Strategic Goals (2014-2019)

       4.7    Western Cape Provincial Spatial Development Framework (2014)
              In 2014 the Western Cape Government adopted the Provincial Spatial Development
              Framework (PSDF). Its purpose is to address the lingering spatial inequalities that persist as
              a result of apartheid’s legacy – inequalities that contribute both to current challenges (lack of
              jobs and skills, education and poverty, and unsustainable settlement patterns and resource
              use) and to future challenges (climate change, municipal fiscal stress, food insecurity and
              water deficits). The PSDF provides a shared spatial development vision for both the public
              and private sectors and serves as the guide to all sectoral considerations with regard to space
              and place. The PSDF serves to guide the location and form of public investment and to
              influence other investment decisions by establishing a coherent and logical spatial
              investment frame work.

       4.8    OneCape 2040
              OneCape 2040 is a deliberate attempt to stimulate a transition towards a more inclusive and
              resilient economic future for the Western Cape region. It is a vision and strategy for society,
              rather than a plan of government, although all three spheres of government are essential for
              implementation. It does not replace any existing statutory plans required of either the
              province or municipalities. It is rather intended as a reference point and guide for all
              stakeholders to:

OVERBERG REGIONAL ECONOMIC DEVELOPMENT AND TOURISM STRATEGY (2018-2028)                                  Pg 10
• Promote fresh thinking and critical engagement on the future.
• Provide a common agenda for private, public and civil society collaboration.
• Help align government actions and investment decisions.
• Facilitate the necessary changes that needs to be made to adapt to (rapidly) changing
local and global contexts.
• Address development, sustainability, inclusion and competitiveness imperatives.
4.9 Western Cape Tourism Development Framework- WCTD Framework
The WCTD Framework provides for the destination vision and strategy for tourism in the
Western Cape and is the high-level sector strategy for tourism. The WCTD Framework
ensures joint planning, budgeting and implementation between the three spheres of
government in the first instance and all of their social partners in the second instance. The
WCTD Framework has defined targets and outcomes that need to be achieved over a ten-
year timeframe. It is a living and dynamic document, with research constantly being added
to the evidence base and analyses being adjusted as circumstances change. There will be a
major review on a five-year basis.
4.10 Western Cape Infrastructure Framework (2013)
The Western Cape Infrastructure Framework aligns the planning, delivery and management
of infrastructure provided by all stakeholders (national government, provincial government,
local government, parastatals and the private sector).
4.11 Western Cape Green Economy Strategy Framework (2014)
The aim of the framework is to position the Western Cape as the lowest carbon province in
South Africa and the leading green economic hub of the African continent.
4.12 Overberg IDP 2018-2022
Closely aligned to the provincial strategic plan, the following is identified as the key strategic
goals for the District:
To ensure the well-being of all in the Overberg through the provision of
ODM SG1
efficient basic services and infrastructure.
To promote regional economic development by supporting initiatives in the
ODM SG2
District for the development of a sustainable district economy.
To ensure municipal transformation and institutional development by
ODM SG3 creating a staff structure that would adhere to the principles of employment
equity and promote skills development.
To attain and maintain financial viability and sustainability by executing
ODM SG4
accounting services in accordance with National policy and guidelines.
: To ensure good governance practices by providing a democratic and pro-
ODM SG5 active accountable government and ensuring community participation
through IGR structure
Table 1: Overberg Strategic Objectives (IDP 2017-2021)
4.13 Overberg Spatial Development Framework (2014)
The purpose of the Overberg Spatial Development Framework to optimise the
rich and balanced mix of the Overberg’s agriculture, tourism, heritage,
conservation resources (including natural and scenic resources) and eco
system. The main policy and principle informants for the SDF include the
following:
• The area’s unique agricultural, environmental and urban qualities must
be maintained;
OVERBERG REGIONAL ECONOMIC DEVELOPMENT AND TOURISM STRATEGY (2018-2028) Pg 11• Private conservation areas must continue to be promoted with careful
consideration of appropriate development rights to mobilise the
necessary resources for veld rehabilitation and management;
• Development and tourism efforts should take advantage of the district’s
close proximity to Cape Town as well as ensuring maximum benefits for
local residents.
4.14 Overberg Integrated Transport Plan (2016)2
The Overberg District Municipality’s potential growth and development opportunities have
been identified as being in the fields of tourism and agro-processing. These industries require
good access to transport goods and to service centres as well as to employment
opportunities to ensure successful growth in the regional economy.
The local public transport service such as minibus taxis (MBT) in the district enable people
to access destinations, which cannot be reached on foot or by other modes of non-motorised
transport. Affordability impacts the use of public transport therefore creating a higher
percentage of walking. MBT is the dominant mode for both commuter and long-distance
public transport services. Population densities are relatively low and destinations far between
in many towns. This reduces the cost effectiveness of public transport and particularly bus
services. Currently there are no commuter rail services within the ODM.
The road network through district consists of 4000 km of national and provincial roads. The
N2 is the major road-based link making up 4.5% of the road length. The movement of freight
is fundamental since all economic activity, be it agricultural, infrastructure development,
energy production or general industry.
ODM’s road network is therefore significantly impacted by and subjected to the high tourism
seasonal traffic particularly on R44, R43, R316 and R319. Peak periods occur during the end
of year festive season, around Easter holidays, school holidays and the September-October
whale season.
The Overberg District has a number of airstrips. The largest of which is the Test Flight and
Development Centre Airforce base between Bredasdorp and Waenhuiskrans in the CALM.
Upgrading of existing or construction of new airstrips can pave the way towards many
economic opportunities for people in and around surrounding towns within the district.
2
The Overberg’s Integrated Transport Plan is currently being updated
OVERBERG REGIONAL ECONOMIC DEVELOPMENT AND TOURISM STRATEGY (2018-2028) Pg 125. METHODOLOGY
The preparation of the RED and Tourism Strategy followed a four-phase work program
completed over 19 months between December 2017 and March 2019 as seen in the figure
below.
Figure 4: Development of the Overberg Regional Economic Development and Tourism
Strategy
The Overberg RED and Tourism Strategy has been compiled through primary and secondary
data. The Economic Outlook Section through data from:
• Municipal Economic Outlook and Review;
• Provincial Economic Outlook and Review;
• Quantec; and
• Statistics South Africa
The primary data has been obtained through a combination of a series of engagement
between officials from the Overberg, National & Provincial Government3, SALGA;
Swellendam, Theewaterskloof, Overstrand, and Cape Agulhas municipalities’ local
representatives from business, agriculture, NPOs and social development. This was done
through a series of extensive consultations with stakeholders and representatives of
community and business organisations in each of the above stated municipalities.
These engagements are outlined below:
• 11-13 June 2018;
• 23 August 2018;
• 03-05 September 2018; and
• 25-26 October 2018.
•
OVERBERG REGIONAL ECONOMIC DEVELOPMENT AND TOURISM STRATEGY (2018-2028) Pg 136. ECONOMIC ANALYSIS
This section describes the economic status quo of the economy of the Overberg District
Municipality using the latest economic data available obtained from Municipal Economic
Outlook and Review (WC Treasury, 2018), Quantec and Statistics South Africa. This creates an
opportunity to examine the economy and the different economic sectors, which in turn
identifies the sectors of the economy that have the largest contribution to the district.
• Global Economic Outlook
• South African Growth Outlook
• Provincial Economy
• District Economic Outlook
6.1 Global Economic Outlook
To put into context the complex nature of economic development, firstly it is important to take
a look at the global and national economies as it has a great impact on provincial and local
economies. The latest World Economic Outlook report (2018) projects that global growth will
remain steady over 2018–19 at last year’s rate of 3.7 percent. This growth exceeds that
achieved in any of the years between 2012 and 2016.
Despite the encouraging headline growth figures, the global economy is facing the highest
level of risk in recent years. Indeed, this favourable economic picture appears to come from
a completely different world to the one where headlines are dominated by protectionist
rhetoric, major territorial disputes, and financial market instability and rising geopolitical
tensions (The Economist Intelligence Unit Limited, 2018). Considering the developments
since April 2017, growth has plateaued at 3.7 percent down from the projected 3, 9 percent
for 2018 and 2019. US growth forecast owing to the recently enacted tariffs on a wide range
of imports from China and China’s retaliation. Therefore, China’s expected 2019 growth is
also marked down (IMF, 2018).
Overall, compared with six months ago, projected 2018–19 growth in developed economies
is 0.1 percentage point lower, including downgrades for the euro area, the United Kingdom,
and Korea. The negative revisions for emerging market and developing economies are more
severe, at -0.2 and -0.4 percentage point, respectively, for 2018 and 2019.
These revisions are also geographically diverse, encompassing important economies in Latin
America (Argentina, Brazil, and Mexico), emerging Europe (Turkey), south Asia (India), East
Asia (Indonesia and Malaysia), the Middle East (Iran), and Africa (South Africa)—although
Nigeria, Kazakhstan, Russia, and Saudi Arabia are among the petroleum exporters that will
benefit from higher oil prices. Broadly speaking, however, there are signs of lower investment
and manufacturing, coupled with weaker trade growth.
6.2 South African Growth Outlook
Statistics South Africa has published its latest Gross Domestic Product (GDP) data, showing
that South Africa’s economy grew at 0.8% in 2018, slightly beating estimates. Following a
technical recession in the second quarter of 2018, most forecasts were revised down to 0.6-
0.7 from the 1.2%-1.5% range, as the economic realities set in despite upbeat talk around
political change in the country. The International Monetary Fund has lowered South Africa's
projected GDP growth rate for 2019 from 1.4% to 1.2% (April, 2019), putting the country
among the worst performers in sub-Saharan Africa.
OVERBERG REGIONAL ECONOMIC DEVELOPMENT AND TOURISM STRATEGY (2018-2028) Pg 14Given population growth, GDP per capita growth has been stagnant or low since 2014,
leaving little room to reduce poverty. Commodity prices remain important for South Africa, a
major exporter of raw materials. Strengthening investment, including foreign direct
investment, will be critical to propel growth and create jobs.
South Africa remains a dual economy with one of the highest inequality rates in the world,
perpetuating both inequality and exclusion. According to Statistics South Africa, the Gini
coefficient measuring relative wealth reached 0.65 in 2014 based on expenditure data
(excluding taxes), and 0.69 based on income data (including salaries, wages, and social
grants). The poorest 20% of the South African population consume less than 3% of total
expenditure, while the wealthiest 20% consume 65% (STATSSA, 2018).
Having said that, South Africa’s growth had improved in 2017 to 1, 3% up from 0,6% in 2016.
This recovery was underpinned by agriculture, mining & finance. South Africa is seen as the
‘big emerging market story of 2018, however, risks remain including the unfolding land reform
process; state-owned policy; mining charter (which is said to be concluded); and the impact
on public debt. As a result, Statistics South Africa announced on Tuesday, 4 September 2018
that South Africa has officially entered a technical recession4.
The country's real GDP had decreased by 0.7% in the second quarter of 2018. This follows
a GDP contraction of 2.2% in the first quarter. South Africa has however made considerable
strides toward improving the wellbeing of its citizens since its transition to democracy in the
mid-1990s, but progress is slowing. Based on the poverty line of $1.90 per day at Purchasing
Power Parity (PPP), poverty fell from 33.8% in 1996 to 16.9% by 2008. Factors driving this
included social safety nets and free access to basic services, real income growth, as well as
decelerating inflationary pressure on households, the expansion of credit, and growth in
publicly-provided formal housing. Yet progress has slowed in recent years due to structural
challenges and weak global growth since the global financial crisis of 2008. Poverty
increased slightly, estimated at 19% in 2018. High unemployment remains a key challenge,
standing at 27.2% in the second quarter of 2018. The unemployment rate is even higher
among youths, at around 50%.
The largest negative contributors to GDP growth were the agriculture industry - which
decreased by 29.2%, followed by the transport industry (-4.9%) and trade (-1.9%) (Statistics,
2018). The decrease in agriculture was largely driven by a decline in the production of field
crops and horticultural products.
For the first time since Q1 2016, households also cut consumption expenditure, which
decreased by 1.3% for the quarter 4 in 2018. The biggest cuts were recorded for spending
on transport, food and drinks, according to Stats SA (Fin24, 2018). The implication of this
would be significant for local economies since businesses in these sectors will not be
financially sustainable and will experience job losses.
Government expenditure, meanwhile, grew by 0.7%. Total investment, also known as gross
fixed capital formation, decreased by 0.5%. Net exports contributed positively to growth in
GDP through expenditure. Exports were up 13.7% for the quarter due to increased trade in
precious metals, mineral products and vegetable products. Imports increased by 3.1% and
were driven by imports of mineral products, prepared foodstuffs, beverages and tobacco and
vehicles and transport equipment, according to Stats SA. The total value of the South African
economy was R1,24 trillion in Q2:2018 with finance (R222b) & government (R198b)
industries remain the biggest.
4
A technical recession is two consecutive quarters of negative growth (Fin24, 2018).
OVERBERG REGIONAL ECONOMIC DEVELOPMENT AND TOURISM STRATEGY (2018-2028) Pg 156.3 Provincial Economic Analysis
A sharp moderation in economic growth to 0.2 per cent is expected in the Western Cape in
2018. However, much of this is due to a contraction in output in the agriculture, forestry and
fisheries sector because of the drought. Value added in the agriculture, forestry and fisheries
sector might decline by close to 25 per cent in 2018. Related to this is the food and beverages
manufacturing sector with a likely fall in output of 9.1 per cent in 2018. The poor performance
of these sectors contributes greatly to the expectation of muted growth in 2018 (PERO,
2017).
The impact of the water crisis on the Western Cape economy is likely to be significant, both
directly on businesses and through their supply chains (Meyer, 2017). The Western Cape
agriculture including the rest of the value chain and agri-processing export sectors, as well
as construction and tourism - are at risk due to the severe water crisis (Provincial Economic
Review and Outlook, 2017). The Western Cape is currently experiencing the worst drought
in recorded history. Of significance to have noticed that the agricultural & agri-processing
sectors combined contribute more than 10% of Provincial GDP and employ an estimated
340,000 workers. The impact of the drought on the Western Cape economy resulted in loss
of revenue and jobs. To date, between 30 000 and 40 000 jobs have been lost in the
agricultural sector, however the value chain job losses have not been included in this figure.
The Western Cape agriculture sector recorded an estimated loss of R5.9 billion during
2017/18 as result of the drought and this translated into 30,000 job losses (Pienaar and
Boonzaaier, 2018). Drought Policy Brief Western Cape Agriculture, Western Cape Provincial
Government; Bureau for Food and Agricultural Policy).
The agriculture subsector recorded the fastest growth in employment of 4.9 per cent per year
between 2011 and 2016 followed by the construction subsector at 3.7 per cent. In the
Western Cape manufacturing employment declined from 248 006 in 2011 to 240 450 in 2016.
The oil rig repair industry was negatively affected by a decline in oil prices at the end of 2014.
Ship repair and ship fabrication activities have taken up the slack in demand in the rig repair
activity in 2015. Cape Town is currently the dominant ship repair location in South Africa.
Tourism in the Western Cape has shown resilience in recent years. The Western Cape
received the highest number of tourist bed nights and also had the highest average length of
stay of any province in South Africa in 2016. A provincial initiative to promote Western Cape
exports is the development of a halal‑relevant food and agri-business subsector targeting the
global halal food and product market.
The Western Cape is estimated to be the third most populous province in South Africa. Life
expectancy, fertility rates and migration have an impact on the Province’s demographic
profile. Net in-migration is estimated at over 290 000 people between 2011 and 2016. In
2015, 55.5 per cent of the South African population were considered poor of which 7.5 per
cent lived in this Province. The proportion of the Western Cape population below the upper
bound poverty line increased from 33.7 per cent by 2011 to 37.1 per cent in 2015. The upper
bound poverty line was R779 per person per month in 2011 and R992 per person per month
in 2015.
Over 2018 to 2022, the long-term outlook for the Western Cape is expected to average 2.2
per cent per annum. Beyond the next two years, the Western Cape economy is likely to see
a return to the growth trend of the past few years (PERO, 2018).
6.4 District Economic Outlook
6.4.1 Overview
OVERBERG REGIONAL ECONOMIC DEVELOPMENT AND TOURISM STRATEGY (2018-2028) Pg 16The Overberg District Municipality is classified as a Category C municipality and is one of the
five district municipalities in the Western Cape Province. It is the smallest district in the
province making up about 9% of its geographical area. The District is comprised of the
following four category B local municipalities; Theewaterskloof, Swellendam, Cape Agulhas
and Overstrand. The Overberg is home to approximately 301 983 people with an
unemployment rate of 12, 2%. In 2016, the economy of the region grew by 0, 56% to R13,
32 billion (WESGRO, 2018).
In 2016 the Overberg District contributed R18.4 billion to the economy of the Western Cape.
The Theewaterskloof and Overstrand municipal areas are the primary contributors to the
District economy, collectively contributing 72.2% towards the Overberg District GDPR in 2016
(MERO, 2018).
The table 2 below gives the key socio-economic profile of the Overberg
OVERBERG KEY INDICATORS
Executive Mayor Andries Franken
Population (2017) 301 983
GDP (2016) ZAR R13,32 billion
GDP Growth (2016) 0,56%
Unemployment rate (2016) 12,16%
Black (24, 09%), Coloured (56, 33%), Indian &
Ethnic groups
Asian (0, 04%), White (19, 54%)
Afrikaans (70, 3%), Xhosa (17, 9%), English (6,
Languages
8%), Sotho (2, 1%)
Literacy rate 81,1%
Gini Coefficient 0.60
Human Development Index (HDI) 0.70
Table 2 Socio-Economic profile: Overberg District, 2018 (Quantec, 2018)
The economy of both the District and the Province have struggled to grow at rates
experienced prior to the global financial crisis, with economic growth declining sharply
between 2014 and 2016. However, it is estimated that economic growth was boosted in 2017
with a growth rate of 2 per cent. Even though the growth rate improved, it is still lower than
the long-term average growth rate (3.2 per cent). In 2017, economic growth improved in all
the local municipal areas with the Theewaterskloof and Swellendam municipal areas
recording the fastest growth rates in the OBD, with an estimated growth rate of 2.5 per cent
in both municipal areas. Table 3 below indicates the average GDPR contribution and growth
rates in the various municipal areas in the OBD.
Contribution
to GDPR (%)
Trend Real GDPR growth (%)
value 2016
R million
Municipality
2006 -
2013 -
2017e
2017e
2016
2016
2012
2013
2014
2015
2016
Theewaterskloof 7 537 40.9 3.6 2.5 3.7 3.8 4.4 1.6 0.3 2.5
Overstrand 5 755 31.2 2.5 1.8 2.5 2.6 2.5 1.4 0.9 1.4
Cape Agulhas 2 752 14.9 2.9 1.9 2.9 2.8 2.8 1.6 0.8 1.3
OVERBERG REGIONAL ECONOMIC DEVELOPMENT AND TOURISM STRATEGY (2018-2028) Pg 17Swellendam 2 374 12.9 4.0 2.9 4.1 4.2 4.4 2.3 1.4 2.5
Total Overberg
18 418 100 3.2 2.2 3.3 3.3 3.5 1.6 0.7 2.0
District
Western Cape
529 928 - 2.6 1.8 2.9 2.6 2.4 1.5 1.2 1.0
Province
Table 3: Overberg District GDPR contribution and average growth rates per municipal area,
2012 - 2017 Source: Quantec Research, 2018 (e denotes estimate)
6.4.2 GDPR contribution per sector (2016)
The sectors that contributed the most to the OBD economy in 2016 include:
• Finance, insurance, real estate and business services sector (20.1 per cent);
• Wholesale and retail trade, catering and accommodation sector (19.1 per cent); and
• Manufacturing sector (13.5 per cent).
The improved estimated economic growth rate of 2 per cent in the OBD was mainly as a
result of the strong growth in the agriculture, forestry and fishing sector (5.8 per cent), the
transport, storage and communication sector (3 per cent) and the finance, insurance, real
estate and business services sector (2.7 per cent).
Not all sectors in the OBD performed equally well in 2017. Despite the stronger growth in the
transport, storage and communication sector and the finance, insurance, real estate and
business services sector, growth in the tertiary sectors declined (to an average of 1.6 per
cent). It is estimated that the wholesale and retail trade, catering and accommodation sector
had a growth rate of 0.3 per cent, while the general government sector contracted by 0.4 per
cent. Another sector that is estimated to have contracted in 2017 is the construction sector
(0.1 per cent).
Activities in the Overberg region have a strong reliance on agriculture, aquaculture, mainly
abalone farming, light industrial/manufacturing such as agro-processing, tourism (which
leads to vibrant construction, financial and business services, retail, catering and
accommodation sectors), property development including the retirement market, government
services and social grants also contribute. New and emerging industries include agro-
forestry, value adding horticulture, jewellery manufacturing as well as plastics and packaging.
The Overberg district municipality is proactively identifying current and future economic
opportunities that can supplement its rich agricultural, resource, and tourism based economy.
Tourism has been one of the effective means of macro-economic diversification from the
traditional over-reliance on agriculture in many economies. The expansion of agriculture-
tourism or “agri-tourism” linkages connotes the importance of local agricultural produce (food
crops, livestock and fish products that are processed and consumed) which boosts economic
growth (WESGRO, 2018).
Table 4 below gives the Overberg District GDPR contribution per sector (2016). Overall, the
municipal areas’ sectoral contributions to their respective economies are similar, except for
the agriculture, forestry and fishing sector which accounts for 15.5 per cent of
Theewaterskloof. This is proportionally higher than the other municipal areas.
OVERBERG REGIONAL ECONOMIC DEVELOPMENT AND TOURISM STRATEGY (2018-2028) Pg 18Sector Overberg Theewaterskloof Overstrand Cape Swellendam
District Agulhas
Primary Sector 10.9 15.6 6.7 7.1 11.0
Agriculture,
forestry and 10.8 15.5 6.5 7.0 11.0
fishing
Mining and
0.1 0.1 0.2 0.2 0.1
quarrying
Secondary
23.4 24.5 24.2 23.1 18.3
Sector
Manufacturing 13.5 13.6 14.7 14.0 9.6
Electricity, gas
2.5 3.0 2.1 2.4 2.3
and water
Construction 7.4 7.9 7.4 6.7 6.4
Tertiary Sector 65.6 59.9 69.1 69.8 70.7
Wholesale and
retail trade,
19.1 17.7 19.2 22.1 19.7
catering and
accommodation
Transport,
storage and 10.8 10.9 10.9 10.9 9.9
communication
Finance,
insurance, real
estate and 20.1 16.3 24.3 19.9 22.4
business
services
General
9.0 8.5 8.4 10.2 10.7
government
Community,
social and
6.6 6.6 6.2 6.6 8.0
personal
services
Total 100 100 100 100 100
Table 4 Overberg District GDPR contribution per sector, 2016 (%) (MERO, 2018)
Overall, the municipal areas’ sectoral contributions to their respective economies are similar,
except for the agriculture, forestry and fishing sector which accounts for 15.5 per cent of
Theewaterskloof. This is proportionally higher than the other municipal areas.
6.4.3 Employment
The sectors that contributed the most to employment in the OBD in 2016 include:
• Agriculture, forestry and fishing (22.7 per cent);
• Wholesale and retail trade, catering and accommodation (21.6 per cent); and
• Finance, insurance, real estate and business services (15.4 per cent).
Employment statistics reflect the importance of various sectors on their respective municipal
areas. The wholesale and retail trade, catering and accommodation sector contributes
significantly more to the coastal municipalities (the Overstrand and Cape Agulhas municipal
areas) as tourism plays an important role in these economies, especially over peak holiday
times. This essentially provides an indication of the key economic levers of the district are
OVERBERG REGIONAL ECONOMIC DEVELOPMENT AND TOURISM STRATEGY (2018-2028) Pg 19where attention should be geared towards and value chains be maximised. Table 5 indicates
the sectoral contribution to employment in the municipal areas of the OBD.
Sector Overberg Theewaterskloof Overstrand Cape Swellendam
District Agulhas
Primary Sector 22.7 30.9 12.6 14.3 22.5
• Agriculture, forestry
22.7 30.9 12.6 14.2 22.5
and fishing
• Mining and
0.0 0.0 0.0 0.0 0.0
quarrying
Secondary Sector 14.7 13.9 17.1 16.5 10.7
• Manufacturing 7.6 7.0 9.2 9.3 5.1
• Electricity, gas and
0.3 0.3 0.3 0.3 0.3
water
• Construction 6.7 6.5 7.6 6.9 5.3
Tertiary Sector 62.6 55.2 70.3 69.2 66.8
• Wholesale and
retail trade,
21.6 18.3 25.7 26.1 20.9
catering and
accommodation
• Transport, storage
and 3.8 3.4 4.3 4.6 3.4
communication
• Finance, insurance,
real estate and 15.4 13.6 17.2 15.9 17.3
business services
• General government 8.2 7.2 8.4 10.0 9.7
• Community, social
and personal 13.6 12.7 14.7 12.6 15.5
services
Total 100 100 100 100 100
Table 5 Sectoral employment contribution per municipal area, 2016 by % (MERO, 2018)
The Theewaterskloof municipal area contributes the most to employment in the sectors of
the OBD, followed by the Overstrand municipal area. The distribution of workers by locality
is in line with the economic output of each municipal area. Due to these economies
contributing the most to the economic sectors of the OBD in terms of employment, they tend
to attract people from rural areas that are looking for work. The migration of people will
increase the demand for basic services and infrastructure, especially housing.
6.4.4 Unemployment
Unemployment in the OBD (11.8 per cent) has remained lower than the provincial
unemployment rate (18.2 per cent) over the past five years. In the District, Overstrand has
experienced the highest unemployment rate over the past five years, while Swellendam has
experienced the lowest unemployment rate. While there is an increase in employment
opportunities in the District, the unemployment rate is indicative of an increase in job seekers
relative to the rate of job creation. Below in Table 6 is a further breakdown on unemployment
per municipality.
OVERBERG REGIONAL ECONOMIC DEVELOPMENT AND TOURISM STRATEGY (2018-2028) Pg 20Municipality 2012 2013 2014 2015 2016 2017e
Theewaterskloof 9.1 8.8 9.4 8.5 9.7 10.3
Overstrand 13.2 13.2 14.0 13.7 15.6 16.6
Cape Agulhas 8.4 8.2 8.7 8.2 9.1 9.7
Swellendam 7.4 7.1 7.5 6.8 7.6 7.9
Overberg District 10.0 9.8 10.5 9.8 11.1 11.8
Western Cape
15.8 15.7 16.1 16.2 17.4 18.2
Province
Table 6: Overberg District unemployment rate, 2012 - 2017 (%) (MERO, 2018)
6.4.5 SMMEs
SMMEs that play a vital role in the local economy sometimes require additional support in
order to become sustainable and make a continuous contribution to the economy and
employment creation. SEDA plays a vital role in providing support for SMMEs in the OBD.
Table 7 outlines the number of SMMEs that are registered on the municipal databases based
on the Provincial Treasury Municipal survey responses received.
Municipality Number
Overstrand 702
Cape Agulhas 1 073 (of which 329 are local)
Swellendam 720
Table 7 SMMEs registered on municipal databases, 2018 (Provincial Treasury Municipal
survey responses, 2018)
The municipalities of the OBD have a large number of SMMEs registered on their databases,
particularly the Cape Agulhas Municipality (1 073 SMMEs), however, only 329 are local. This
indicates that SMMEs are operating beyond municipal borders in the OBD in order to be
successful. Figure 2 indicates the activities of the SMMEs that are supported by SEDA in the
OBD.
ICT Tourism
Finance, Insurance, 1.0% Agriculture and
Retail 0.4%
Forestry
0.4% 13.0%
Construction
4.1%
Manufacturing
2.0%
Transport
2.0%
Retail and Wholesale
8.3%
Services Sector
68.9%
Figure 5: SMMEs supported by SEDA - business categories, 2018 (SEDA, 2018)
OVERBERG REGIONAL ECONOMIC DEVELOPMENT AND TOURISM STRATEGY (2018-2028) Pg 21You can also read