Strategic Energy Road Map of Niue - PRDR Sustainable Energy for All
←
→
Page content transcription
If your browser does not render page correctly, please read the page content below
Strategic Energy Road Map of Niue
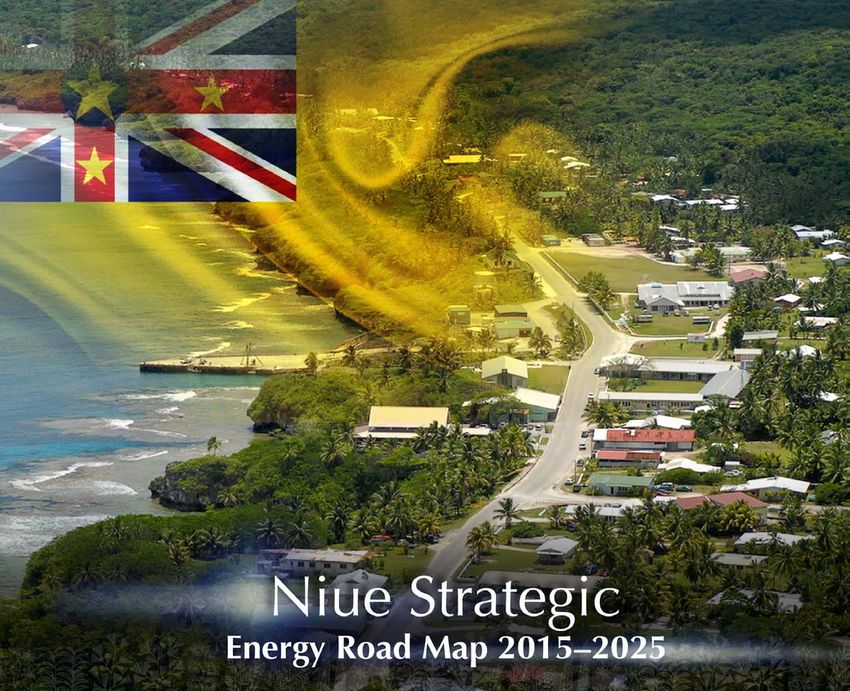
Niue Strategic Energy Road Map 2015–2025

           Government of Niue

        Secretariat of the Pacific Community
                       Suva, Fiji
                         2015
© Copyright Government of Niue 2015
All rights for commercial/for profit reproduction or translation, in any form, reserved.

                                    Original text: English

          Secretariat of the Pacific Community cataloguing-in-publication data

Niue Strategic Energy Road Map 2015–2025 / Government of Niue

    1. Energy – Management – Niue.
    2. Renewable energy sources – Niue.
    3. Power resources — Niue.
    4. Energy — Government policy — Niue.
    5. Energy policy — Niue.

I. Title II. Niue III. Secretariat of the Pacific Community

333.79099626								                                                     AACR2

ISBN: 978-982-00-0939-4

Prepared for publication at SPC’s Suva Regional Office, Private Mail Bag, Suva, Fiji, 2015

                         Printed by Quality Print, at Suva, Fiji, 2015
Contents
Abbreviations.......................................................................................................... vii
Foreword................................................................................................................. 1
Niue’s Strategic Energy Road Map........................................................................... 3
1 Introduction.......................................................................... 6
1.1 Purpose and drivers of the NiSERM.......................................................... 6
1.1.1 National..................................................................................................... 6
1.1.2 Regional and global................................................................................... 6
1.1.3 Energy access and links to development.................................................. 6
1.2 How the NiSERM was developed.............................................................. 7
2 Niue’s energy balance........................................................... 8
3 Electricity sub-sector............................................................. 13
3.1 Generation and supply.............................................................................. 13
3.2 Peak demand............................................................................................ 14
3.3 Grid improvement and energy storage..................................................... 15
3.4 Renewable energy potential..................................................................... 16
3.4.1 Solar energy potential............................................................................... 16
3.4.2 Wind energy potential.............................................................................. 16
3.4.3 Other renewable energy technologies...................................................... 17
3.5 Energy efficiency and conservation potential........................................... 17
3.5.1 Electricity supply losses............................................................................. 17
3.5.2 Residential, commercial and government................................................. 18
3.5.3 The commercial sector.............................................................................. 19
3.5.4 The government sector............................................................................. 19
3.5.5 The tourism sector.................................................................................... 19
3.5.6 Appliance labelling and standards............................................................ 20
3.5.7 LPG rehabilitation...................................................................................... 20
3.6 Electricity sub-sector targets..................................................................... 20
4 Transport sub-sector.............................................................. 23
4.1 Transport energy use................................................................................ 23
4.2 Land transport........................................................................................... 23
4.3 Transport sub-sector targets..................................................................... 23
5 Petroleum sub-sector............................................................. 26
5.1 Fuel supply and demand........................................................................... 26
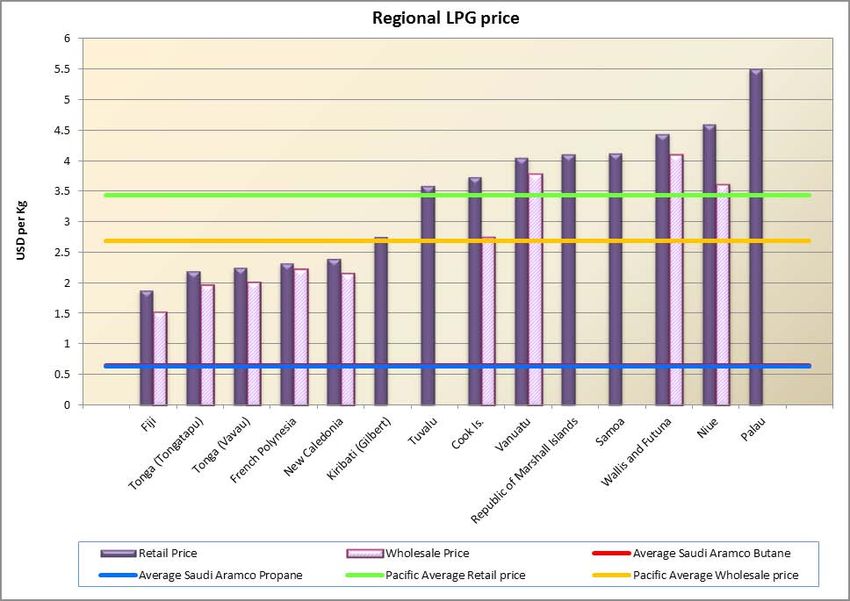
5.2 Fuel pricing................................................................................................ 28
5.3 Petroleum sub-sector targets.................................................................... 29
4.4 Achieving government leadership and commitment................................ 29
6 Policies to sustainable energy opportunities in Niue............. 31
6.1 Concrete policies and measures............................................................... 31
6.1.1 Encouraging and improving energy efficiency.......................................... 31
6.1.2 Incentivising renewable energy deployment............................................ 32
6.1.3 Training and capacity building................................................................... 32
6.1.4 Data collection and analysis...................................................................... 33
NIUE STRATEGIC ENERGY ROA D MAP v
7           NiSERM financing plan.......................................................... 35
                    7.1         Financial savings analysis.......................................................................... 35
                    7.2         Financing the road map............................................................................ 39
                                NiSERM implementation framework........................................................ 41
                    7.2         Roles and responsibilities.......................................................................... 41

                    8           NiSERM monitoring and evaluation plan............................... 43
                    8.1         Monitoring................................................................................................ 43
                    8.2         Evaluation.................................................................................................. 43

                    10.         Annexes................................................................................. 45
                    Annex 1: People and organisations consulted......................................................... 45
                    Annex 2: References................................................................................................ 45
                    Annex 3: Niue Energy Balance................................................................................. 47
                    Annex 4: NiSERM Monitoring Plan.......................................................................... 48

                    List of tables
                    Table 1: Niue’s socio-economic indicators............................................................... 7
                    Table 2: Total installed diesel capacity and solar PV capacity.................................. 14
                    Table 3: Total generation diesel and solar 2009–2014............................................ 14
                    Table 4: Wind energy status in some selected Pacific Island countries...................16
                    Table 5: Energy savings through lighting strategy................................................... 19
                    Table 6: Energy savings through AC retrofit............................................................ 19
                    Table 7: Total consumption (TJ) of LPG per sector 2010–2014................................ 20
                    Table 8: Electricity sub-sector goals and targets..................................................... 21
                    Table 9: Land transport target................................................................................. 24
                    Table 10: Pacific region fuel quality......................................................................... 27
                    Table 11: Petroleum sub-sector targets................................................................... 29
                    Table 12: Potential savings breakdown................................................................... 38
                    Table 13: NiSERM estimated investment................................................................. 39

                    List of figures
                    Figure 1: Percentage of primary energy supply in 2014.......................................... 10
                    Figure 2: Total primary energy supply 2009 to 2014............................................... 10
                    Figure 3: 2014 Production and import.................................................................... 11
                    Figure 4: 2014 Total final energy consumption....................................................... 11
                    Figure 5: Total electricity generation and peak demand, June 2013.......................13
                    Figure 6: Annual peak demand actual and projections from 2010–2030...............15
                    Figure 7: Electricity consumption trend 2009 to 2014............................................ 18
                    Figure 8: Fuel use for transport sector 2009 to 2014.............................................. 23
                    Figure 9: Petroleum fuel and LPG sales projects 2015–2018.................................. 26
                    Figure 10: Regional prices of LPG (including tax and duty)..................................... 28
                    Figure 11: GoN energy grants (subsidies)................................................................ 36
                    Figure 12: Savings estimates................................................................................... 38
                    Figure 13: Road map implementation institutional framework.............................. 41

vi   NI U E S TR ATE G IC E NE R GY R OAD M A P
Abbreviations
ADO      automotive diesel oil                NPC      Niue Power Corporation
CBA      cost-benefit analysis                NZD      New Zealand dollars
                                                       New Zealand Ministry of Foreign Affairs
cc       cubic centimetres                    NZMFAT
                                                       and Trade
DOU      Department of Utilities              PALS     Pacific Appliance Labelling Standards
DOT      Department of Transport              PECF     Pacific Environment Community Fund
DPK      dual purpose kerosene                PICs     Pacific Island countries
DSM      demand side management               PICTs    Pacific Island countries and territories
EE       energy efficiency                    PIREP    Pacific Islands Renewable Energy Project
EDF      European Development Fund            PMCU     Project Monitoring and Coordination Unit
         Framework for Action on Energy
FAESP                                         PPA      Pacific Power Association
         Security in the Pacific
GDP      gross domestic product               PPM      parts per million
Gj       gigajoules                           PV       photovoltaic
GoN      Government of Niue                   RE       renewable energy
GVW      Gross vehicle weight                 REP      Renewable Energy Programme
HDI      human development index              RON      Research Octane Number
                                                       System average interruption duration
HSFO     high-sulfur fuel oil                 SAIDI
                                                       index
         International Union for                       (United Nations) Sustainable Energy for
IUCN                                          SE4ALL
         Conservation of Nature                        All initiative
         Japanese International Cooperation
JICA                                          SIDS     small island developing states
         Agency
kVAr     kilo volts ampere reactive           SPC      Secretariat of the Pacific Community
kW       kilowatt                             TJ       terajoule
kWh      kilowatt-hour                        UNDP     United Nations Development Programme
kWp      kilowatt-peak                        USP      University of the South Pacific
LPG      liquefied petroleum gas              USD      United States dollars
MOI      Ministry of Infrastructure
MP       Monitoring plan
MWh      megawatt hour
NBF      Niue Bulk Fuel
NiSERM   Niue Strategic Energy Road Map
NNSP     Niue National Strategic Plan

                                                       NIUE STRATEGIC ENERGY ROA D MAP            vii
Foreword
Foreword
    At the global level, the world leaders have adopted the
2030 Agenda for Sustainable Development which consists of
17 goals endorsed the post 2015 UN Sustainable Development
Goals and it is pleasing to see Goal 7 – Ensure access to
affordable, reliable, sustainable and modern energy for all.
Countries the world over need modern energy and Niue is
no exception.
     At the regional level, at the 46th Pacific Islands Forum leaders’
meeting in Papua New Guinea on the theme Strengthening
connections to enhance Pacific regionalism, we recognised that
our shared quest for greater energy security and accessibility
is vital to promote regional connectivity in three core areas:
people to people, institutional and physical connectivity. Energy
security enables cost-effective transportation in our region
to connect people by road, water and air. It enables modern
communication technologies to effectively connect people and
institutions and address the tyranny of distance and remoteness.
Equally, it will enable construction of infrastructure such as                  Honorable Dalton Tagelagi
bridges, roads, wharves and airports to physically connect our                   Minister of Infrastructure
villages, islands and communities to markets.
      This Niue Strategic Energy Road Map 2015–2025 is
government’s effort, at the national level, to work with its
national and regional partners and the global community to
unlock the development potential of Niue and to contribute
to addressing the challenges of climate change. This roadmap
represents a whole-of-government approach to addressing the
energy security challenges of Niue, an approach that looks
at the entirety of the energy sector – electricity, renewable
energy, energy efficiency and petroleum – and has all the
partners working together as one team in its implementation.
     Energy security for Niue encompasses everyone’s access to
modern, reliable and safe energy services. It includes energy
generation, distribution and consumption becoming more cost-
efficient and affordable, and the energy infrastructure in Niue
becoming climate-proof and based on a low carbon approach.
    I acknowledge the technical assistance and guidance provided
by the Secretariat of the Pacific Community in the development
of this road map, and the time, effort and commitment our
Niue national team gave to its completion.
    I commend this road map and its contents to your attention,
as we all work hand-in-hand towards a prosperous Niue.

Honorable Dalton Tagelagi
Minister of Infrastructure

                                                                  NIUE STRATEGIC ENERGY ROA D MAP             1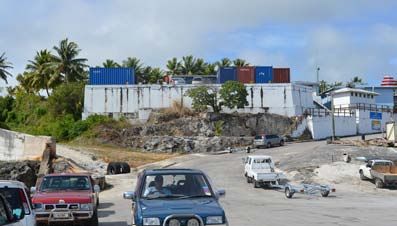
Energy Road Map summary

2   NI U E S TR ATE G IC E NE R GY R OAD M A P
Energy Road Map summary

Niue’s Strategic Energy Road Map
Overall vision
The Niue Strategic Energy Road Map 2015–2025 (NiSERM) builds on the 2005 Niue National
Energy Policy and the Niue National Strategic Plan (NNSP) 2014–2019, and is aligned to current
national, regional and international emerging issues relating to the energy sector.
Having joined other Forum Islands Pacific Leaders in endorsing the Framework for Action on
Energy Security in the Pacific (FAESP) in 2010 and the Majuro Declaration for Climate Leadership
in 2013, Niue is committed to achieving its energy goals and to be guided by four key elements
of energy security:
   →   access to modern energy services;
   →   affordability of energy;
   →   energy efficiency and productivity; and
   →   environmental sustainability.

The Government of Niue (GoN) decided to develop the NiSERM to guide the whole-of-country
approach towards achieving a vision shared by the government, public stakeholders, private operators,
communities and development partners, the vision of:
A sustainable and secure energy sector
Goals and targets
This NiSERM aligns itself with GoN objectives in improving energy security and low carbon
developments with a focus on three energy sector goals.

Goal 1: Significant renewable energy integration to the grid
Current description
   → Niue currently has excess diesel generating capacity: four diesel generator engines with a total
     installed capacity of 2084 kW. However, only two of these, with a capacity of 1026 kW (49%) are
     being regularly used, while the other 51% acts as reserve capacity.
   → In 2014, the total installed solar PV capacity in Niue reached 343 kWp, with 150 kWh battery
     storage for smoothing purposes of voltage and frequency into the grid. This is equivalent to 14%
     of the total installed capacity.
   → In 2014, the percentage of solar PV generation in total electricity generation was 1.99%, while
     98.01% was from diesel.
   → Though Niue has 343 kWp of solar PV installed capacity, currently only around 80 kWp of solar PV
     is connected to the grid, due to grid instability considerations. The remaining 263 kWp of solar
     PV capacity is currently offline.

Target
   → 80% renewable energy generation by 2025

                                                               NIUE STRATEGIC ENERGY ROA D MAP          3
Energy Road Map summary
Goal 2: Improve energy efficiency in the electricity and transport sub-sectors
Current description
→ In 2014, around 1.27 million litres of diesel was imported into Niue, of which 75% was used for
power generation. The remainder was mostly used for transportation.
→ In 2014, around 1785 motor vehicles were registered: 31% cars, 24% vans, 23% light trucks and
21% motor vehicles and scooters.
→ Electricity generation from fossil fuel use is highly subsidised; in 2014, government provided a
subsidy of NZD 0.63 per kWh.
→ In 2014, billed electricity was recorded for three sectors: commercial (43%), residential (37%)
and government (20%) respectively. In addition to this, Niue has unbilled consumption for street
lighting and water pumping.
→ The efficiency of fuel use for power generation has shown a decrease from 4.29 kWh/litre in
2009 to 3.77 kWh/litre in 2014.
→ Energy consumption in the transport sector has steadily risen by 4% annual growth during the
period 2011 to 2014.
Targets
→ Niue Power Corporation (NPC) station losses maintained at an acceptable level of 4% by 2020
(5.19% in 2011)
→ Power generation efficiency maintained above 4 kWh/litre in 2017
→ 10% electricity savings on residential, commercial and government by 2020
→ 1% of fuel-efficient vehicles by 2020
→ 90% of households use LPG for cooking
Goal 3: Reliable energy supply
Current description
→ While data are not available for Niue, the average forced outage rate for power utility members
of the Pacific Power Association (PPA) was 5.4%, as reported in the PPA/Pacific Region
Infrastructure Facility power benchmarking study of 2012. In 2011, this was 8.3%. For the system
average interruption duration index (SAIDI), the average was 5,664 minutes in 2012 compared to
794 in 2011.
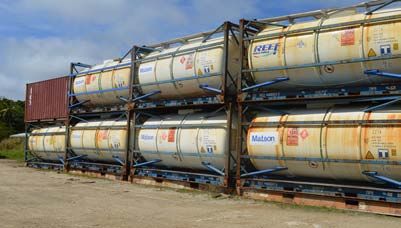
→ 100 % of fuel imported into Niue in 2014 came in rented tank-tainers.
→ Fuel supply security days in 2014 was 28 days, based on monthly shipping schedules.
Targets
→ Increase fuel supply security days to 60 days (baseline is 28 days in 2014).
→ Keep the average forced outage to below the regional average of 5.4%.
→ Keep the SAIDI to be less than the regional average goal of 200 minutes per customer.
4 NI U E S TR ATE G IC E NE R GY R OAD M A PIntroduction
Introduction

    Introduction
    1.1     Purpose and drivers of the NiSERM

    1.1.1 National
    The Niue National Strategic Plan (NNSP) recognises that a reliable, affordable, secure and sustainable
    energy supply is key to achieving prosperity for all Niueans. The purpose of the NiSERM is to
    create a realistic planning document to provide a systematic guide and an enabling tool for both
    the government and practitioners to achieve a reliable, affordable and sustainable energy supply
    and to complement the NNSP strategic goals, as well as those now brought on by this NiSERM.
    A key driver in the development of this NiSERM is Niue’s own aspiration to pursue energy security
    and low carbon development through sourcing 80% of its electricity needs from renewable energy
    sources by 2025.
    Additional motivations include:
        →   reduced dependence on fossil fuels;
        →   improved energy efficiency;
        →   more sustainable, cleaner energy;
        →   improved cost-effectiveness of energy services; and
        →   attraction of funding for energy sector development.
    There is a need to support the implementation of the NiSERM, in particular the effective delivery
    of electricity services, maintenance, operations and tariff collections. A regulatory framework
    with a matching institutional structure is equally important as part of the implementation of
    the NiSERM.

    1.1.2 Regional and global
    FAESP 2010–2020 has an Implementation Plan 2010–2015, which is currently being reviewed
    with the intention that such review will provide a regional road map for 2015–2020. Therefore,
    the NiSERM, and other national energy road maps (e.g Kiribati, Nauru, Tonga and Vanuatu) have
    been drafted in a manner to ensure they are consistent and concurrent with each other. The goals
    of the NiSERM promote low carbon development and are to be supported by the small island
    developing states (SIDS) sustainable energy mechanism, SIDS DOCK 1 and various platforms and
    partnerships established under the Sustainable Energy for All (SE4All) initiative.
    The General Assembly of the United Nations has designated the years 2014–2024 the Decade of
    Sustainable Energy for All (SE4ALL). This initiative aims to mobilise urgent global action to three
    complementary objectives, to be achieved by 2030:
        →   ensure universal access to modern energy services;
        →   double the rate of improvement in energy efficiency; and
        →   double the share of renewable energy in the global energy mix.

    1       Niue was amongst the first countries to sign the SIDS DOCK treaty at the Third SIDS Conference at Samoa in September 2014. SIDS
            DOCK is a SIDS–SIDS institutional mechanism established to facilitate the development a sustainable energy economy within the
            small island developing states. The ultimate goal of SIDS DOCK is to increase energy efficiency by 25 per cent (2005 baseline) and to
            generate a minimum of 50 percent of electric power from able sources and a 20–30 per cent decrease in conventional transportation
            fuel use by 2033.

6   NI U E S TR ATE G IC E NE R GY R OAD M A P
Introduction
The Decade of SE4ALL presents an opportunity to raise awareness about the importance of
increasing access to sustainable energy, energy efficiency and renewable energy at the local,
national, regional and international levels. The recognition is attributed to the proven reality that
energy and energy services have profound positive effects on productivity, health, education,
climate change mitigation, food and water security, and communications services.
1.1.3 Energy access and links to development
Empirical evidence has proven that there is significant relationship between access to modern
energy and human development. Access to modern energy has improved the human development
index (HDI) measure of progress on the basic dimensions of human development – a long healthy
life, access to education and knowledge, and a decent standard of living. While not included in
the HDI measure of progress, Niue has a very good social development performance and has
met and or surpassed most of the Millennium Development Goals. Niue has 100% electricity
penetration rate. Internet connectivity is good and available to most citizens. Niue is active in
regional and international efforts to promote natural resources conservation and environmental
sustainability, and to reduce the impacts of climate changes on small island developing states.
New Zealand is Niue’s primary development partner and contributes significant financial and
technical support to Niue. During 2014/2015 New Zealand aid amounted to NZD 19.6 million,
including budget support of NZD 7.2 million (New Zealand Ministry of Foreign Affairs and
Trade 2015). Economic activity is improving and revolves around government services, which
are subsidised by New Zealand aid flows. Subsistence agriculture is very important for most
households in Niue. There is reduced dependence on remittances due to net-emigration to New
Zealand. Like other Pacific Island countries and territories (PICTs), Niue has few exports and is
dependent on imported commodities, resulting in a negative trade balance. Petroleum imports
for energy generation and the transport sector account for about 15.3% of the gross domestic
product (GDP) (Secretariat of the Pacific Community 2011).
Niue’s key socio-economic indicators are presented in Table 1 below;
Table 1: Niue’s socio-economic indicators
Indicator 2013
Population 1,500
GDP (Real) NZD 24,469,000 (2012)
Total imports NZD 15,095,733
Total exports NZD 251,969 (2009)
Mineral imports NZD 1,634,638
Population growth -1% (2011)
Unemployment rate 2.7% (2011)
Trade-GDP ratio 0.6 (2011)
Electrification level 99% (2011)
Access to modern energy 99.6% (2011)
Fuel imports as a % of GDP 15.3% (2011)
NIUE STRATEGIC ENERGY ROA D MAP 7Introduction
1.2 How the NiSERM was developed
The NiSERM is essentially an initiative of the GoN to streamline allocation of its limited resources
to effectively manage its energy sector development. The Ministry of Infrastructure (MOI)
identified energy sector targets that were themselves derived from consultative processes with
various public and private stakeholders, including situational and research outcomes analyses.
The NiSERM is deemed the best strategic approach to achieving these targets:
In developing this NiSERM, the government went through a consultative process involving
stakeholders from the public and private sector and civil society groups. The MOI conducted
face-to-face consultations with the NiSERM stakeholders and a series of workshops, one held
in November 2014 and second in July 2015. A list of people and organisations consulted on the
development of the NiSERM is provided in Annex 1.
Other reference documents used in putting together the NiSERM are provided in the reference
section attached as Annex 2.
Guiding principles
The NiSERM is guided by the principles of Niue: ke Moniuna – a prosperous Niue which is contained
in the NNSP.
8 NI U E S TR ATE G IC E NE R GY R OAD M A PNiue energy balance
Niue energy balance

     Niue’s energy balance
     The Niue energy sector is highly dependent on imported primary energy supply. Figure 1 shows
     that 99% of Niue energy supply is imported, compared to 1% of indigenous primary energy
     production.

                                  Niue 2014: total primary energy supply - 81.4 TJ

                                                            Production
                                                               1%

                                                              Imports
                                                                99%

     Figure 1: Percentage of primary energy supply in 2014
     Source: SPC 2015

     The indigenous primary energy production is limited to solar energy and biomass, while imported
     primary energy supply is automotive diesel oil (ADO), petrol, dual purpose kerosene (DPK) and
     LPG. Figure 2 shows the total primary energy supply from 2009 to 2014.

                                                    Niue 2009-2014: total primary energy supply
                              120.00
       Energy supplied (TJ)

                              100.00
                               80.00
                               60.00
                               40.00
                               20.00
                                0.00
                                    2009             2010              2011            2012            2013             2014

                                       Solar PV   Solar Hot Water Systems     Biomas   ADO    Petrol   Kerosene   LPG

     Figure 2: Total primary energy supply 2009 to 2014
     Source: SPC 2015

10   NI U E S TR ATE G IC E NE R GY R OAD M A P
Niue energy balance
In terms of imports in 2014 as illustrated in Figure 3, ADO accounted for 48%, petrol for 29%,
kerosene for 21% and LPG for the remaining 2%. For energy produced in Niue, biomass currently
meets 68% of the total energy produced with solar PV at 30% and solar water heater systems
accounting for 2%.
Niue 2014: total energy produced - 788 GJ Niue 2014: total energy imported - 102,683 GJ
LPG
Solar PV Kerosene 2%
30% 21%
ADO
48%
Biomas
68%
Solar Hot Petrol
Water 29%
Systems
2%
Figure 3: 2014 Production and import Figure 3: 2014 Production and import
Source: SPC 2015 Source: SPC 2015
In terms of total final energy consumption (Figure 4), in which power generation is not included
as an end use sector, the highest consumption is in the transport sector with 71%, followed
by residential uses (11%), commercial sector (10%), industry and government sector (7%) and
agriculture, fisheries and fishing sector (1%). The energy balance attached as Annex 3 to this
Road Map shows an increase of 4% annual growth rate in the transport sector since 2011 to 2014.
Niue 2014: total final energy consumption -
54.98TJ
Agriculture, Industry &
Forestry & Government
Fishing 7%
1%
Commercial
10%
Residential,
communithy Transport
& social 71%
services
11%
Figure 4: 2014 Total final energy consumption
Source: SPC 2015
NIUE STRATEGIC ENERGY ROA D MAP 11Electricity sub-sector
Electricity sub-sector

Electricity sub-sector
3.1    Generation and supply
The total installed diesel generator set (gen-set) capacity is around 2,032 kW, consisting of four
508kW Caterpillar C18 gen-sets. At any point in generation, the production layout usually involves
one diesel gen-set, one is placed on standby to meet peak demand loads (peak diesel), one is
placed on back-up and the fourth one is under routine servicing and maintenance. The generators
are controlled by Woodward 3000 controllers linked by a supervisory control and data acquisition
system that controls the generator dispatch based on the island load.
A typical daily electricity generation load is shown in Figure 5. One diesel prime generator
operates in the early morning from 1:00 a.m. to 5:00 a.m. when the load is at the lowest peak.
The second gen-sets (diesel peak) kicks in at 6:00 a.m. and continues to run to meet the daily
demand until 12:00 a.m. when the loads again recede. The peak load gradually increases from
5:00 p.m. and reaches highest peak at between 8:00 p.m. and 9:00 p.m.

Figure 5: Total electricity generation and peak demand, June 2013.

There are 1,510 electric meters around the country but they are old and customers claim that
they are faulty and give wrong readings. Replacing these meters to prepayment meters is another
priority activity for the government and NPC.
Niue is 99% dependent on fossil fuel for its power generation. Since the installation of the 51.7
kWp solar PV systems from the 9 th European Development Fund (EDF) in 2009, the dependence
on diesel was reduced by 2.13%. Additional solar PV installations were done in 2014, which has
increased the total installed grid-connected PV systems capacity to around 343.1 kWp. 2
However, due to grid instability issues in November 2014, the energy generated from the
additional installed solar PV has not been utilised into the electricity grid. It is the assumption
that both the EDF10 and the Pacific Environment Community Fund (PECF) solar generation will
be integrated into the grid in 2016 and 2017, when the grid stability issues are resolved. It is
projected that around 5% of the total generation will be from solar PV installed from the EDF10
project and the percentage share of renewable energy will increase to 12.42% when the PECF
project comes on line.
2      51.7 kWp from EDF9, 89 kWp from the EDF10 Project and 202.4 kWp from PECF project. The PECF project only allows 110 kW of
       installed capacity to be generated to the grid as the 92.4 is used for charging the battery.

                                                                               NIUE STRATEGIC ENERGY ROA D MAP                     13
Electricity sub-sector
Table 2 provides the total diesel and solar PV grid-connected system installed capacities and the
peak demand from 2009 to 2014.
Table 2: Total installed diesel capacity and solar PV capacity
Total diesel installed Total solar installed Peak demand
Year
capacity (kW) capacity (kW) (kW)
2009 2032 0 512
2010 20841 51.7 559
2011 2084 51.7 551
2012 2084 51.7 590
2013 2084 51.7 590 (estimate)
2014 2084 343.1 590 (estimate)
Source: Niue Power Corporation 2015
The electricity generation statistics for diesel and solar PV, including the percentage of renewable energy
share, are provided in Table 3.
Table 3: Total generation diesel and solar 2009–2014
Total
Diesel Solar PV Fuel used / kWh /
Year generation / % RE share
generation/kWh generation/kWh litres litre
kWh
2009 2876885 0 2876885 669885 4.29 0.00%
2010 3081197 66828 3148025 755986 4.08 2.13%
2011 3201148 68717 3269865 842003 3.80 2.18%
2012 3264508 64470 3328978 790685 4.13 1.97%
2013 3285240 66672 (estimate) 3351912 825541 3.98 2.00%
2014 3160219 66672 (estimate) 3226891 839038 3.77 1.99%
Source: Niue Power Corporation 2015
3.2 Peak demand
The projected peak demand for Niue will also increase in the next ten years, as shown in Figure
6. The peak demand is captured as capacity requirement. Capacity requirement captures the
peak demand on business as usual and the reserved demand. The reserved demand is all the
expected load from the growth in tourism, returning residents, construction of planned buildings
by government, the use of electric vehicles, and improved infrastructure, such as schools and
accommodation for tourists.
3 One diesel gen-set was replaced, increasing the diesel installed capacity.
14 NI U E S TR ATE G IC E NE R GY R OAD M A PElectricity sub-sector
Niue 2009-2030: peak demand trend
1,200.00
1,000.00
800.00
kW
600.00
400.00
200.00
-
Figure 6: Annual peak demand actual and projections from 2010–2030
3.3 Grid improvement and energy storage
In mid-2012, the GoN through funding support from the Pacific Islands Greenhouse Gas Abatement
through Renewable Energy Project (PIGGAREP) engaged DNV KEMA, a global energy consultancy
company, to investigate technical issues around the stability of the existing power system and
the effect of the planned solar PV systems on stability. The Dynamic Power Study report stressed
that the grid stability issue has been going on a long time, with the use of only one diesel gen-
set and the starting of two big electricity users: the quarry crusher motor (50 kW) and the wharf
winch motor (11 kW).The crusher motor, in particular, seriously affected the Niue power system
stability as it caused a severe drop in system voltage and frequency, which in turn caused the
existing solar plants to trip off-line, both at the high school and hospital. Running two diesel units
helps, but the frequency dip may be severe enough to risk losing the solar generation.
Other causes of instability mentioned in the study report are the fluctuations in solar generator
output and voltage that can have a significant impact on electric system operations and stability,
especially as solar generator penetration increases.
The study report made four recommendations.
→ Diesel generation must provide the frequency and voltage reference for any future PV
installations.
→ As the inverters used with solar generation are susceptible to low-voltage drop-out during certain
extreme events, the voltage ride-through for the inverters should be reduced to low voltage set
point for the 0.20–2.0 period from 0.65 to 0.50 pu. All existing and future inverters should use
these settings.
→ Shunt reactance of 130 kVAr (inductive) should be fitted to counteract the capacitive effect of the
cable network. Installation of three 65 kVar reactors was recommended.
→ All the prospective (future) cases showed that one diesel gen-set should handle normal
renewable output variations.
The power sector in Niue urgently requires technical assistance to support implementation of
the recommendations from the KEMA study. This will solve the grid instability issues and allow
Niue to integrate more renewable energy generation. The New Zealand Ministry of Foreign Affairs
and Trade (MFAT) is providing financial support for a qualified technical advisor to work closely
with the Utilities Department and the NPC to fast-track the recommendations from the study
NIUE STRATEGIC ENERGY ROA D MAP 15Electricity sub-sector
and provide technical skills as required.
3.4 Renewable energy potential
Niue has the potential to exploit some renewable energy sources such as solar, wind, wave
energy, ocean thermal energy conversion, biomass and biogas. There is no significant tidal,
geothermal or hydro energy resources. The only significant renewable energy sources currently
used in Niue are solar PV and to some extend wood (biomass) for traditional cooking, and solar
thermal energy for water heating.
3.4.1 Solar energy potential
The 2004 PIREP 3 study reported an average of 4.52 kWh/m 2/day for Niue. The University of the
South Pacific (USP)/Korea International Cooperation Agency project set up two masts for wind and
solar data monitoring but the data had not been analysed before the write-up of this road map.
Solar energy is the best option to meeting the renewable energy target, but work on stabilising
the national grid is required to allow maximum penetration of solar energy. In addition, due to
the intermittent characteristics of solar energy, energy storage is required to save energy that
can be used at night time. The total installed solar PV capacity of 343.1 kW could contribute
around 5% of solar generation to the electricity generation, assuming the grid instability issue
is resolved and battery storage is available.
3.4.2 Wind energy potential
Wind energy has been proposed in the past, but it did not result in any installation on the ground.
Niue’s modest power requirements could be met by three or four turbines to supplement diesel
generation. No significant negative impacts on the environment or social problems seem likely
from the use of wind power. However, any turbines installed must be designed to survive cyclones
and must be carefully integrated into the grid to avoid instability problems.
The wind option could be looked at for the long-term benefits of meeting the renewable energy
targets, reducing the use of fossil fuel, and realising GoN commitments towards climate change.
For the benefit of future decision making Table 4 provides information on the status of wind
energy use in other Pacific Island countries.
Table 4: Wind energy status in some selected Pacific Island countries
Capacity of Wind energy
Number of Total capacity
Country turbine installed Supplier contribution to
turbines installed
(kW) the grid
Vanuatu 275 11 3.025 MW5 Vergnet 1.2%
Fiji 275 37 10.175 MW Vergnet 2%
Samoa 275 2 550kW Vergnet 2%
Source: SPC 2015
3 megawatts
16 NI U E S TR ATE G IC E NE R GY R OAD M A PElectricity sub-sector
After further data collection and analysis, wind energy may also be shown to be a cost-effective
option and if this is the case, it can be integrated into the renewable energy target mix in the
future.
3.4.3 Other renewable energy technologies
3.4.3.1 Biomass
Biomass resources may not be a good option for Niue, given the poor soil and the need for
conservation of existing forest resources. Coconut oil for biofuel maybe possible but is unlikely
to be cost-effective because of limited labour and human resources on the island.
3.4.3.2 Biogas
Biogas captured through a biogas digester at Vaipapahi Farm could be developed and demonstrated.
A four cubic metre biogas digester may be possible with at least ten mature pigs to be available
at all times.
3.4.3.3 Ocean energy
Niue has a mean wave energy flux of around 16.49 kW/m and this is ideal for grid connection.
However, the Pacific region has not had any experience of wave energy technology and this may
not be an option until the distant future, ten to twenty years from now.
3.5 Energy efficiency and conservation potential
3.5.1 Electricity supply losses
A study of the Niue power system energy losses conducted by KEMA in 2012 quantified the losses
into two categories: station losses, which were categorised as efficiency of generating units and
power plant auxiliary loads and distribution station losses – technical and non-technical.
This section discusses the findings of the study on the NPC power system total losses of 11.86%
consisting of:
→ 5.19% in power station auxiliaries (station losses), which is relatively high;
→ 4.7% in technical losses, which is in the normal range;
→ 0.03% in non-technical losses, which is an excellent level; and
→ 1.94% in unbilled usage for street lights and a portion of the consumption by the water system.
The power station losses of 5.19% is high and ideally should be reduced to 4% or lower. The
study highlighted some unaccounted losses from the NPC buildings at the power plant site, street
lights and two nearby houses. The KEMA study report recommendations are considered in the
implementation plan of this road map. For non-technical losses, the KEMA report recommends
that replacement of older meters by new meters is a priority and is included in this road map.
In order to achieve better and more accurate figures on total losses and non-technical losses,
it was also recommended to perform monthly meter readings on or around the last day of the
month in order to get a more accurate comparison between energy entering into the feeders
and energy sold.
NIUE STRATEGIC ENERGY ROA D MAP 17Electricity sub-sector
3.5.2 Residential, commercial and government
The 2004 Pacific Islands Renewable Energy Project study estimated a 10% savings on electricity
demand could be achieved through demand side management (DSM) activities in the residential,
government and commercial sectors. These activities include consumer awareness on energy
conservation and promoting financial incentives for consumers to use more efficient appliances.
In order to determine the electricity usage for the three sectors, electricity sales data were
collected from the Treasury Department. However, the data do not provide a breakdown of the
different sectors since the residential and commercial sales are lumped together as private, while
the government is recorded as public. There is a need to increase awareness and understanding
of data recording and analysis as the three sectors have different usages and therefore should
be dealt with differently.
In order to get an estimate on electricity use for the three sectors, private sector consumption
is divided thus: 40% for residential users and 60% for the commercial sector. This is used to
estimate the baseline electricity uses for residential and commercial users. Figure 7 depicts the
electricity billed for the residential, commercial and government users.
Niue 2009-2014: electricity consumption trend
3500
3000
2500
Units (GWh)
2000
1500
1000
500
0
2009 2010 2011 2012 2013 2014
Residential customers Commercial customers Government customers
Figure 7: Electricity consumption trend 2009 to 2014
Source: SPC, 2015
Residential sector
Energy efficiency strategies that could be adopted for the residential sectors could include;
→ an energy efficiency lighting strategy;
→ air conditioners retrofit in government buildings;
→ appliance standards and labelling; and
→ an LPG rehabilitation programme.
18 NI U E S TR ATE G IC E NE R GY R OAD M A PElectricity sub-sector
Tables 5 and 6 show what energy savings 4 could be achieved through an energy lighting strategy
and air conditioners retrofits.
Table 5: Energy savings through lighting strategy
No. of kWh/yr saving USD/yr saved CO2 t/yr emission
projects savings
Street lighting projects 11 334058 $185,343 286
Residential lighting projects 6 1317635 $614,787 1139
Commercial and public sector 9 1315945 $603,631 972
26 2967638 $1,403,761 2397
Source: PEEP 2 http://www.ee-pacific.net/
Table 6: Energy savings through AC retrofit5
No. of units kWh/month USD/month CO2 t/yr emission
replaced saving saved savings
High efficiency (EER 3 to 4) 11 4,500 $2,160.00 2397
inverter air conditioners
11 4500 $2,160.00 2397
Source: RMI Energy Audit Nick Wardrop presentation case study, Feb 2012
3.5.3 The commercial sector
The high electricity consumers are the Swanson Supermarket and the Matavai Resort. The NPC
reported that the commercial sector had carried out their energy audits as they are quite keen
to reduce electricity consumption. However, there is a need for aggressive awareness-raising on
energy efficiency and energy conservation.
3.5.4 The government sector
There is a need to collect and monitor energy usage in all government buildings in order to
establish baseline data, and track consumption on an ongoing basis, mainly those buildings using
air conditioning units. The energy efficiency measures could be incorporated into revised building
codes and supported by financial incentives for buildings that incorporate renewable energy uses,
such as solar water heaters, gas stoves, efficient lights and energy labels on electric appliances.
3.5.5 The tourism sector
Tourism has gradually increased in Niue since 2009. Visitor earnings have also increased, reaching
more than NZD 5 million in 2013, and will continue to rise as GoN has committed to increase its
investments in the extension of the Matavai resort in order to accommodate the larger number
of visitors to Niue.
However the number of tourists and visitors to Niue will affect electricity generation, electricity
consumption, transportation and water pumping. Even though water is free and not metered to
households and hotels, electricity is used to pump water to the water tank or reservoir.
There should be an aggressive awareness on electricity uses as well as water conservation.
6 Using past projects such as the PEEP 2, RMI EE experiences
5 There are 22 households with Air conditioning Units
NIUE STRATEGIC ENERGY ROA D MAP 19Electricity sub-sector
3.5.6 Appliance labelling and standards
Niue has no approved standards on electrical appliances and this road map considers the
benefits of participating in the Pacific Appliance and Labelling Standards (PALS) project that
will provide funding and technical assistance for a review of legislation to establish standards
and labels for selected household appliances, including lights, freezers/refrigeration and air
conditioners. An energy efficiency study conducted by SPC in 2012 concluded that an effective
labelling programme in Niue could result in annual savings of approximately 173.4 mega-watts
hour (MWh) of electricity and 189 tons of CO 2 emissions. The savings in avoided electricity is
USD 60,000 over the ten year period. 6
3.5.7 LPG rehabilitation
LPG use for cooking was promoted in the EDF9 project, with distribution of 314 gas stoves at the
end of the project in December 2010. There has since been a reduction in the total consumption
of LPG in Niue for households from 69% in 2012 to 60% in 2013 and reduced to 55% in 2014.
However the commercial sector experienced increased use of LPG. Table 7 highlighted the
estimated trend on the LPG consumption for the two sectors, residential and commercial.
Table 7: Total consumption (GJ) of LPG per sector 2010–2014
2010 % 2011 % 2012 % 2013 % 2014 %
Residential,
community and 818.19 69 898.06 69 978.06 69 924.09 60 891.27 55
social services
Commercial 365.22 31 400.87 31 436.58 31 626.76 40 737.10 45
Total
1183.41 100 1298.92 100 1414.64 100 1550.84 100 1628.37 100
consumption
Two issues contributed to the slow uptake of LPG: i) the high cost of LPG compared to electricity
and ii) reports that the distributed LPG stoves were not working due to faults in the gas pipe and
there being no spare parts available on the island. The gas pipes need to be replaced with the
commonly used fittings, which requires funding and technical expertise that can be provided by
the NBF (Niue Bulk Fuel).
The 2011 census reported that 116 households out of the 477 used electricity for cooking and 320
used gas stoves, but about half of these stopped using LPG shortly after take-up. This road map
aims to convert them, as well as the existing 116 households that use electricity, to LPG as the
main means of cooking. In total, the goal is to have 276 households converted to LPG for cooking.
3.6 Electricity sub-sector targets
The road map has identified priorities that will reduce the burden on government spending on
power generation. First is to implement the actions required to fully utilise the total capacity of
the solar energy installed, hence the need to resolve the grid in-stability issues and second, is to
improve both the efficiency of electricity generation supply and the demand use of electricity.
6 68,899 litres of diesel avoided over a ten year period.
20 NI U E S TR ATE G IC E NE R GY R OAD M A PElectricity sub-sector
Table 8 summarises the targets relating to the priorities for reducing diesel use for electricity
production through increased percentage share of renewable energy and reducing electricity
consumption through supply and demand side efficiency.
Table 8: Electricity sub-sector goals and targets
Base year 2017 2020 2025
Goal 1: Significant renewable energy integrated to the grid
Indicator 1: Percentage of renewable energy of 2% (2009) 5% 50% 80%
total generation
Goal 2a: Improve efficiency in the electricity sub-sector
Indicator 1: Percentage of electricity savings 5.19% (2011) 4.9% 4.5% 4%
through supply side management programme
Indicator 2: Fuel efficiency (kWh/litre) remains 3.77 (2014) 4.0 kWh/l 4.0 kWh/l 4.0 kWh/l
constant in 2017
Indicator 3: Percentage of total billed electricity 10% 15%
consumption reduced
Indicator 4: Percentage of households using LPG 67% (2011) 34% (2015 57% 90%
for cooking fuel estimates)
NIUE STRATEGIC ENERGY ROA D MAP 21Transport sub-sector
Transport sub-sector

Transport sub-sector
4.1             Transport energy use
In 2014, the transport sector was estimated to account for 71% of the total fuel energy consumption
on Niue. Of this, over 99% of the fuel consumed in the transport sector is for land transportation.
Kerosene sales for aviation are accounted as international sales and are reflected as re-export
figures for Niue.
The graph presented in Figure 8 represents the energy consumption for the transport sector 2009 to 2014.

                            Niue 2009-2014: fuel consumption trend in the transport sector
             1200000
             1000000
              800000
    litres

              600000
              400000
              200000
                   0
                    2008              2009              2010             2011              2012         2013        2014
                                             ADO - Land        Petrol - Land      ADO - Marine

Figure 8: Fuel use for transport sector 2009 to 2014
Source: SPC data 2015

4.2             Land transport
The Transport Act 1965 and regulations govern the licensing and related fees for motor vehicles
use in Niue. The 2011 census recorded a total of 926 vehicles at household level, estimating that,
on average, every household 8 in Niue owns at least two vehicles. The availability of loans and
second-hand cars from relatives living abroad are two of the reasons for the increased number
of vehicles.
A regulation developed under the Customs Tariff Act 1982 restricts the importation of second-hand
cars that were manufactured before 2000 as they are less fuel-efficient than the latest models.
The mode of transport to work as surveyed in the 2011 census report was by motor vehicles. 9
There is no public transport system in Niue and therefore a private vehicle is the predominant
form of transport for workers and the public. The census report noted that 77.1% of employers
use their own vehicle to travel to work, even in those areas where the government offices are
situated around Alofi South and Alofi North. Only 13.3% of workers said they shared a vehicle
when they travelled to and from work and this is common for those who come from Vaiea, Avatele,
Likue and Tuapa, villages further away from government buildings. In terms of fuel, petrol is the
fuel most used for land transport.

4.3             Transport sub-sector targets
There have been no activities relating to energy efficiency and renewable energy options for
the transport sector in the past, and the road map will constitute the first effort to examine
8               In 2011, there were 477 households in Niue.
9               In 2011, there were 555 motor cars, 96 vans or trucks, 23 motorbikes and 46 bicycles.

                                                                                            NIUE STRATEGIC ENERGY ROA D MAP           23
Transport sub-sector
this area. As the majority of fuel use is for land transport and the other major user of fuel is the
airline industry where international regulations limit the scope for national interventions, the
road map will focus on land transport.
The target for land transport is shown in Table 11.
Table 9: Land transport target
2009 2015 2020
Goal 2b: Improve efficiency in the transport sub-sector
Indicator 1: Percentage of fuel efficient vehicles – solar battery 1% (50
No data No data
powered, hybrid or engine cylinder capacity of less than 1300 vehicles)
Options to improve efficiency in land transportation include the following.
1. In 2011, Customs regulations were amended to encourage the import of fuel-efficient vehicles into
Niue. For example, the following tiers are applied to vehicles:
a) 10% duty for spark-ignition internal combustion reciprocating piston engines, cylinder capacity
not exceeding 1500 cubic centimeter (cc) OR compression-ignition internal combustion piston
engines (diesel or semi-diesel) for transport of goods (of a gvw not exceeding 5 tonnes)
b) 20% duty for spark-ignition internal combustion reciprocating piston engines cylinder capacity
exceeding 1500 cc but not exceeding 3000 cc OR compression-ignition internal combustion
piston engines (diesel or semi-diesel) for transport of goods (of a gvw exceeding 5 tonnes but not
exceeding 20 tonnes)
c) 40% duty for spark-ignition internal combustion reciprocating piston engines cylinder capacity
exceeding 3000 cc OR compression-ignition internal combustion piston engines (diesel or semi-
diesel) for transport of goods (of a gvw. exceeding 20 tonnes)
d) Vehicles: electrical, self-propelled, (not fitted with lifting or handling equipment) of the type used
for short distance transport of goods in factories, warehouses, dock areas or airports have 0%
duty.
2. As technology improves, the Customs regulations need to be reviewed and adjusted at regular intervals
(i.e. every five years) to support fuel-efficient vehicle import initiatives. Customs have confirmed a
new tariff has been proposed and will be implemented once approved by Cabinet.
3. Vehicle types must be considered and classified for this plan moving forward – for example the average
family car sufficient to transport parents to work and children to school should aim to have an engine
cylinder capacity of less than 1300 cc rather than a heavy duty utility vehicle for towing a fishing boat
or for gathering firewood from the plantation, etc. This could have an engine cylinder capacity up to
2500 cc.
4. Provide incentives and facilities to improve the quality of maintenance of vehicles.
5. Consider incentives to increase the use of bicycles and promote health as a way of preventing non-
communicable diseases.
An electric-diesel hybrid vehicle may be an option to investigate for the near future as the power
generation is currently supplying more than the energy demand. The batteries can be charged
using electricity, thereby reducing the use of diesel fuel. As renewable energy generation increases,
the feasibility of fully electric vehicles with solar (or wind) charging can be a good option for a
low carbon economy. However, fully electric vehicles are far from becoming a commercial reality
in practice, even worldwide. A preliminary investigation into the benefits and costs of electric
vehicles would be needed before any concrete steps are taken in this direction.
24 NI U E S TR ATE G IC E NE R GY R OAD M A PPetroleum sub-sector
Petroleum sub-sector

     Petroleum sub-sector
     5.1                      Fuel supply and demand
     Niue Blulk Fuel (NBF) imports and distributes petroleum products in Niue. There is only one
     retailer for automotive diesel oil (ADO) and petrol, while LPG is distributed by the private sector
     – Ali’s enterprise. Fuel supply to Niue is provided through Matson shipping, which procures fuel
     from Z 7 energy of New Zealand. Maintenance and inspection of systems is based on industry
     standards published by Shell. Several of the larger tanks at Sir Robert’s wharf are currently in
     poor condition and not up to industrial standards, but these assets are not currently required
     due to the tank-tainer supply model. Key spare parts for pumping and treatment systems are
     held on the island. The current method of fuel importation is through tank-tainers, but recent
     investigations have looked into restoring the local coastal tankers supply model, including the
     Alofi wharf bulk fuel tanks.
     NBF assets currently in use include storage tanks at Amanau and Hanan Airport, tankers, pumps,
     hoses and the jet fuel distribution line (including filtration systems, etc.). In addition to these
     assets, there are storage tanks at Sir Robert’s Wharf in Alofi that were damaged in cyclone Heta
     in 2004. Total petroleum imports to Niue in past years average around 2.4 million litres per
     annum. Diesel is the largest volume imported to Niue, averaging 1.2 million litres per annum.
     The electricity generation diesel use accounts for 66% of the total imports (0.8 million litres).
     Figure 9 provides the NBF projections that predict an increase in fuel demand in all types of fuel;
     ADO, petrol, dual purpose kerosene (DPK) and LPG until 2016. However, diesel use for power
     generation is expected to decrease after 2016 following the planned increase in the renewable
     energy share to the total generation. Jet fuel or DPK imports are also expected to increase in the
     coming years, noting the growth in the tourism sector that will eventuate with more than two
     flights per week to Niue in the foreseeable future. LPG use will also increase once it is readily
     accessible and becomes more affordable compared to electricity.

                                    Niue Bulk Fuel - petroleum & LPG sales projection          Petrol - retail (6% increase)
                           1200
                                                                                               Diesel- retail (3% decrease)
                           1000
                                                                                               Diesel - NPC (2% increase for the next
                                                                                               3years and then decrease gradually)
                            800                                                                Diesel - other customers(Nil Sales)
         Thousand litres

                                                                                               Jetfuel- Air NZ (1% increase)
                            600
                                                                                               Jetfuel - other flights(9% decrease)
                            400
                                                                                               Kerosene (1% decrease)
                            200
                                                                                               LPG-LQD (0.4% decrease)

                              0                                                                LPG- VAP (8% increase)
                                         2014            2015     2016         2017     2018

     Figure 9: Petroleum fuel and LPG sales projects 2015–2018
     Source: NBF presentation 19 Nov 2014

     7                            Z Energy was formerly Shell

26   NI U E S TR ATE G IC E NE R GY R OAD M A P
You can also read