Draft Emissions Reduction Plan 2017-2021 - Eurobodalla Shire ...
←
→
Page content transcription
If your browser does not render page correctly, please read the page content below

Draft
Emissions Reduction
Plan
2017-2021

                      1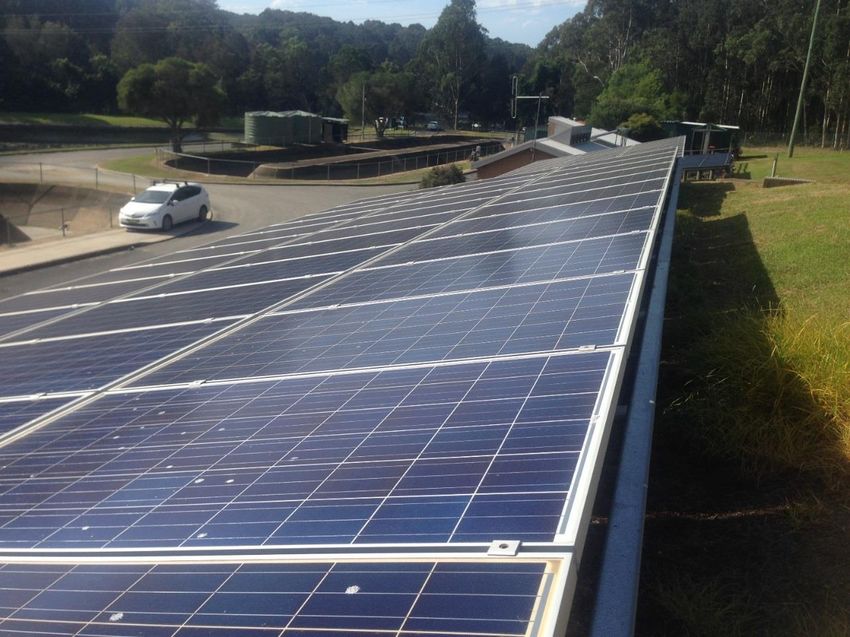
Draft Emissions Reduction Plan 2017-2021

Glossary of terms and acronyms:
BAU             Business As Usual

CCP             Cities for Climate Protection

CNG             Compressed Natural Gas

CO₂e            Equivalent tonnes of Carbon Dioxide

CSP             Community Strategic Plan

ERP             Emissions Reduction Plan

GHG             Greenhouse gas

IPCC            Intergovernmental Panel on Climate Change

IWCMS           Integrated Water Cycle Management Strategy

kL              Kilolitre is a unit of measurement equal to 1,000 litres.

kWh             Kilowatt hours is a unit of energy equal to 1000 watt hours or 3.6 megajoules.

LED             Light Emitting Diode

LPG             Low Pressure Gas

ML              Megalitre. 1 ML= 1,000kL

MWh             Megawatt hours. 1MWh = 1,000 kWh

NGERs           National Greenhouse and Emissions Reporting Act

RET             Large-scale Renewable Energy Target

PV              Photo-voltaic

UNFCC           United Nations Framework Convention on Climate Change

                                                                                                 2
Emissions Reduction Plan 2017-2021

Contents
Glossary of terms and acronyms: ................................................................ 2
List of Figures ............................................................................................... 4
List of Tables ................................................................................................ 4
1.     Executive Summary ............................................................................. 6
2.     Background .......................................................................................... 7
     2.1       International ........................................................................................................................................ 7
     2.2       Australia ............................................................................................................................................... 7
     2.3       New South Wales ................................................................................................................................ 8
     2.4       Eurobodalla Shire Council.................................................................................................................... 8
     2.5       The Eurobodalla community ............................................................................................................... 8
3.     Council greenhouse gas emissions inventory.................................... 10
     3.1       Corporate emissions profile .............................................................................................................. 10
     3.2       Community emissions ....................................................................................................................... 13
4.     Progress to date................................................................................. 15
     4.1       Climate change activities completed to date .................................................................................... 15
5.     Greenhouse gas emission reductions................................................ 17
     5.1       Emission reduction opportunities ..................................................................................................... 17
       5.1.1 Higher vehicle emission standards ................................................................................................... 17
       5.1.2 Electric vehicles ................................................................................................................................ 18
       5.1.3 Battery storage ................................................................................................................................. 18
       5.1.4 Energy efficiency standards .............................................................................................................. 19
       5.1.5 Methane ........................................................................................................................................... 19
       5.1.6 Energy costs ...................................................................................................................................... 19
       5.1.7          New energy trading models ...................................................................................................... 20
       5.1.8 Renewable energy costs ................................................................................................................... 20
     5.2       Forecast emissions ............................................................................................................................ 20
     5.3       Council emission reduction targets ................................................................................................... 23
6.     Emissions Reduction Plan .................................................................. 27
     6.1       Community ........................................................................................................................................ 27
     6.2       Energy management ......................................................................................................................... 29
       6.2.1          Energy management – buildings ............................................................................................... 31
       6.2.2          Energy management – street lighting ....................................................................................... 34
       6.2.3          Energy management – water and sewer................................................................................... 35
     6.3       Fleet ................................................................................................................................................... 37
     6.4       Leadership ......................................................................................................................................... 38

3
Draft Emissions Reduction Plan 2017-2021

     6.5      Planning ............................................................................................................................................. 39
     6.6      Renewable Energy ............................................................................................................................. 40
     6.7      Waste................................................................................................................................................. 42
7.     Implementing the Emissions Reduction Plan .................................... 44
     7.1      Resourcing and funding ..................................................................................................................... 44
     7.2      Monitoring and evaluation ................................................................................................................ 45
     7.3      Risk management .............................................................................................................................. 45
       7.3.1 Risk register ...................................................................................................................................... 45
Appendix 1           Emissions inventory methodology .................................... 48
Appendix 2           Actions taken to date ........................................................ 49
Appendix 3. New actions ........................................................................... 55
Appendix 4.          Risk consequence and likelihood table ............................. 58

List of Figures
Figure 1           Council GHG Emissions Breakup (2015-16) ................................................................................. 11
Figure 2          Council energy costs over time ..................................................................................................... 12
Figure 3          Council greenhouse gas emissions history ................................................................................... 13
Figure 4          Eurobodalla community electricity usage per customer has declined by 17% since 08-09......... 14
Figure 5          Solar power installation at Kianga Sewage Treatment Plant ........................................................ 16
Figure 6          Vehicle emission standards targets .............................................................................................. 17
Figure 7          Projected Electric Vehicle uptake ................................................................................................. 18
Figure 8          Cost predictions for electric vehicle battery packs are already out of date................................. 19
Figure 9          Forecast Council total emissions .................................................................................................. 21
Figure 10         Forecast Council energy emissions ............................................................................................... 22
Figure 11         Emissions reduction target ........................................................................................................... 23
Figure 12         Forecast emissions can be reduced by over 80% by 2030 ........................................................... 25
Figure 13         High electricity using Council buildings ........................................................................................ 31
Figure 14         Emissions from Council buildings ................................................................................................. 31
Figure 15         Water assets electricity costs ....................................................................................................... 35
Figure 16         Example of current solar power generation data ........................................................................ 41
Figure 17         Forecast landfill emissions............................................................................................................. 42

List of Tables
Table 1       Council 2015-16 Greenhouse Gas Emissions Inventory .................................................................... 10
Table 2       Emissions Costs by Activity Type (2015-16) ...................................................................................... 11
Table 3       Core community actions.................................................................................................................... 28
Table 4       Core energy management actions .................................................................................................... 30
Table 5       New general energy management actions........................................................................................ 30
Table 6       Core Building Energy Efficiency Actions ............................................................................................ 32
Table 7       New building energy management actions ....................................................................................... 33

                                                                                                                                                                     4
Emissions Reduction Plan 2017-2021

Table 8 New street lighting energy management actions ............................................................................. 34
Table 9 Core water and sewer actions ........................................................................................................... 36
Table 10  New water and sewer energy management actions..................................................................... 36
Table 11  Core fleet actions........................................................................................................................... 37
Table 12  New fleet actions ........................................................................................................................... 37
Table 13  Core leadership Actions ................................................................................................................ 38
Table 14  New leadership actions ................................................................................................................ 38
Table 15  Core planning actions ................................................................................................................... 39
Table 16  New planning actions .................................................................................................................... 39
Table 17  Core renewable energy actions ..................................................................................................... 40
Table 18  New renewable energy actions .................................................................................................... 41
Table 19  Core waste Actions ....................................................................................................................... 42
Table 20  New waste actions......................................................................................................................... 43
Table 21   Resource requirements ............................................................................................................... 44
Table 22  Risk management matrix .............................................................................................................. 47
Table 23  Completed actions ......................................................................................................................... 49
Table 24  All new actions............................................................................................................................... 55

5
Council is ready to capitalise on any
1.     Executive Summary                           opportunities that prove to be technically and
The 2017-2021 Eurobodalla Emissions                economically feasible.
Reduction Plan sets out Council’s strategy to
minimise the greenhouse gas emissions from         The emission reduction actions and
Council operations. It builds on the work done     achievements to date have demonstrated
in the previous editions of the plan over the      that there is a strong business case for action.
period 2007-2017. The outcomes achieved            Completed actions have generated significant
over the past ten years has demonstrated           energy cost savings totalling over $1m per
that emission reductions can deliver both          year. New actions will continue to be
strong environmental and economic benefits.        prioritised based on the economic benefits to
                                                   Council and new project approvals will
Climate change has the potential to affect         depend on a viable business case proving a
every aspect of our lives, from the health and     positive return on investment.
integrity of natural systems, to economic
prosperity and community health and well-          Council is on track to meet its commitment to
being. Responding effectively to climate           reduce emissions by 25% by 2020. A new
change involves both reducing greenhouse           corporate energy emissions reduction target
gas emissions (mitigation) and being ready to      of 80% by 2030 has been established. An
adapt to climate change impacts as they occur      additional target will be to source 100% of
(adaptation).                                      Council’s electricity from renewable energy
                                                   by 2030. Council recognises that there will be
The content of the new draft plan is               challenges in reaching these targets due to
principally focussed on emission reduction         future increases in Council services and assets
                                                   and their corresponding emissions. It will also
activities. A dedicated climate change
                                                   depend upon other factors including the
adaptation plan will be developed separately
                                                   policies implemented by the NSW and
and is one of the key actions in this plan. This
                                                   Australian Governments, the trends and
will enable the draft Emissions Reduction Plan     opportunities presented by clean technology
to focus on more targeted actions related to       and the energy market, and the internal
emissions and as such is appropriately to be       decisions made by Council.
titled the Emissions Reduction Plan (ERP).
                                                   Council will continue working on a range of
Key actions for Council to reduce emissions
                                                   strategies and implement a number of new
include continued efforts in energy efficiency,
                                                   actions detailed in this plan. Steps to support
renewable energy, reducing methane
                                                   the community in responding to the issues of
pollution from landfill, decarbonising the fleet
                                                   climate change are also outlined in the Plan.
and developing an Adaptation Strategy.
                                                   Committing to a strong target places Council
Council will also keep a firm focus on
                                                   in a good position to continue focusing on
emerging technologies and will be
                                                   improving efficiencies and delivering energy
investigating a number of new opportunities.
                                                   and cost savings.

                                                                                                     6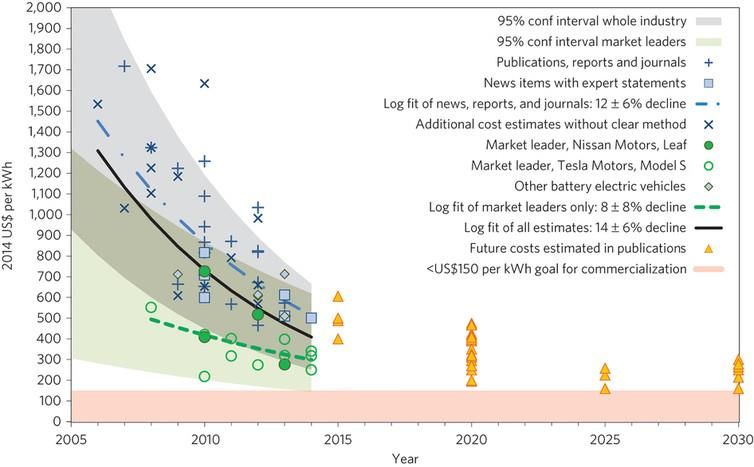
it (as of 7 March 2017). The commitment of
2. Background these nations accounts for about 82% of
international carbon emissions.
2.1 International
The issue of climate change has been on the
international agenda since The United 2.2 Australia
Nations Conference on Environment and Australia has committed to reducing
Development in Rio de Janeiro in 1992. Since greenhouse gas emissions by 26-28% below
this time, climate change has increasingly 2005 levels by 2030. The Australian
dominated international environmental Government plans to meet the interim 5%
negotiations, and is now widely recognised as reduction by 2020 target through their Direct
the most serious environmental issue of our Action policies. At the core of this policy is the
time. It is an issue that will require a high Emissions Reduction Fund which provides
degree of international cooperation to incentives for emission reduction activities
resolve. across the Australian economy.
An historic global climate agreement was The Australian Government ratified the Paris
agreed under the United Nations Framework Agreement in November 2016. The
Convention on Climate Change (UNFCCC) at agreement’s review and ratchet mechanism
the 21st Conference of the Parties (COP21) in means that Australia’s interim emissions
Paris (30 November to 12 December 2015). reduction targets are likely to become more
The Paris Agreement sets in place a durable ambitious over time.
and dynamic framework for all countries to
take climate action from 2020, building on The Renewable Energy Target (RET) is an
existing international efforts in the period up Australian Government scheme designed to
to 2020. Key outcomes include: reduce the greenhouse gas emissions in the
A global goal to hold average
electricity sector. The target for large-scale
temperature increase to well below renewable generation of 33,000 GWh in 2020
2°C and pursue efforts to keep will mean that about 23.5% of Australia’s
warming below 1.5°C above pre- electricity generation in 2020 will be from
industrial levels. renewable sources.
All countries to set mitigation targets
from 2020 and review targets every The National Energy Productivity Plan 2015-
five years to build ambition over time, 2030 was developed by Council of Australian
informed by a global stocktake. Governments. It outlines a framework and
Robust transparency and
plan to accelerate improvement to deliver a
accountability rules to provide 40% improvement in Australia’s energy
confidence in countries’ actions and productivity. Key activities that will provide
track progress towards targets. direct benefits to Eurobodalla include
Promoting action to adapt and build
improving vehicle emission standards,
resilience to climate impacts. improving residential and commercial
Financial, technological and capacity
buildings energy efficiency and accelerating
building support to help developing energy market reforms and innovative new
countries implement the Agreement. technologies.
The Paris Agreement entered into force on 4 Other key national programs include the
November 2016 and has now become legally Australian Renewable Energy Agency (ARENA)
binding for the 133 nations that have ratified and the Clean Energy Finance Corporation
7
Draft Emissions Reduction Plan 2017-2021

(CEFC). ARENA provide grant funding to                     3.2 Value, protect and enhance our
accelerate renewable energy solutions in                       natural environment and assets
Australia. The CEFC invests commercially,                  3.4 Develop community awareness of
through the provision of loans, into                           environmental opportunities, issues
renewable energy, energy efficiency and low                    and impacts
emissions technologies.
                                                     4. Sustainable living
2.3     New South Wales
                                                         4.1 Maximise the efficient use and reuse
The New South Wales Government endorses
                                                             of our water resources
the Paris Agreement and has committed to
                                                         4.2 Targeted reduction of waste with an
achieving zero net emissions by 2050. This
                                                             emphasis on resource recovery and
objective is intended to give confidence and
                                                             waste minimisation
certainty to industry and attract low carbon
                                                         4.3 Support and encourage sustainable
investment and innovation across NSW.
                                                             choices and lifestyles
The NSW Government is developing a Climate               4.4 Work together to reduce our
Change Fund Strategic Plan in 2017. This will                environmental footprint and develop a
provide funding and support for advanced                     clean energy future
energy technologies and solutions, energy
efficiency and climate change adaptation.             9. Innovative and proactive leadership
                                                          9.1 Provide strong leadership and work in
The NSW Energy Saving Scheme is one of the                partnership to strategically plan for the
key strategies that reduces electricity                   future and progress towards the
consumption in NSW by creating financial                  community vision
incentives for organisations to invest in                 9.2 Ensure financial sustainability and
energy savings projects. In past and current              support the organisation in achieving
projects Council has generated energy saving              efficient ongoing operations
certificates by installing, improving or                  9.3 Leverage our skills, knowledge and
replacing energy savings equipment.               systems to continually improve and innovate

2.4     Eurobodalla Shire Council                    Council has previously committed to an
Eurobodalla Shire Council has been actively          emissions reduction target of 25% by 2020
addressing climate change for many years.            and is on track to achieve this. A new target
Two consecutive Greenhouse Action Plans
                                                     has been established to reduce Council
have been implemented from 2007 to 2017.
                                                     energy emissions from the 2005-06 baseline
The Eurobodalla Community Strategic Plan             by 80% by 2030. An additional, supporting
(CSP) is the key guiding document for Council        target has also been established to source
and was developed after extensive                    100% of Council’s electricity from renewable
community consultation. A number of                  energy by 2030.
outcomes and strategies in the CSP are
addressed through the implementation of the          2.5      The Eurobodalla community
Emissions Reduction Plan. The main links are:
                                                     A 2016 survey of local residents showed that
3. Protected and valued natural environment          the local community is generally concerned
    3.1 Respond to our changing environment          about climate change. Some relevant results
        and build resilience to natural hazards      included:

                                                                                                     8
Emissions Reduction Plan 2017-2021
Advice from Council on ‘sustainability, A local Eurobodalla chapter of the
renewable energy and climate change’ was international climate change advocacy
valued as relatively important to 84% of group “350.org” was established in 2015.
people The South coast Health and Sustainability
73% of people said that, in general, they Alliance (SHASA) was formed in 2015 and
are concerned about the environment. has been active in supporting the take up
Climate change was the environmental
of more renewable energy.
issue that worried them the most
Narooma Rotary ran a Renewable Energy
97% of people surveyed already have some
Expo in 2016 with about 1,000 attendees.
energy saving items installed at home
26% of those surveyed had solar panels. Several community climate change rallies
This rose to 40% and 45% for the 55-64 and events have been attended by
and 75+ age brackets. hundreds of people.
There has been a growing community interest
in climate change and renewable energy in
Eurobodalla.
9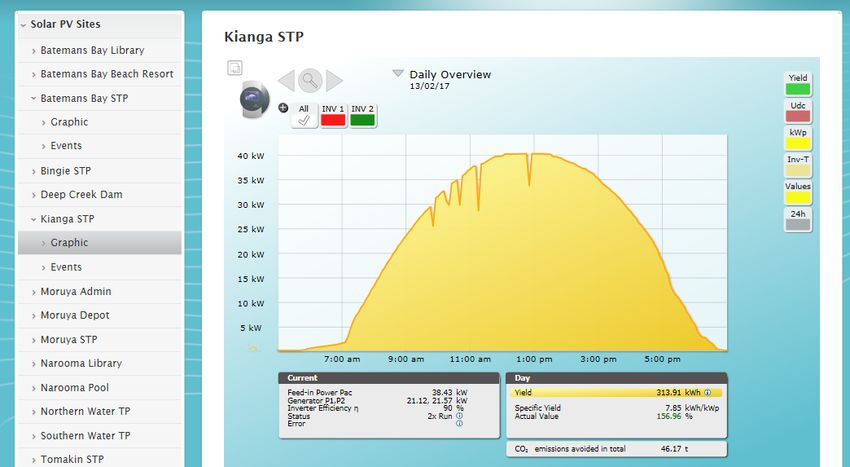
Electricity used by street lighting assets
3. Council greenhouse gas which are owned by Essential Energy
emissions inventory More information on the methodology used
for calculating emissions is provided in
Background terms:
Appendix 1.
For the purpose of greenhouse gas reporting,
GHG emissions are categorised into Scope 1, 3.1 Corporate emissions profile
Scope 2 and Scope 3 emissions. The National Council’s emissions are summarised in Table
Greenhouse Emissions Reporting (NGER) Act 1.
2007 refers to the mandatory reporting of
emissions from Scope 1 and 2, whereas Scope 2015-16 Council GHG emissions inventory
3 is voluntary. Eurobodalla Shire Council does Scope 1 2015-16 tCO₂e
not meet the thresholds that trigger Fuel (ULP, Diesel) 2,635
mandatory reporting under NGERs. However, Bottled gas 128
emissions reporting has been aligned with Waste: landfill methane
this methodology in the interests of emissions 20,014
consistency and best practice. Sewer: fugitive methane
emissions 990
Definitions for each Scope and Council SUBTOTAL 23,766
emissions from these areas are outlined Scope 2
below. Electricity 7,020
SUBTOTAL 7,020
Scope 1 Emissions:
The direct emissions from an activity Scope 3
undertaken or controlled by the company. Electricity transmission and
distribution losses 1,003
Council managed landfill sites
Fuel production and transport 147
Fugitive emissions from Sewer Treatment
Plants Street lighting (electricity) 1,473
Bottled gas direct emissions
SUBTOTAL 2,623
Fleet fuel (ULP, E10 and diesel) direct
TOTAL 33,409
emissions
Table 1 Council 2015-16 Greenhouse Gas
Scope 2 Emissions: Emissions Inventory
The emissions arising from electricity,
heating, cooling or steam consumed by the An analysis of Council’s GHG emissions by the
company. type of activity is revealing. As illustrated in
Electricity use from all Council owned Figure 1 it highlights the large contribution
facilities made by the methane emissions from landfill
Scope 3 Emissions: waste. This is, in part, due to the fact that
The emissions generated as a consequence of methane is a powerful greenhouse gas and
the activities of the company which occur has 25 times the global warming potential of
outside of the facility. carbon dioxide and the fact that Council
Transmission and distribution emissions processes a large volume of waste from the
from Council electricity use wider community.
Extraction and supply emissions associated
with fuel used for Council vehicles and
bottled gas
102 0 1 5 / 1 6 C O U N C I L E M I S S I O N S ( TO N N ES
CO2E)
Fleet
8%
Streetlighting
Sewer
13%
Waste
Water 60%
Buildings
6%
Figure 1 Council GHG Emissions Breakup (2015-16)
Analysis of the energy costs associated with contribution to Council’s greenhouse gas
Council’s emissions intensive activities in (GHG) emissions. Energy costs clearly
Table 2 highlights the large costs associated represent a large operating cost to Council
with these activities. Fuel costs have a and efforts to reduce the exposure to
disproportionately high share of the overall increased energy costs are essential.
energy costs given their relatively small
Sector GHG tCO₂-e % GHG Energy cost* $ Energy $ %
Buildings 2,105 6% $571,658 19%
Water 2,869 9% $445,353 15%
Sewer 4,176 13% $673,700 23%
Fuel 2,771 8% $1,060,503 36%
Street lighting 1,473 4% $200,889 7%
Waste - landfill 20,014 60% $11,138 0%
TOTAL 33,409 $2,963,241
Table 2 Emissions Costs by Activity Type (2015-16)
* Energy costs includes electricity, gas, fuel (diesel, ULP, E10 and LPG)
11Draft Emissions Reduction Plan 2017-2021
Actual energy costs
$3,900,000
$3,700,000
$3,500,000
$3,300,000
$3,100,000
$2,900,000
$2,700,000
$2,500,000
2011-2012 2012-2013 2013-2014 2014-2015 2015-2016
Figure 2 Council energy costs over time
As shown in Figure 2, energy costs have This is referred to as Council’s baseline that is
declined considerably since 2013-14. This is used for comparative purposes to determine
due to a decline in energy usage, improved if emissions are increasing or decreasing.
energy management strategies and a Figure 3 shows Council’s greenhouse gas
reduction in the costs of energy. Refer to emissions history since 2005-06. The blue part
Section 4.1 or Appendix 2 for more details on of the graph shows actual Council emissions.
actions completed to date. Total energy costs The orange part shows what emissions would
to Council have declined by over $900,000 in have been if no reduction activities had been
2015-16 compared to their peak in 2012-13. completed by Council. By including this in the
Energy costs would have been significantly chart, it shows what emissions would have
higher again if energy management activities been if all the energy efficiency, renewable
had not been completed. energy and carbon offset projects had not
been completed in a ‘Business As Usual’
Council first quantified its greenhouse gas scenario.
emissions with reliable data in 2005-2006.
12Emissions Reduction Plan 2017-2021
Council emissions
45,000
40,000
35,000
30,000
TONNES CO2E/YEAR
25,000
20,000
15,000
10,000
5,000
-
Emissions Business as usual emissions
Figure 3 Council greenhouse gas emissions history
Total emissions for 2015-16 are down 3.4% Community electricity emissions are displayed
compared to the 2005-06 baseline. This in Figure 4. This shows a significant reduction
equates to a 16% reduction compared to the in electricity usage over time (17%)
business as usual scenario. demonstrating the impact that energy
efficiency and solar power systems have had
3.2 Community emissions in reducing energy usage. Emissions per
Council continues to support the reduction of customer have declined by 27% compared to
community emissions through a number of 2008-09 due to this reduction in electricity
strategies outlined in Section 6.1. Although usage combined with a decarbonising
Council has limited resources or capacity to electricity supply.
influence community efforts to address
climate change, it can provide support Other sources of community emissions such
through education programmes, through the as bottled gas, transport and agricultural
delivery of the Local Environment Plan and in emissions have not been compiled.
the structure of some community services
such as waste, recycling, water and sewer.
13Draft Emissions Reduction Plan 2017-2021
Eurobodalla community electricity usage
205,000 10.00
200,000 9.00
Tonnes CO2e/customer/year
195,000 8.00
MWh/customer/year
7.00
Total MWh/year
190,000
6.00
185,000
5.00
180,000
4.00
175,000
3.00
170,000 2.00
165,000 1.00
160,000 -
2008/09 2009/10 2010/11 2011/12 2012/13 2013/14 2014/15 2015/16
Total MWh MWh/customer Tonnes/customer
Figure 4 Eurobodalla community electricity usage per customer has declined by 17% since 08-091
1
Essential Energy (2017)
144. Progress to date
4.1 Climate change activities
completed to date
Council has completed a large number of
activities and projects aimed at reducing
greenhouse gas emissions. These actions are
summarised in Appendix 2.
The 2012-2017 Greenhouse Action Plan
resulted in:
100% of actions progressing
saving over $1m and 5,100 tonnes of CO₂e
per year
compared to the 2005-06 baseline,
building emissions are down 36%
street lighting emissions are down 14%
The 2007-2012 Greenhouse Action Plan before the bulk LED upgrade
resulted in: over 15km of shared pathways and
85% of the actions implemented footpaths built
the continued development of cycle and total of 1,240 water rebates issued
foot paths and promotion of sustainable starting an Energy Performance Contract
transport options. on Council’s 23 largest sites
three solar power systems installed on winning the 2015 Local Government NSW
community buildings Excellence in the Environment Award for
numerous energy and water efficiency accomplishments in sustainability and
measures environmental management
62% of Council's light vehicle fleet were over 630kW of solar power installed across
four cylinder vehicles, up from 26% in 2006 25 facilities
many resources recovered, reused, the Community Building Sustainability
recycled and diverted from landfill project saved 553 tonnes of CO₂, 7,359,000
Sustaining Our Towns (2010-2012) litres of water and over $159,000 per year
sustainability programs for residential, at over 50 community buildings
business and community groups a successful aggregated bid in the
Business Treading Lightly (2008-2010) Emissions Reduction Fund to reduce
sustainable business program methane emissions at Waste Management
an energy efficient street lighting upgrade Facilities.
reducing street lighting energy
consumption by 25%. Projects to be completed in 2017 include:
an Energy Performance Contract on the 23
largest Council sites. This is a competitive
energy auditing process which will reduce
energy use by 12% at target sites. This will
save over 729 tonnes of CO₂ and $155,000
per year.
15Draft Emissions Reduction Plan 2017-2021
LED street lighting will be installed on 5,000 equivalent tonnes of CO₂ per
local roads in Eurobodalla in 2017 year at Surf Beach landfill, and an
which could save over 450 tonnes of estimated 3,500 equivalent tonnes of
CO₂ and $200,000 per year in energy CO₂ per year at Brou landfill.
and maintenance costs
a landfill methane gas capture and
flaring project will save an estimated
Figure 5 Solar power installation at Kianga Sewage Treatment Plant
16Emissions Reduction Plan 2017-2021
5. Greenhouse gas declining costs, will also drive the deployment
and mainstreaming of new opportunities.
emission reductions
The cumulative effect of a wide range of
5.1 Emission reduction emission reduction opportunities becoming
opportunities more viable will enable more ambitious
A number of emerging trends and greenhouse gas reduction targets to be
developments in clean energy technologies achievable in the years ahead.
and policies offer the potential for emissions
reductions in the coming years. 5.1.1 Higher vehicle emission standards
Improving vehicle efficiency through a higher
The National Energy Productivity Plan 2015- fuel efficiency standard would deliver real
2030, developed by the Council of Australian benefits to Council as vehicles are upgraded.
Governments aims to improve the country’s As shown in Figure 6 the Australian
energy productivity by 40%. A number of Government’s draft proposed vehicle
activities within this plan will help deliver emissions standards suggests target of
emission reductions for Council. Of particular 105g/km, phased in from 2020 to 2025, which
relevance will be higher vehicle emissions would broadly align Australia with the EU
standards, higher appliance energy efficiency targets for 2020-21 and the overall US target
standards and accelerating energy market for 2025. This will deliver cost and emissions
reforms and innovative new technologies. savings to Council’s fleet as vehicles are
upgraded.
The growth in clean technology markets,
improving economies of scale leading to
Vehicle emissions
250
Average emissions intensity (g CO2 /km)
200
150
100
50
0
2003
2014
2025
2000
2001
2002
2004
2005
2006
2007
2008
2009
2010
2011
2012
2013
2015
2016
2017
2018
2019
2020
2021
2022
2023
2024
US US (target) EU
EU (target) Australia Australia (forecast)
Australia (target)
Figure 6 Vehicle emission standards targets23
2
Climate Change Authority (2016) Towards a climate policy toolkit: special review on Australia’s climate goals and
policies, Special Report Three – Charts.
3
Department of Infrastructure and Regional Development (2016) Vehicle emissions standards for cleaner air – Draft
Regulation Impact Statement. https://infrastructure.gov.au/roads/environment/forum/index.aspx
175.1.2 Electric vehicles and greater security through reduced reliance
Electric vehicles will become a rapidly growing on imported fuels.
segment of the car market. Combined with a
low-carbon electricity grid they offer the As shown in Figure 7, electric vehicles are
potential to significantly reduce transport predicted to comprise 29%-45% of new
emissions. Electric vehicles can also offer vehicle sales by 2036 in a neutral or strong
Council reduced risk from volatile fuel costs uptake scenario.
Figure 7 Projected Electric Vehicle uptake4
5.1.3 Battery storage
Rapidly reducing costs for battery storage The Australian Energy Market Operator
presents opportunities for energy expects a steady uptake in battery storage by
management and renewable energy. 2021 driven by rising energy costs and
Batteries can help reduce demand charges declining battery costs.5
through ‘peak shaving’, increase the level of
solar power self-consumption, provide back A 2015 literature review of electric vehicle
up, or stand-alone power and improve ‘time battery packs identified the current and
of use’ power management. On a larger scale predicted costs of battery packs, as shown in
there are many other applications as well for Figure 8.6 Since then price reductions for
electricity network operators and distributors. battery packs have already exceeded the
most optimistic predictions.
4
Australian Energy Market Operator (2016) AEMO Insights, Electric Vehicles,
https://www.aemo.com.au/-/media/Files/Electricity/NEM/Planning_and_Forecasting/NEFR/2016/AEMO-
insights_EV_24-Aug.pdf (sourced 22/2/17)
5
Swift, D. (2016) Market Trends and Outlook in Australia’s Electricity Markets, https://www.aemo.com.au/-
/media/Files/Electricity/NEM/Security_and_Reliability/ACES_Presentation.pdf
6
Nykvist, B. & Nilsson, M (2015) Rapidly falling costs of battery packs for electric vehicles, Nature Climate Change 5
(329-332).
18Figure 8 Cost predictions for electric vehicle battery packs are already out of date
5.1.4 Energy efficiency standards would be classified as renewable energy and
The Equipment Energy Efficiency qualify for generating extra revenue through
(E3) program is a cross jurisdictional program the sale of Large-scale Generation
through which the Australian Government, Certificates.
states and territories, and the New Zealand
Government collaborate to deliver a single, If there is an insufficient quantity of methane
integrated program on energy efficiency for electricity generation there may be
standards and energy labelling for equipment opportunities to use the waste heat from the
and appliances.7 methane flare for other purposes. This could
include evaporating the leachate from the
It enforces minimum energy performance landfill sites or drying out bio-solids from the
standards on a range of appliances. This helps nearby Surf Beach Sewage Treatment Plant
to ensure that, over time, as appliances are (STP). Both of these options could result in
replaced, they will use less power and deliver cost savings to Council.
incremental savings to Council.
In conjunction with this activity Council is also
5.1.5 Methane investigating the technical and economic
feasibility of a bio-gas plant at the Surf Beach
The Surf Beach and Brou landfill sites will
Sewage Treatment Plant (STP), which is
begin extracting methane from decaying
located next to the Surf Beach landfill site.
organic waste in 2017. This will be flared and
This may be able to harvest additional
converted into carbon dioxide (CO₂) in the
methane from the STP and then use the
short term. Burning the methane reduces the
landfill methane in a combined power
global warming potential of the gas by 25
generation plant.
times, and results in substantial emission
reductions. If there is a sufficiently reliable 5.1.6 Energy costs
volume of methane, there may be Wholesale electricity prices are expected to
opportunities to generate electricity. This remain above $80 per megawatt hour (MWh)
at least until 20208. This is significantly higher
7 8
http://www.energyrating.gov.au/ Australian Stock Exchange, (accessed 7/3/17)
Quarterly base futures prices,
19Draft Emissions Reduction Plan 2017-2021
than the current retail rate that Council costs, and improved industry capability and
currently pays. When Council’s current experience in installing large scale solar
electricity contract expires in 2018 it power. As this trend continues, the business
anticipates a large rise in base energy prices. case for large scale solar power plants will
These rising future costs in the electricity become increasingly attractive.
market will mean higher energy costs to
Council, but it will also make some Australian Renewable Energy Agency’s
opportunities more economically viable to (ARENA) CEO Ivor Frischknecht said the 2016
implement. funding round for large scale solar power
“clearly demonstrates how quickly large-scale
5.1.7 New energy trading models solar PV costs are falling… which has resulted
A number of opportunities are emerging in in rising confidence, lower finance costs and a
the way renewable or battery stored energy is more supportive market for power purchase
transacted and accounted for in the electricity agreements.”9
network. Examples include ‘peer to peer
trading’ which would allow homes and 5.2 Forecast emissions
businesses to sell excess solar power to As the population of Eurobodalla grows and
neighbours and peers rather than selling back requirements for services and facilities
into the grid. ‘Local generation credits’ or increase, emissions associated with these
reduced network charges, would place a value activities may result in an overall increase in
on generation that doesn’t have a high Council emissions. The growth in emissions
transmission and distribution cost and is used from new or expanding services and
locally. infrastructure can be minimised through good
planning and through pursuing other
These new financial models may be paired emissions reduction opportunities.
with smart energy meters and software that
can facilitate these transactions. Software Council’s future emissions will depend on a
that enables households and businesses to range of factors, including the policies
earn high value ‘grid credits’ by exporting to implemented by the NSW and Australian
the grid during times of peak demand is Governments, the trends and opportunities
already commercially available. presented by clean technology and the energy
market, and the internal decisions made by
If these opportunities are realised by the Council.
market and energy regulators, they may make
the business case for some renewable energy Greenhouse gas emissions have been
generation and battery storage projects more modelled for Council’s operations until 2030.
attractive. A number of factors have been considered
including:
5.1.8 Renewable energy costs The predicted future emissions intensity
The cost of installing large scale solar power of the electricity grid10
continues to decline. This has been due to
improving economies of scale reducing capital
http://www.asx.com.au/products/energy-
10
derivatives/australian-electricity.htm Australian Government, Department of Environment
(2015) Electricity Generation emissions projections
9
https://arena.gov.au/media/project-proposals-show- 2014-15, Chart 3.13 Excel.
shrinking-cost-big-solar/
20Emissions Reduction Plan 2017-2021
The predicted future growth rate in The impact of a Council renewable
electricity usage by business11 which energy target
accounts for improvements in energy The growth trend in waste disposed to
efficiency, business growth, uptake of landfill
solar and batteries. The assumption that all street lights
The impact of a national vehicle will be switched to LEDs within four
emissions standard scheme12 13 years
The impact of a 2030 Australian or
state renewable energy target
Forecast Council emissions
45,000
40,000
Tonnes CO2e/year
35,000
30,000
25,000
20,000
15,000
10,000
5,000
-
2023-24
2009-2010
2010-2011
2011-2012
2012-2013
2013-2014
2014-2015
2015-2016
2016-17
2017-18
2018-19
2019-20
2020-21
2021-22
2022-23
2024-25
2025-26
2026-27
2027-28
2028-29
2029-30
Figure 9 Forecast Council total emissions
Figure 9 shows Council emissions based on continue to be remain proactive in trying to
current actions with no changes to state or manage these emissions in managing the
national energy or carbon policies. It shows treatment of these materials. However,
emissions dipping as the impacts of the predicting the costs and likelihood of
energy performance contract, LED street implementing different options for addressing
lighting upgrade and methane flaring projects these emissions remains expensive and
take effect. Then there is a steady rise due to uncertain. For these reasons additional
a growing population and the continued trend opportunities to reduce these emissions
in waste disposed to landfill per capita. sources has not been modelled.
Council has a limited capacity to influence the Council has a higher capacity to influence and
behaviour of the community in what is manage the emissions from energy usage.
disposed to landfill and sewer, and There is also a higher economic incentive to
consequently the methane emissions manage these emissions due to the costs and
associated with these activities. Council will risks associated with energy costs. Reducing
11 13
Australian Energy Market Operator (2016) National Climate Change authority (Aug 2016) Towards a
Electricity Forecasting Report, pp20 Climate Policy Toolkit: Special Review on Australia’s
12
Department of Infrastructure and Regional Climate Goals and Policies, Commonwealth of
Development (Dec 2016) Improving the efficiency of Australia.
new light vehicles – Draft Regulatory Impact
Statement, Commonwealth of Australia.
21Draft Emissions Reduction Plan 2017-2021
these emission sources will reduce operating o Stronger NSW/National policies: assumes
costs to Council. This includes emissions from that a vehicle emissions standards scheme
fuel, electricity and gas. A range of scenarios is introduced in 2020, and that the
has been modelled looking at the impact that electricity grid transitions to 50%
various trends and opportunities will have on renewable by 2030.
Council’s energy emissions over the coming o 100% ESC renewable energy: builds on the
years. ‘stronger policies’ scenario but assumes
that Council sources 100% renewable
The scenarios modelled include:
energy by 2030.
o Current policies: assumes little further
interventions beyond current trends.
Forecast energy emissions
18,000
16,000
14,000
12,000
Tonnes CO2e/tear
10,000
8,000
6,000
4,000
2,000
-
Historical energy emissions Current policies
Stronger NSW/National policies ESC 100% renewable energy
Figure 10 Forecast Council energy emissions
As shown in Figure 10, historical energy depending on number of external factors as
emissions have already dropped by over 30% well as the opportunities realised by Council.
in recent years. This has been the result of
In the ESC 100% renewable energy scenario
various energy management and renewable
we see that a stronger policy setting
energy projects, as well as the gradual
supporting the introduction of vehicle
decarbonisation of the electricity grid. A
emissions standards and a cleaner fleet. With
range of emissions trajectories are possible
the transition to 100% renewable energy,
22Emissions Reduction Plan 2017-2021
Council can feasibly reduce its energy methane capture and flaring project at the
emissions by over 80%. two landfill sites, the energy performance
contract and LED street lighting upgrade, will
result in substantial cost reductions. In
5.3 Council emission reduction addition, progress towards the renewable
targets energy target will result in a cleaner electricity
In the 2012-2017 Greenhouse Action Plan supply and extra emission reductions for
Council committed to a 2020 emissions Council.
reduction target.
Figure 11 shows Council’s expected
CURRENT INTERIM TARGET: Reduce total greenhouse gas emissions in 2020 (in blue)
Council greenhouse gas emissions from due to the impact of upcoming emission
the 2005-06 baseline by 25% by 2020. reduction projects. A 25% emissions
reduction is expected to be achieved by 2020.
Council remains on track to meet this target. The red part of the graph shows what
Some key projects in 2017 including the emissions would have been, in a ‘business as
usual’ scenario, if no action had been taken.
2020 Emission reduction target
45,000
40,000
35,000
30,000
25,000
20,000
15,000
10,000
5,000
-
Emissions Business as usual emissions
Figure 11 Emissions reduction target
Having an emissions reduction target has Greenhouse gas emissions have been
helped Council to attract grant funding and modelled for Council’s operations until 2030
generate positive results in working towards a and demonstrate that it is possible to reduce
goal. The draft Emissions Reduction Plan will energy emissions significantly. A new target
operate beyond the current target year of has been established to reduce Council
2020. Therefore a new target will be adopted energy emissions from the 2005-06 baseline
as part of the plan. by 80% by 2030. This represents an
ambitious, yet realistic goal that would make
NEW TARGET: Reduce Council energy
a significant contribution towards addressing
greenhouse gas emissions from the
climate change.
2005-06 baseline by 80% by 2030.
23Draft Emissions Reduction Plan 2017-2021
This target includes all the emissions from standard. If the development of electric
fleet, street lighting, gas and electricity. It vehicles accelerates then there may be
does not include methane emissions from opportunities for greater cuts to fleet. Street
sewer or landfill. Methane emissions from lighting energy usage will be greatly reduced
these sources are a significant proportion of by LED upgrades and ultimately powered by
Council’s emissions. However, as a large part renewable energy. It would also depend upon
of these emissions are from old ‘legacy’ waste Council being able to source or generate
that has been deposited over the life of the 100% of its electricity from renewable energy.
landfills and because they are generated by a There is a level of uncertainty regarding
growing community population, they can be whether this will be feasible. Though, as
very difficult to manage and reduce. Council discussed in section 5.1 there is also
will continue to work on reducing emissions considerable cause for optimism, and time for
from these sources, but they have been emerging opportunities to develop into
excluded from the emissions reduction practical and viable solutions before 2030.
targets.
An 80% energy emissions reduction target by
Achieving this target can be realised by 2030 represents a responsible and necessary
improving the efficiency of the fleet, contribution towards minimising the threats
continued energy management programs and associated with climate change. It
transitioning to 100% renewable energy. demonstrates strong leadership by addressing
There is sufficient evidence to suggest that climate and energy needs now rather than
this will be achievable in this timeframe. leaving it for future generations. Committing
to a strong target places Council in a good
As shown in Figure 10 and 12 it is possible to
position to continue focusing on improving
achieve an 80% reduction in energy related
efficiencies and delivering energy, cost
greenhouse gas emissions by 2030. This will
savings and accessing potential grant funds.
depend upon improvements in fleet efficiency
driven by a national vehicle emissions
24Forecast energy emissions by type
18,000
16,000
14,000
Tonnes CO2e per year
12,000
10,000
8,000
6,000
4,000
2,000
-
Electricity Fleet Streetlighting Gas
Figure 12 Forecast emissions can be reduced by over 80% by 2030
NEW TARGET: Source 100% of section 6.6 there are a number of ways that
Council’s electricity from renewable this goal could be achieved. These options will
energy by 2030. be investigated as part of this plan and ample
time has been allowed to pursue this goal.
Only viable options, that demonstrate a
A critical part of reaching this target relies on positive economic return to Council, will be
sourcing 100% of Council’s electricity from implemented.
renewable energy sources. As outlined in
25Draft Emissions Reduction Plan 2017-2021
26Emissions Reduction Plan 2017-2021
6. Emissions Reduction The current ERP contains fewer concrete
projects than the previous GAP. There are
Plan more actions that involve investigation rather
The content of this Emissions Reduction Plan than implementation. Many actions that were
have been developed with input from
identified in the previous GAP have now been
Eurobodalla Shire Council staff, Councillors
completed such as a mass roll out of solar
and the community. The actions have been
power and energy efficiency lighting
prioritised and are practical and realistic with
the potential to achieve tangible results. They upgrades. Council recognises that we are
are grouped into the following categories: continually cycling through the continuous
Community improvement Plan–Do–Check–Act cycle, and
Energy Management new business cases need to be proven before
o Buildings some new opportunities and projects can
o Street lighting proceed.
o Water and Sewer
Council will not pre-empt the findings of any
Fleet
investigations and will not commit to
Leadership
Planning implement actions without a viable business
Renewable Energy case. However, should investigations prove
Waste fruitful and viable opportunities are
confirmed, the ERP outlines a process
Actions have been categorised as ‘core’ or whereby these opportunities can be realised.
‘new’ activities. Core actions are those that
Council has been doing for some time and will 6.1 Community
continue to do into the foreseeable future. Council has a role and responsibility in
These actions will continue to be progressed facilitating the community response to the
and integrated into the routine operations of issues associated with climate change. Council
Council. also manages the network of roads, footpaths
and cycle paths in the Shire and is well placed
Core actions have been included in this plan to support community efforts to reduce
to document the breadth of activities that reliance on emissions intensive transport. We
Council completes that are related to continue to deliver a number of core actions
reducing emissions. These actions will not be to support the community in reducing their
reported on during the life of the plan unless emissions. In addition to these actions,
there are significant changes or Council is also very active in reducing the
developments. emissions generated from waste disposed to
New actions that have been identified will be landfill by the community. These actions are
progressed and reported on throughout the documented in the Waste section of the plan.
life of this action plan.
Number Core action
27Draft Emissions Reduction Plan 2017-2021
C.1 Assist in providing climate change education and engagement programs in partnership with
community, and government organisations. Support and encourage climate change programs
for residents, businesses, the community and staff. Where community groups or state or
Australian Government programs provide such programs Council may assist in promoting and
facilitating uptake of the program. If opportunities arise, Council may be in a position to
deliver such programs.
C.2 Facilitate the development of emerging sustainable businesses and sectors in Eurobodalla.
This could include: support for emerging sectors; facilitation of training or workshops;
business incentives; support for establishment of community renewable energy ventures.
C.3 Support the development of local community renewable energy generation initiatives where
they are deemed appropriate and feasible.
C.4 Support efforts to preserve and increase local carbon farming activities. This may involve
supporting work by landholders and community groups to preserve existing bushland and
plant more trees. Support and education may be provided to landholders interested in
participating in other carbon farming initiatives that reduce on farm methane and nitrous
oxide emissions or increase carbon stored in soil. These activities maintain and increase the
amount of carbon stored in the environment.
C.5 Council will encourage the community to adopt sustainable technologies by raising
awareness about the availability of rebates and incentives offered by Local, NSW and
Australian Governments or by community organisations.
C.6 Continue to advocate for and support improved public transport linkages. Public transport
can be a more efficient means of travel and can reduce transport emissions.
C.7 Continue to develop an integrated network of bike lanes and shared paths as outlined in the
2017 Shared Pathway Strategy. Opportunities for grant funding will be investigated to
increase the roll out of shared pathways. Community groups will be supported in their
fundraising and building of pathways.
C.8 Continue to support the development of local health services to reduce need to travel.
Council will work actively to advocate and lobby for the provision of local services. This
includes health and other services that many Eurobodalla Residents currently travel out of
the Shire to access many specific services.
C.9 Promote the use of shared pathways to residents and visitors to the Shire.
Table 3 Core community actions
28You can also read