West Yorkshire Low Emissions Strategy 2016 to 2021 - Delivering Cleaner Air for All in West Yorkshire.
←
→
Page content transcription
If your browser does not render page correctly, please read the page content below
West Yorkshire Low
 Emissions Strategy
      2016 to 2021

                  Delivering Cleaner
                  Air for All in
                  West Yorkshire.

                  December 2016

                                    i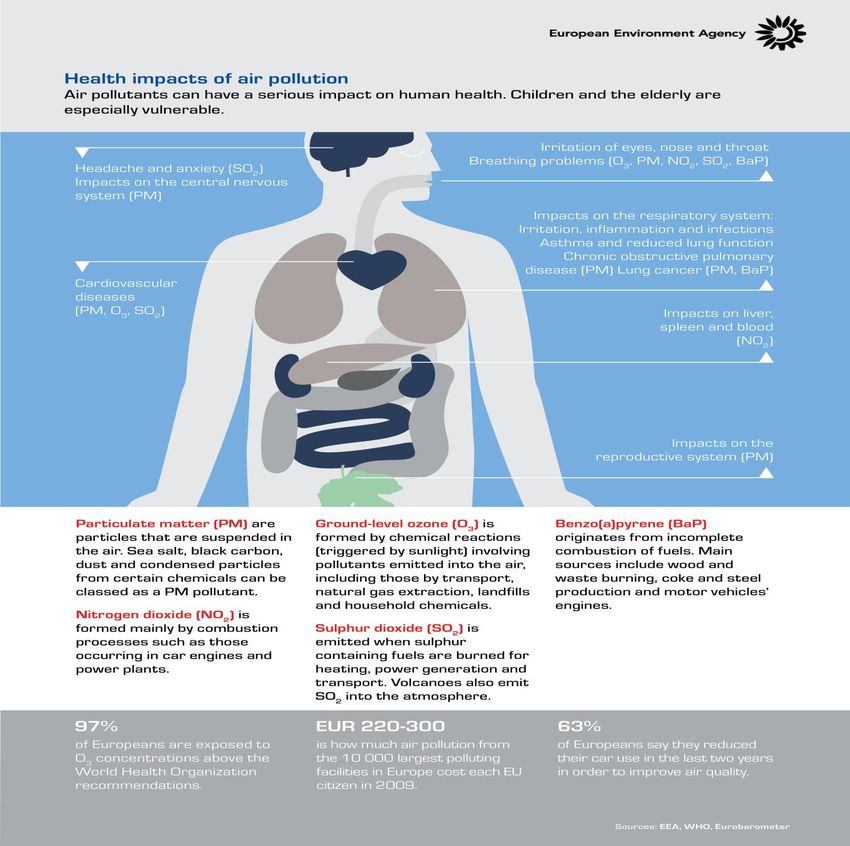
About the West Yorkshire Low Emissions Strategy
The West Yorkshire Low Emissions Strategy (WYLES) has been developed through collaboration between the
West Yorkshire local authorities (Bradford MDC, Calderdale MBC, Kirklees MDC, Leeds CC and Wakefield MDC);
West Yorkshire Combined Authority (WYCA) and Public Health England (PHE), with each organisation having an
input and contributing to the content of the Strategy.
Funded by the Department for the Environment and Rural Affairs (DEFRA) the WYLES project has been managed
by Bradford MBC, with technical support provided by Low Emissions Strategies Ltd. and Public Health England
and specific acknowledgements are given for their contribution into the development of this Strategy.
This Low Emissions Strategy outlines what the key challenges are in relation to air quality within West Yorkshire
and how, together, we can deliver cleaner air for all to create a healthier place for people to live, work and visit.
After considering the evidence which supports the need to improve air quality this Strategy then considers air
quality in the context of other key regional plans and strategies and how we can use these to Create a Low
Emissions Future, including consideration of the region’s economic and transport plans, changes in energy
production and use, land-use planning, supporting walking and cycling and finally how local authorities can lead
by example.
The Strategy then moves on to its main focus: Tackling Transport Emissions as pollution from transport causes
most local air quality problems. All transport modes are considered as each has a part to play, to a greater or
lesser extent, in delivering the necessary improvements to air quality.
The key aims and objectives are set out early within the Strategy document and will act as a reference point to
monitor progress towards achieving cleaner air for all. Finally, the delivery and funding arrangements are
considered and set out how, together with our partners, we will make the best use of existing funding and
access new funding streams and co-ordinate activity across West Yorkshire to make air quality better now and
for future generations.
Consultation
Public consultation on the draft WYLES was undertaken during November and December 2015 via an on-line
survey. The key messages taken from the consultation, together with direct feedback from other key
stakeholders were:
A more ambitious Strategy which has more “teeth” to improve air quality using Low Emission Zones /
Clean Air Zones.
A more focussed Strategy, with fewer, but more targeted objectives that will deliver the greatest
benefits to air quality.
Tackling emissions from the most polluting vehicles in towns and cities: buses, lorries and taxis.
Better public transport and greater support for walking and cycling, not just reducing emissions.
Linking in with other initiatives, such as green infrastructure, energy efficiency and carbon reduction to
improve air quality.
This feedback has been used to help shape the final version of the WYLES together with other key developments
such as the refresh of the Leeds City Region Strategic Economic Plan 2016 to 2036; the development of the West
Yorkshire Transport Strategy 2016 to 2036 and the Government’s Plan1 for improving air quality in the UK which
was published in December 2015. One other key development since the public consultation has been the UK
referendum result to leave the European Union in July 2016. It is far too early to say how this decision will affect
air quality policy at a national level, but as far as this Low Emissions Strategy is concerned, the fundamental
principle of protecting health through improved air quality remains un-changed and therefore, whether
operating outside or within a wider European framework, should not alter our strategic aims and objectives.
1
https://www.gov.uk/government/collections/air-quality-plan-for-nitrogen-dioxide-no2-in-uk-2015
ii
Foreword

West Yorkshire has a rich industrial heritage,
which has evolved and adapted over the decades         Cllr Val Slater
                                                       Deputy Leader & Health and Wellbeing
resulting in one of fastest growing economies in
                                                       Portfolio
the UK. We are also blessed with beautiful
countryside and majestic open spaces for both
residents and visitors to enjoy. There is much to be
proud of and levels of air pollution have much
improved over the decades, but we expect even
better air quality now and for future generations.
                                                        Cllr Dan Sutherland
The challenges are not insignificant. Reducing          Cabinet Member for Planning, Housing
                                                        & Environment
emissions from road traffic, particularly from older
diesel vehicles in towns and city centres, is our
greatest priority, but we need to recognise that
increased traffic can also be associated with the
need for more housing and more jobs for the
region. We are confident that collectively we can
achieve “good growth”, i.e. more and better            Cllr Peter McBride
homes and jobs and a vibrant economy, while at         Cabinet Member for Economy, Skills,
the same time reducing emissions and improving         Transportation and Planning
air quality.
The energy market is also changing, with a move
from large central power stations, to more
localised heat and power generation and the use
of renewable fuels and technology in order to meet
carbon reduction targets and tackle climate
change. Energy production closer to where people       Cllr Lucinda Yeadon
                                                       Deputy Leader and Executive Member for
live and work can deliver significant environmental    Environment and Sustainability
benefits, but we recognise that this can also
introduce localised pollution and has the potential
to negatively impact on air quality. We will ensure
that in responding to the changing energy market,
air quality will be preserved and protected.
There is no “silver bullet” to protecting and
improving air quality, which requires action at         Cllr Maureen Cummings
international, national, local and individual level     Portfolio Holder for Communities and
and on a range of areas including transport,            Environment
housing and economic development and changing
behaviour. The West Yorkshire Low Emissions
Strategy recognises our collective responsibility
and sets out what we can achieve in our respective
roles on behalf of the public which we serve to
make sure that air quality in West Yorkshire
continues to improve for a cleaner and healthier
place to live, work and visit.

                                                                                         iii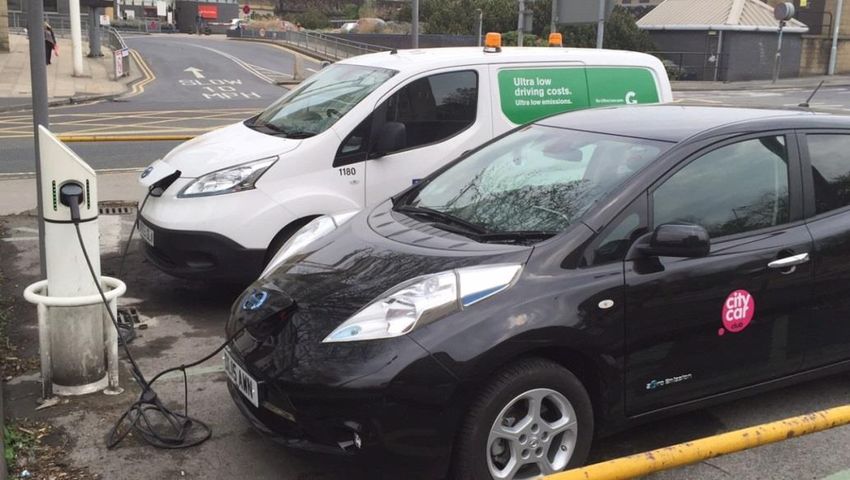
Our Key Messages:

                                                             Improvements in air quality over recent decades
                                                              have reduced the number of sudden air quality
                                                             events; e.g. the London ‘Smogs’. Nowadays the
                                                          health risks from air pollution are less visible as they
         Health effects associated with                    build up over a period of time. The high use of cars
          exposure to air pollution are                   and motor vehicles means that air pollution sources
    significant; more deaths are caused by                 are more numerous and widespread with peaks in
     air pollution than preventable liver or                air pollution occurring at rush hour times. Motor
    respiratory disease. In West Yorkshire,               vehicles are now the most significant contributor to
     5.1% of all deaths (1 in 20 deaths) are                poor air quality in West Yorkshire and around the
     caused by exposure to particulate air                                        country.
     pollution with up to 6% in some local
             authority areas. (2013).

                                               West Yorkshire Low
                                               Emissions Strategy
                                                 2016 to 2021

                                                                     Creating a place where people feel that
      Air quality shouldn’t be considered in isolation             public transport and active travel are the
         as an issue that can be purely addressed by                   best and easy choice and where the
         reducing emissions through technical fixes                remaining vehicles emit less pollution will
       (newer engines) and restrictive practices (low                 improve our health, our cities and our
       emission zones), it needs to also be seen as an              environment and make West Yorkshire a
        opportunity to encourage people to change                      better place to live and invest, thus
      their behaviour and become more active. 20%                    creating “good growth” for the region.
          of people in West Yorkshire are physically
      inactive so decreasing vehicle use, particularly
     for short journeys, both reduces air pollution and
       allows us to incorporate physical activity into
                   our normal daily routine.

                                                                                                                     iv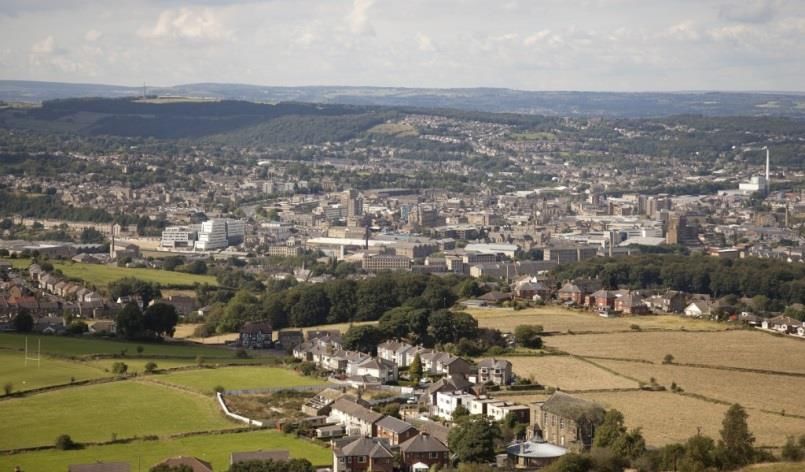
Contents
                                                                         Page
  1. Executive Summary                                                    1

  2. Vision, Aims and Objectives                                          9

  3. Introduction                                                         11

  4. Evidence for Change
         4.1    Health Impact                                             15
         4.2    Legal Context                                             20
         4.3    Air Quality in West Yorkshire                             23

  5. Creating a Low Emission Future
         5.1    Links with Other Strategies, Polices and Plans            26
         5.2    Leeds City Region Strategic Economic Plan 2016 to 2036    28
         5.3    West Yorkshire Transport Strategy 2016 to 2036 (Draft)    29
         5.4    Local Development Plans & Development Management          32
         5.5    Energy Production & Use                                   35
         5.6    Active Travel – Walking & Cycling                         38
         5.7    Leading by Example                                        41

  6. Tackling Transport Emissions
         6.1   Vehicle Emissions                                          43
         6.2   West Yorkshire Vehicle Emissions Plan (WYVeP)              46
         6.3   Passenger Cars                                             49
         6.4   West Yorkshire Electric Vehicle Strategy                   51
         6.5   Clean Air Zones                                            52
         6.6   Buses & Trains                                             54
               6.6.1     Buses                                            54
               6.6.2     Trains                                           58
         6.8   Freight                                                    60
         6.9   Taxis                                                      62
         6.10 Public Sector Fleet                                         63

  7. Funding & Delivery of the WYLES                                      65

  List of Abbreviations

                                                                                v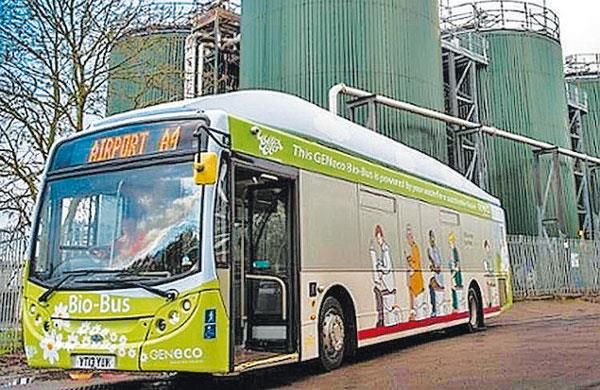
West Yorkshire Low Emissions Strategy 2016 – 2021 Executive Summary
1. Executive Summary
The West Yorkshire Low Emissions Strategy demonstrates the commitment of the West
Yorkshire local authorities, together with West Yorkshire Combined Authority and other key
stakeholders to work together to improve air quality for the benefit of all in the region. This
Strategy sets out the overall vision, aims and objectives which the WYLES intends to deliver
over the next five years. This Strategy document has four main sections:
Evidence for Change
Creating a Low Emission Future
Tackling Transport Emissions
Delivery and Funding of the WYLES
1.1. Evidence for Change
Most of West Yorkshire benefits from very good air quality and, overall, air quality has
improved relative to air pollution levels experienced by previous generations. However,
traffic in our urban centres and on busy roads result in levels of air pollution which have a
significant impact on the health of the population, with those having underlying health
conditions being most at risk. There are two pollutants of greatest concern: nitrogen dioxide
(NO2) and particulate matter (PMn), which have an adverse impact on health and are mainly a
caused by emissions from traffic, particularly exhaust emissions from older diesel vehicles.
Unlike the smoke and smog problems of the past, nitrogen dioxide and particulate matter
emissions are invisible, leading to a perception that the air is “clean”. However, fine
particulate matter is inhaled deep into the respiratory tract and, in the case of very fine
particles and nitrogen dioxide may transfer into the blood stream. A range of health
problems are attributed to exposure to high levels of nitrogen dioxide and particulate matter,
the most obvious being respiratory conditions, asthma and cardio-vascular disease, but
evidence is now also showing an association with cancer, strokes, low birth-weight babies and
even childhood development. These health conditions impact both on quality of life and life
expectancy. The Public Health Outcomes Indicator2 for air pollution points to the equivalent
of one in twenty deaths in West Yorkshire each year being attributable to poor air quality,
which equates to approximately 1,000 deaths annually and poor air quality has been
estimated to cost £16 billion to the UK economy.
Nitrogen dioxide and particulate matter, together with other air pollutants, have been set an
upper air quality limit value that the general population should not be exposed to and are
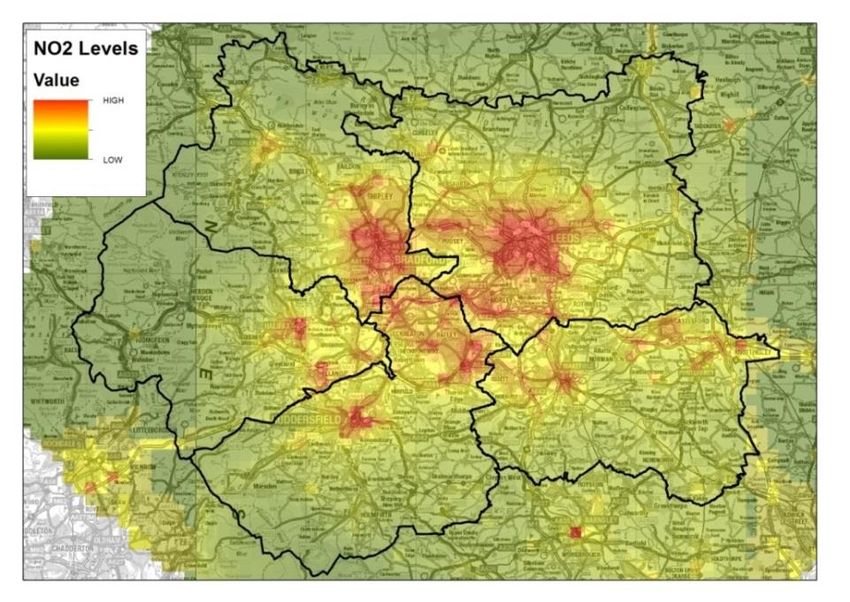
legally binding through EU and UK law. The urban areas of West Yorkshire have been
identified as having some of highest levels of nitrogen dioxide concentrations in the UK, with
only London showing higher levels at a regional level. Current projections indicate that
concentrations of nitrogen dioxide will not fall below the limit values in some parts of West
2
Public Health Outcomes Framework, 3.1 fraction of Mortality attributable to particulate air pollution, Public Health England
Page | 1
West Yorkshire Low Emissions Strategy 2016 – 2021                                Executive Summary

     Yorkshire until 2025 at the earliest unless urgent action is taken to reduce pollution in our
     towns and city centres and particularly the emissions coming from the most polluting
     vehicles: older diesel cars, vans, buses and lorries.

     Continued failure to meet the limit values will put the UK Government at risk of legal action
     being taken against it under European law, with the further risk of any fine imposed on the
     UK Government being passed down to local authorities if their action, or in-action, has
     contributed to the limit value being exceeded. In April 2015 the Supreme Court ordered the
     UK Government (Secretary of State for the Environment, Food and Rural Affairs) to produce a
     revised Plan setting out how it intended to meet the Air Quality Limit values in the shortest
     possible time and submit this to the European Commission by the end of 2015. This Plan was
     duly produced and introduced a number of measures intended to meet the air quality limit
     value for nitrogen dioxide. Perhaps the most significant aspect the Plan is the intention to
     require Clean Air Zones (CAZ) to be implemented within a number of cities in the UK where
     the air quality limits were not predicted to be achieved by 2020, including an area within the
     Leeds district. The CAZ is a means of regulating vehicles entering the Zone unless minimum
     emission standards are met, and for charges to be levied against vehicle owners that don’t
     meet the minimum emission standard. This form of vehicle control is similar to Low Emission
     Zones which already operate in some parts of the UK, but follow a standardised national
     framework. Clean Air Zones are discussed in further detail within Section 6 of this Strategy:
     Tacking Transport Emissions.

     It is too early to say how the UK referendum decision to leave the European Union will impact
     on the legal position with regard to the EU Air Quality Directive and the possibility of legal
     action outlined above, however, we recognise the underlying importance of reducing
     emissions to improve and protect public health and therefore we will continue with the
     ambitions and objectives of this Low Emissions Strategy irrespective of our relationship within
     the European Union.

    1.2. Creating a Low Emission Future

     This section recognises that reducing emissions and improving air quality does not sit in
     isolation from wider economic, social and environmental activity within the region and
     considers how the WYLES objectives fit, or may be at risk, from these other policy
     considerations and considers how we can ensure that air quality continues to improve as our
     economy and society develops in the future.

     The Leeds City Region Strategic Economic Plan 2016 to 2036 and the draft West Yorkshire
     Transport Strategy both offer significant opportunities to improve air quality, although it must
     also be recognised that economic growth, more housing and the potential for more traffic on
     our roads has the potential to make air quality worse unless this is considered at an early
     stage and action is taken to mitigate and reduce emissions. The Strategic Economic Plan
     includes ambitions to reduce carbon emissions and to improve resource efficiency, which can
     also benefit air quality and the objectives of the WYLES, for example through improved

                                                                                             Page | 2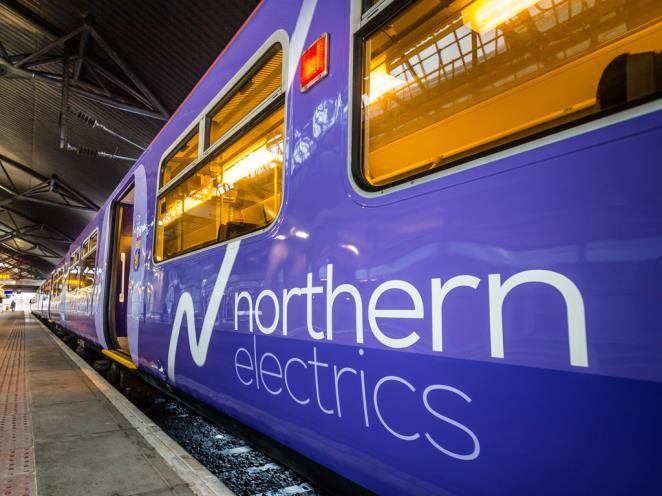
West Yorkshire Low Emissions Strategy 2016 – 2021                                Executive Summary

     resource efficiency, improving green infrastructure and further development of alternative
     fuels and technologies such as hydrogen, hydro-electric, wind and solar power. However,
     some carbon reduction initiatives have the potential to give rise to adverse impacts on air
     quality, such as decentralised energy production and the use of biomass fuels and it is
     therefore important that we recognise these potential conflicts and ensure any unintended
     consequences are identified and addressed at an early stage

     Given that the greatest impact on local air quality arises from road traffic the Draft Transport
     Strategy for West Yorkshire is extremely important to the delivery of the Low Emissions
     Strategy objectives. The draft Strategy incorporates many aspects which have the potential
     to improve air quality, including greater public transport provision, more attractive and safer
     places where walking and cycling become a natural part of everyday life as well as initiatives
     to reduce emissions from transport including buses, lorries, taxis and private vehicles.

     This section also considers the role of Planning in the development of Local Plans and
     determining individual planning applications. An important feature of the West Yorkshire
     Low Emissions Strategy has been the development an Air Quality and Planning Technical
     Guide which helps to inform developers, planners, consultants and air quality leads on how
     the air quality impact from developments can be assessed and mitigated against under the
     principles of sustainability and in accordance with national and local planning policies. The
     Guide uses the concept of the Damage Costs associated with the any increase in NOx and
     particulate emissions as a result of development proposal, requiring appropriate mitigation
     which proportionate to the scale and kind of development.

     This Low Emissions Strategy inevitably focuses on tackling emissions from transport, but we
     also recognise that emissions from energy production and use also contribute to overall air
     pollution. The energy sector is undergoing significant change, with a commitment to reduce
     the use of fossil fuels to help tackle CO2 emission reduction targets and tackle climate change.
     Although these changes are positive for the environment, we are also mindful of potential
     unintended adverse consequences for air quality which could arise from decentralising heat
     and power production, for example through Combined Heat and Power (CHP) plant, and
     Short Term Operating Reserve (STOR) generators which bring emission sources closer to
     where people live and work and also the use of alternative fuels such as biomass, wood-
     burning and energy from waste facilities. When considering new energy generating facilities,
     the potential impact on air quality will be considered through feasibility studies, planning and
     other regulatory controls.

     When considering how we shape the future to reduce emissions and improve air quality we
     must consider the roles which cycling and walking have to play: the ultimate forms of low-
     emission transport, which also deliver significant additional health benefits. We have seen
     significant increases in the number of people cycling and steady growth in the number of
     people walking as part of their travel and leisure activity. Cycling and Walking is set to
     continue to play a significant role and feature strongly within the West Yorkshire Transport
     Strategy, with particular emphasis on creating places not dominated by cars, but which are

                                                                                             Page | 3
West Yorkshire Low Emissions Strategy 2016 – 2021                                Executive Summary

     pedestrian and cyclist-friendly; developing transport hubs to better integrate cycling and
     walking as part of multi-modal travel arrangements; building on City Connect and Cycle
     Superhighway projects to develop cycling and walking infrastructure and maximises
     opportunities from the Government’s Cycling and Walking Investment Strategy to help bring
     further investment in cycling and walking into the region. Because active travel is so
     important, a separate Walking and Cycling Plan will be developed to support the West
     Yorkshire Transport Strategy and this will complement our ambition to create a low emission
     future.

     Finally, in this section we look at our own role and leading by example to reduce emissions
     from the vehicle fleets operated by local authorities; how we can support and encourage the
     people we employ to reduce their own impact on air quality by considering how they travel
     and using low-emission alternatives; and how we can encourage the suppliers of goods and
     service to reduce their emissions from out procurement policies.

    1.3. Tackling Transport Emissions

     In some parts of West Yorkshire, like many urban areas in the UK and other developed
     countries across the world, road traffic is having a significant impact on air quality. Factors
     such as the growth of diesel passenger cars and vehicle technology not achieving anticipated
     emission reductions has led to air pollution (NO2 in particular) remaining unacceptably high in
     some areas. This Strategy seeks to reduce emissions from all sectors of road transport,
     although buses, lorries, taxis and other diesel vehicles operating within towns are cities will
     be the focus of our attention in order to achieve air quality improvements as quickly as
     possible.

     This section looks at each of the main vehicle categories in turn, including passenger cars,
     buses, trains, freight transport, taxis and our own fleet vehicles, and considers what local
     authorities are able to do as part of a West Yorkshire Vehicle Emissions Plan (WYVeP) through
     regulatory means, infrastructure development, our influencing role and other support to
     achieve a reduction in transport emissions than would otherwise occur without such
     intervention.

     A very important feature of the WYVeP will be the mandatory introduction of the Leeds Clean
     Air Zone, which will regulate access of certain categories of vehicle to an area of Leeds
     dependant on the emission standard of the vehicle: targeting buses, coaches, taxis, HGVs and
     vans. In addition to the mandatory Leeds CAZ, we will consider whether Clean Air Zones will
     be necessary to reduce transport emissions in other parts of the region if air quality is found
     not to be improving through the implementation of the WYLES.

     Passenger Cars account for 78% of the 9.8 billion miles driven on West Yorkshire roads each
     year and they are a significant contributor to overall emissions which impact on air quality. In
     real-world driving conditions it has been shown that diesel cars can produce 22 times more
     particulate emissions and four times more NOx emissions than petrol cars and this, together

                                                                                             Page | 4
West Yorkshire Low Emissions Strategy 2016 – 2021                                 Executive Summary

     with a rapid growth in the number of diesel cars on our roads compared to a decade ago is
     one of the main reasons why air quality targets have not been achieved across the UK. This
     Low Emission Strategy will focus on reducing emissions from cars, by making it easier for
     people to switch to ultra-low emission alternatives, such as plug-in electric, hybrid and
     hydrogen fuel-cell power-trains and developing the necessary infrastructure to support this
     change. Although this is our main focus, this will also be supported by our wider strategic
     ambition to reduce the dominance of cars in our towns and cities and to create places which
     are more pedestrian and cyclist friendly and increasing public transport integration for
     example with increased park & ride / park & rail schemes.

     Buses provide a valuable public transport option and are part of the solution to air quality
     problems. However, buses, which are a type of heavy goods vehicle and predominantly run
     on diesel fuel, give rise to relatively high NOx and particulate emissions. It is also common for
     buses to be kept in operation for many years and therefore turn-over to newer buses which
     have more stringent emission standards can be relatively slow. These factors, together with
     the recognition that buses also operate in our towns and cities where air quality needs to
     improve the most, means that reducing emissions from a relatively small number of buses will
     yield the most significant air quality improvements and is therefore a key priority for the
     delivery of the Low Emissions Strategy.

     We are developing a Bus Strategy and supporting the bus industry through a Bus18 project
     which will accelerate a reduction in bus emissions through investment in new buses, fitting
     pollution abatement technology where appropriate, introducing the Eco Stars fleet
     recognition scheme and supporting alternative fuels and technologies including biomethane,
     electric and hybrid variants. These supportive measures, together with the introduction of a
     Clean Air Zone in Leeds and elsewhere if needed, will accelerate the reduction in bus
     emissions than would occur without such intervention.

     Trains, particularly those driven by diesel engines, can contribute to the overall air pollution,
     however their contribution is relatively insignificant in the region when compared to other
     transport modes such as buses, lorries, vans and (diesel) cars, particularly when considered in
     relation to the emissions per passenger carried. Trains are therefore considered within this
     Strategy principally as a means of helping to resolve air quality in towns and cities: the more
     people who are able to move away from cars, even if for part of their journey, will have a
     positive contribution to air quality. The draft West Yorkshire Transport Strategy 2016 to 2036
     will consider in further detail the significant role that trains will have in meeting our future
     transport needs and improving connectivity and capacity on local, regional and national rail
     network, including integration with HS2, further electrification of the rail network and better
     integration to facilitate multi-modal travel increased car-parking capacity and electric vehicle
     charging at railway stations and improving facilities to support cyclists to create door-to-door
     connectivity.

     Freight and commercial operations are a significant contributor to the West Yorkshire
     economy, taking advantage of the excellent links to the strategic highway to deliver goods

                                                                                              Page | 5
West Yorkshire Low Emissions Strategy 2016 – 2021 Executive Summary
and services nationally and internationally as well as within the region. Consequently, the
number of HGVs on the West Yorkshire road network contribute significantly to local and
regional air pollution. The Leeds Clean Air Zone will mean that lorries and vans will need to
meet newer (Euro VI/6) emission standards where the CAZ applies, which will accelerate a
reduction in emissions, but as well as a regulatory approach, this Low Emission Strategy will
also support the commercial sector to reduce emissions from their fleet operations, for
example by providing advice and training through the ECO Stars fleet recognition scheme, and
supporting trials and infrastructure for low emission alternatives including compressed
natural gas (CNG), liquefied natural gas (LNG), hybrid, electric and hydrogen fuel options.
Taxis (hackney carriage and private hire vehicles) are predominantly diesel cars or vans, with
the majority of journeys being within town and city centres and therefore contribute to local
air pollution issues. Taxis, like buses, lorries and vans, will be included in the class of vehicles
that will need to meet minimum Euro standards as part of the Leeds Clean Air Zone. The
West Yorkshire local authorities will also be using their influence when licensing hackney
carriages and private hire vehicles and contracting taxi transport services to improve vehicle
emission standards. These measures will accelerate a reduction in emissions coming from
taxis, but the role taxis play as part of the integrated transport network, particularly for
people with limited mobility, is also important and therefore we will continue to support the
role of taxis at transport hubs and encourage the uptake of ultra-low emission vehicle options
and the provision of dedicated electric vehicle charging infrastructure and allowing access to
bus lanes where appropriate.
Public Sector Fleet vehicles also contribute to local air pollution problems and it is important
that we play our part and also lead by example by doing all we can to reduce emissions from
the fleet vehicles which we operate. All fleet managers in local authorities are signed up to
the Eco Stars fleet recognition scheme and will reduce emissions from fleets through a
combination of upgrading fleets to the latest Euro VI emission standard and integrating the
use of alternative fuels and technologies, such CNG / LNG, hydrogen fuel cell and electric
vehicles where we can.
1.4 Funding and Delivery of the West Yorkshire Low Emissions Strategy
Accelerating the reduction in emissions and creating a low emission future will require
funding. This will be provided through a number of avenues including maximising
opportunities that arise from existing funding streams, such as Growth Deal funding used to
deliver objectives of the Strategic Economic Plan and the West Yorkshire Transport Fund used
to deliver the West Yorkshire Transport Strategy. New developments will also fund initiatives
to reduce emissions, such as improved cycling and walking provision and electric vehicle
charging infrastructure either directly as part of a development proposal, or indirectly
through contributions from Section 106 Planning Obligations or Community Infrastructure
Levy (CIL) arrangements. We will also work together to apply for new funding from grant
schemes, such as those administered by the Department for Transport, and seek
Page | 6West Yorkshire Low Emissions Strategy 2016 – 2021 Executive Summary
opportunities for private and public sector investment, for example in new low emission
infrastructure such as alternative fuels and technologies.
Delivery of the WYLES will be overseen by the West Yorkshire Transport & Health Board,
which has representation from Public Health England, West Yorkshire Combined Authority
and West Yorkshire district Environmental Health professionals and will in turn report on
progress through the governance arrangements of the West Yorkshire Combined Authority.
Progress in achieving the WYLES objectives will be monitored and reported through each local
authority and made available to the public and the WYLES will also be used to inform each
local authority’s Annual Status Report and development of Air Quality Action Plans as part of
their local air quality management duty.
Page | 7This Page is intentionally blank.
Page | 8West Yorkshire Low Emissions Strategy 2016 – 2021 Vision, Aims & Objectives
2. Vision, Aims and Objectives of the WYLES
Vision
Delivering Cleaner Air for all in West Yorkshire.
Aims
In working towards achieving the above vision the West Yorkshire local authorities together with
West Yorkshire Combined Authority will use this Strategy as a framework to achieve the following
aims:
Aim 1: Accelerate improvements in air quality, above that which would occur
without intervention, to achieve air quality limit values set out in law in all
parts of West Yorkshire by 2020 at the latest.
Aim 2: Working within the wider economic, social and environmental context for
West Yorkshire to create a Low Emissions Future that will maximise
opportunities to improve air quality, minimise risks of worsening air
quality and create healthier places to live, work and visit.
Aim 3: Immediate focus on tackling transport emissions, targeting interventions
that will deliver the most significant air quality improvements in the areas
of greatest concern.
Page | 9West Yorkshire Low Emissions Strategy 2016 – 2021 Vision, Aims & Objectives
`Objectives
The West Yorkshire local authorities (WYLA) and West Yorkshire Combined Authority (WYCA) will
work together to achieve the above aims and will commit to the following strategic objectives:
Ref: Objective:
A Clean Air Zone will be introduced within the Leeds district, and elsewhere
001
where necessary, to control emissions from the most polluting vehicles.
We will work with West Yorkshire bus operators to accelerate investment in
newer buses, emission abatement technology and alternative fuels and
002
technologies to reduce emissions through the implementation of the West
Yorkshire Bus Strategy and Bus 18 Project.
We will accelerate the uptake of plug-in electric cars and vans through
003 improved electric vehicle charging infrastructure and the implementation of
an Electric Vehicle Strategy.
We will introduce the Eco Stars fleet recognition scheme to support
004 businesses, bus operators and public sector fleet managers to reduce
emissions from their fleet operations.
We will work with our partners to develop infrastructure to support
005 alternative fuels and technology for transport including: natural gas, bio-
methane, LNG and hydrogen.
We will support the taxi industry to help the transition to low emission
vehicles including demonstrating economic benefits; supporting funding bids
006
and considering policy incentives to promote the uptake of ultra-low
emission taxis.
We will use the West Yorkshire Transport Strategy and Leeds City Region
Strategic Economic Plan to help deliver the WYLES objectives, including
007 improved cycling and walking provision; better public transport; low
emission energy production and use, and sustainable infrastructure to deliver
“Good Growth”.
We will use the West Yorkshire Air Quality and Planning Technical Guide to
008
deliver sustainable developments and deliver air quality improvements.
We will use our influence to promote low emission transport through the use
of the West Yorkshire Low Emission Procurement Guide in the procurement
009
of vehicles, goods and services and lead by example to reduce emissions from
our own fleet operations.
We will continue to raise awareness of the impact of poor air quality with the
public, policy makers and partners to improve air quality through changing
010
behaviour, influencing policy, access funding and working together to deliver
the objectives of this low emissions strategy.
Page | 10West Yorkshire Low Emissions Strategy 2016 – 2021 Introduction
3. Introduction
Breathing clean air, which does not adversely affect health, should be a basic requirement of any
society. Air quality has improved significantly over recent decades from the days when smogs and
smoke could be seen coming from chimneys in the region. Where visible smoke emissions, mainly
from domestic and industrial combustion processes, were once the major cause of concern, today
we face different, but no less significant challenges to our air quality although now the emissions
are largely unseen and mainly come from the traffic on our roads.
The “quality” of air describes its composition, i.e. the mixture of gases and fine particles in a given
volume of air (usually one cubic metre (m3)). These gases and particles are made up from the
millions of chemical, biological and physical reactions and processes that occur on a daily basis,
including those resulting from human activities that we have all become used to in today’s world,
such as driving a car, using public transport, generating heat and power, construction, agriculture,
manufacturing and transport of goods and services. Emissions from these activities, together with
the emissions from natural processes, add to the overall composition of the air we breathe.
Levels of air pollution are affected by a number of factors including the amount of primary pollution
produced at source and how this is then dispersed in the atmosphere. However, the effect or
impact that air pollution has depends on the level of exposure, (how much and for how long), and
the susceptibility of the person (or other organism) to the particular pollutant or pollution mix.
Air pollution at a particular location is made up from a number of different pollution sources, both
near and far, but generally the closer a person is to a pollution source and for a longer period of
time the more likely they are to be exposed to “poor” air quality. Figure 1 illustrates how air quality
becomes a problem due to “layers” of pollution building up from different sources. In rural or semi-
rural areas the levels of pollution may mainly come from distant sources and therefore air quality is
likely to be very good. In urban areas the amount of pollution from traffic and other sources can
add to general background levels and can result in an elevated “urban background” so that the
population living in that area is exposed to “poor” air quality. In other cases, although urban
background levels may be below threshold levels which impact on health, localised pollution
sources, for example a busy road or combustion plant can elevate the level of air pollution close to
that source resulting in a local “hot-spot” of poor air quality and only the population in the “hot-
spot” area will be affected.
Page | 11Figure 1 - How air pollution builds up in urban areas (illustrative only).
Pollution from:
Vehicles on individual roads / junctions
and local sources such as industry or
construction activity.
General urban traffic and contribution
from heat / power combustion
processes.
Wider strategic road network, power
stations, major industry, agriculture etc.
Natural processes: storms, volcanoes,
lightning, sea-salt, animal and plants
etc.West Yorkshire Low Emissions Strategy 2016 – 2021 Introduction
The World Health Organisation has considered over thirty different pollutants that contribute to air
pollution and recommended guideline values to help inform policy development for the protection
of public health. The most common pollutants, and the ones which are considered to be a priority in
terms of protecting public health, together with the WHO short-term and long-term guideline values
are listed in Table 1 below.
Table 1: Air Quality Guideline Values (WHO) 3
WHO Guideline Values
Short Term Long Term Exposure
Pollutant Exposure (annual mean)
Nitrogen Dioxide (NO2) 200 µgm-3 (24hr) 40 µgm-3
PM10 50 µgm-3 (24hr) 20 µgm-3
Particulate
Matter (PM) PM2.5 25 µgm-3 (24hr) 10 µgm-3
20 µgm-3 (24hr)
Sulphur Dioxide (SO2)
500 µgm-3 (10 min)
Not Required4
Ozone (O3) 100 µgm-3 (24hr)
Air pollution is monitored in the UK through a combination of measurement of pollutant
concentrations at different locations and using computer modelling based on calculated emissions
from various pollution sources. The results of this monitoring can be viewed on DEFRA’s ambient air
quality interactive map5, which provides data on background and roadside levels of air pollution. In
addition, local authorities also monitor air quality at a local level, so overall we have a have a good
understanding of the pollutants which are of concern and the sources of pollution which needs to be
addressed.
Of the pollutants listed in Table 1, the Guideline Values for Sulphur Dioxide is consistently being met
within West Yorkshire, largely as a result of a reduction in the use and content of sulphur containing
fuels, such as coal, and the introduction of Smoke Control areas by local authorities. Ozone is not a
primary source of pollution, but is produced through a photo-chemical reaction in the atmosphere
with other pollutants, and therefore Ozone pollution is greatly affected by the amount and intensity
of sunlight and the prevalence of other pollutants, such as Nitrogen Dioxide and Volatile Organic
Compounds (VOCs). Ground-level Ozone is not exceeding the WHO guideline values within West
Yorkshire, but there is a concern that levels may increase over time due the effect of climate change
and the changing concentrations of other primary pollutants. Action to reduce primary pollutants,
3
Air Quality Guidelines - Global Update 2005, World Health Organisation
4
The short-term exposure value is considered sufficient for the protection of health.
5
https://uk-air.defra.gov.uk/data/gis-mapping
Page | 13West Yorkshire Low Emissions Strategy 2016 – 2021 Introduction
such as Nitrogen Dioxide, and limit greenhouse gases, such as Carbon Dioxide, will also have a
beneficial effect in limiting Ozone production and therefore this Strategy, although not specifically
aimed at Ozone, will also seek to achieve outcomes which will have a positive benefit on ground-
level Ozone levels.
Levels of both Nitrogen Dioxide and Particulate Matter are exceeding WHO Guideline values in some
urban areas of West Yorkshire. Both pollutants are largely associated with combustion processes,
including internal combustion engine (ICE) vehicles (particularly those using diesel fuel), and the
generation of heat and power using fossil fuels. Poor air quality occurs in areas where a large
number of these combustion processes occur in close proximity to where people live and work – i.e.
in urban areas and near to busy roads.
Everyone in West Yorkshire has a role to play in improving air quality, including individuals,
businesses, public sector organisations and local and national Government. However, the West
Yorkshire local authorities together with West Yorkshire Combined Authority (WYCA) recognise their
collective role in shaping the region’s economic, social and environmental future through their
administrative and political decision-making powers and the allocation and use of public money.
This Low Emissions Strategy provides a strategic framework to help shape regional and local
strategies, policies and plans and demonstrate their commitment to ensure the people of West
Yorkshire can continue to enjoy cleaner air over the next five years and for future generations.
Page | 14West Yorkshire Low Emissions Strategy 2016 – 2021 Evidence for Change
4. Evidence for Change
4.1. Health Impact
The adverse health effects from short and long-term exposure to air pollution range from
premature deaths caused by heart and lung disease to worsening of respiratory symptoms (i.e.
asthma, chronic obstructive pulmonary disease (COPD, commonly known as chronic bronchitis),
which lead to a reduced quality of life and increased health care costs. There is also evidence
linking air pollution with lung and bladder cancer6, low birth weight babies7 and subsequent
neurodevelopment problems in children8. The main health effects associated with air pollution are
illustrated Figure 2 below:
Figure 2: Main health effects of air pollution (European Environment Agency)
6
Diesel Engine Exhause Carcinogenic, International Agency for Research on Cancer, WHO, 12 June 2012
7
Ambient air pollution and low birthweight: a European cohort study (ESCAPE), The Lancet v1, No9 p695 - 704, Nov 2013
8
http://bmjopen.bmj.com/content/6/6/e010004.full
15West Yorkshire Low Emissions Strategy 2016 – 2021 Evidence for Change
The two main pollutants of concern in urban areas of West Yorkshire are Nitrogen Dioxide (NO 2)
and Particulate Matter (PMn). The Committee on the Medical Effects of Air Pollutants (COMEAP), a
panel of independent experts, provide advice on the associated health risk from various air
pollutants based on the best available evidence. In 2015 COMEAP reported 9 that the evidence
linking exposure to NO2 concentrations and adverse health effects such as asthma, respiratory
conditions and increased cardiovascular risk has strengthened significantly over recent years and
DEFRA estimate that this has an effect on mortality equivalent to 23,500 deaths annually in the
UK10.
Particulate matter is the generic term used to categorise air pollution caused by very small particles
which arise from a range of sources and are categorised by the particle size (Figure 3).
Figure 3: Particle size relative to human hair.
PM10
PM2.5
PM0.1
PM10 – coarse particles (smaller than 10 microns / 0.01mm)
PM2.5 – fine particles (smaller than 2.5 microns / 0.0025mm)
PM0.1 – ultra-fine particles (smaller than 0.1 microns / 0.0001mm)
The small particle size means that that these pollutants are inhaled deep into the lung tissue and
ultra-fine particles can pass into the bloodstream and circulate around the body and may lodge in
tissue causing a disruption of function. Although much remains to be understood about the toxicity
of different particle sizes, chemical composition and particle structure, COMEAP reports 11 a clear
causal link between exposure to fine particulates and adverse impacts on health, estimated to have
an effect on mortality equivalent to 29,000 deaths, 340,000 life-years lost across the UK.
9
Statement on the Evidence for the Effects of Nitrogen Dioxide on Health, COMEAP (March 2015)
10
Improving air quality in the UK, Tackling nitrogen dioxide in our towns and cities, UK overview document, December 2015
11
Statement on the Evidence for Differential Health Effects of particulate Matter According to Source or Components, COMEAP (March 2015)
Page | 16West Yorkshire Low Emissions Strategy 2016 – 2021 Evidence for Change
Using Public Health England (PHE) methodology12 for assessing the health impact from particulate
air pollution it is possible to understand the impact on mortality levels at a West Yorkshire Level (for
PM2.5 fine particulate air pollution) (see Table 2). The figures show that an equivalent of one in
twenty deaths in West Yorkshire can be attributed to exposure to fine particulate matter alone,
which, when also taking into account the effect of other air pollutants, is likely to underestimate of
the true impact on health and mortality.
Table 2: Estimated Mortality from Exposure to Fine Particulate Air
Pollution in West Yorkshire (2013 data)
Equivalent number of
% Mortality
deaths per year
West Yorkshire (total) 5.0% 992
Bradford 4.7% 213
Calderdale 4.5% 86
Kirklees 4.8% 173
Leeds 5.0% 329
Wakefield 6.0% 189
Premature death is the ultimate health impact associated with air pollution, but poor air quality
particularly affects people with pre-existing respiratory and cardiac problems. It can be seen from
Table 2 that the number hospital admissions for asthma, coronary obstructive pulmonary disease
(COPD), and heart conditions (in this instance myocardial infarctions), in West Yorkshire are
considerably higher than those for England as a whole. If the incidence rates for England were to
apply in West Yorkshire there would be 678 fewer asthma admissions, 1,245 fewer for COPD and
463 fewer heart attacks. These figures give an indication of the levels of ill health and the size of the
‘high risk’ population that will benefit most from improvements in air quality in the region.
Table 3: West Yorkshire hospital admissions for Asthma, COPD and
Myocardial Infarction (MI) (2012/13 data)
Admissions per 1000 Additional admissions in
population West Yorkshire
West compared to England
England
Yorkshire overall
Asthma 1.39 1.09 678
COPD 2.63 2.07 1,245
Myocardial
1.39 1.18 463
Infarction
12
Estimating Local Mortality Burdens Associated with Particulate Air Pollution, Public Health England, 2014
Page | 17West Yorkshire Low Emissions Strategy 2016 – 2021 Evidence for Change
The mortality and morbidity effects of exposure to poor air quality can be translated into an
economic cost to society. It is estimated that air pollution imposes a cost of £16 billion13 per year in
the UK. HM Treasury together with DEFRA have developed guidance14 on how to quantify the
economic impact that policies, plans and projects have on air quality. The guidance uses annual
“damage costs” to quantify the impact of different pollutants from different sectors (Figure 4).
Figure 4: Relative Air Quality Damage Costs (PM and NOx) by Sector
Industrial Sector
Transport (average)
Waste
Agriculture Energy Industries
Domestic Sector
Transport accounts for the most significant economic impact on air quality with an average “cost” of
£44,430 and £25,252 per tonne of emissions for particulate matter (PM) and Oxides of Nitorgen
(NOx) respectively. This impact is even greater in urban areas, for example in urban conurbations,
such as large parts of West Yorkshire, the damage cost associated with transport rises to £107,965
and £61,365 per tonne for PM and NOx respectively.
The concept of damage costs associated with air quality is used later within this Strategy when
considering “good growth” and particularly in relation to new developments and the role of the
planning system to contribute to the achievement of sustainable development.
When considering interventions to reduce emissions and improve air quality, it is helpful to
understand and compare the relative impact of different interventions. Leeds and Bradford
Councils used this approach to help understand the health impact of introducing transport
13
https://www.gov.uk/guidance/air-quality-economic-analysis
14
Valuing impacts on air quality: Supplementary Green Book guidance, HM Treasury and DEFRA, May 2013
Page | 18West Yorkshire Low Emissions Strategy 2016 – 2021 Evidence for Change
initiatives to reduce emissions as part of a Low Emission Zone (LEZ) feasibility study15. Table 4a
summarises the estimated health benefit, in terms of actual health events being averted, if various
transport initiatives were introduced. A further parameter used by health professionals to compare
alternative health interventions is Quality Adjusted Life Years (QALY) which assigns a cost (or saving)
to NHS and Personal Social Services (NHS / PSS) for each life year that is lost (or saved) as result of a
particular health intervention.
The QALY framework was applied to the estimated health benefits arising from the LEZ study in a
report16 carried out by the University of York, Centre for Health Economics and concluded that the
QALY methodology should be applied when assessing interventions to improve air quality. A
summary of the NHS / PSS benefits associated with the transport interventions considered as part
of the LEZ study are summarised in Table 4b below.
Table 4a: Health Impact (Benefit) Associated with transport interventions modelled as part of a Leeds
and Bradford Low Emissions Zone Feasibility Study.
pre Euro IV Ratio of Petrol : 10%
pre Euro V
buses and Diesel cars to reduction in
Transport Intervention: buses to Euro
HGVs to Euro year 2000 levels car journeys
VI by 2021
VI by 2016 (50:50 to 80:20) by 2021
Number of
Number of Number of Number of
Cases
Health Event Pollutant Cases Averted Cases Averted Cases Averted
Averted per
per year per year per year
year
All-cause mortality PM2.5 15 18 18 19
Cardio-pulmonary
PM2.5 8 11 10 10
deaths
Coronary events
PM2.5 24 45 45 45
(Bradford only)
Low birthweight
PM2.5 12 14 14 15
babies (at term)
Low birthweight
NO2 19 38 45 37
babies (at term)
Pre-term birth PM2.5 3 4 4 4
Cases of childhood
NO2 254 506 596 494
asthma*
Table 4b: Estimated Cost Saving to NHS / PSS using QALY methodology.
Annual Saving £3.9m £5.5m £5.5m £5.7m
One-off Saving* £4.3m £8.6m £10.1m £8.4m
*One-off effect due to reduced prevalence of asthma – i.e. incidents no longer recur year on year.
This approach provides useful indicator of the magnitude of the impact which poor air quality has
on health and the associated costs in providing NHS and Personal Social Services and also the
benefits which targeted interventions, such as those considered as part of the LEZ feasibility study
for Leeds and Bradford, can have on the wider population.
15
Bradford Low Emission Zone Feasibility Study, Bradford Council Environmental Health Service, November 2014
16
A pharmacoeconomic approach to assessing the costs and benefits of air quality interventions that improve health: a case study, Lomas et al, BMJ Open,
April 2016
Page | 19West Yorkshire Low Emissions Strategy 2016 – 2021 Evidence for Change
4.2. Legal Context
Note:
This Strategy was drafted prior to the UK referendum on membership of, and
subsequent decision to leave the European Union and therefore this Section should
be read within this in mind. It is too early to say how this decision will impact on
the legal position with regard to the EU Air Quality Directive and domestic law and
the possibility of legal action outlined below, however, we recognise the underlying
importance of reducing emissions to improve and protect public health and
therefore we will continue with the ambitions and objectives of this Low Emissions
Strategy irrespective of our relationship within the European Union.
Although improving public health is the main driver for this Strategy, there is also a legal
requirement through European and domestic law to improve air quality. Air Quality Directive
2008/50/EC17 sets out the obligations for Member States in terms of assessing ambient air
quality and ensuring limit values for certain pollutants are not exceeded by a given target date.
These legal requirements have been transposed into domestic law18. The limit values and target
dates to be achieved for the two key pollutants of Nitrogen Dioxide and Particulate Matter are
set out in Table 4.
Table 4: Air Quality Directive 2008/50/EC - Limit Values and Target
Dates for compliance for Nitrogen Dioxide and Particulate Matter
Limit Value
Target Date
(annual mean)
Nitrogen Dioxide 40µgm-3 1st January 2010
PM10 40µgm-3 1st January 2005
Stage 1 25µgm-3 1st January 2015
PM2.5
Stage 2 20µgm-3 1st January 2020
It is worth noting that the limit values set out in the Air Quality Directive are influenced by the WHO
Air Quality Guideline Values (Table 1), but they are not the same, this is particularly the case for the
limit values for long term exposure to particulate matter, which are higher than the WHO Guideline
values. A review19 of the evidence on which the air quality guidelines are based has shown that
exposure to levels of particulate air pollution even below 10µgm-3 can have adverse health effects
and demonstrate that there is no safe threshold of exposure to fine particulate matter. In
recognition of this the Directive further requires Member States to achieve an exposure reduction
target for PM2.5, which for the UK means achieving an average exposure target of 11µgm-3 by 2020.
The Directive is therefore set in a legal and policy context to achieve improvements in air quality,
but compliance with the Directive itself is not an assurance that air pollution will be at a level which
will still not have any adverse health impact.
Each year DEFRA report on air pollution in the UK and compliance with the Air Quality Directive.
These reports provide information of background (at 1km2) and roadside air pollution levels. For
reporting purposes the UK is divided into 43 zones, one of which is the West Yorkshire Urban Zone.
17
DIRECTIVE 2008/50/EC on Ambient Air Quality and Cleaner Air for Europe, (21 May 2008)
18
Air Quality Standards Regulations 2010
19
REVIHAAP Project: Technical Report, World Health Organisation (2013)
Page | 20West Yorkshire Low Emissions Strategy 2016 – 2021 Evidence for Change
The latest DEFRA report20 indicates that in 2014 the limit value for PM10 and PM2.5 was being met
across the West Yorkshire Urban Area. More detailed consideration using DEFRA’s Ambient Air
Quality Interactive Map21shows significant parts of urban West Yorkshire and particularly areas near
to busy motorways and major roads are exceeding WHO guideline values and the 2020 exposure
target for PM2.5 of 11µgm-3. Therefore, although levels of fine particulate matter are currently
compliant with Air Quality Directive limit values, there is a continuing need to reduce particulate
emissions even further in order to sustain compliance with the Directive and to further protect
public health.
The current challenge for the West Yorkshire area in terms of compliance with the Air Quality
Directive is achieving the limit value for nitrogen dioxide. DEFRA’s annual report 16 shows that levels
nitrogen dioxide in parts of West Yorkshire, along with other major conurbations in the UK, were
exceeding the EU limit value in 2014 and therefore continuing to breach the target compliance date
of 2010.
The European Commission has commenced infraction proceedings against the UK Government for
failing to meet the limit value for nitrogen dioxide and has indicated that it would like [the UK
Government] “to achieve full compliance with existing air quality standards by 2020 at the latest”.
The implication being that continued failure to meet the limit value beyond 2020, could result in
further legal action and possible infraction fines against the UK Government. It is also recognised
that all public authorities have a role to play in improving air quality and DEFRA has written to all
local authorities seeking their co-operation in achieving compliance with the air quality limit values,
adding: “we feel we ought to remind you of the discretionary powers in Part 2 of the Localism Act
under which the Government could require responsible authorities to pay all or part of an
infraction fine”.
In April 2015, in a case brought by Client Earth22, the Supreme Court ruled that the UK Government
must submit new Air Quality Plans to the European Commission by the 31st December 2015 on how
it intends to achieve compliance with the limit value for nitrogen dioxide in the shortest possible
time. In December 2015 DEFRA duly published its Air Quality Plan for Nitrogen Dioxide in UK
(2015)23, including an overview document and specific plans for each zone, including the West
Yorkshire Zone Plan24. These Plans include an assessment of compliance with the limit value for
nitrogen dioxide for each zone for the baseline year of 2013 and projection for compliance by 2020
and 2025 if no new measures, other than those already proposed, were to be implemented. The
West Yorkshire Urban Zone, is one of eight in the UK where the annual mean limit value for
nitrogen dioxide is predicted not to be achieved by 2020 unless additional measures as outlined in
the Plan are implemented, which include the mandatory introduction of a Clean Air Zone (CAZ)
within Leeds to control emissions from buses, coaches, taxis, HGVs and light goods vehicles (LGVs)
together with additional measures such as traffic management, promoting alternative travel
options and the use of alternative, low emission fuels and technology.
20
Air pollution in the UK 2015, DEFRA (September 2015)
21
https://uk-air.defra.gov.uk/data/gis-mapping
22
R (on the application of ClientEarth) (Appellant) v Secretary of State for the Environment, Food and Rural Affairs (Respondent) [2015] UKSC 28, 29 April
2015
23
Air Quality Plan for Nitrogen Dioxide in UK, DEFRA (2015)
24
Air Quality Plan for the achievement of the EU air quality limit value for nitrogen dioxide (NO2) in West Yorkshire Urban Area (UK0004), DEFRA, December
2015
Page | 21You can also read