ATMOSPHERE TOWARDS A PROPER STRATEGY FOR TACKLING GREATER MANCHESTER'S AIR POLLUTION CRISIS - IPPR
←
→
Page content transcription
If your browser does not render page correctly, please read the page content below
Institute for Public Policy Research

ATMOSPHERE
TOWARDS A PROPER
STRATEGY FOR TACKLING
GREATER MANCHESTER’S
AIR POLLUTION CRISIS

"Walk in silence

Don't walk away,
in silence

See the danger

Always danger"
                                         Ed Cox and
         Joy Division                  Dom Goggins
                                            June 2018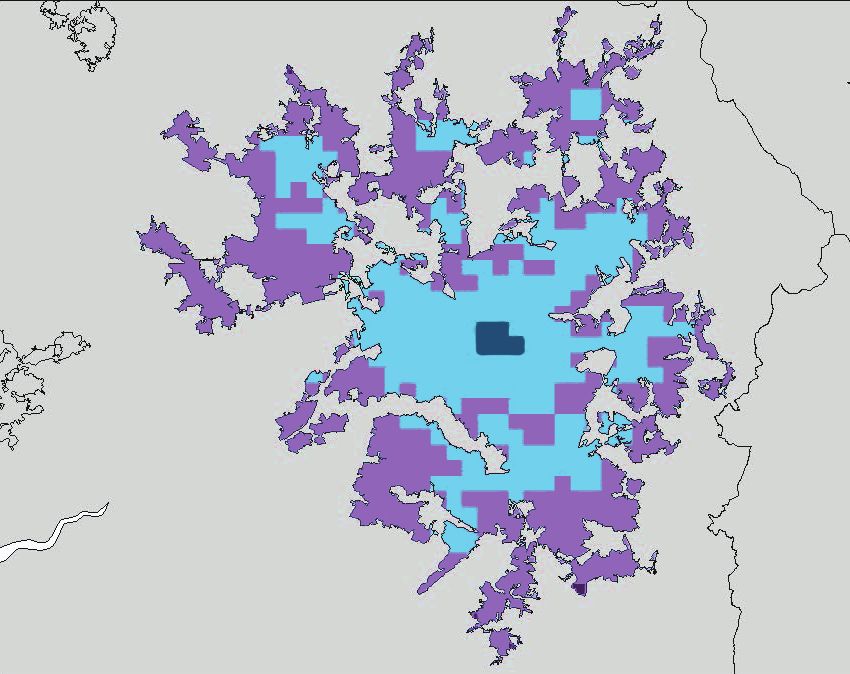
ABOUT IPPR NORTH
IPPR North is the dedicated think tank for the north of England, with
bases in Manchester and Newcastle.
IPPR, the Institute for Public Policy Research, is the UK's leading
progressive think tank. We are an independent charitable organisation
with our main office in London. IPPR Scotland is based in Edinburgh.
IPPR's purpose is to conduct and promote research into, and the
education of the public in, the economic, social and political sciences,
science and technology, the voluntary sector and social enterprise,
public services, and industry and commerce.
20th Floor
City Tower
Piccadilly Plaza
Manchester
M1 4BT
T: +44 (0)161 694 9680
E: north@ippr.org
www.ippr.org/north
Registered charity no: 800065 (England and Wales),
SC046557 (Scotland)
This paper was first published in June 2018. © IPPR 2018
The contents and opinions expressed in this paper are those of the
author only.

The progressive policy think tank
CONTENTS

Summary...........................................................................................................................3
   Key findings........................................................................................................ 3
   Key recommendations..................................................................................... 4
1. Introduction.................................................................................................................5
2. Air quality in Greater Manchester.......................................................................... 7
   2.1 What is air pollution?................................................................................. 7
   2.2 Air quality statistics in Greater Manchester........................................ 10
   2.3 Health impact of air pollution in Greater Manchester.......................17
   2.4 Air pollution and asthma........................................................................ 20
   2.5 Snapshot montoring around Greater Manchester............................. 20
3. Air quality policy and its critics............................................................................23
   3.1 National policy context............................................................................ 23
   3.2 Air quality policy in Greater Manchester............................................. 25
4. What can be done? Air quality measures and their impact......................... 28
   4.1 Approaches from elsewhere................................................................... 28
   4.2 Measures for tackling air pollution in cities....................................... 30
   4.3 Modelling the impact of pollution reduction measures................... 31
   4.4 Measures for Greater Manchester......................................................... 32
5. A roadmap for Greater Manchester.....................................................................35
   5.1 A timetable for change............................................................................. 35
   5.2 Our recommendations for urgent action............................................. 35
6. Conclusions: Going to the top of the league.....................................................37
References.................................................................................................................... 38

     IPPR NORTH | Atmosphere Towards a proper strategy for tackling Greater Manchester's air pollution crisis                         1
ABOUT THE AUTHOR
Ed Cox is the former director of IPPR North.
Dom Goggins is a freelance consultant working on environmental policy, and a
member of the Manchester Climate Change Board.
ACKNOWLEDGEMENTS
The authors would like to thank the European Climate Foundation and ClientEarth
for supporting this work. We are particularly grateful for the advice and support
of Joss Garman at ECF, Peter Abel at Manchester Friends of the Earth, and Polly
Billington and Jason Torrance at UK100.
We would like to thank David Dajnak, Heather Walton, James David Smith and Sean
Beevers at King’s College London for their meticulous work on Greater Manchester’s
first ever health impact assessment, Dr Jo Barnes at the University of the West of
England for advice on PCM modelling, and Sam Longman at Transport for London for
advice on modelling mitigation measures.
And finally we would like to thank colleagues at Transport for Greater Manchester
for their support explaining Greater Manchester’s current approach.
The authors of the report would like to highlight that it does not necessarily
represent the views of those who have supported and given their time and
expertise to inform this research. Any errors that remain, and the analysis and
conclusions of the report, are the authors’ own.
Download
This document is available to download as a free PDF and in other formats at:
http://www.ippr.org/publications/atmosphere
Citation
If you are using this document in your own writing, our preferred citation is:
Cox E and Goggins D (2018) Atmosphere: Towards a proper strategy for tackling Greater Manchester's air
pollution crisis, IPPR. http://www.ippr.org/publications/atmosphere
Permission to share
This document is published under a creative commons licence:
Attribution-NonCommercial-NoDerivs 2.0 UK
http://creativecommons.org/licenses/by-nc-nd/2.0/uk/
For commercial use, please contact info@ippr.org
2 IPPR NORTH | Atmosphere Towards a proper strategy for tackling Greater Manchester's air pollution crisisSUMMARY 60-SECOND SUMMARY The levels of air pollution in Greater Manchester are lethal and illegal. In groundbreaking new analysis, King’s College London (KCL) has estimated that 1.6 million life years will be lost in Greater Manchester in the coming century due to its poisonous air. This is equivalent to each of us having our life expectancy reduced by six months. Using the 2011 baseline, NO2 pollution alone was estimated to have caused up to 1,781 premature deaths in Greater Manchester and particulate matter pollution up to 1,906 premature deaths. Devolution allows the Greater Manchester mayor to take responsibility for this clean air agenda and do more, much more quickly, but national government must act urgently too to give the mayor the tools necessary to save lives and the £1 billion annual cost to the Greater Manchester economy. KEY FINDINGS While so much attention is given to air pollution in London, Greater Manchester (GM) in fact has the highest rates of emergency admissions to hospital for asthma in the whole country – Central Manchester and North Manchester NHS trusts have emergency admissions at double the national average. And evidence shows that the most vulnerable people and those living in disadvantaged areas are at greater risk from air pollution. A recent World Health Organization (WHO) study shows Manchester to be the second-worst council in England for PM10 pollution (London lies 22nd). Three out of five sites in Greater Manchester monitoring the more worrying PM2.5 pollution currently exceed WHO ‘safe limits’. The cost to the Greater Manchester economy is huge. The KCL study shows that air pollution is costing between £1 billion and £1.2 billion with every single local authority area affected. Although government and the Greater Manchester combined authority recognises the general problem and is taking incremental steps to be legally compliant, there is little recognition of the scale or urgency of Greater Manchester’s crisis. Government modelling – based on just five monitoring sites for the whole city region – badly underestimates the extent of the problem and the prevalence of local hotspots. Greater Manchester’s Clean Air Plan is focusing on a handful of congested road ‘links’, but more extensive analysis shows a much wider problem across the whole city. Despite government predictions of a steady reduction in NO2 emissions, local authority data shows NO2 levels in Greater Manchester are relatively static with nine out of 10 Greater Manchester council areas having monitoring sites showing annual averages above legal limits of 40 micrograms per cubic metre (µg/m3) with some reaching over 65µg/m3. There are also notorious hotspots with staggering exceedances which are not captured by annual average figures. At the Manchester Oxford Road monitoring station, levels of 200µg/m3 were exceeded no fewer than 90 times during 2016. IPPR NORTH | Atmosphere Towards a proper strategy for tackling Greater Manchester's air pollution crisis 3
Local snapshot monitoring over two- to four-week periods also reveals the fact
    that annual averages are masking the extent of NO2 pollution on busy shopping
    streets, outside schools and in other densely populated areas.

    In Greater Manchester a Low Emissions Strategy and an Air Quality Action Plan
    have identified a wide range of activities to address air quality problems including
    measures to reduce congestion, encourage electric vehicles and the use of
    public transport, and make changes to the bus and local authority vehicle fleet.
    But current measures seem too little too late. IPPR North analysis suggests that
    current measures being considered are unlikely to reduce NO2 emissions by more
    than 7.5 per cent.

    Urgent action needs to be taken concerning Greater Manchester’s heavily polluting
    bus fleet. In GM over 20 per cent of all buses fall into the most polluting Euro 2–3
    emission standard – in London this figure is just 12 per cent. In London 37 per cent
    of all buses are electric or meet Euro 6 standards, in Greater Manchester this is
    just 10 per cent.

    Even to achieve legal compliance Greater Manchester will need to begin restricting
    access to the city centre or introducing some form of charging clean air zone in the
    immediate future. But legal compliance alone will do little to save many lives and
    reduce the costs to the public purse and the wider economy.

    KEY RECOMMENDATIONS
    Devolution allows the Greater Manchester mayor to take responsibility for the
    clean air agenda and do more, much more quickly. With the clear objective of
    achieving legal compliance by 2020, this report calls on the mayor to speed up the
    introduction of already planned measures and introduce a charging zone for buses
    and HGVs and a workplace parking levy scheme by June 2019.

    Beyond this, this report urges the mayor to pledge to transform Greater
    Manchester into one of the UK’s cleanest cities by 2024 introducing a wider
    Charging Clean Air Zone and other temporary traffic restrictions with a view to
    reducing emissions by at least 40 per cent across the city. These commitments
    would allow the mayor to pledge that by 2028 Greater Manchester will finally
    be able meet its commitment to be a WHO BreatheLife city. This would include
    a Class D CAZ with car-free Manchester days, cycle-only streets and many
    car-free neighbourhoods.

    In return for such pledges, the Greater Manchester mayor – together with the
    mayors of Birmingham, Liverpool, London and other city leaders – should
    demand more urgent action from central government. This must include a Greater
    Manchester Clean Air Devolution Deal as part of a much more generous Clean Air
    Fund; a national, targeted diesel scrappage scheme; and a more robust national
    framework for monitoring, modelling and health impact assessment.

    Air pollution is a complicated, hidden killer and tackling it takes strong political
    leadership and tough choices. This report aims to show that, where progress
    is achieved, all sections of society are engaged in solutions. And so finally we
    recommend that the mayor establishes a Clean Air Taskforce, with representation
    from public services, business, civil society and most importantly citizens. The
    taskforce would advise and support the mayor with the long-term goal of making
    Greater Manchester’s air among the cleanest in Europe.

4   IPPR NORTH | Atmosphere Towards a proper strategy for tackling Greater Manchester's air pollution crisis
1. INTRODUCTION Air pollution is now one of the greatest causes of global public health concern as its impact has become more widely known and understood. According to the World Bank, globally air pollution accounts for around 1 in 10 deaths (WB & IHME 2016). It is an uncontested fact that many parts of the UK suffer from illegal levels of air pollution. The annual mortality burden is equivalent to 40,000 deaths, while the economic cost is estimated to be over £20 billion every year (RCP 2016). Despite the widespread incidence of air pollution, the overwhelming focus of attention in the UK has been in the capital, London. As the biggest and most congested city in the UK this is hardly surprising. Air pollution in the capital has been estimated to cause the equivalent of up to 9,000 deaths – nearly one quarter of the national estimate (Walton et al 2015). There is a rich and varied literature on London’s air quality crisis ranging from academic studies, thinktank reports, government reports, and local strategies and tools such as the London Atmospheric Emissions Inventory place the city at the cutting edge of research and policymaking in attempting to cut harmful emissions. Air pollution, however, is a significant problem in many other UK cities too. In a recent World Health Organization (WHO) report on ambient air pollution, 31 towns and cities across the UK have been identified as exceeding WHO limits for particulate matter with Salford and Manchester ranked third and fifth worst respectively, compared with London which lies 22nd. The UK government has identified 80 local authority areas where nitogen dioxide (NO2) emissions are above legal limits and demanded that 45 of these should take urgent action to achieve compliance with EU law. Each of these places is now in the process of developing a clean air plan, with some going further than others in recognising the scale and significance of their local problems as well as attempting to comply with the letter of the law. In comparison with London, however, few have the data analysis, the strategic thinking and coordination or the public leadership and awareness seen in the capital. This has to change. Greater Manchester, England’s largest economic region outside London, suffers from similar air pollution challenges to the capital. Citizens are exposed, some die prematurely and the health of many more is affected. Along with the human cost, this creates a significant economic impact both in terms of costs to public services and damage to the wider economy. But unlike London, Greater Manchester lacks the strategies and a system to tackle air pollution. The Air Quality Action Plan and it’s emerging Clean Air Plan have much to commend them, but, overall, air pollution data in Greater Manchester is not as complete or as well understood as in the capital. This has affected public awareness and, in turn, the extent to which tackling air pollution is seen as a local priority. More radical and urgent action is necessary. In this report we set out the size and scale of Greater Manchester’s air pollution problems with a new analysis of its devastating impact on the health of its residents all around the city region. We consider both national and local approaches to tackling this emergency and explore proposed measures to reduce air pollution levels and bring them within legal limits. However, we also set out a more radical IPPR NORTH | Atmosphere Towards a proper strategy for tackling Greater Manchester's air pollution crisis 5
package of measures that will not only achieve legal compliance, but might put
    Greater Manchester on the map as a leading city on the international stage with
    some of the cleanest air in any city across the whole of Europe.

    We have written this report not because it is our job, but because Greater Manchester
    is our home. We love it, we live here, it’s in our blood. Our own government knows that
    the air we breathe is dangerous, but not enough is being done to raise awareness
    of this or to tackle it with sufficient urgency. We don’t think ths is good enough for
    us or for our own children. We think people in Greater Manchester deserve better,
    and we think the institutions that govern us – both locally and nationally – can do
    more. We hope that this report can be part of inspiring them to act.

6   IPPR NORTH | Atmosphere Towards a proper strategy for tackling Greater Manchester's air pollution crisis
2.
AIR QUALITY IN
GREATER MANCHESTER
CHAPTER SUMMARY
• The main forms of air pollution (PM10, PM2.5 and NO2) come from road
transport and have a serious impact on human health – ‘safe limits’ are
therefore regulated by the European Commission and the World Health
Organization and adopted into UK law.
• Air quality policy in England is currently based upon ‘pollution climate
mapping’ (PCM) which suggests NO2 levels in Greater Manchester will fall
within UK legal limits by 2022 with no ‘additional’ action – however, the PCM
model depends upon limited data sources and typically underestimates
pollution levels.
• Even using PCM modelling, the predicted ‘life years lost’ (mortality impact) of
current levels of air pollution is 1.6 million life years lost by 2134 costing the
Greater Manchester economy approximately £1 billion per annum.1
• More detailed local authority monitoring shows NO2 levels in Greater
Manchester are relatively static with nine out of 10 Greater Manchester council
areas having monitoring sites showing annual averages above legal limits for
micrograms per cubic metre (µg/m3) with some reaching over 65µg/m3–25µg/
m3 above the legal limit.
• A recent WHO study shows Manchester to be the second-worst council in
England for PM10 pollution (London lies 22nd). Three out of five sites in Greater
Manchester monitoring the more worrying PM2.5 pollution currently exceed
WHO ‘safe limits’.
• Given the poor air quality, it should not be a surprise that Central Manchester
and North Manchester NHS trusts have the two highest rates for emergency
admissions for asthma in the whole of the UK.
2.1 WHAT IS AIR POLLUTION?
Air pollution is the general term given to a wide range of airborne substances that
can lead to adverse environmental effects and can have severe health impacts
both at the local level but also over much wider areas.
There are two broad types of air pollutant: particulate matter in the form of minute
particles of dust and liquid droplets suspended in the air; and a wide range of gases
including nitrogen oxides, sulphur dioxide, ozone, carbon monoxide and benzene.
The focus of most public health debate at the present time lies with nitrogen
oxides and particulate matter as these present the greatest cause for concern due
to their high levels in many towns and cities around the world. Table 2.1 describes
their main sources and health impacts.
1 2134 is a lifetime after the final figure for projected pollution concentrations in 2030.
IPPR NORTH | Atmosphere Towards a proper strategy for tackling Greater Manchester's air pollution crisis 7TABLE 2.1
The main source of pollutants and their impacts on public health
Pollutant Main source Health impact
Linked to asthma, lung cancer, respiratory and
cardiovascular diseases, infant mortality and
Particulate matter Transport (exhaust,
tyre and brake wear), low birth weight.
Typically referred to as combustion, industrial
PM exposure can also lead to growth stunting
particles under 10µm processes, construction,
and mortality in plants and certain forms
in diameter (PM10) demolition, natural
contribute to global warming.
and fine particles sources. Also created
less that 2.5µm in by the interaction of PM2.5 is a more serious health concern since
diameter (PM2.5). other pollutants. smaller particles can travel more deeply into
the lungs and cause more harmful effects.
NO2 exposure can lead to lung irritation,
decrease lung function and increase chances
Nitrogen oxides of respiratory infection. Long-term exposure
is associated with low-birthweight babies and
Generally referred to excess deaths.
Transport, combustion.
as NOX but includes
nitric oxide (NO) and NO and NO2 are precursors to the formation
nitrogen dioxide (NO2) of ozone and acid rain. NOX can also be
deposited into fresh water and land harming
biodiversity in sensitive sites.
Adapted from Howard, Up in the Air (Howard 2015)
Sources of air pollution
There is relatively little accurate data on the sources of air pollution in
different towns and cities outside London, although it comes mainly from
road transport. Perhaps the most detailed data comes from a 2010 analysis
of the London Atmospheric Emissions Inventory (LAEI). This showed that
while 82 per cent of NOX pollution in London was generated within London,
75 per cent of PM pollution came from outside the city. Road transport
was responsible for almost half of NOX and PM pollution, although the
modelling is likely to underestimate this source. Buses, HGVs and taxis
play a significant role in NOX emissions with vans contributing especially
to PM10. Around 60 per cent of PM10 pollution from road transport can be
attributed to tyre and brake wear and tear. Domestic and non-domestic gas
combustion also make significant contributions to NO2 emissions. Non-
road mobile machines (NRMM) contribute about 10 per cent of NOX and
PM10 emissions in Greater London.
In the absence of any more accurate data, it can probably be assumed
that there will be a similar pattern in similar monocentric cities such as
Greater Manchester.
It is important to note that the impacts of air pollution are not equally distributed.
There is evidence to show that health impacts fall disproportionately on children
due to schools often being located near busy roads (Howard 2015). There is
also evidence to show that air pollution exposure is disproportionately high for
deprived communities and particular ethnic minorities (Vaughan 2016).
In response to the negative consequences of air pollution, the World Health
Organization (WHO) has published air quality ‘guideline values’ for concentrations
8 IPPR NORTH | Atmosphere Towards a proper strategy for tackling Greater Manchester's air pollution crisisof these main pollutants. In turn, the European Commission has issued a number
of directives which establish standards for key air pollutants.
TABLE 2.2
World Health Organization and European Commission air pollution concentration limits
Permitted
Pollutant Averaging WHO ‘safe
Limit exceedances Deadline
name period limits’
(per year)
As per EU
1 hour 200 µg/m3 18 January 2010
values
NO2
As per EU
1 year 40 µg/m3 N/A January 2010
values
January 2005 extended As per EU
1 day 50 µg/m3 35
January 2011) values
PM10
1 year 40 µg/m3 N/A January 2005 20 µg/m3
1 year 25 µg/m3 N/A January 2015 10 µg/m3
PM2.5
1 year 20 µg/m3 N/A January 2020 10 µg/m3
Source: European Commission, ‘Air Quality – Existing Legislation’ (EC 2016)
Notes: concentration limits are expressed either in the form of an annual average concentration or as a restriction on
the number of ‘exceedances’ over shorter time periods in a whole zone.
It is important to note, however, that in the case of particulate matter (PM),
the EC concentration limits are not as stringent as those of the World Health
Organization, because both WHO and the Royal College of Physicians have
cautioned that as even the very tiniest concentrations of PM can have adverse
health impacts, ‘no threshold has been identified below which no damage to
health is observed’ (WHO 2014).
In the UK, the 2008 EC directive was transposed into English law by the Air
Quality (Standards) Regulations 2010, with equivalent regulations then adopted
in Scotland, Wales and Northern Ireland. At present, it is unclear how air quality
standards in the UK will be set and scrutinised after Brexit, but an Environmental
Protection Agency, independent of government, has been proposed (HoC 2018).
In general, air pollution in the UK is falling, particularly as regards PM – although
both WHO and the RCP suggest there are no ‘safe limits’ for PM. There has been
much slower progress, however, in reducing concentrations of NO2 largely due
to the growth in the number of diesel vehicles during the 2000s. In many parts
of the UK, NO2 levels remain above legal limits, although forward projections
suggest that many areas will improve substantially by 2020 as vehicle emissions
standards improve. However, as shown later in this report, questions remain about
the accuracy of current modelling, and other trends might counteract any vehicle
improvements. For example, it is unclear how different forms of decentralised
combined heat and power (CHP) generation might affect air quality, and there
are significant uncertainties around non-road mobile machinery (Howard 2015).
A recent paper in the Lancet, however, has suggested that predicted reductions
in NO2 could be offset in some areas by the growth in bioenergy CHP stations
(Markandya et al 2018).
IPPR NORTH | Atmosphere Towards a proper strategy for tackling Greater Manchester's air pollution crisis 92.2 AIR QUALITY STATISTICS IN GREATER MANCHESTER
A growing number of cities across the developed world now have good-quality
data on air pollution, much of which is made available to the public in real time
and open source for the purposes of analysis and public awareness. In London,
for example, the London Atmospheric Emissions Inventory2 contains datasets on a
wide range of pollutants at 20m grid scale, emissions by vehicle type at link level,
concentration maps, methodological details and even GIS files.
In Greater Manchester air quality data is very much more limited. In part this
is due to a lack of effective monitoring – a vital subject we will address later in
this report – but even the data that does exist is not easily available or held in
an accessible way. The GreatAir Manchester website3 carries relatively recent
data4 on various pollutants from 14 monitoring sites across Greater Manchester,
but its data archive has no data since 2013 and the most recent report of the
Greater Manchester Emissions Inventory (EMIGMA) dates back to 2010. Transport
for Greater Manchester (TfGM) and some local authorities do make some data
available to interested parties, but the most up-to-date information tends to be
available only after freedom of information requests from campaigning groups.
Government PCM modelling
Official government statistics focus exclusively on NO2 emissions and their most
recent assessment is set out in a report published in July 2017 called Air Quality
Plan for tackling roadside nitrogen dioxide concentrations in Greater Manchester
Urban Area (DEFRA/DfT 2017). This assessment was based on 2015 data from five
monitoring sites located in Manchester Piccadilly, Bury, Shaw, Salford (Eccles)
and Manchester South (Cheadle). Data was then modelled to calculate roadside
emissions on major roads across Greater Manchester.
This modelling shows that ‘there were no measured exceedances of the annual limit
value in this zone in 2015’ and ‘there were no modelled background exceedances of
the annual limit value’ as shown in figure 2.1 (ibid, authors’ emphasis).
2 See https://data.london.gov.uk/dataset/london-atmospheric-emissions-inventory-2013
3 See http://www.greatairmanchester.org.uk/default.aspx
4 In some cases there is data for the past 24 hours but it depends on the monitoring site.
10 IPPR NORTH | Atmosphere Towards a proper strategy for tackling Greater Manchester's air pollution crisisFIGURE 2.1
Map of modelled background annual mean NO2 concentrations 2015
NO2 (µgm-3)
10 and below
11-20
21-30
31-40
Source: Department for Environment, Food & Rural Affairs and Department for Transport, Air Quality Plan for tackling
roadside nitrogen dioxide concentrations in Greater Manchester Urban Area (DEFRA/DfT 2017)
Note: Modelled exceedances of the annual limit value are shown in orange and red.
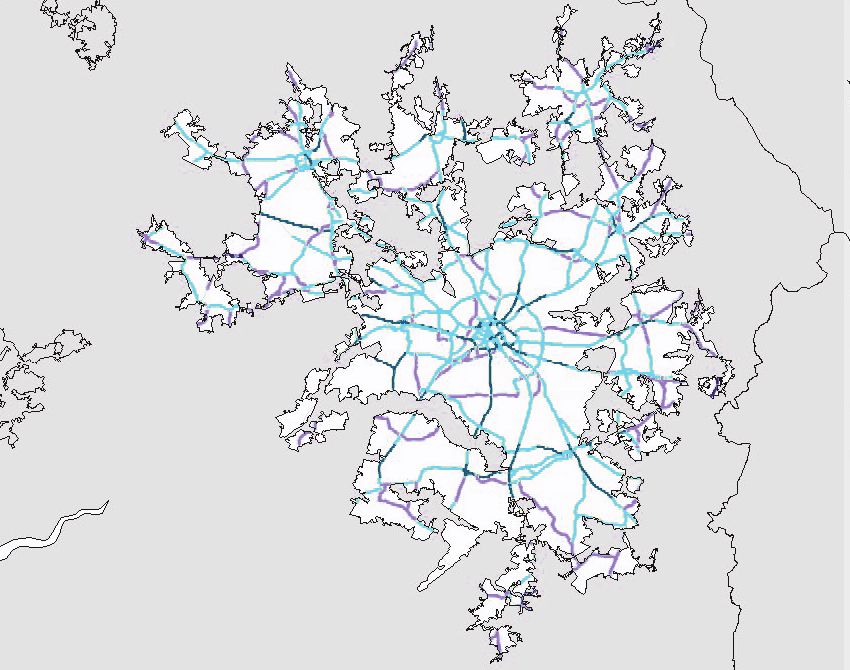
However, the modelling did indicate that ‘90.8 km of road length was modelled to
exceed the annual limit value’ as shown in figure 2.2.
FIGURE 2.2
Map of modelled roadside annual mean NO2 concentrations 2015
NO2 (µgm-3)
10 and below
11-20
21-30
31-40
Source: Department for Environment, Food & Rural Affairs and Department for Transport, Air Quality Plan for tackling
roadside nitrogen dioxide concentrations in Greater Manchester Urban Area (DEFRA/DfT 2017)
Note: Modelled exceedances of the annual limit value are shown in orange and red.
IPPR NORTH | Atmosphere Towards a proper strategy for tackling Greater Manchester's air pollution crisis 11The report goes on to project NO2 levels for each year from 2017 to 2030 based
upon traffic activity projections to 2020 and beyond. The report states ‘the model
results suggest that compliance with the NO2 annual limit value is likely to be
achieved by 2022 under baseline conditions’ (ibid). As a result of this, in a report to
the Manchester City Council Executive in January 2018 the city council stated:
"Further joint work is currently underway between Greater Manchester
and the Government to clarify the extent of the road network where
specific actions will be required to meet legal requirements. The
published Plan forecasts that a stretch of the Mancunian Way and a
stretch of the M60 close to Princess Parkway close to the M60 will fail
to comply with legal limits by the required date."
MCC 2018
A further nine road ‘links’ in the rest of Greater Manchester were also identified
as likely to fail to comply. But to deduce from this that Greater Manchester’s
air pollution problem is confined to a handful of small stretches of road would
be ill-advised. It is important to note that in its recent Strategic Transport Plan,
Transport for the North predicts that in a ‘transformed north scenario’, road traffic
could increase by as much as 54 per cent by 2050 (TfN 2018). Clearly, not all of this
will be heading into Greater Manchester, but even in lower-growth scenarios road
traffic is predicted to increase by as much as 25 per cent. Furthermore, pollution
climate mapping (PCM) modelling notoriously underestimates levels of air
pollution (see box) as it draws upon limited data and, by modelling at large scales
and only for major roads, it fails to pick up the fine grain of pollution hotspots.
For this reason it is important to complement national data with that collected by
local authorities.
The problems of PCM modelling
There is wide-ranging concern that the pollution climate mapping model
that government uses to measure air pollution in the UK significantly
underestimates the problem. At the simplest level, it depends upon too
little data from too few monitoring sites. For example, the PCM model uses
data from just five monitoring sites for the whole of Greater Manchester.
More technically, government predictions about reductions in NO2 over
time would appear to be overestimates compared with other studies and
the emerging reality (AQC 2016) and more significantly, the model has a
greater tendency to underpredict for high concentrations close to 40μg/m3
(35–45μg/m3) than it does overall (McHugh and Karyampa 2016). Oxford city
council, for example, has demonstrated that its own local monitoring and
mapping shows significantly higher than the government’s PCM model5 and
there is increasing academic evidence of widespread flaws in the Local Air
Quality Management (LAQM) approach (see Barnes et al 2018).
Local authority air pollution data
Local authorities collect air pollution data from over 250 monitoring sites around
Greater Manchester. The monitoring sites vary in terms of their type (automatic/
non-automatic), function (urban traffic, urban background, suburban, rural, etc),
and the different pollutants they monitor but it is possible to build up a far more
comprehensive picture of air pollution in the city region using their data than that
used by the government’s more limited PCM model.
5 See https://www.oxford.gov.uk/downloads/file/4004/letter_on_air_quality_05102017
12 IPPR NORTH | Atmosphere Towards a proper strategy for tackling Greater Manchester's air pollution crisisNitrogen oxide pollution
Figure 2.3 shows the annual mean concentrations of NO2 pollution in each of
the 10 local authority areas between 2011 and 2016. Each is marked to show the
40µg/m3 legal limit and the 35µg/m3 ‘precautionary limit’ set in the Greater
Manchester Air Quality Action Plan. A number of observations can be made
from these charts.
• There are 63 monitoring sites across Greater Manchester where in 2016 NO2
emissions were above the legal limit.
• In local authorities like Manchester and Salford – but also Rochdale, Stockport
and Tameside – more than one-third of monitoring sites are above legal limits.
Nine out of the 10 local authority areas had at least one site with annual averages
higher than legal limits. Trafford is the only local authority area which has no
monitoring site with an illegal annual average for 2016.
• Despite reductions in a few places, NO2 concentrations across Greater
Manchester are largely static and the predicted reductions are much less than
might be expected.
• Between 2011 and 2016 the maximum annual average is 64.5µg/m3 but 17
sites across four different local authorities have 2011–16 averages of over
50µg/m3. Using the most recent data from 2016, the maximum average annual
mean is 66.2µg/m3, but eight separate sites have annual averages higher than
60µg/m3 and 17 higher than 50µg/m3.
• Of the 149 ‘urban traffic’ monitoring sites over one-third (58) exceed the legal
limits and two-thirds (97) exceed the precautionary limit set out by the Greater
Manchester combined authority (see figure 2.4).
IPPR NORTH | Atmosphere Towards a proper strategy for tackling Greater Manchester's air pollution crisis 13FIGURE 2.3
Levels of NO2 pollution in Greater Manchester local authorities
Average annual NO2 concentrations from all monitoring sites in each local authority area
70
Bolton
60
50
40
30
20
10
0
2011 2012 2013 2014 2015 2016
90
Bury
80
70
60
50
40
30
20
10
0
2011 2012 2013 2014 2015 2016
70
Manchester
60
50
40
30
20
10
0
2011 2012 2013 2014 2015 2016
45
Oldham
40
35
30
25
20
15
10
5
0
2011 2012 2013 2014 2015 2016
60
Rochdale
50
40
30
20
10
0
2011 2012 2013 2014 2015 2016
Monitoring site Defra safe legal limit TFGM precautionary limit
14 IPPR NORTH | Atmosphere Towards a proper strategy for tackling Greater Manchester's air pollution crisis70
Salford
60
50
40
30
20
10
0
2011 2012 2013 2014 2015 2016
70
Stockport
60
50
40
30
20
10
0
2011 2012 2013 2014 2015 2016
80
70 Tameside
60
50
40
30
20
10
0
2011 2012 2013 2014 2015 2016
50
45 Trafford
40
35
30
25
20
15
10
5
0
2011 2012 2013 2014 2015 2016
60
Wigan
50
40
30
20
10
0
2011 2012 2013 2014 2015 2016
Monitoring site Defra safe legal limit TFGM precautionary limit
Source: Greater Manchester local air quality monitoring data
IPPR NORTH | Atmosphere Towards a proper strategy for tackling Greater Manchester's air pollution crisis 15FIGURE 2.4
Levels of NO2 pollution in more congested parts of Greater Manchester
Average annual NO2 concentrations in urban traffic monitoring sites in Greater
Manchester 2011–16
80
70
60
50
40
30
20
10
2011 2012 2013 2014 2015 2016
0
Monitoring site Defra safe legal limit TFGM precautionary limit
Source: Greater Manchester local air quality monitoring data
Alongside annual mean concentrations of NO2 pollution, it is also important to
assess how often particular locations have hourly mean exceedances of greater
than 200µg/m3. At the Manchester Oxford Road monitoring station this legal limit
was exceeded no fewer than 90 times during 2016.
Particulate matter
Levels of PM10 in Greater Manchester are only measured in 16 sites across
Greater Manchester and they are lower than the legal limit of the annual mean
concentration of 40µg/m3. In most locations they are also declining, albeit slowly.
However, as already noted, it is broadly considered that there are no ‘safe limits’
for particulate matter pollution and the WHO guidelines suggest a lower level of
20µg/m3. Using this measure, three different sites in Greater Manchester are at or
above the WHO limit and 10 out of 16 sites had levels of 17µg/m3 or above in 2016.
WHO guidelines also suggest that there should be no more than 35 occasions per
annum where the 24-hour mean concentration of PM10 exceeds 50µg/m3. Although
nine out of 16 monitoring sites did experience >50µg/m3 exceedances, the worst
places were Manchester Oxford Road (16) and Salford M60 (13).
As regards PM2.5, across the only five sites where this is measured, levels are within
the UK/EU legal limit of 20µg/m3 annual mean concentrations, but three out of
these five sites exceed the WHO guidelines of 10µg/m3.
It is unsurprising then that in a recent WHO report on PM10 air pollution,
Manchester was placed second-worst place in the UK (excluding Gibraltar),
significantly above London which ranked 22nd worst in the UK (BBC 2018).
16 IPPR NORTH | Atmosphere Towards a proper strategy for tackling Greater Manchester's air pollution crisis2.3 HEALTH IMPACT OF AIR POLLUTION IN GREATER MANCHESTER
In order to better understand the health impacts of air pollution in Greater
Manchester on its population, IPPR North commissioned King’s College London
(King’s) to study the mortality burdens and impacts associated with current and
future pollution levels as well as the economic cost to the city region. King’s has
previously carried out similar studies for other cities, including London, and its
methodology uses local authority data from the Department of the Environment,
Food and Rural Affairs’ (Defra) Local Air Quality Monitoring website (LAQM), which
is then combined with relationships between concentrations and health outcomes
for each local authority in the city region. This is the first time any health impact
assessment has been carried out with this rigour and uses the most up to date and
accurate methodology available. The full report is available separately (Dajnak at
al 2018). The results are a significant cause for concern.
As air pollution can shorten lives over the long term, in this case, between 2011
and 2134 the results are expressed as life-years lost (one life year is one year for
one person) across the whole population.
While the results were calculated for both NO2 and PM2.5, there is an overlap
between them, so for pragmatic reasons we have chosen not to add them up (as
has sometimes been reported about London), but instead take the higher of the
two values in order to represent human exposure.6
• Greater Manchester past and projected air pollution concentration changes
from 2011 to 2030 were estimated to lead to 0.6 to 1.6 million life years (one
person living for one year) lost by 2134, if further action is not taken to reduce
air pollution. At the upper estimate this could be as high as 2.2 million life
years lost.
• This can also be represented as a loss in life expectancy from birth in 2011 of
around two to six months for every person born in 2011 in Greater Manchester.
• Nonetheless, the impacts of the projected future changes7 in air pollution
concentrations is an improvement over 2011 concentration levels remaining
unchanged with the population in Greater Manchester gaining around 930,000
life years over a lifetime when the predicted change is taken into account.
It is possible to estimate the economic costs associated with the health impacts in
the first point above:
• the annualised monetary costs of the health impacts of the projected future
changes in air pollution concentrations from 2011 to 2030 has been estimated
to be as much as £1 billion per annum (in 2014 prices) – at the upper estimate
this could be as high as £1.2 billion.
It is also possible to calculate the mortality ‘burden’ of air pollution in Greater
Manchester. Burden calculations are a snapshot of the burden in one year; they
are intended as a simpler calculation than the more detailed assessments that are
given above and do not reflect the impact over many years.
• Using baseline data from 2011, the total mortality burden of anthropogenic
PM2.5 is estimated to be equivalent to 1,459 attributable deaths in 2011. At the
upper estimate this could be as high as 1,906.
• In the past, for London, the results were presented as a range from PM2.5 alone
to the sum of the PM2.5 and NO2 results. Since then it has become clearer
6 These calculations should be regarded as alternative ways of showing the effects of the pollution
mixture, with NO2 representing the effects of traffic pollution and PM2.5 best for representing the overall
mixture including some of the traffic pollution effects. The results are thought to overlap substantially
but not completely. Thus, each one alone is an underestimate to some extent. Taking the higher value
follows COMEAP 2017.
7 Projected future changes use the standard PCM model predictions from 2015 and not the wider measures
set out later in this report.
IPPR NORTH | Atmosphere Towards a proper strategy for tackling Greater Manchester's air pollution crisis 17that the overlap is likely to be substantial, and that traffic pollutants such as
PM2.5 might account for some of the effects attributed to NO2. For this reason,
these figures should not be added as has been done in media reporting about
London. Nonetheless the total mortality burden of NO2 is provided as well for
completeness and has been estimated to be equivalent to 1,132 attributable
deaths in 2011.8 At the upper estimate this could be as high as 1,781.
The King’s modelling also considers each of the 10 local authorities in Greater
Manchester. These results are summarised in tables 2.3 and 2.4.
TABLE 2.3
Life years lost across the local authorities and GM population for anthropogenic PM2.5
(without cut-off )
Concentration does not reduce from Predicted concentration between
Local 2011 levels 2011 and 2030
authority Central Lower Upper Central Lower Upper
estimate estimate estimate estimate estimate estimate
Bolton 236,206 159,371 311,233 162,938 109,851 214,860
Bury 156,294 105,444 205,957 101,506 68,423 133,873
Manchester 562,094 379,571 740,016 368,816 248,765 486,126
Oldham 208,696 140,850 274,903 135,801 91,563 179,061
Rochdale 188,515 127,232 248,322 122,354 82,497 161,330
Salford 243,459 164,378 320,571 160,086 107,967 211,024
Stockport 224,848 151,783 296,122 148,290 99,998 195,499
Tameside 198,516 133,903 261,642 130,292 87,819 171,854
Trafford 182,309 123,086 240,060 121,221 81,755 159,794
Wigan 256,186 172,813 337,631 186,743 125,892 246,267
GM 2,457,123 1,658,431 3,236,457 1,638,047 1,104,530 2,159,688
Source: Dajnak et al, Greater Manchester Health and Economic Impact Assessment study, (Dajnak et al 2018)
8 Note that the concentration-response function has changed from that used for calculations in London.
18 IPPR NORTH | Atmosphere Towards a proper strategy for tackling Greater Manchester's air pollution crisisTABLE 2.4
Life years lost across the local authorities and GM population for anthropogenic NO2
(without cut-off )
Concentration does not reduce from Predicted concentration between
Local 2011 levels 2011 and 2030
authority Central Lower Upper Central Lower Upper
estimate estimate estimate estimate estimate estimate
Bolton 173,845 61,126 276,864 90,488 31,767 144,326
Bury 119,597 42,052 190,466 60,037 21,076 95,761
Manchester 474,071 167,008 753,631 243,068 85,410 387,358
Oldham 158,155 55,639 251,745 81,491 28,614 129,950
Rochdale 139,045 48,911 221,351 69,811 24,512 111,332
Salford 207,526 73,094 329,963 103,194 36,255 164,475
Stockport 168,046 59,133 267,433 90,573 31,810 144,404
Tameside 151,597 53,288 241,493 78,990 27,727 126,001
Trafford 142,132 50,036 226,097 72,932 25,618 116,268
Wigan 176,032 61,863 280,486 90,935 31,915 145,079
GM 1,910,046 672,150 3,039,529 981,519 344,704 1,564,954
Source: Dajnak et al, Greater Manchester Health and Economic Impact Assessment study, (Dajnak et al 2018)
As might be predicted from the air quality monitoring data in the previous section,
all council areas are projecting over 100,000 life years lost at the central estimate
for PM2.5 pollution but with the three worst affected local authorities – Manchester,
Salford and Wigan – together projecting nearly 1 million life years lost at their upper
estimates. NO2 pollution data shows a similar distribution across Greater Manchester.
Finally, table 2.5 shows the estimated annualised economic impact for different local
authority areas. This shows that in Manchester, for example, the economic cost of
PM2.5 pollution could be more than £250 million per annum at the upper estimate.
TABLE 2.5
Lower and upper annualised economic impact estimate (in 2014 prices) across the local
authorities and GM population for anthropogenic PM2.5 and NO2 (without cut-off )
Anthropogenic PM2.5 NO2
Predicted concentration between Predicted concentration between
Zone
2011 and 2030 2011 and 2030
Lower estimate Upper estimate Lower estimate Upper estimate
Bolton £71,629,372 £119,293,195 £40,915,722 £68,141,979
Bury £45,017,051 £74,972,427 £27,421,362 £45,668,163
Manchester £155,796,302 £259,466,727 £105,043,816 £174,942,375
Oldham £59,284,381 £98,733,565 £36,486,809 £60,765,966
Rochdale £53,988,953 £89,914,438 £31,672,210 £52,747,624
Salford £69,247,961 £115,327,139 £45,957,433 £76,538,560
Stockport £66,790,243 £111,233,999 £41,918,527 £69,812,074
Tameside £57,856,692 £96,355,859 £35,991,016 £59,940,262
Trafford £53,842,802 £89,671,035 £33,339,469 £55,524,315
Wigan £83,775,621 £139,521,836 £42,009,734 £69,963,972
GM £717,229,378 £1,194,490,220 £440,756,097 £734,045,290
Source: Dajnak et al, Greater Manchester Health and Economic Impact Assessment study, (Dajnak et al 2018)
IPPR NORTH | Atmosphere Towards a proper strategy for tackling Greater Manchester's air pollution crisis 192.4 AIR POLLUTION AND ASTHMA
According to Asthma UK, more than 5.4 million people in the UK are receiving
treatment for asthma. More than 1 million of those in treatment are children.
There is an asthma attack every 10 seconds in the UK and on average, three attacks
per day are fatal. Two in every three of these deaths are preventable.9
Air pollution is an asthma trigger. Two-thirds of people with asthma say poor air
quality makes their asthma worse. The particles found in fumes are small enough
to enter the lungs quickly, easily irritating asthmatic lungs and triggering asthma
symptoms. Pollution also makes those with asthma more sensitive – and more
likely to react – to conventional asthma triggers such as pollen and dust. These
factors significantly increase the chances of those with asthma suffering an attack
because of air pollution.10
Alongside increased risk of emergency for existing asthmatics, there is a growing
body of work linking air pollution to the development of asthma, especially in
children. A recent study from the University of Leeds’ Institute for Transport
found that as many as 38 per cent of new child asthma cases each year could be
attributable to air pollution, with 24 per cent directly linked to vehicle emissions
(University of Leeds 2018).
The correlation between air pollution hotspots in Manchester and asthma
emergencies are too strong to ignore and are a significant cause for concern.
Of all the clinical commissioning group (CCG) areas in England, Central Manchester
is the worst in the country for asthma emergencies by a considerable distance.
Emergencies in Central Manchester in 2015–16 (the latest available figures) were
more than double the national average and significantly higher than any other area.
North Manchester is second worst in England, more than 35 per cent higher than
the national average. Three of the worst 10 CCG areas in England for emergency
asthma admissions are in Greater Manchester. In fact, all but three of the CCG
areas covering Greater Manchester are above the national average.
2.5 SNAPSHOT MONITORING AROUND GREATER MANCHESTER
The problem with all of the analysis above is that it works on ‘average
concentrations’ and modelling over relatively broad areas or zones such as 1km by
1km grids, wards or even local authority areas. Although PCM modelling identifies
important road ‘links’ where pollution is estimated to be high and certain
monitoring sites are located in key locations, the averaging or modelling of data
fails to take sufficient account of the prevalence of air pollution hotspots.
This is recognised by the European Commission and in its 2008 directive it
states, ‘compliance should not be determined nor assessed as an “average” of
concentrations measured in different locations within the same zone’ (EC 2016).
Very little is being done to monitor hotspots in Greater Manchester, although
voluntary groups have undertaken a series of neighbourhood-based studies.
Friends of the Earth in Manchester has carried out extensive snapshot analysis at
a range of sites in Manchester and Stockport using the same rigorous methodology
as most local authorities.11 This work has identified 33 locations which were above
legal limits including two sites that had more than double the legal limit.
9 Facts and stats from Asthma UK: see https://www.asthma.org.uk/about/media/facts-and-statistics/
10 See https://www.asthma.org.uk/advice/triggers/pollution/
11 NO2 monitoring tubes are located on lampposts at a height of 2–2.5m for 2–4 weeks. They are analysed
and bias adjusted by Gradko International – the laboratory that processes NO2 monitoring tubes from
many local authorities.
20 IPPR NORTH | Atmosphere Towards a proper strategy for tackling Greater Manchester's air pollution crisisTABLE 2.6
Manchester Friends of the Earth snapshot studies data12
NO2 snapshot
Location Month Year
value (µg/m3)
Stockport: St Mary’s Way 106.24 March 2015
Manchester: Fairfield Street 96.1 April 2017
Rusholme: Oxford Road 77.7 March 2015
Levenshulme: 709 Stockport Road 72.41 July 2017
Manchester: Stephenson Square 70.31 May 2017
Levenshulme: 847 Stockport Road 70.16 July 2017
Rusholme: Oxford Road/Claremont Road 68.55 March 2015
Manchester: Rochdale Road/Swan St 68.34 May 2017
Fallowfield: Birchfields Road 64.74 March 2015
Fallowfield: Wilsmlow Road/Furness Road 64.57 March 2015
Manchester: Newcastle Street (2 week NO2 tube) 62.90 Oct 2016
Levenshulme: 256 Broom Lane 61.57 July 2017
Stockport: St Mary’s Way / Hall Street 59.84 March 2015
Manchester: Deansgate/Quay St Near Sainsburys Local 58.76 May 2017
Didsbury: Princess Rd, by St Ambrose School 58.69 Jan 2018
Openshaw: Ashton Old Road / Falconwood Way 58.68 March 2015
Manchester: Deansgate (LP15) Opp Kendals/Waterstones 56.41 May 2017
Openshaw: Ashton Old Road/Rylance Street 55.36 March 2015
Stockport: St Mary’s Way/Carrington Rd 53.87 March 2015
Stockport: St Mary’s Way/Hall Street 52.13 March 2015
Manchester: New Wakefield Street 51.60 May 2017
Levenshulme: Albert Road – Littleways 51.50 July 2017
Stockport: St Mary’s Way 50.05 March 2015
Manchester: Deansgate opp BetFred/Lloyd St (LP25) 49.87 May 2017
Fallowfield: Wilsmlow Road/Brighton Grove 47.22 March 2015
Openshaw: Ashton Old Road/Alan Turing Way 46.56 March 2015
Manchester: Sandy Lane/Barlow Moor Rd by Chorlton Church 45.15 Jan 2018
Openshaw: Ashton Old Road/Pottery Lane 44.32 March 2015
Rusholme: Oxford Road/Great Western St 44.24 March 2015
Manchester: Stretford Rd opp cafe (new development) Lampost 13 43.87 April 2017
Stockport: St Mary’s Way 43.41 March 2015
Manchester: 114 Barlow Road 42.24 July 2017
Manchester: Grange School 40.16 Jan 2018
Source: Adapted from Manchester Friends of the Earth data
12 A map setting out all of the Manchester Friends of the Earth data – together with 2016 local authority
LAQM data – is available here: https://www.google.co.uk/maps/@53.4978615,-2.4449994,11z/data=!3m1!4b1
!4m2!6m1!1s14R3SOBXbd2WtKVNnWsbttH-ZBXs?hl=en&authuser=0
IPPR NORTH | Atmosphere Towards a proper strategy for tackling Greater Manchester's air pollution crisis 21It is interesting to compare a number of locations where snapshot surveys and
local authority monitoring sites are very closely located. In many of these the
snapshot levels are significantly higher than the annual average figures. Table 2.7
sets out a number of examples.
TABLE 2.7
Comparison of snapshot monitoring and LAQM annual average NO2 concentrations
LAQM Annual Average
Location FoE Snapshot
2017 2016 2015
Levenshulme: Stockport Road (75) 72.41 48.33 51.54 46.52
Didsbury (by St Ambrose School) (37) 58.69 43.11 46.25 41.78
Ancoats: Angel Street / Rochdale Road (85) 68.34 58.54 57.78 52.21
Source: Adapted from Manchester Friends of the Earth data
Significantly, none of these examples are identified as ‘PCM links’ requiring urgent
action by Defra to bring below legal limits.
Although such studies are ‘unofficial’ they add weight to the argument that PCM
modelling and local authority averages are likely to be underestimating the scale
of air pollution problems in many hotspots around the city region. If nothing
else, they demonstrate the urgent need for more effective and comprehensive
monitoring than currently exists.
22 IPPR NORTH | Atmosphere Towards a proper strategy for tackling Greater Manchester's air pollution crisis3.
AIR QUALITY POLICY
AND ITS CRITICS
CHAPTER SUMMARY
• The UK government is required by the European Commission to produce a
national air quality plan which sets out the UK’s air quality objectives and
recognises that action at national, regional and local level may be needed,
depending on the scale and nature of the air quality problem.
• The government’s 2017 Air Quality Plan delegates responsibility for preparing
air quality plans to 23 local authorities, including Greater Manchester, which
will deliver compliance with legal limits for NO2 in the shortest possible time
but asks them to first consider whether there are other equally effective
options which don’t involve Charging Clean Air Zones.
• Greater Manchester had adopted a commendable Air Quality Action Plan in
2016, but this has been superseded by urgent action to develop a Clean Air
Plan to deliver legal compliance. A ‘strategic outline case’ has been submitted
to the Joint Air Quality Unit (JAQU) but this has not been released to the public.
• During his election campaign, Greater Manchester mayor Andy
Burnham appeared to rule out the possibility of a Charging Clean Air Zone
for Greater Manchester, but more recently conceded that there may need
to be certain vehicle restrictions in the city in return for greater support
from central government.
3.1 NATIONAL POLICY CONTEXT
Air pollution rules in the UK date back to 1273, when the use of coal in London was
limited because excessive winter use was deemed to be ‘prejudicial to health’. It
is only since 2010, however, that better science, policy developments and lengthy
legal battles have combined to build greater urgency around the issue.
EU legislation
Action to manage and improve air quality is largely driven by EU legislation. The
2008 ambient air quality directive (2008/50/EC) sets legally binding limits for
concentrations in outdoor air of major air pollutants that impact the public – this
includes PM10, PM2.5 and NO2.
The 2008 directive replaced nearly all the previous EU air quality legislation and
was made law in England through the Air Quality Standards Regulations 2010,
which also incorporates the 4th air quality daughter directive (2004/107/EC) that
sets targets for levels in outdoor air of certain toxic heavy metals and polycyclic
aromatic hydrocarbons. Equivalent regulations exist in Scotland, Wales and
Northern Ireland.
UK policy and legislation – national and local
The environment secretary has responsibility for meeting the limit values in
England. The same department coordinates assessment and air quality plans for the
UK as a whole, even though day-to-day responsibility for meeting air quality limits is
devolved to the national administrations in Scotland, Wales and Northern Ireland.
IPPR NORTH | Atmosphere Towards a proper strategy for tackling Greater Manchester's air pollution crisis 23You can also read