Every breath we take - transforming the health of China's office space - JLL presents a white paper on how to achieve good indoor air quality in ...
←
→
Page content transcription
If your browser does not render page correctly, please read the page content below

Every breath we take – transforming
the health of China’s office space
JLL presents a white paper on how to achieve good indoor air quality
in the workplace, in partnership with PureLiving China

Research Report | December 2015

2     JLL

Opportunity knocks                                                                                                           and Shanghai. The average Beijinger, for example, is well versed
                                                                                                                             on PM2.5, unlike residents of other world capitals in developed
In the modern business world, people in China are spending more
                                                                                                                             countries where pollution is not of huge public concern. Experts
time indoors than outdoors. At work, employees from 90 percent
                                                                                                                             have surmised that PM2.5 levels in Beijing are currently even worse
of the country’s industries are clocking in overtime hours on a
                                                                                                                             than those experienced in Los Angeles during its peak pollution
weekly basis1. Meanwhile, outside of the office, the air in China is
                                                                                                                             decades from the late 1940s through to the 1960s3. In developing
a serious problem. Air pollution in China contributes to some 1.6
                                                                                                                             countries presently, however, it is India and Pakistan that suffer
million fatalities in the country annually, according to the findings of
                                                                                                                             the highest PM2.5 concentrations in the world4. Though China is
a scientific study released earlier this year by Berkeley Earth, which
                                                                                                                             not that far behind these countries, it is head and shoulders above
also attributed 17 percent of the country’s mortalities to the bad
                                                                                                                             in both awareness and policy, making it best-positioned to act on
air. While the number of premature fatalities linked to the air that
                                                                                                                             indoor air quality in a global context so that other industrialising
we breathe indoors is difficult to quantify, we know that spending
                                                                                                                             nations can follow.
time inside, in places where the air is not properly managed,
also exposes us to harmful levels of outdoor pollution – and the                                                             A decade ago, tobacco smoke was targeted as the main culprit
ubiquitous PM2.5. The real danger is that 75 percent of PM2.5 –                                                              of bad air in office buildings around China. Although legislation
or particulate matter sized 2.5 microns or smaller – finds its way                                                           has done well to put an end to smoking in most Tier I city offices
into our buildings from outside2. PM2.5 penetrates deep into our                                                             in recent years, cigarette smoke was previously only masking
lungs, enters our bloodstream, and has sobering long-term health                                                             the PM2.5 in the background. Unlike PM2.5, tobacco smoke is
implications. Consequently, pollution remains at the forefront of                                                            a form of point-source pollution – it has a strong odour and is
public health concerns in the country and continues to be a focal                                                            highly location-specific – making it relatively easy to identify and
point of China’s 13th Five-Year Plan (2016-2020), with targets                                                               eliminate from offices. Nowadays, however, concerns have shifted
curbing reliance on coal-fuelled power – a chief source of PM2.5 –                                                           to non-point-source pollution, namely PM2.5, which comprises the
reaffirming the Chinese government’s deep commitment to the “war                                                             bulk of China’s ambient air pollution and is harder to eliminate. In
on pollution”.                                                                                                               fact, PM2.5 from the burning of fossil fuels can travel hundreds of
                                                                                                                             kilometres to infiltrate office buildings of all shapes and sizes. While
As pollution continues to strongly influence China’s plans for the
                                                                                                                             flushing out poisonous compounds off-gassed from office furniture
future, indoor air quality is a critical issue that deserves greater
                                                                                                                             and construction materials (volatile organic compounds or VOCs)
attention, especially given that high public awareness of pollution
                                                                                                                             and keeping carbon dioxide levels low are also key components to
is dramatically changing people’s expectations toward health.
                                                                                                                             achieving good indoor air quality, these pollutants are tied to indoor
Moreover, pollution is no longer primarily a concern among just
                                                                                                                             sources and building construction. Therefore, for the purpose of this
expatriates working in China; everyone has major reservations
                                                                                                                             paper, we focus heavily on PM2.5, given its lack of analysis relative
about the bad air. In just a short time, the general public has gone
                                                                                                                             to the China office market. We also emphasise PM2.5 as a concern,
from complete ignorance to world-leading levels of knowledge on air
                                                                                                                             given that pollution poses a problem that is increasingly becoming
quality indexes, and this is especially true in major cities like Beijing
                                                                                                                             important for workplace retention and commercial space selection.

1. China Labour Market Report Analysis. Beijing Normal University; 2014. (www.cnki.net).
2. Wallis, Raefer. RESET Certified Video. December 2015. (v.youku.com/v_show/id_XMTQwNjQ5MDE0OA==.html?from=y1.7-1.2)
3. Makinen, Julie and Smith, Doug. Beijing’s Smog Makes Los Angeles Air Look Good. September 10, 2014. Los Angeles Times. (www.latimes.com/world/asia/la-fg-china-la-smog-stats-20140910-story.html).
4. Outdoor Air Pollution Database. May 2014. World Health Organization. (www.who.int/entity/quantifying_ehimpacts/national/countryprofile/aap_pm_database_may2014.xls?ua=1).
Every breath we take – transforming the health of China’s office space 3
Considering that environmental reform in China is a long-term Indoor air quality affects daily business operations
endeavour, we can all take proactive measures now to improve and company growth.
indoor air quality and create office space that employees will
want to work in – and choose over others. In this white paper, we China’s future economic growth will largely depend on transitioning
explore how sound investments in indoor air quality today can to a service-oriented economy, which requires improving
improve office space for tomorrow and beyond, giving employers productivity – what economists refer to as Total Factor Productivity.
an important edge needed in China to attract and retain top talent This all starts with the individual worker. Uncomfortable working
in the increasingly competitive marketplace – where companies conditions arise from poor indoor air quality. Stuffy air, for
are only as strong as their people. Though our findings are far from example, has been known to cause people to feel unwell or
providing all of the answers to indoor air quality problems, we have sluggish. Likewise, particulates have a negative effect on workers,
looked at the outside air in China and assessed how it is of concern especially after prolonged exposure to heavy concentrations. Lower
to both landlords and tenants in the office market. Supported productivity, whether it is from reduced efficiency or increased
by data analysis and anecdotal evidence, we address issues absenteeism, hurts how companies run their day-to-day business.
surrounding the subject of indoor air quality and offer solutions on Moreover, the knock-on effect weakens the productivity of others
how the situation at work can be better managed. around them who rely on their output to carry out tasks. Not only
may others have to pick up the slack, but more employees may also
Our key takeaways include: become worried and distracted from their work. In extreme cases,
these disruptions lead to increased turnover, as disgruntled and
Indoor air quality affects daily business operations and concerned employees seek opportunities elsewhere; this causes
company growth. instability for companies and a loss of momentum in the market as
firms are forced to redirect energy and resources on recruitment.
Good indoor air correlates with nearly twice the level Given that retention is projected to pose even greater staffing
of productivity compared to average air quality and challenges for employers in China going forward, it is not an issue
is increasing in significance for talent attraction and to be taken lightly5. Meanwhile, although employee turnover rates in
retention in China. China are improving, they still remain generally high, particularly in
retail, high-tech, consumer goods, and insurance, giving employers
Good indoor air quality can be achieved by following the
good reason to be cautious of losing their top talent to competitors6
3As (Assess, Act, and Assure).
(see Figure 1).
Assess: Test your office space to identify Figure 1: Voluntary Turnover Rates in China
current problems and design a solution to
fix them. Voluntary Turnover Rates Trends
Industry
Act: Install effective and efficient equipment to 2012 2013 2013 vs 2012
clean the air in your space; mechanical Retail (Chain Store) 30.9% 30.9% –
systems have the greatest impact on PM2.5 Hi-tech 24.0% 23.2% ↓
reduction indoors. Consumer Goods 19.5% 19.0% ↓
Assure: Implement controls that maintain Insurance (Life) 19.2% 20.7% ↑
clean indoor air on an ongoing basis, such Pharma 18.5% 17.7% ↓
as on-demand automation and continuous Real Estate (Tier 1) 17.5% 16.5% ↓
monitoring. Insurance (Non Life) 17.2% 15.7% ↓
Get the indoor air quality of your space accredited by a Engineering 17.0% 13.2% ↓
trusted certifier to validate your results and leverage the Auto Parts (Tier 1) 16.9% 13.0% ↓
marketing benefits. Logistics 16.7% 15.4% ↓
Medical Device 16.1% 13.1% ↓
Investments in indoor air quality help to differentiate office
buildings from competitors, better enabling them to retain Machinery (Tier 1) 14.3% 10.5% ↓
value in any market. Sourcing 14.1% 11.1% ↓
Chemical 12.9% 10.7% ↓
Pollution in China is not just a Beijing problem – or even
Auto Vehicle (Tier 1) 7.0% 4.1% ↓
a North China one – it is far-reaching and affects the
entire country. China Overall 18.9% 14.3% ↓
Source: Aon Hewitt’s Long-term Trends Reshape China Talent Landscape
Report. 2014.
5. Retention: Is it Getting Enough Attention? Hays. 2012: Shanghai, China. (www.hays.cn/cs/groups/hays_common/@cn/@content/documents/digitalasset/hays_088412.pdf)
6. Long-term Trends Reshape China Talent Landscape. Aon Hewitt. HR Connect – Asia Pacific. Vol. 7, Iss. 3, 2014. (www.aon.com/apac/human-resources/thought-leadership/asia-connect/Attachments/Talent-2014Vol7Issue3-Reshape-China-Talent-Landscape.pdf).
4     JLL

      LEED without lead on indoor air quality                                                                                      Good indoor air quality starts with good
                                                                                                                                   design and selection of construction materials
      Widely credited as a leader of sustainable practices in                                                                      and mechanical systems, and then relies on
      building construction, LEED certification has helped raise                                                                   continuously checking and maintaining air
      awareness on green issues to advance building design and                                                                     quality.
      functionality. However, without mandatory requirements
      directly influencing the indoor air quality of a building, LEED                                                              The Chinese government is increasingly
      as a certification standard should not be confused as a
                                                                                                                                   recognizing the need to protect health both
                                                                                                                                   indoors and outdoors and is getting help from
      guarantee of good indoor air quality, especially in terms of
                                                                                                                                   institutions like ours to create standards which
      managing PM2.5 levels. While there is a set of guidelines                                                                    direct smart building and design.
      for indoor air quality that are fairly stringent, the optional
      credit emphasises VOCs and can be fulfilled by flushing                                                                                                                                            Dr Li Jingguang
                                                                                                                                                                           Shanghai Research Institute of Building Science
      air through the space. This can make LEED unreliable in
      terms of its ability to vouch for good indoor air quality in the
      China office context. For example, JLL and PureLiving China
      research found that 12 percent of the worst-performers in
                                                                                                                               While the benefits of a healthy workspace can be difficult to
      terms of PM2.5-reduction indoors were offices in LEED
                                                                                                                               measure in terms of directly correlating gains, new research
      buildings (see chart below). Therefore, paying more to be in
                                                                                                                               from Harvard University indicates that working environments with
      a LEED-accredited building does not guarantee better air.
                                                                                                                               better ventilated clean air helps raise the level of productivity for
      However, the new LEED Dynamic Plaque, which moves                                                                        analytically intensive tasks by as much twice that compared to just
      from a design-rating only approach to a continuous                                                                       average air quality7 (see Figure 2). The study is significant because
      performance measurement, is aimed at addressing some                                                                     it suggests that air quality has far more of an impact than previously
      of the loopholes in the certification process. While indoor                                                              thought, according to previous seminal research from 2003 and an
      air quality requirements are once again optional, the credit                                                             examination of some two dozen studies in 2006, which only linked
      applies a rolling-points system, which is good enough for                                                                better airflow to improved productivity for repetitive tasks such
      most markets, but perhaps not granular enough for a heavily                                                              as typing speed, and not by more than 11 percent8. Furthermore,
      polluted market like China where more is required.                                                                       instead of relying on performance of rote tasks, the study measured
                                                                                                                               performance on standardised tests assessing analytical skills
                                                                                                                               such as judgment and processing, which are more relevant to
                                                                                                                               professional services firms.
      Offices with the Worst Reductions in PM2.5

                                                                                                                               Figure 2: Productivity Increases in Analytical Tasks
                                                               12%
                                                                                                                               300%
                                                                                                                               250%
                                                                                                                               200%
                                                                                                                               150%
                                                                                                                               100%
                                              88%                                                                                50%
                                                                                                                                   0%
                                                                                                                                                Crisis Response                    Information Usage                           Strategy

                                                                                                                                                  Ventilation rate of 20 cubic feet per metre/person
                                                                Offices in LEED Buildings                                                         Ventilation rate of 40 cubic feet per metre/person
                                                                Offices in non-LEED Buildings
                                                                                                                               Source: Harvard T.H. Chan School of Public Health’s Center for Health and
                                                                                                                               the Global Environment
      Note: Includes bottom 25% of tested spaces in terms of
      PM2.5 reductions.
      Source: PureLiving China Certified PM2.5 Audits (2013-2015)

7. Allen, Joseph G., MacNaughton, Piers, Satish, Usha, Santanam, Suresh, Vallarino, Jose, and Spengler, John D. Associations of Cognitive Function Scores with Carbon Dioxide, Ventilation, and Volatile Organic Compound Exposures in Office Workers:
   A Controlled Exposure Study of Green and Conventional Office Environments. Harvard T.H. Chan School of Public Health’s Center for Health and the Global Environment, SUNY Upstate Medical University, and Syracuse University. October 26, 2015:
   Published in Environmental Health Perspectives. (ehp.niehs.nih.gov/wp-content/uploads/advpub/2015/10/ehp.1510037.acco.pdf)
8. World Green Building Council. Health, Wellbeing & Productivity in Offices. September 2014. (www.worldgbc.org/files/6314/1152/0821/WorldGBC__Health_Wellbeing__productivity_Full_Report.pdf).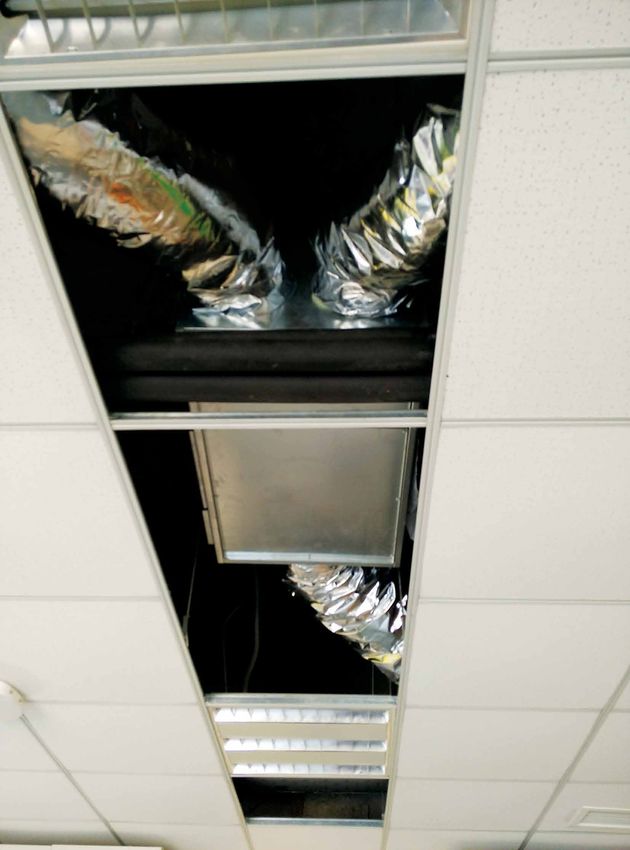
Every breath we take – transforming the health of China’s office space   5

Productivity gains from good indoor air are                                                                        Figure 3: Typical Business Operating Costs
especially significant given that staffing costs make
                                                                                                                                                                      10% Variation
up the majority of a company’s operating costs.
                                                                                                                                                                      A 10% variation applied
A simple cost-benefit analysis (see Figure 3) illustrates the                                                                           1%                            equally to each cost has a
potentially large cost-savings that employers can achieve by                                                                            Energy Costs                  far from equal impact
locating their firms in a building with proper air filtration, an important                                                             9%
driver of air quality in offices. Staffing costs, by way of salaries
and benefits, consume up to 90 percent of the operating costs,
                                                                                                                                        Rental Costs
                                                                                                                                        90%
                                                                                                                                                                      +/- 0.1%
while rents and energy account for just 9 percent and 1 percent,                                                                                                      Energy Costs
                                                                                                                                        Staff Costs

                                                                                                                                                                      +/- 0.9%
respectively. Investments in improving air quality can pay for                                                                          (Salaries and Benefits)
themselves in as little as three to six months through increased
productivity, reduced sick days, and lower health insurance                                                                                                           Rental Costs
premiums9.Though technologically advanced buildings with filtered
fresh-air systems tend to be higher rent buildings, these properties
typically only demand marginally higher rent than the market                                                                                                          +/- 9.0%
average. Therefore, a small premium in office rent could go a long                                                                                                    Staff Costs
way in creating bigger cost-savings for companies. With greater
productivity leading to better performance, employers have the most                                                Source: World Green Building Council’s Health, Wellbeing & Productivity in
                                                                                                                   Offices Report. 2014.
to gain.

  Developer aims to offer “peace of mind” with upgrades
  With corporate offices currently undergoing air quality testing to customise solutions for effective PM2.5 reduction indoors, Kerry Properties
  has started to explore how to implement mechanical system upgrades across its mixed-use developments in mainland China to improve
  indoor air quality at its projects.
                                                                                                              “Ensuring a safe and healthy environment for our customers and tenants
                                                                                                              is our top priority. With air quality an increasing topic of concern, we
                                                                                                              want to make sure the air quality in our office buildings are clean, safe,
                                                                                                              and healthy,” said Bryan Gaw, an executive director of Kerry Properties
                                                                                                              Limited.
                                                                                                              Apart from shielding people from the hazardous elements outside, the
                                                                                                              goal for Kerry Properties is to deliver “peace of mind” to all guests once
                                                                                                              they step into a Kerry Centre project. Included in the company’s plans
                                                                                                             is the installation of real-time air quality monitoring devices – focused on
                                                                                                             tracking live PM2.5 levels – so the public can see for themselves just how
                                                                                                             safe the air inside is.
                                                                                                             Given the current state of pollution in China, providing a safe indoor
                                                                                                             environment is not only the responsible thing to do, but also follows
                                                                                                             the Kerry philosophy. “If the ability exists to make a difference, then we
                                                                                                             should look at how to benefit our customers – because as a developer,
                                                                                                             we are always striving to create communities that get people to come
                                                                                                             together in a more sustainable way,” Gaw said.
                                                                                                             Now is the time to act, he added, pointing to improving technology with
                                                                                                             lower costs now available in the market, growing awareness on how
                                                                                                             bad air in China is affecting indoor environments, and people’s rising
                                                               Beijing Kerry Centre                          awareness and demands for healthy spaces due to heightened concerns
                                                                                                             over health.

  9. Wallis, Raefer. RESET Certified Video. December 2015. (v.youku.com/v_show/id_XMTQwNjQ5MDE0OA==.html?from=y1.7-1.2)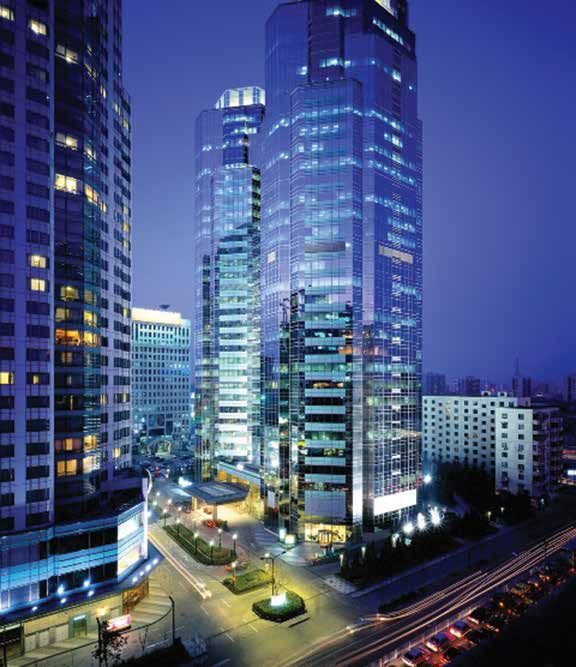
6     JLL

Yet even beyond productivity and growth, in this day and age of
pollution in China, employers also need to pay more attention to                                                                When it comes to creativity, WPP tends to think
risk management, and we believe that there is a greater role for                                                                outside of the box in every aspect.
indoor air quality to play in this to come. Simply put, employers who                                                           Taking extra steps to create a healthy and safe
provide clean air at work are sending a clear message to staff: they                                                            working environment for staff is one of our
care about their well-being. Not only is this highly likely to motivate                                                         innovative moves as an industry leader, and one
staff to stay longer and work harder, a healthy workplace further                                                               step ahead in corporate responsibility.
supports a work environment that is more conducive to employee
                                                                                                                                                                                                           James Woodburn
engagement. This is particularly critical in China, where only 6
                                                                                                                                                                                                          Head of Real Estate
percent of employees are engaged at work compared to 29 percent                                                                                                                                             WPP Asia Pacific
of employees in the United States and Canada, which share the
largest percentage of employees in the world who are engaged
while on the job10 (see Figure 4). Moreover, Chinese workers who
are engaged in their jobs are more likely than those who are not to
                                                                                                                                Indoor air quality is important to our people,
                                                                                                                                and air quality monitors installed at our
say that they are satisfied with their health – and this is important
                                                                                                                                new Shanghai premises gives management
for workplaces as higher satisfaction with personal health has been                                                             confidence that this new office space represents
proven to lead to lower absenteeism, reduced healthcare costs, and                                                              a high quality, healthy and sought after work
greater productivity11.                                                                                                         environment for our people.
Considering that the country has one of the worst employee                                                                      It has also provided unprecedented transparency
engagement figures in the world, employers in China would                                                                       and access to air quality data. The user-friendly
arguably benefit the most from anything that encourages employee                                                                online portal displays real-time air quality results
engagement. Yet while all of these reasons support the call to                                                                  per floor, including a comparison between indoor
action, perhaps the real highlight for employers in China is that the                                                           and outdoor readings.
provision of good indoor air quality for staff at work is not just in their
best interest, but also well within their reach.
                                                                                                                                We are now exploring options for installing
                                                                                                                                indoor air quality monitors in other offices
                                                                                                                                in China.
                                                                                                                                                                                                           Douglas Johnson
                                                                                                                                                                                             Corporate Responsibility Manager
                                                                                                                                                                                                     PricewaterhouseCoopers

Figure 4: Global Employee Engagement Rates

 Region                                                                                                              Engaged                                    Not Engaged                          Actively Engaged
 United States and Canada                                                                                                29%                                            54%                                 18%
 Australia and New Zealand                                                                                               24%                                            60%                                 16%
 Commonwealth of Independent States and Nearby Countries                                                                 21%                                            60%                                 19%
 Western Europe                                                                                                          18%                                            62%                                 21%
 Southeast Asia                                                                                                          12%                                            73%                                 14%
 Central and Eastern Europe                                                                                              11%                                            63%                                 26%
 Middle East and North Africa                                                                                            10%                                            55%                                 35%
 South Asia                                                                                                              10%                                            61%                                 29%
 Sub-Saharan Africa                                                                                                      10%                                            57%                                 33%
 East Asia                                                                                                                6%                                            68%                                 26%

Source: Gallup Employee Engagement Study. 2013.

10. Crabtree, Steve. Worldwide, 13% of Employees are Engaged at Work. October 8, 2013. (www.gallup.com/poll/165269/worldwide-employees-engaged-work.aspx?version=print).
11. Yu, Daniela, and Srinivasan, Rajesh. Employee Engagement Increases in China, but Still Very Low. February 20, 2013. (www.gallup.com/poll/160190/employee-engagement-increases-china-low.aspx).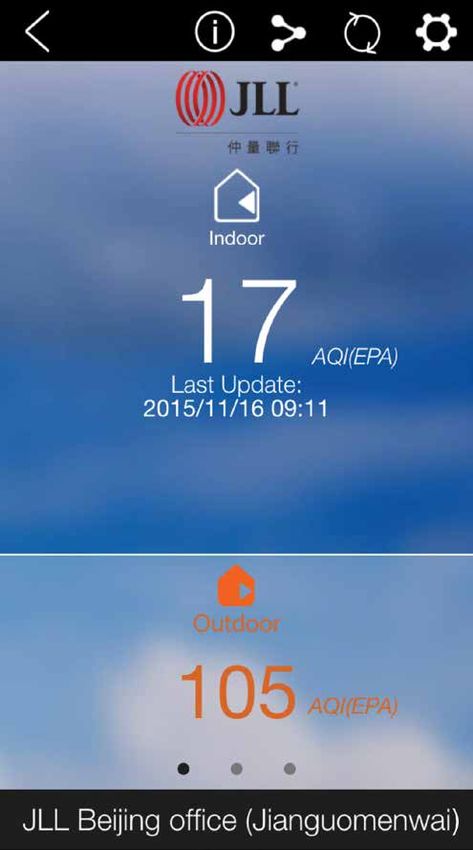
Every breath we take – transforming the health of China’s office space   7

Good indoor air quality can be achieved by following
the 3As (Assess, Act, and Assure).                                          Act on that information.
                                                                            With a sample of 100 data points collected at some 50 commercial
Though the actions taken by employers to improve indoor air quality
                                                                            offices around the country in Beijing, Shanghai, Chengdu, and
in a new or old building will differ, the process undertaken to get
                                                                            Suzhou from indoor air quality testing carried out from 2013 to 2015,
there will be the same. While many employers have a tendency to
                                                                            our partner for this paper, indoor environmental quality consultancy
cut corners at some stage of the process, believing that budgetary
                                                                            PureLiving China, considered almost a dozen factors contributing
requirements will be beyond their reach, this is perhaps unwise.
                                                                            to indoor air quality. This helped us determine what has the biggest
Skipping over a step could lead to serious repercussions – the
                                                                            impact on PM2.5-reduction indoors. Surprisingly, while several
circulation of dirty and dangerous air – that could prove much
                                                                            factors, including building height, occupant density, and green
costlier and painful to fix at a later date. It is also important to note
                                                                            certification had little correlation with the reduction of PM2.5 indoors,
that not all undertakings to improve air quality are necessarily costly.
                                                                            statistical analysis revealed that as a group, mechanical systems,
Moreover, as companies face added pressures to run on lower
                                                                            specifically the heating, ventilation, and air conditioning (HVAC),
operating budgets to increase their competitiveness in the market,
                                                                            and filtration functions, make the most meaningful contributions
we expect more employers in China to place greater emphasis on
                                                                            to cleaner indoor air at offices in China (see Figure 5). Therefore,
finding better balances between achieving good indoor air quality,
                                                                            these should be the prime focus of efforts to improve the air where
energy-efficiency, and cost-savings.
                                                                            we work.

      Assess                     Act                  Assure                Figure 5: Relative Impact of Factors on PM2.5 Reduction

                                                                                 Occupant Density; 3%             Building Type; 2%

Assess your workplace situation.                                              Height of Office; 4%                        Origin of Property Management; 1%

                                                                               Green-certified
When considering a space for lease, tenants should be proactive in               Building; 5%
asking landlords about what has been done to provide good indoor
air quality in the building. For example, does the office tower have                     Green-                       Independent Air
                                                                                         certified                    Purification; 22%
a fresh-air system in place, and is it kept on during all operating                      Office; 7%
hours? Is there a centralised air filtration system? The more
tenants asking these questions, the better, as it motivates landlords                 Elapsed Time Since
                                                                                      Renovation; 8%
to consider these specifications when they do upgrades. It also                                                          AHU Filtration; 17%
applies pressure on them to change their property management
                                                                                            Operable
practices. Yet even if a landlord assures you of excellent air quality,                     Windows; 15%
it is not possible to detect the indoor air quality of a space solely                                          Fresh-air
by relying on their responses. Even in cases where the landlord                                                System; 16%
has answered truthfully, the differences in design, operation,
and maintenance can produce different outcomes. Therefore,
performing due diligence is important. Having air quality tested
                                                                               Independent Air Purification             Green-certified Building
not only provides a snap picture of the situation, but also helps to
                                                                               AHU Filtration                           Height of Office
form the basis for a solution to improve the indoor air quality of the
space in question. For the best results, PM2.5 auditing should be              Fresh-air System                         Occupant Density

conducted by a credible third party, not only before occupation as             Operable Windows                         Building Type
is most commonly done, but actually prior to fit-out commencement              Elapsed Time Since Renovation            Origin of Property Management
to ensure that solutions can be implemented during the fit-out                 Green-certified Office
period (or afterwards as a retrofit). This assessment is critical to
                                                                            Source: PureLiving China Certified PM2.5 Audits (2013-2015)
knowing how to act. For example, is the existing system acceptable
and just in need of a filtration upgrade? Is better maintenance
required? Or what kind of air purification should be added if the
current system cannot be upgraded? As the industry develops
further, pre-testing before signing a lease agreement should be
adopted as an industry standard.
8 JLL
Improving the indoor air quality of an office can be as simple as The easiest way to purify the air is to exploit existing equipment
ventilating the space with fresh air from an open window; this helps and retrofit particulate filtration media into existing air handling units
to dilute air contaminants such as carbon dioxide and VOCs. This (AHUs) of a central HVAC system. AHUs utilising high-efficiency
works in other countries, even in cases where tobacco smoke is filters deliver large amounts of purified air at a minimal cost, while
an issue. However, because China’s outdoor air is typically heavily AHUs operating without a filtration mechanism will be largely
polluted, opening a window brings pollution into the breathing ineffective in reducing PM2.5 levels (see Figure 7). Note that
space. Since open windows do not flush out PM2.5, buildings HEPA (ultra high-efficiency particulate air) filters – while suitable
that rely on opening windows for ventilation achieve only minor for portable air purifiers – are too restrictive of airflow to enable
reductions in PM2.5 concentration. Given that open windows offer the functioning of the HVAC system, which requires slightly more
zero filtration, this method only works on blue-sky days. Therefore, porous filters to achieve the necessary balance between airflow and
many office towers rely on a fresh-air system to ventilate the air the capture of particulates.
within their building. Buildings that use mechanical systems for
ventilation typically incorporate at least some type of filtration,
however, varying filter grades will impact the degree to which the
equipment will be effective (see Figure 6).
Figure 6: Building Ventilation Comparison Figure 7: Impact of AHU Filtration Efficiencies on PM2.5 Reduction
80%
70%
Open Windows 60%
50%
40%
30%
Fresh-air System 20%
10%
0%
0% 10% 20% 30% 40% 50% 60% 70% High-efficiency Medium-efficiency Low or None
Average PM2.5 Reduction Average PM2.5 Reduction
Source: PureLiving China Certified PM2.5 Audits (2013-2015) Note: There is a system called MERV that standardises filtration efficiencies.
Source: PureLiving China Certified PM2.5 Audits (2013-2015)
The importance of performance-based standards Our industry is rapidly
becoming transparent and
In the near future, we shall see a conversion of the market to performance-based performance-based. Whereas this
standards. This will be driven in part by employees whose access to real-time information trend is led by governments in
has already begun to surpass that of employers. As consumer-grade air quality monitors the energy and water sectors, it is
continue to flood the market, air quality in the workplace will increasingly be tested and almost entirely led by individuals
challenged at any and all times by employees. This is an opportunity to create better in the air quality sector.
employee-employer engagement for mutually beneficial outcomes. Performance-based
This trend is moving at
standards based on real-time measurements will become imperative not only for
consumer speed within an
attracting talent, but also maintaining trust and employee satisfaction. Although standards industry that is traditionally slow
will continue to evolve quickly, several key components of what they will determine has and conservative. Those in real
already become apparent: from determining the grade of monitor being used to how and estate who are equipped with the
where these devices are installed. Currently, the RESET Certified Standard is the only proper knowledge, and respond
third-party system to address these questions. quickly, will have much to gain.
Raefer Wallis
Founder and CEO of RESETEvery breath we take – transforming the health of China’s office space 9
Unfortunately, retrofitting the central ventilation or air conditioning
system is not always an option because of the negative impact
on airflow, or the landlord’s unwillingness to allow modifications.
Therefore, many tenants assume that control over their environment
is beyond their reach. However, it turns out that companies can in
fact significantly benefit from installing independent purifiers that
filter the air within the tenant’s space. Depending on the size of the
space or the time permitted for the upgrade, different methods can
be used to filter the recirculating air.
For large spaces where installing a central filter is not possible,
independent air purification is necessary. There are two ways
to approach this. One is the use of portables, which can be
highly effective, but carries cost, maintenance and human error
drawbacks. Meanwhile, in-ceiling solutions are the most effective
and cost-efficient. The in-ceiling approach has been found to be
significantly more effective for big areas compared to portable
air purifiers at floor level due to their high capacity and therefore
sweeping coverage area. In-ceiling systems can also be spaced
apart without any airflow obstructions from furniture. This allows
for evenly distributed filtration at a faster rate and minimal sources
of interruption. By comparison, portables are frequently found
turned off, without a filter, with a dirty filter, or with a filter incorrectly
inserted – all forms of human error that make it difficult for the
machines to work as designed. Portables are also often misplaced
within an office, with objects blocking their air intake and output, and
this, too, handicaps their effectiveness. The results of our analysis
In-ceiling air
(see Figure 8) demonstrate which combinations of mechanical purification systems
systems generate the best results in terms of reducing PM2.5 levels operate with minimal
indoors. A combination of in-ceiling purification, AHU filtration, and a distraction to office
workers.
fresh-air system is most likely to lead to the best possible outcome.
Figure 8: HVAC and Filtration Combination Efficiencies
In-ceiling Air Purifiers + Filtered AHU + FA
High-density Air Purifiers + Filtered AHU + FA
Low-density Air Purifiers + Filtered AHU + FA
Low-density Air Purifiers + Filtered AHU (no FA)
Low-density Air Purifiers (no AHU or FA)
No Air Purifiers, AHU or FA
0% 10% 20% 40% 30% 50% 60% 70% 80%
Average PM2.5 Reduction
Note: Medium-efficiency filters applied to AHU Filtration. High-density portables = > 1 per 50 sqm while low-density portables = < 1 per 50 sqm. FA = Fresh-
air System. AHU = Air Handling Unit.
Source: PureLiving China Certified PM2.5 Audits (2013-2015)10 JLL
The use of mechanical systems (which is anything besides opening Figure 10: Relative Cost for Mechanical System Filtration
the window) is most compelling when extreme spells of pollution hit. Options (per 1% PM2.5-reduction over 3 Years per 1,000 sqm)
Figure 9 shows the actual recorded PM2.5 levels in a 1,000-sqm
Grade A office in Shanghai during a historic “airpocalyptic” episode Portable
in December 2013. This is the true stress-test of the equipment. Air Purifiers
By using in-ceiling air purifiers to filter the recirculating air, the
company’s office effectively achieved a 93 percent-reduction. Indoor In-ceiling
PM2.5 levels never exceeded 40 micrograms per cubic metre while Air Purifiers
outdoor levels soared up to 570 micrograms per cubic metre. The
outdoor Air Quality Index (AQI) reading at the time was off the AHU
charts, but the indoor equivalent only reached the low 100s at Filtration
its peak.
0 500 1,000 1,500 2,000 2,500 3,000 3,500 4,000 4,500
While portable filtration units are quicker to set up and cheaper RMB
by the unit than ceiling units, more portables are required to AHU Filtration In-ceiling Air Purifiers Portable Air Purifiers
cover a larger space. Therefore, portables are most suitable for
smaller rooms (typically working best in spaces smaller than 20 Note: Medium-efficiency filters applied to AHU Filtration.
square metres in size) or temporary offices requiring flexibility in Source: PureLiving China
deployment. While in-ceiling units take comparatively longer to
set up, their installation is still relatively quick, and they can be
hidden with drop ceilings to reduce their visibility and distraction
to employees. While the capital investment required for these
systems is more upfront per unit than portables, they offer greater M Moser Associates has always focused on
longer-term cost-savings due to lower maintenance costs and creating corporate workspaces that are not just
higher coverage per unit (see Figure 10).
attractive and energy efficient, but ones that
people can be comfortable and productive in.
As we see more clients interested in indoor
air quality and health, we believe designing
workspaces with people in mind at the forefront
brings tremendous values to the business.
Elaine Fang
Sustainability Advisory Services
M Moser Associates
Figure 9: December 2013 Shanghai “Airpocalypse” – PM2.5: Outdoor vs. Indoor
PM2.5 (ug/m3)
600
500
400
300 93%
Reduction at peak pollution time
200
US EPA Healthy Air
100 Standard (35 ug/m3)
0
8:00 8:30 9:00 9:30 10:00 10:30 11:00 11:30 12:00 12:30 13:00 13:30 14:00 14:30 15:00 15:30 16:00 16:30 17:00 17:30 18:00 18:30 19:00 19:30 20:00
Time
Outdoor Indoor
Source: PureLiving ChinaEvery breath we take – transforming the health of China’s office space 11
Meanwhile, on-demand automation is the latest tool in the market. Figure 12: Annual Energy Costs per 1,000 sqm (RMB)
Strongly preferred for its ability to reduce human error – or mistakes
RMB
commonly made when it comes to manually operating purifiers,
30,000
such as cleaners accidentally turning units off on “good days” and
people fighting over the control switch without understanding how 25,000
the machines work. On-demand automation is also highly efficient 20,000
and energy-saving as pre-programmed functions enable air filtration
15,000
systems to respond to real-time air quality readings and turn on or
off according to actual conditions, which helps to streamline the 10,000
consistency of good indoor air quality (see Figure 11). Because 5,000
the machines do not need to be kept on at all times, on-demand
0
automation also lowers operating costs through energy savings (see Always On On On-demand Automated Operation
Figure 12). Therefore, we expect interest in on-demand automation (24 Hours/day & 7 days/week) 07:00-19:00 07:00-19:00
(workdays) (workdays)
to grow as the number of employers investing in better indoor air
quality rises. Shanghai Beijing
Note: On-demand automation calculation based on pre-programming that
turns machine off once outdoor PM2.5 levels drop below 75 ug/m3.
Source: PureLiving China
Figure 11: On-demand Automation vs. Manual Operation: PM2.5-reduction Trend
PM2.5 (ug/m3)
180
160 Working Hours
140
120
Incorrect Speed or Turned Off
100
80
60
US EPA Healthy Air On Unnecessarily
Standard (35 ug/m3) during Non-working Hours
40
20
0
0 0 0 0 :00 0 :00 :00 :00 :00 :00 :00 :00 :00 :00 :00 :00
6:0 7:0 8:0 9:0 10 11
:0
12 13 14 15 16 17 18 19 20 21 22
On-demand automation system: indoor PM2.5 concentration (ug/m3)
Manual system: indoor PM2.5 concentration (ug/m3)
Source: PureLiving China12 JLL
The key selling
point of RESET
for the China
office market is
that it grades the
indoor air quality
of a space based
on the results of
a three-month
period of
continuous
monitoring
which pays
close attention
to PM2.5 levels.
Assure that good air quality is maintained by a three-month period of continuous monitoring that pays close
attention to PM2.5 levels. Certified spaces are subsequently tracked
continuously monitoring your accredited space. with a real-time monitoring app online that conveniently enables
Many landlords and employers mistakenly assume that once the indoor air quality conditions to be displayed publicly for employees
installation is complete, there remains nothing left to do. In fact, to follow. With certified, live readings and metrics, the app offers a
the real work begins after a designated system is up and running. high degree of transparency for operations teams to continuously
The ability of employees to track air quality in real-time with indoor improve indoor air quality. Equally important, the app, along with
air quality monitors and mobile apps is rapidly driving the industry similar apps that track indoor air quality conditions in real-time, such
toward performance-driven solutions, putting more pressure on as GAM Systems (www.gam-system.com), used at JLL offices in
employers to provide safe air during working hours. This is also China, offers employees high visibility of air quality conditions in
exerting more pressure on landlords, as tenants expect their their workspace (see Figure 13).
buildings to deliver consistently good indoor air quality. Additionally, real-time monitoring apps are a powerful feedback tool
The next step is monitoring to validate and fine-tune performance in holding both landlords and tenants accountable for the indoor air
of the equipment, as well as improve training and communications quality of their space on a regular basis. It ultimately encourages
among the staff operating the machines. Best of all, automated both sides to work together to make certain that problems
operations allow both landlords and employers to take care of all of are rectified quickly as they arise, further helping to minimise
this while getting the most out of their system. Industry certifications interruptions to good indoor air quality.
such as RESET (www.reset.build) or WELL (www.wellcertified.
com) help protect occupant health with specific requirements for Figure 13: Application of Real-time Monitoring
criteria affecting indoor air quality. Not only do these accreditations
provide a road map and standard for creating healthy spaces, they
provide marketing benefits and recognition for those who make
the effort and achieve real results. Dedicated to the overall comfort
and well-being of occupants, the WELL accreditation takes on a
holistic approach, demanding a series of requirements that include
strict standards on factors affecting indoor air quality. The RESET
certification differs from WELL in that it primarily concentrates on
indoor air quality with a focus on PM2.5, and because of this, it is
arguably the most relevant to the China market and others where
pollution poses challenges. Starting at the design phase, RESET
considers the indoor health of a space by drawing from a database
categorising the safety and/or risk of some 104,000 materials – a
key element of the equation, but beyond the scope of this paper.
The key selling point of RESET for the China office market is that GAM Systems app
it grades the indoor air quality of a space based on the results of screenshot at JLL’s
corporate office in Beijing.Every breath we take – transforming the health of China’s office space 13
Investments in indoor air quality help to differentiate to the market. This will help properties with good indoor air quality
office buildings from competitors, better enabling to be more resilient in periods of economic downturn or slow growth
them to retain value in any market. due to their long-term market viability, according to the results of
a 2013 Beijing Tenant Survey (by Building Owners and Managers
While employers have numerous reasons incentivising them to Association (BOMA) China) indicating that health and safety are a
act quickly, it should also be recognised that landlords, too, have priority for building satisfaction (see Figure 14).
a very persuasive case to be proactive in leading the market. As
more landlords consider HVAC upgrades, making the right level of
investment in system upgrades will be essential. Under investing Figure 14: Most Important Criteria for Building Satisfaction
has been the case historically and should be avoided. However, Greenery 4%
over-investing from an insufficient assessment of the situation is Tenant Service 12%
also to be avoided. The bottom line is that office towers with good
indoor air will only be more appealing to tenants. Buildings without
good indoor air quality will provide tenants with less incentive to Health and Safety Building
sign or renew their leases, particularly in older buildings where 43% Management
tenant leases are nearing expiry. In the worst-case scenario, 22%
tenants will move into buildings with cleaner air. Even buildings with
very high occupancy are still susceptible to losing tenants. Today,
office buildings with good indoor air quality are able to differentiate Exterior Aesthetic 3%
themselves from competitors. Later, as more buildings upgrade Facility Convenience 16%
their systems, those with the best equipment (specifically fresh-air
systems and AHU filtration) will be able to maintain their relevance Source: 2013 Beijing Tenant Survey by BOMA China
What lies ahead
There is evidence that strict government pollution controls in China are working. Beijing observed humble improvements in PM2.5 levels in 2014
compared to 2013, and this trend is expected to continue in 2015. However, experts believe that it will still be decades before outdoor pollution
levels in China fall to those of mature markets. Due to the alarming conditions in China, pollution has become a mainstay of daily conversation
all over the country. As a result, routine habits such as wearing protective masks, using air purification machines at home, and checking
mobile apps for real-time outdoor readings on air quality before planning activities outside have become commonplace for millions of people
nationwide. Perhaps, the tipping point for people in China, public pressure on the government to put an end to the haze has been mounting ever
since the “Beijing Airpocalypse” in January 2013. The Chinese government’s most recent pledge to combat pollution as part of China’s 13th
Five-Year Plan (2016-2020) illustrates that leaders are focused on the issue, but the reality is that there is no immediate solution to the problem.
China’s Energy Policy Outlook
National Air National
12th Five-Year Plan 2013 2014 Pollution Plan Energy Plan
(2011-2015) (2013-2017) (2020)
Coal Power
% of Energy ~ 65 66-67 64.2 < 65 < 62
Non-Fossil Fuel Power
% of Energy 11.4 9.8 11.1 13.0 15.0
Gas Power
% of Energy 7.0 5.9 >6 9.0 > 10
Curbing Coal Usage and Increasing Reliance on Non-fossil Fuels
Source: Greenpeace Beijing’s New Normal
Presentation. 2015.14 JLL
Pollution in China is not just a Beijing problem according to data collected from some 1,500 ground stations in and
– or even a North China one – it is far-reaching around the country in 201413. Considering the vast reach of pollution
and affects the entire country. in China, complacency, whether in Beijing or not, would be unwise.
When people think of pollution in China, Beijing automatically comes
to mind. Following the “Beijing Airpocalypse” in January 2013 – Pollution presents numerous challenges for
when PM2.5 concentrations soared to more than 22 times the level China. With regards to its bearing on indoor
deemed safe by the World Health Organization12 – media headlines air quality, topical clinical research in China is
have largely focused on Beijing. The attention has since put the limited, but is expanding quickly as awareness
capital under constant scrutiny for its bad air, yet Beijing is far from has grown exponentially in just the last few years.
experiencing the worst air in the country. In fact, several other
cities have also experienced their own “airpocalyptic” episodes.
Moreover, contrary to popular belief, the impact
of unpleasant and unhealthy conditions on
While some places are worse off than others are, the reality of the
productivity is as pronounced in China, if not
situation is that the bad air in China directly affects nearly every more than overseas studies indicate.
pocket of the country (see Figure 15). As a region, the corridor
that extends south-west from Beijing, meanwhile, suffers from the Zhouhui Zhao
highest concentration and largest sources of pollution in China, Associate Professor
School of Public Health at Fudan University
Figure 15: Air Pollution in China
Unhealthy for 140
Good Moderate Unhealthy
Sensitive Groups
50oN
120
Harbin
45oN
Changchun
Annual Average PM2.5 (ug/m3)
100
Shenyang
Baotou
40oN Beijing Tangshan
Shijiazhuang 80
Weifang
Latitude
35oN Lanzhou Heze Linyi
Xi’an
Zhoukou
Fuyang 60
Chengdu Shanghai
Wuhan
30 oN
Chongqing
Wenzhou 40
Guiyang
Kunming Ganzhou
25oN Quanzhou
Guangzhou Gaoxiong 20
20oN
0
100 oE
105 oE
110 oE
115 oE
120 oE
125 oE
130 oE
Longitude
Source: Berkeley Earth’s Air Pollution in China Study. 2015.
12. WHO caps PM2.5 exposure at 25 micrograms over a 24-hour average.
13. Rohde RA, Muller RA (2015) Air Pollution in China: Mapping of Concentrations and Sources. PLoS ONE 10(8): e0135749. doi:10.1371/journal.pone.0135749 (berkeleyearth.org/)Every breath we take – transforming the health of China’s office space 15
Figure 16: Air Quality Index Group Categories for 64 Cities in China
Guangzhou Suzhou
Zhongshan
Kunming
Fuzhou Nanchang
Haikou
Zhuhai Foshan Changsha Jinhua
Qingdao
Dalian
Xiamen
Quanzhou
Shenzhen
Wenzhou
Nanning Wuhu
Guiyang Mianyang
Chongqing Wuxi
Ningbo
Grade 1 (Best) Shanghai Hangzhou
Changzhou
Shenyang Grade 2
Chengdu Grade 3
Beijing
Harbin Xi’an Jinan
Hefei
Wuhan Nanjing Tangshan
Shijiazhuang
Tianjin
Grade 4 Zhengzhou
Grade 5 (Worst)
JLL China60 Overall Index City Report Score JLL China City Tier
Highest Lowest Highest Lowest
Note: Grade 1 refers to the best group; Grade 5 refers to the worst group. The best city’s annual average AQI was 43 according to the Chinese standard,
while the worst was 170.
Source: Minisitry of Environmental Protection of China, JLL China60 Report (www.jll.com/china60)
JLL’s own analysis of full-year 2014 air quality statistics separated Yet for all of the times that Beijing is put in the hot seat for pollution,
64 major Chinese cities into quintiles according to their annual it is fair to say that the pollution peaks are high in the capital. When
average China AQI readings (see Figure 16). The groupings comparing China’s two main cities, Beijing frequently has more
rank the relative severity of cities across China and illustrate that “bad air” days than Shanghai (see Figure 17). While this hardly
while coastal cities enjoy some reprieve from the sea breeze, air means that Shanghai is immune to the situation, this fact does add
quality levels rapidly deteriorate as one moves inland a few dozen more weight to the argument for landlords and tenants in Beijing –
kilometres. comprising one of the most influential markets in the country – to act
sooner rather than later and set the tone for the country.
Figure 17: 2015 Air Quality Index (from January to end-October)
400
350 Shanghai Average 87
Beijing Average 115
300
250
200
150
100
50
0
Jan Feb March April May June July Aug Sep Oct
Shanghai AQI Bejing AQI
Note: AQI refers to the Chinese Air Quality Index.
Source: Ministry of Environmental Protection of China16 JLL
Healthy buildings foster development of While pollution is harder on the young and old, it does not
discriminate, and therefore, after lengthy amounts of exposure to the
truly innovative cities by helping bad air, everyone will suffer in some form or another. From 2000 to
thwart “brain drain” 2012, cancer rates and incidence of diseases linked to air pollution
It is no secret that innovation is a key measure to further have increased significantly for both men and women in China14.
enabling China to compete globally. For the nation to push Considering that urban residents in China spend an average of 87
ahead as a legitimately innovative force, however, it will percent of their time indoors15, improvement in indoor air quality will
require top talent. Yet, as China’s most highly educated and have a tremendous potential gain for public health, for which costs are
skilled residents move abroad, seeking so-called greener expected to continue rising16.
pastures in developed countries, where healthier living and Moreover, the direct impact of particulate matter on health shows a
cleaner air are part of the draw, the need to better manage disturbing reality, with residents in China subject to extremely high
China’s pollution is undeniable. In 2013, the number of risk of heart disease, stroke, pulmonary disease, lung cancer, and
Chinese residents overseas totalled 9.34 million people, children’s respiratory diseases (see Figure 18). Using Beijing as a
almost double the figure in 2000, underlining the extent of the case study, we see that even though the city’s annual average PM2.5
country’s “brain drain” deficit (see chart below). figure is expected to improve modestly from 2014 to 2015, it is still
Given rising health complaints and surging health care costs, exponentially greater than that of Los Angeles – the most notoriously
the move toward sustainable development in China will be a polluted US city. This shows the polar gap between both cities and
key component for helping re-route citizen outflow patterns in underscores the serious public health issues facing Beijing.
the future*. Increasing difficulties in attracting and retaining Therefore, without sincere and effective actions taken to reverse
top talent will effectively impede economic development and these trends soon, it will only be a matter of time before the toll on
competitiveness among global counterparts. Thus, at a time China’s workforce overburdens the market and has far-reaching
when swelling numbers of people are leaving and relatively implications which worsen the situation. With this in mind, it would
few are arriving, the importance of a healthy office market – be in the best interest of the market as a whole to move swiftly to
capable of not only protecting China’s brightest minds, but provide more breathable working spaces.
also of attracting top talent from elsewhere – is arguably more
critical now than ever. Figure 18: Increase in Risk of Death from Air Pollution-related Diseases
120% Beijing 2014
Beijing 2015*
Population Inflows and Outflows for China 100% Los Angeles 2014
9.34
8.76
80%
Increase in Risk
5.49
4.08 60%
376 508 757 848
40%
1990 2000 2010 2013
Foreigners in China (thousands, people)
20%
Chinese Nationals Abroad (millions, people)
Source: Center for China & Globalization’s Annual Report on Chinese
International Migration. 2014. 0%
0 10 20 30 40 50 60 70 80 90 100 110 120
Annual Average PM2.5 (μg/m3)
Ischaemic Heart Disease
Stroke
Chronic Obstructive Pulmonary Disease
Lung Cancer
Children’s Lower Respiratory Diseases
*Note: Forecast as of October 2015 (Greenpeace Beijing’s New Normal
* Annual Report on Chinese International Migration: 2014. Center for China & Globalization. Presentation).
Source: Greenpeace, Global Burden of Disease, and the US South Coast
Air Quality Management District
14. China Statistical Profile. World Health Organization. January 2015. (www.who.int/gho/countries/chn.pdf?ua=1).
15. China’s Ministry of Environmental Protection. Exposure Factors Handbook of Chinese population: Adult Edition. Beijing, China: China Environmental Science Press, 2013.
16. The Innovation Center for Social Risk Governance in Heath associated with Fudan University; 2015. (srghealth.fudan.edu.cn/a/news/2015/0603/264.html).Every breath we take – transforming the health of China’s office space 17
Clean office air is hard to come by Some buildings have worse air quality indoors than outdoors.
Throughout the second half of 2015, JLL Research inspected PM2.5 Some buildings achieve no improvement at all. In fact, about
levels in 160 office buildings in Beijing, of all grades, located in the one-quarter of all buildings surveyed showed worse air quality in
urban area. While not a thorough, scientific testing process like that indoor working areas than outdoors. Reasons could potentially
used by professional testing companies such as PureLiving China, include air intakes drawing from parking garages, or insufficient
where tests are conducted over multiple days with sophisticated fresh air intake. Limited fresh air intake could cause a build-up
sensors, the JLL Research team spot tests are a quick snapshot of particulates. In a handful of extreme cases, indoor air was 50
and an indication of the situation using consumer-grade tools. (Also, percent worse than outdoor air, which needs to be addressed. The
off-gassing and other indoor air issues are a different discussion not key point about PM2.5 levels is prolonged, extended exposure.
covered here.) While brief exposure is acceptable, long-term exposure – where
people work daily – is where the damage is done.
JLL took spot measurements in five locations: outdoors, which
establishes a baseline, followed by the lift lobby, office corridors, Washrooms and stairwells are often worse.
stairwells, and washrooms. Buildings tested on days with outdoor We repeated the analysis with measurements taken in washrooms.
baseline PM2.5 readings below 20 micrograms per cubic metre were In these areas, circulation is often not ideal, and in some buildings,
removed (relatively clean days), leaving 145 buildings for analysis. tobacco smoke can also be a factor. A third of washrooms sampled
Ninety percent of office buildings in Beijing are not achieving a had air quality worse than outdoors. Also, more than two-thirds of
substantive reduction in PM2.5 with their current systems. washrooms have higher PM2.5 readings than the working areas,
and almost 10 percent of the buildings had washroom readings that
We compared the indoor readings with outdoors. A substantive were double that of the working areas.
means at least a 60 percent reduction in PM2.5 readings over
ambient outdoor levels. This means that the vast majority of the Washroom vs. Working Area*
buildings we tested are unlikely, with the exception of low-pollution
days, to be able to maintain indoor PM2.5 levels within a safe range. Minimum Maximum
Only about 4 percent of buildings achieved drastic reductions of 80 -100% -81% 0% Better
percent or more. It is these state-of-the-art buildings that set the -80% -61% 0%
example for others to follow. -60% -41% 0%
-40% -21% 5%
While many buildings (about half) achieved slight or moderate
-20% -1% 27%
reductions in PM2.5, they are defenceless against elevated levels of
0% 19% 36%
pollution. For example, a 20 percent reduction of a high PM2.5 level is
still an undesirably high level. Similarly, a 40 percent reduction is still 20% 39% 14%
not satisfactory. In the first 10 months of 2015 in Beijing, 81 days were 40% 59% 4%
considered unhealthy, with an AQI over 150. This is approximately 60% 79% 4%
one out of three days. On these days, it would take a 60 percent to 80% 99% 1%
80 percent reduction indoors to reach levels equivalent to a nice, – More 8% Worse
blue-sky day. In spite of this, even a small reduction is a start.
*Days with outdoor air over 20 micrograms per cubic metre.
Source: JLL Research
Office Working Area PM2.5 Level vs. Outdoors*
Minimum Maximum JLL also investigated stairwells, which are usually much less
-100% -81% 4% Better climate-controlled. They are also prone to particulate build-up and
-80% -61% 7% tobacco smoke in some buildings. We considered 122 buildings
-60% -41% 15% with accessible stairwells. While PM2.5 in almost a quarter of office
building working areas exceeded outdoor levels, this number nearly
-40% -21% 28%
doubles in stairwells. However, given that occupants spend little
-20% -1% 23%
time in stairwells and washrooms compared to working areas,
0% 19% 14%
it is the working areas that should remain the focus for PM2.5
20% 39% 6%
reduction efforts.
40% 59% 3%
60% 79% 1%
80% 99% 0% Worse
*Days with outdoor air over 20 micrograms per cubic metre.
Source: JLL ResearchYou can also read