DIGITAL ECONOMY GROWTH AND MINERAL RESOURCES - Implications for Developing Countries - UNCTAD
←
→
Page content transcription
If your browser does not render page correctly, please read the page content below
DIGITAL ECONOMY GROWTH AND MINERAL RESOURCES
        Implications for Developing Countries

                                                No16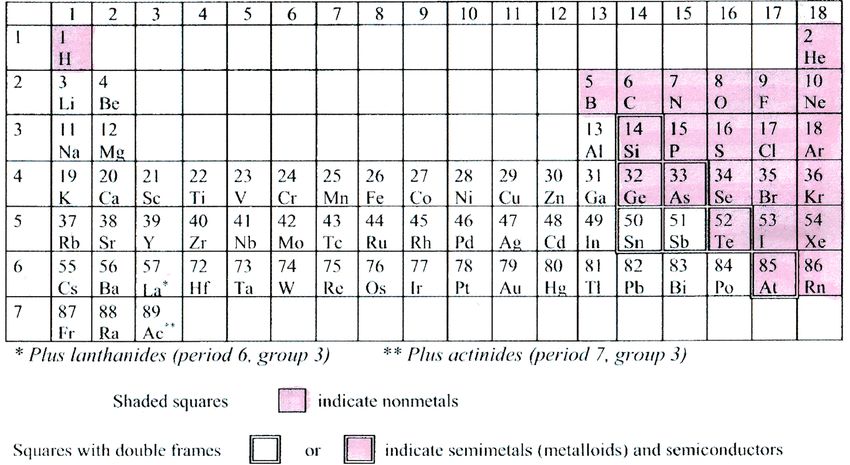
UNCTAD, DIVISION ON TECHNOLOGY AND LOGISTICS
               SCIENCE, TECHNOLOGY AND ICT BRANCH
               ICT POLICY SECTION
                                                                      TECHNICAL NOTE NO16 UNEDITED
                                                                                TN/UNCTAD/ICT4D/16
                                                                                     DECEMBER 2020

           Digital economy growth and mineral resources:
                implications for developing countries1

Abstract: This technical note examines the link between growing digitalization of the world economy
and the demand for various elements. It feeds into the overall research work of the UNCTAD E-
commerce and Digital Economy (ECDE) work programme.

The study focuses on the following issues in view of the growing use of digital technologies: What
metals/minerals will be more demanded as a result?; What changes in demand can be expected
compared with today's situation?; Which mineral-rich developing countries are likely to be most
affected by the growth in demand of different metals and minerals?; Which are the main actors
(including possibly new actors such as digital companies) involved in the extraction, smelting and
refining of these minerals and metals?; and How recyclable will these "new" metals be and to what
extent may they be adding to the problem of "e-waste"?

Based primarily on desk top research, complemented by a few interviews with representatives from
industry and academia, the study deals primarily with the functional parts of computers and other
devices, which are at the core of the digital economy. Demands for raw materials from the structural
parts of the devices and the networks necessary as well as their energy supply and the consequences
of the transition to a fossil free world are not covered.

1
  This technical note was prepared by Magnus Ericsson, Olof Löf and Anton Löf of RMG Consulting, with
contributions and guidance from Torbjörn Fredriksson. Valuable comments were received from Shamika N.
Sirimanne. The note was commissioned by the ICT Policy Section of UNCTAD as background for the E-
commerce and Digital Economy work programme. Financial contribution from the Government of the Netherlands
is gratefully acknowledged.
Contents
Executive summary ................................................................................................................................. 4
Introduction............................................................................................................................................. 6
   Elements, metals and non-metals ....................................................................................................... 7
What elements will be covered in the study and why? .......................................................................... 8
   Properties of the seven ICT elements ............................................................................................... 13
What changes in demand can be expected? ........................................................................................ 14
Which mineral-rich countries are likely to be most affected by the demand growth by digitalization?
............................................................................................................................................................... 17
   Resources and reserves ..................................................................................................................... 20
Which are the main actors? .................................................................................................................. 20
   Gallium .............................................................................................................................................. 22
   Germanium........................................................................................................................................ 22
   Indium ............................................................................................................................................... 22
   Rare earth elements .......................................................................................................................... 23
   Selenium ............................................................................................................................................ 24
   Tantalum ........................................................................................................................................... 25
   Tellurium ........................................................................................................................................... 25
   New actors......................................................................................................................................... 25
   Summary ........................................................................................................................................... 26
How recyclable will these elements be and to what extent may they be adding to the problem of “e-
waste”? .................................................................................................................................................. 27
Conclusions............................................................................................................................................ 29
Bibliography........................................................................................................................................... 31
Annex tables .......................................................................................................................................... 34

Figure 1 Periodic table metals, non-metals and semi-metals ................................................................. 7
Figure 2 Elements of a smartphone ...................................................................................................... 10
Figure 3 Production value of digitization metals (% of total value of all mined elements) .................. 13
Figure 4 Production of seven ICT elements 2018 (MUSD) .................................................................... 19
Figure 5 Relative importance at the mine stage of seven ICT elements 2018 by value (MUSD) .......... 19
Figure 6 Production (all stages) of seven ICT elements 2018 by value (MUSD) ................................... 20
Figure 7 Rare earth elements production 1965 - 2020 ......................................................................... 24
Figure 8 Recycling of ICT elements - indium as an example ................................................................. 28

Table 1 Elements important for the digital economy ............................................................................. 9
Table 2 Selected elements for the digital economy .............................................................................. 12
Table 3 Production volumes (t) and values (MUSD) for elements for the digitised economy 2018 .... 12
Table 4 Origin of seven elements .......................................................................................................... 15
Table 5 Potential future demand for ICT elements ............................................................................... 16
Table 6 Potential future demand for ICT elements by Internet of Things ........................................... 17
Table 7 List of producing countries of seven elements 2018 (MUSD) .................................................. 18
Table 8 Recycling rates for ICT elements (in bold) and battery metals ................................................ 28

2|Page
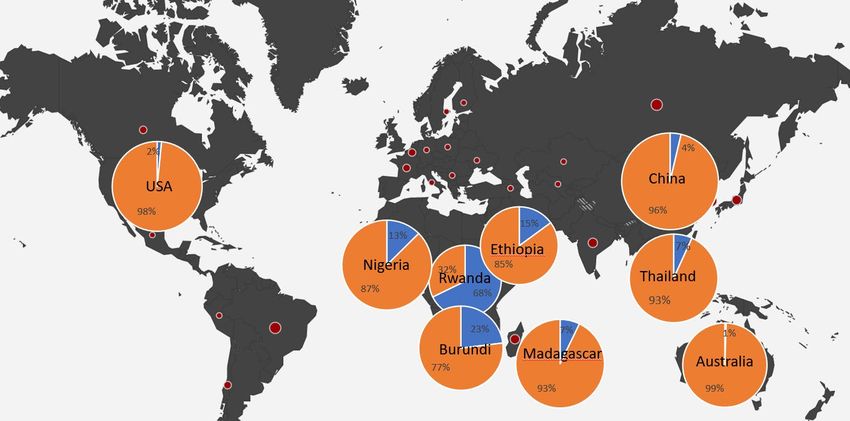
Table 9 Resources and reserves of seven ICT elements ........................................................................ 35
Table 10 Major companies producing gallium ...................................................................................... 36
Table 11 Major companies producing germanium ............................................................................... 37
Table 12 Major companies producing indium....................................................................................... 38
Table 13 Major companies producing rare earth elements.................................................................. 39
Table 14 Major companies producing selenium ................................................................................... 40
Table 15 Major companies producing tantalum ................................................................................... 41
Table 16 Major companies producing tellurium ................................................................................... 42

3|Page
Executive summary
The fast-evolving digital economy demands an increasing number of elements for devices such
as computers, mobile phones and networks. This study focuses on seven information and
communications technology (ICT) elements: gallium, germanium, indium, rare earth elements
(REEs), selenium, tantalum and tellurium. They are all “functional elements” that are essential
raw materials for the building blocks for all ICT hardware, such as microchips and integrated
circuits.

These ICT elements have become widely used during the past decades but mostly in minute
quantities. Of the seven elements, only the REEs are produced in more than a few thousand ton
globally every year. Even the REE production amounts to less than 200,000 ton compared to,
for example, the 60 million ton of aluminium or 2 billion ton of steel. Aluminium and steel are
“structural elements”, used to house the functional parts of a computer and for the infrastructure
around its core, such as energy storage, electric motors, etc. Together with the so-called battery
metals (cobalt, nickel and others) these structural elements have been extensively studied and
are not examined in this review. All the seven ICT elements have a wide range of uses outside
the ICT sector. However, for gallium, germanium, indium and tellurium the ICT sector
dominates. In 2018, the total value of the production of the ICT elements was around $5 billion,
or 0.77% of all mined elements (metals and industrial minerals) excluding coal.

While REEs and tantalum are primary products from specific mines, the other five elements are
by-products from copper, bauxite, lead/zinc or coal mines, extracted at later process steps of
smelting or refining. The supply of these elements is in general not an issue. Only limited parts
of what could potentially be extracted from the total volumes of the primary products is
currently utilized. The small absolute production volumes needed make it realistic to cover also
large future increases in demand for all the seven elements with limited investment and within
short time frames, possibly with the exception of REEs.

The mines from which the seven elements originate are located all around the world. Among
developing countries (excluding China), the Democratic Republic of the Congo (DRC),
Rwanda, Brazil, Nigeria, India, Madagascar, Ethiopia, Thailand, Viet Nam and Burundi have
the highest economic value of production of the ICT elements, ranking from $315 million in
the DRC to as little as $10 million in Burundi. For Rwanda, the production of tantalum accounts
for 68% of the total value of all metals produced there, making it the country in which ICT
metals contribute the most to the national economy relative to GDP. For the other African
countries mentioned above, ICT elements contribute 23% of the value of total mine production
in Burundi, 15% in Ethiopia, 13% in Nigeria and 7% in Madagascar. In all these countries,
tantalum is the most important element.

Meanwhile, China and in high-income countries host most of the smelting and refining steps,
which are the most important in the global value chains related to the ICT elements. The ICT
elements are often needed in extremely pure form, 99.999% (five nines or more, 5N+) purity,
and a few such high-tech production units are enough to cover world demand. Chinese
producers dominate production with around 90% of global output of gallium and germanium
and some 70% of the REEs. For indium and tellurium, they account for half the world output
while their share is below 25% for selenium and tantalum.

Traditional transnational mining companies do not have the tight control over the production
of the ICT elements as they have over base metals, such as iron ore and bauxite. Relatively

4|Page
small and highly specialized companies account for the final and most important refining steps.
The small volumes of production and the fragmented ownership structure make the related
markets fairly opaque. The Chinese producers of ICT elements are often privately held which
adds to the difficulties of finding data. The strategic importance for military purposes of some
of the ICT elements have added another layer of secrecy, which makes it difficult to track who
produced what and even more difficult to trace ownership of the companies involved. It is,
however, clear that vertical integration remains limited in this sector.

Among the transnational companies, a handful are central to the entire sector: Umicore
(Belgium), Teck (Canada), Indium Corp. (USA), Mitsubishi (Japan), Dowa (Japan). A few
others are scattered around the world.

Opportunities for developing countries to benefit from increased demand for ICT elements are
quite limited, mainly because of the small volumes demanded and the limited value of these
elements in absolute terms. African production of tantalum represents 78% of total production
and this is the only one among the seven ICT elements where mines in developing countries
excluding China play a key role. For selenium, African production accounts for 11%, for indium
5% and for the remaining elements the share is negligible.

The present trade conflict between China and the United States and other high-income countries
might lead to some restrictions of exports of ICT elements from China and possibly open up
further opportunities for other countries. However, given the need for specific production
facilities, skills and know-how to produce these elements, such a development would require
significant investment in capacity development over several years.

The recycling rates of the ICT elements are high in that the amount of primary scrap recycled
is considerable. However, recycling of end-of-life products, such as smart phones, is miniscule.
New approaches with design for recycling and reuse and improved collection of used computers
and smart phones will become necessary to change this situation.

5|Page
Introduction
The pace of digitalization in the world economy is steadily increasing (McKinsey 2015, DERA
2016, UNCTAD 2019). Information and communications technologies (ICTs) are given a
central role in these developments. Computer application software, in particular algorithms,
have gradually come to influence life for billions of people around the world. The number of
smartphones sold annually was about 1.3 billion units in 2019 (Mongardini and Radzikowski,
2020). In 2018, 9 billion items were connected to the Internet of Things and with an expected
growth rate of 17% annually the number could exceed 22 billion in 2025 (McKinsey 2016,
European Commission JRC 2020, DERA 2016). The amount of information and data produced,
stored and exchanged is expected to grow even faster. Increasing at a breakneck speed by more
than 500% between 2018 and 2025, when 175 ZB (zettabyte 2) may be handled globally
(European Commission JRC 2020). Some followers of these developments claim that when
transitioning to 5G and 6G, demand for speed, capacity and new hardware will explode and
possibly increase speed of change even more (Ny Teknik 2020). But even if computers, tablets
and smart phones have become smaller and smaller but more powerful, following Moore’s law,
the sheer number of hardware items also creates a significant demand for a wide range of
materials including many elements which have so far been of narrow scientific interest. The
equipment for storage and distribution around the world of giant dataflows add to the raw
materials demand.

Even in the emerging world of e-commerce and the digital economy, the hardware will retain
a central position as will the surrounding infrastructure and support systems, in particular
energy supply, and create additional demand for materials. The necessity to reduce the use of
fossil fuels in global energy systems has speeded up the transition to renewable energy sources
and new energy storage solutions. While the impact on the demand for metals and minerals by
the transition to a fossil-free future has been relatively well studied (World Bank 2017 and
2020, UNCTAD 2020), the demand for raw materials created by hardware (such as computers,
fibre optical cables, computer chips and its building blocks such as capacitors and others, diodes
and screens etc) is less examined. It is this “core” of the digital economy that is in focus for this
report, recognizing that also when expanding out of this core into the broader scope including
e-commerce, e-mobility, industry 4.0 with robots, microprocessors and process control etc.,
these sectors will require huge additional amounts of raw materials. The digital sector is further
enabling change and development in almost all other parts of national and global economies,
thereby indirectly generating new demand for raw material.

The analysis contained in this report can be seen as a pre-study of the likely impact on demands
and what implications this might have for mineral rich developing countries. It sheds light on
the following five questions:
    • What elements will be most affected by increased demand?
    • What changes compared with today’s situation can be expected?
    • How will mineral rich developing countries be affected?
    • Which are the main actors (including possibly new actors such as ICT companies)
        involved in the raw material supply for these elements?
    • How recyclable will these elements be and to what extent are they adding to the problem
        of “e-waste”?

2
    One zettabyte is 1021 or one billion trillion transactions.

6|Page
But before going into these questions, it will be useful to make a brief introduction to some
basic chemical definitions.
Elements, metals and non-metals
The elements are the building blocks of all matter, whether the earth’s crust, the oceans, the
atmosphere, all man-made materials including textiles, plastic products and metal alloys or
biological material and living matter. There are over 100 elements which are systematically
organized in the periodic table according to their inner structure. Each element has been given
an atomic number 3 according to how the number of protons it contains. Thus, elements close
to each other in the periodic table often have similar properties.
The elements can be divided into metals and non-metals. Metals are typically elastic, ductile
and strong, with good conductivity for heat and electricity (Enghag 2004). The remaining
elements form the non-metals including gases, such as hydrogen, nitrogen and oxygen, and a
range of other elements on the right-hand side of the periodic table (Figure 1). The border
between metals and non-metals is not sharp, however. Elements along the borderline show both
metallic and non-metallic properties. They are called metalloids or semi-metals. Many of the
elements that are important for the production of various ICT goods belong to the semi-metals
and are interesting exactly because they have this dual character and can behave as
semiconductors. Silicon (Si) and germanium (Ge) in group 14 (column in the period table) are
semiconductors but also elements on both sides in group 13 and 15 have semiconductor
properties. Gallium (Ga), and indium (In) combined (doped) with phosphorous (P), arsenic
(As), and antimony (Sb) give semiconductors with specific properties.
Figure 1 Periodic table metals, non-metals and semi-metals
Source: Enghag 2004.
3
The figure in the top left corner for each element in the periodic table.
7|PageIn the crust of the earth, elements are found mostly as minerals, which are combinations of elements. When these minerals are concentrated enough to make mining economically and technically viable, a mineral deposit is created. The traditional four main steps of metal production can start: mining, processing, smelting and refining. Many of the ICT elements are demanded in ultra-pure qualities which makes it necessary to refine to 99.999% and higher (5N, five nines) levels of purity and a second refining step is added which is often done by specialized companies with the required expertise. These final process steps treat very limited volumes of material, often only kg quantities, in each batch and under particular conditions, for example, a helium atmosphere. 4 What elements will be covered in the study and why? A computer could for simplicity be divided into two main parts: A structural part using mostly metals and polymers and a functional part with components including metals and semimetals/semiconductors. 5 Among the structural metals, aluminium, tin, nickel, steel, magnesium and lead are the most common. These are all widely used in many other applications and the use in computers mostly only accounts for a small part of their total usage. 6 The functional elements are often used in small quantities and include a large number of elements. Many of these have only found wide usage, even if in minute quantities in each smart phone or portable computer, during the past decades. As noted above, the focus in this paper will be on the functional metals and semimetals most directly related to ICT hardware. Table 1 lists twenty-four elements which could be considered important for the digital future. It could be argued that additional elements should be included in the table. The explosion of elements that are present in a smartphone compared to a traditional fixed line telephone from the mid-twentieth century is frequently used as an illustration of the complexity of modern IT products (see for example Achzet et al 2012). The screen alone is made up of at least 14 elements (see Figure 2). Different memory technologies use aluminium, antimony, arsenic, chromium, cobalt, germanium, hafnium, indium, iridium, manganese, neodymium, nickel, platinum, ruthenium, selenium, silicon, tantalum, tellurium, tungsten, zirconium in all 21 elements mostly in minute amounts (European Commission JRC 2020). Given the nature of this brief study, however, it is not possible to analyze all of them in depth, and the use of, for example, aluminium in computer magnetic RAM memories is of no importance whatsoever on the overall aluminium markets or the potential for developing countries economies (Ku 2018). 4 Such new demands for helium have made that element potentially a critical resource and necessary for the production of ICT products but it is not covered in this study. 5 The study does not deal with the polymers (plastic) which are mainly built by hydrocarbons (oil and gas) although they could also be produced based on plant and forest raw materials. 6 It should be noted that the energy transition is not the main driving force behind the increase in demand for most high-volume metals, which will principally be generated by general economic and social developments caused by the growing global population and its generally increased standard of living. It is realistic to anticipate that these long-term underlying trends will continue. 8|Page
Table 1 Elements important for the digital economy
                Element                       Symbol                                          Usage in ICT
Antimony                                      Sb                       Alloying element in lead batteries.

Beryllium                                     Be                       Electric contacts, communication satellites
Boron                                         B                        Dopant in semiconductors.
Bromine                                       Br                       Flame retardant in plastics cases for cell phones.
Cesium                                        Cs                       Photoelectric cell components.
Chromium                                      Cr                       Alloys.
Cobalt                                        Co                       Rechargeable batteries.
Copper                                        Cu                       Electric connections.
Gallium                                       Ga                       Integated circuits, LED, photovoltaics.
Germanium                                     Ge                       Fibre optics, IR technology.
Gold                                          Au                       Microelectrical components, electric connections.
Graphite                                      C                        Rechargeable batteries.
Heavy REEs (atomic number 63-71, for
example dysprosium)                           Dy                       Magnets for microphones and loud speakers, displays.
Helium                                        He                       Protective, shielding gas.
Indium                                        In                       Displays.
Light REEs (atomic number 21, 39, 57-62 for
example praseodymium and neodymium)           Pr, Nd                   Magnets for microphones and loud speakers, displays.
Lead                                          Pb                       Solder.
Lithium                                       Li                       Rechargeable batteries.
Magnesium                                     Mg                       Alloys for cell phone cases.
Manganese                                     Mn                       Rechargeable batteries.
Nickel                                        Ni                       Microphone, electrical connections.
Niobium                                       Nb                       Alloys.
Platinum Group Metals (PGMs)                  Pd, Pt, Rh, Ru, Os, Ir   Alloys
Selenium                                      Se                       Photovoltaics.
Silicon                                       Si                       Integrated circuits.
Silver                                        Ag                       Microelectrical components.
Tantalum                                      Ta                       Capacitors.
Tellurium                                     Te                       Photovoltaics.
Tin                                           Sn                       Lead free solder.
Tungsten                                      W                        Dielectric materials, filaments.
Vanadium                                      V                        Rechargeable batteries.
Sources: USGS, BGS, Enghag.

9|Page
Figure 2 Elements of a smartphone
Source: Compound Interest 2014.
Against this background, the study does not include an analysis of the following elements:
• Antimony used to be an important alloying material in lead acid batteries but is
nowadays mostly used as a flame retardant and hence not of key relevance to this study.
• Beryllium has properties that make it suitable for use in aircraft and space applications.
It is an electric insulator with good heat conducting properties and is also used in high-
density electronic circuits. The dominating use of beryllium is, however, as a minor
component of copper-beryllium alloys with many applications in industry.
• Cesium is perhaps best known for its use since 1967 to define time in the cesium clock.
Its industrial use is diversified but only marginally in ICT industries.
• Platinum Group Metals (PGMs), in addition to ruthenium (discussed below), platinum
and palladium are used for hard disks and multilayer ceramic capacitors. The main usage
of both platinum and palladium is, however, as catalysts in, for example, catalytic
converters for exhaust gases from petrol engines. The ICT industries generate only 10%
of total palladium demand.
• Rhenium, although one of its important applications is as a material in electric switches,
this is mostly for high-voltage applications. Further, rhenium is mainly used for alloys
working at extreme temperatures such as rocket motors.
• Ruthenium is one of the PGMs, which is mainly used as an alloying element for platinum
and palladium making them harder. A three-atom thick layer of ruthenium between two
magnetic layers can improve the storage capacity of hard disks.
• Silicon is clearly of key interest as it is a semiconductor and is widely used because of
this property as a foundation for integrated circuits. Silicon Valley that stands as a
symbol for the entire ICT industries of the world is named after this element. A single
crystal of silicon is cut extremely thinly and these wafers, semiconductor plates are used
to manufacture chips with miniature electronic components such as transistors, diodes,
resistors and capacitors. However, silicon is used in many other applications including
10 | P a g eglassmaking, as an alloying metal in steel and cement and solar cells. Silicon is also the
main components in quartz, which is used as an abrasive and as a flux material in metal
production processes. It is not possible to find and separate out production statistics
useful for the purpose of this analysis and hence, unfortunately, silicon cannot be
usefully analysed here.
• Tin is one of the oldest known metals. A very thin tin layer improves corrosion
resistance of copper, nickel and in oxygen free atmosphere such as in cans. Tin is also
used in a range of alloys for example with copper in bronze. In electronics it is used in
lead-free solders and in a thin film which conducts electricity used in touch screens. All
of these applications in the ICT industries are however again marginal to other uses of
tin.
Copper, gold and silver, which are used for their excellent electrical conductivity together
account for more than 50% in value terms of a computer (Dedryver 2020), are also excluded.
Only a marginal part of their production is used in the ICT sector and their supply situation and
importance for developing countries are already well understood (Addison, Roe 2018).
There will be continuously increasing demands for elements in the batteries necessary for the
energy supply of all mobile and hand-held types of equipment and as energy storage equipment
to balance the swings in production of wind and solar and other renewable generation of
electricity. Batteries are undoubtedly often an integral part of a computer but they are only
mentioned here in passing. For details, readers are recommended to consider other studies (for
example, UNCTAD 2020, World Bank 2020, Ericsson Löf 2020). The most important elements
for present and future battery technologies are expected to include chromium, cobalt, copper,
graphite (a naturally occurring crystalline form of carbon), lithium, manganese, molybdenum,
nickel, niobium, platinum group metals, rare earth elements, tantalum, vanadium. In this study,
only tantalum will be in focus as it is crucial also as a functional material.
With these exclusions, the seven elements that will be analysed below in more detail are:
gallium, germanium, indium, rare earths (dysprosium, neodymium and praseodymium),
selenium, tantalum and tellurium (see Figure 3). The rare earths constitute the bulk of the seven
elements with 0.59% of the total value of all mine production of non-fuel minerals (3/4 of the
total value of the seven elements alone) and the remaining six only 0.18% (1/4). In this study
they are referred to as the ICT elements. A brief overview and presentation of the main
applications of these seven elements are provided below.
Although all these seven elements are minor in terms of both volume and value of production,
their role in making the digital transformations happen is of major importance (Table 2). The
total value of all metal production (at the mine stage) in 2018 was around $660 billion. Iron ore,
gold and copper - in that order – accounted for over 60% of that amount and other metals 39%,
while the seven elements identified together only represented 0.77%.
11 | P a g eTable 2 Selected elements for the digital economy
Mobile Flat screen Laptops and 5G Rechargeable
Element phones PCs TVs notebooks networks batteries Fiberoptics Main ICT usage
LED, microchips,
Gallium X X X X X photovoltaics
Infrared optics, fibre
Germanium X X X X optics, solar
Flatscreens,
photovoltaics, solder,
Indium X X X X semiconductors
REEs X X X X X Magnets, displays, LED
Selenium X Electronics
Capacitors, “sputter
Tantalum X X X targets”
Tellurium X Solar, thermoelectrics
Sources: Dedryver, Bakas et al., DERA, USGS.
In terms of production volumes, the share of these 7 metals is even smaller, as most of them
command a high price per ton. Total world production of metals was around 1 600 Mt (metal
content) in 2018. The seven elements together amounted to 0.17 Mt, of which REEs accounted
for around 95%. All the others are produced in miniscule amounts, from germanium around
100 ton up to 3,000 t of selenium (Table 3). The ICT elements thus represent only a tiny fraction
of total use of all metals but for some of them, the digital economy accounts for 80-90% of total
usage (Malmodin et al. 2018).
Table 3 Production volumes (t) and values (MUSD) for elements for the digitalized economy
2018
Value Volume ICT usage 1)
Metal (MUSD) (t) (% of total usage)
Gallium 160 323 81
Germanium 155 101 80
Indium 310 835 90
REEs 3,900 164,000 20
Selenium 125 2988 16
Tantalum 790 1799 32
Tellurium 40 524 70
Note: ICT includes also entertainment and media sectors.
Sources: RMG Consulting, BGS, USGS, DERA 2016, Naumov, Malmodin et al.
12 | P a g eFigure 3 Production value of digitization metals 2018 (% of total value of all mined elements,
excl. coal)
Other
38.99%
Iron ore
23.81%
Gold
20.72%
Copper
15.70%
Source: Raw Materials Data, RMG Consulting, BGS, USGS.
Properties of the seven ICT elements
This section provides a brief description of the properties of the seven ICT elements.
Gallium metal is liquid near room temperature. Its melting point is at 30o C. It forms
semiconductors together with arsenic and phosphorous. The gallium-based semiconductors
have an advantage over silicon in that they generate less heat. Gallium is also used in
optoelectronic devices such as light emitting diodes (LED), laser diodes and solar cells.
Germanium is nowadays used in fibre optics, infrared optics and solar cells. Germanium is
transparent to infrared (IR) radiation like glass is to light and this makes it suitable for IR optics.
13 | P a g eAt the end of a fibre optical cable, the light signals are decoded by a germanium-based
semiconductor. A substitution of gallium-arsenide for germanium-silicon is taking place.
Indium alloyed with gallium is liquid at room temperature and has a very low friction
coefficient, which is the basis for its use as a lubricant without oil. Indium-tin oxide (ITO) is
used for liquid crystal displays (LCD). Indium phosphide serves as a special semiconductor,
which makes the fastest frequency synthesizer available.
Rare earths, both some of the “heavy” (HREEs with atomic number 65 and over) elements
(mainly terbium, dysprosium, and the “light” (below 65) elements (mainly lanthanum,
praseodymium, neodymium, europium, gadolinium) have a range of usages in electronic
components and computer screens. The special electron configuration of the rare earth metals
forms the basis for their special chemical, optical, magnetic and electromagnetic properties.
Selenium was previously a widely used element in electronics and is nowadays mostly used as
a colour in glass and as an alloying element to improve machinability. Its ICT usages include
thin-film photovoltaics.
Tantalum has excellent corrosion resistance due to a passive and thin layer of tantalum oxide
which is naturally formed on its surface. This layer is also responsible for its dielectric property
which is utilized in capacitors made of tantalum. More than 60% of its total production is
destined for capacitors.
Tellurium is chemically resembling selenium, both of which are semiconductors. Antimony and
bismuth containing tellurium compounds are used in thermoelectric cooling devices. A small
but promising for the future, part of tellurium production is used in solar cells.
What changes in demand can be expected?
Projections into the future are always subject to uncertainty, and this applies especially to
estimates of future demand for elements in the digitalization of the world economy. Further
complexity is added by the current transition to a low-carbon future running at an increased
pace, for two main reasons:
• First, many of the technologies that are applied when digitizing are either newly
developed or not yet developed and proven, and will most probably change in the future
as greater knowledge is accumulated. Speed of technological development has also been
revved up.
• Second, substitution is often possible and will take place when the potential alternatives
can provide the same or improved properties at an acceptable cost. Given that the price
sensitivity for increased raw material costs in most cases is very low (as the amount of
material included in the final product is marginal), huge swings in price can be
accommodated and does not necessarily make demand change as dramatically as prices
might do.
The growing acceptance and use of the concept of criticality and critical materials by politicians
and industry have made the risks of future imbalances in supply and demand of these elements
come into focus at an early stage in the development cycle. In Europe, China, Japan and the
14 | P a g eUnited States, broad R&D programmes have been started to shed lights on all possible aspects
of demand and supply of critical elements. Research topics include the search for possible
substitutes, ways to increase supply and how alternate technologies could be facilitated and
future deficits with concurring price swings avoided. All these efforts should hopefully result
in reduced risks. Improved rates of recycling will also influence the demand for virgin materials
and with the present emphasis on sustainability, such aspects have become more important.
Selenium is but one example of how demand for ICT metals has changed dramatically over
short periods of time. Selenium was once greatly used in photocells and photo copiers for its
photoconductivity, it is a good conductor in light but poor in darkness. But since the 1980s,
organic compounds have replaced selenium as photoreceptors (Enghag p. 1069). Germanium
is another example, which with the invention of the transistor in 1947 became an extremely
important element from previously having been known only to a few specialists. But the period
of prosperity was short. Already in the 1960s, silicon was the favoured semi-conductor material
and replaced germanium (Enghag p. 932). Similar developments could very well be projected
for other elements.
The small volumes demanded of the seven elements and the low grades in possible ores make
specific mines impossible for all except rare earths and tantalum. There are a handful of rare
earth mines around the world. Tantalum is often found in ores which also contain tin and the
two metals are produced together. The other elements are only identified as a by-product at the
smelting/refining stage (see Table 4).
Table 4 Origin of seven elements
Product of mine or Primary / by-
Metal/ element smelter/refinery product Origin
Gallium Smelter/refinery By-product Alumina production, previously mostly zinc processing.
Germanium Smelter/refinery By-product Zinc processing, coal (lignite) or fly ash.
Indium Smelter/refinery By-product Mainly zinc processing, some copper and tin ores.
REEs Mine Primary product REE ores.
Selenium Smelter/refinery By-product Electrolytic refining of copper.
Tin/tantalum ores. increasingly by-product lithium
Tantalum Mine Primary product
mining
Tellurium Smelter/refinery By-product Electrolytic refining of copper.
Sources: Dedryver, RMG Consulting.
The story of tellurium production in the Swedish Kankberg goldmine illustrates how
development of new production processes can affect the entire world market of these small
volume elements. The Kankberg gold deposit was not exploited for many years because it was
difficult to process the ore and extract the gold due to its high tellurium arsenic content. 7 After
a long period of development, a new process route was designed and successfully tested. In
addition to the desired gold, 40 t annually of tellurium was obtained as a completely unintended
by-product. This amount, equal to 5-10% of world annual production, suddenly came onto the
market from this very small gold mine.
7
Interview with industry executive November 2020.
15 | P a g eMany of the ICT elements have special and unique properties and are applied in very low
volumes, sometimes layers only a few atoms thick, other times as alloying elements or additives
to a crystal gitter, with only a few atoms or extremely low concentrations. Nevertheless, they
are not solely used in ICT applications but also as alloying elements, food additives and many
other applications. Pure ICT demand is usually not accounting for the largest share even of
these highly specialized elements.
It is highly likely that the increase of elements used in small amounts in ICT applications will
continue into the future. In the past couple of years, hafnium, arsenic, ruthenium and bismuth
have increasingly attracted attention. Even accounting for the quick expansion of transactions
on the Internet and the increasing use of computers and smart phones in all parts of the world,
the volumes of a material demanded by the digital economy are generally small and should not
cause much alarm. Geographical and corporate concentration patterns could of course increase
risks. The present geopolitical situation with China’s growing ambitions and the stand-off with
the United States has prompted more interest in the security of supply and sustainable supply
chains, for example, in the European Union (European Commission 2020, Trump 2020). The
case of Chinese control over REEs production, which came to the fore in the early 2010s, with
export quotas imposed by China resulting in strong price hikes, is but one example of how
serious these issues are considered to be.
As has been pointed out, it is difficult to estimate future demand for the metals in new
technologies in general and in the ICT sector in particular. Nonetheless, some estimates do
exist. For example, by 2035, it is projected that an additional 5.3 Mt of copper (in comparison
with total demand in 2013 of 21.4 Mt) will be necessary to cover the demand created in 42
emerging technologies (including around 10 ICT-related ones) (DERA 2016). Demand for
lithium alone will equal almost four times total 2013 production, for cobalt 45 times and for
PGMs platinum and palladium together the growth in demand will be 50%. From the same
source, Table 5 provides information related to the ICT elements in focus in this report.
Table 5 Potential future demand for ICT elements
Demand from 42 Demand from
Production total technologies 2013 (% 42 technolgies
Metal 2013 (t) of total) 2035 (t) Growth % Growth (t)
Gallium 350 25 130 46 40
Germanium 145 39 118 111 62
Indium 790 29 361 55 128
Heavy REEs Dy/Tb 2300 85 7400 370 5400
Yttrium 5500 0.3 1054 659 1038
Tantalum 1300 38 2070 416 1570
Note: Selenium and tellurium were not included in the German study.
Source: DERA 2016.
In a study from 2018 of material implications from the Internet of Things (IoT) of emerging
data storage technologies, the demand over 5-10 years period starting in 2016 for germanium
was expected to grow by 0.35 t/year, indium 0.004 t/year, selenium 0.1 t/year, tantalum 8.3
t/year, tellurium 0.2 t/year. These are all very minor amounts, fractions of a percent of total
production in 2016 except for tantalum where the figure was 0.75%. Of all elements covered,
the PGMs iridium and platinum were projected to grow (in these applications compared to total
production 2016) by 2,500% and 137% respectively (Table 6).
16 | P a g eTable 6 Potential future demand for ICT elements by Internet of Things
Use in the EU Apparent consumption Use in
Metal 2015 (t) (% of total) 2035 (t) Growth (%) Growth (t)
Gallium 4 5 5 25 1
Heavy REEs dysprosium 9 5 12 33 3
Tantalum 80 80 110 38 30
Note: Germanium, indium, selenium and tellurium are not included in the European Commission JRC report.
Source: European Commission JRC.
Which mineral-rich countries are likely to be most affected by the
demand growth by digitalization?
Table 7 lists the producing countries of the seven ICT elements. In Figure 4, these countries are
placed on a world map. China is by far the dominant producing country, mainly because of the
large volumes of REEs mined there. Australia and the United States follow, also because of
their REEs production. Among the 15 most important producing countries, 5 are in Africa, 4 in
Asia, and Brazil is the only significant producer in Latin America. The remaining two countries
are Canada and the Russian Federation. China reaches over $3 billion. For the Democratic
Republic of the Congo, the tantalum production is valued at $315 million. For most countries,
however, the value of production is less than $100 million annually.
17 | P a g eTable 7 List of producing countries of seven elements 2018 (MUSD)
Mine/
Germa- Seleniu Tantal Telluriu Total
No. Country Gallium Indium REEs smelter/
nium m um m MUSD
refinery
1 China 154.9 138.9 148.1 2760.0 31.4 38.3 24.3 3296 m/s/r
2 USA 3.1 414.0 5.0 4.0 426 m
3 Australia 483.0 9.8 493 m
4 DRC 314.9 315 m
5 Rwanda 179.1 179 m
6 Brazil 25.3 106.4 132 m
7 Russian Fed. 3.0 9.3 1.5 62.1 7.7 16.2 3.6 103 m/s/(r)
8 Korea, Rep.of 1.5 88.1 90 m/s
9 Nigeria 85.1 85 m
10 India 66.7 0.7 67 m
11 Japan 1.5 3.1 26.2 32.1 4.3 67 s/r
12 Madagascar 46.0 46 m
13 Ethiopia 29.8 30 m
14 Canada 21.8 3.5 0.0 1.3 27 m/s/r
15 Thailand 23.0 23 m/s
16 Viet Nam 21.2 21 m
17 France 16.1 16 s/r
18 Belgium 7.5 8.4 16 s/r
19 Germany 12.5 12 s/r
20 Burundi 9.8 10 m
21 Mozambique 0.0 0 m
22 Sweden 1.7 3.6 5 m/s
23 Ukraine 3.0 1.5 5 m
24 Finland 4.6 5 s/r
25 Mexico 4.5 4 m/s/r
26 Philippines 4.2 4 m/s
27 Peru 1.9 2.3 4 m/s
28 Poland 2.8 3 m/s
29 Uzbekistan 2.0 2 m/s
30 Italy 1.9 2 s/r
31 Serbia 1.2 1 m/s
32 Kazakhstan 0.4 0.4 m/s/r
33 Bulgaria 0.3 0.3 m/s
Total MUSD 164 156 313 3901 125 789 41 5490
Sources: WMC, BGS, USGS, RMG Consulting.
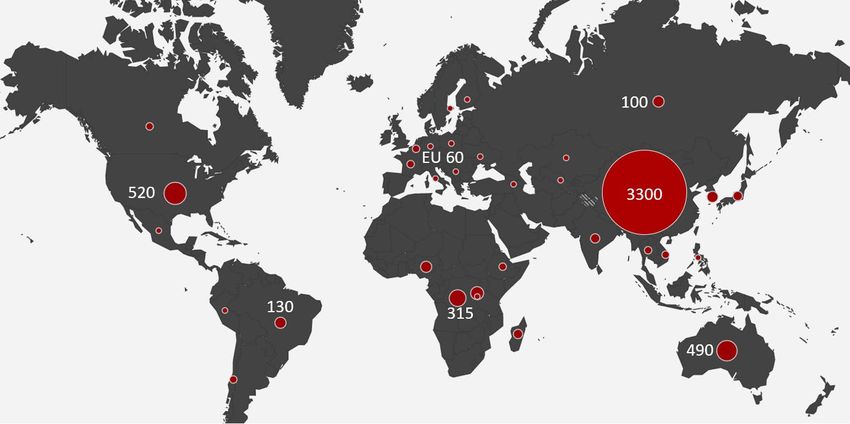
18 | P a g eFigure 4 Production of seven ICT elements 2018 (millions of US dollar) Sources: WMC, USGS, BGS, RMG Consulting. Japan is among the top 15 but has no mine production of its own. All its production originates from imported ores and the metals are produced in Japanese copper and zinc smelters and alumina plants. Further down the list are other countries without mines but with sophisticated processing capabilities, such as Belgium, France, Germany and Italy. The importance of the production of the seven ICT elements compared to total mine production in each country is highlighted in Figure 5. In the African producers, they accounted in 2018 for between 7% in Madagascar and 68% in Rwanda. In most other countries, the production represents only a small part of the total value of mine production. Figure 5 Relative importance at the mine stage of seven ICT elements 2018 by value (MUSD) Sources: WMC, USGS, BGS, RMG Consulting. Note: The full circles represent total value of mine production in each country, blue is the share of the seven elements under study. 19 | P a g e
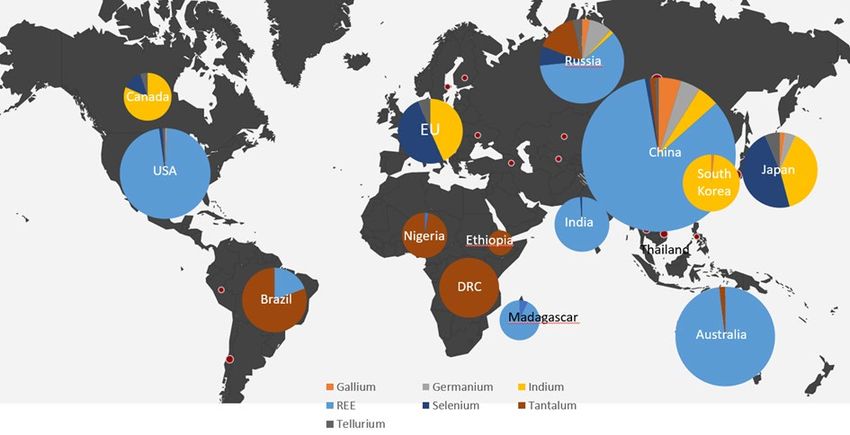
From Figure 6 it is clear that most countries, apart from China, Russian Federation and Japan,
are producing only one or two of the seven elements. Canada, USA and the European Union
report production of three elements each. African countries are producing tantalum, except for
Madagascar, which mines REEs. In Europe, there is limited production based on domestic
mines mostly in Sweden, Finland and Poland, but several smelters/refineries use imported
concentrates for production of the ICT elements.

Figure 6 Production (all stages) of seven ICT elements 2018 by value (MUSD)

Sources: WMC, USGS, BGS, RMG Consulting.

Resources and reserves

Reserves and resources are two concepts describing how much of an element that could be
mined and processed with a profit at today’s prices and technology. The reserves are clearly
defined and studied in detail while resources are sufficiently well known in terms of size and
quality to make an estimate. The conclusion for Table 9 is that there is no scarcity of the ICT
elements in the earth’s crust. For the elements lacking in the table, gallium, germanium and
indium, the reserves and resources are gigantic. They are proportional to the resources of
bauxite (for aluminium production), zinc and copper ores, all of which are produced in millions
of tons every year and hence are available in huge quantities. See Table 9 Resources and
reserves of seven ICT elements in Annex.

Which are the main actors?
Reduced dependencies and diversified supply to achieve resource security is a mantra repeated
by many countries around the world, in particular during the pandemic disrupting global supply
chains (European Commission 2020, Trump 2020). Supply risk analysis usually focuses on
country level concentration of global production of critical raw materials. Dependence on
imports from China is sometimes singled out as “particularly concerning” (Trump 2020). From
Table 7 it is clear that China is the largest supplier of several of the seven ICT elements,

20 | P a g e
producing 95% of global gallium, 89% of germanium, 71% of REEs, 7% of tellurium, 47% of
indium, 25% of selenium and 5% of tantalum.

While country concentration is an important aspect of supply security it is rarely “countries”
that mine, refine or process raw materials. This is done by companies acting on the world
markets. Transnational mining companies make decisions about localization of production, new
investments and production levels, all important decisions about how much is to be produced
and where. There are several state-owned companies in mining, smelting and refining but their
market shares and hence importance have been dwindling since a peak in the 1980s. Corporate
concentration hence is an important part of the analysis of supply security. Within the narrow
scope of this report, it sheds some light on this aspect of mining and refining of the seven ICT
elements.

As already noted, the production processes for the ICT elements differ from the major base
metals and some of the battery metals in that they are mostly by-products (see Table 4). It is
only REEs and tantalum of which at least a sizeable share of production originates from mines
specifically dedicated to the production of these two elements. The by-product base means that
it is the viability of the main metal in a mine that decides whether there will be any by-product
recovery. The by-product does of course give a certain economic contribution, but it is of minor
importance and will usually not warrant major investments, process alterations and generate
much less focus on optimization and maximum recovery. There will further be limited
marketing and sales efforts. 8 A mining executive summarized this concerning cobalt from
copper concentrates: “you get the cobalt the process gives you” 9, and the same is valid for the
by-product ICT elements. Most of the ICT metals are usually lost during the value chain, for
example, only 15-20% of the indium content of a zinc ore is estimated to be recovered into
99.7% indium metal (Lokanc et al. 2015).

The recovery and production of the ICT elements usually do not take place during mineral
processing at the mine but at a later stage during smelting and refining. The skills and
technology to recover these elements are highly specialized and unique. They are mostly
developed and maintained within a small number of companies in developed economies. At
present, when prices for most of the ICT metals are relatively low, process R&D and innovating
activities are limited, but if prices rise, activities will restart. 10 Mineral-rich developing
countries will usually not be able to benefit more than marginally from such content of their
ores and concentrates exported. In particular, the content and extractability of by-products are
often not well known and the refineries extracting these metals are not always open about their
capabilities. A seller must have thorough and deep metallurgical skills in order to be able to
realize the customer value of the product. Often, the presence of these elements does not
increase the price of a concentrate at all as the number of buyers is limited and the markets far
from transparent and competitive. Selenium and tellurium are extracted during copper
processing. Germanium and indium are obtained mainly from zinc refining and gallium during
the production of alumina from bauxite ores, a process step in the chain to aluminium. The
smelters and refineries with capacity to extract these elements usually buy concentrates from a
range of mines around the world and it is difficult or impossible to track the origin to the final
pure elements.

8
    Interview with industry executive November 2020.
9
    Interview with industry executive October 2020.
10
     Interview with process metallurgist October 2020.

21 | P a g e
These industries are characterized by a paradox in that they are in general opaque and secretive as to key facts such as production volumes, capacities and origin of raw materials. On the other hand the companies themselves have an interest in trying to share important information and data among themselves in order to avoid over production and market disturbances, in particular, as production volumes are small and individual companies can have a strong impact on market balance and prices. Price volatility is already high because of rapid technological developments and changes in demand. Gallium Gallium is yet another by-product ICT metal, most commonly obtained from the alumina production step in the value chain from bauxite to aluminium. Some gallium is also recovered in processing of zinc ores. Large production volumes of alumina hence give the potential for high gallium production. Chinese companies are the dominating alumina producers and hence also the largest gallium producers. See Table 10 Major companies producing gallium in Annex. Around the turn of the century there was an oversupply of gallium and production facilities in Australia and France, and later in Hungary and Slovakia, were closed down. There is still considerable over capacity in primary gallium 700-800 ton/annum (tpa) compared to actual production around 300 tpa. In addition to the companies listed above, Japanese Dowa Electronic Materials Co, Sumitomo Chemicals Co, Rasa Industries Ltd and Nippon Rare Metals Inc, have considerable capacity. Dowa and Sumitomo, for example, have estimated production capacity of around 100 tpa. Germanium There are two major sources of primary germanium: zinc concentrates and lignite or fly ash from burning lignite in the proportions two thirds zinc concentrates one third lignite. Chinese companies dominate both these process routes (Moskalyk 2003). The lignite route is dominated by a few Chinese and Russian companies. There are two Chinese lignite areas (Lincang and Wulantuga) with considerable amounts of germanium. One of the most important Chinese producers is Yunnan Lincang Xinyuan Germanium Industrial Co. Ltd in south China, which has a fully integrated production process from mine to wafer. The Russian production is based on lignite deposits in the east of Siberia on the Pacific. See Table 11 Major companies producing germanium in Annex. Indium As mentioned, indium is mainly recovered as a by-product from zinc mining and to a lesser degree from copper, lead tin and silver deposits. Zinc companies with good grades of indium in their ore resources hence theoretically control the mine output of this element. Most mining companies do not, however, extract indium but sell a concentrate to a smelter/refiner which has the necessary equipment to extract indium and produce an indium sponge. Chinese companies account for around half of the world’s indium production. There are no detailed production figures available from China but all Chinese mining sectors including zinc and indium are more fragmented than their competitors outside China (Ericsson, Löf & Löf 2020). In 2010, the 25 largest zinc mining companies in China produced only a third of the total 22 | P a g e
Chinese production, and even the largest was only a tenth of the top transnational company,
Glencore. Since then, some consolidation has taken place but the Chinese companies are still
much smaller than global leaders. Among the indium producers the situation is similar with 20
companies sharing export quotas and the largest, Hunan, having 12% of the total 233 t in 2011.
There was no access to more recent figures but in view of the slow pace of consolidation in
China in the past decade, the situation is likely to still be similar. See Table 12 Major companies
producing indium in Annex.

Depending on their facilities these companies refine indium to at least 95%. The final
conversion into higher purity 5-7 N and into saleable products is done by a dozen of companies
such as: Indium Corp of America, MCP Metal Specialities, ESPI and AIM Speciality Materials
(all United States), Umicore Group (Belgium), Zhuzhou Keneng New Material (China) and
Teck Resources         (Canada).

Rare earth elements

The rare earths came into political limelight in 2010 when prices skyrocketed as a result of
China briefly halting exports during a dispute with Japan (Shen et al. 2020). At that time,
Chinese producers controlled around 90% of total world production at the mine stage and
probably even more of the refined production. The initial global up-roar resulted in political
statements and also some exploration projects. However, as prices fell back, the rare earths left
the centre of attention. Gradually, the Chinese dominance has been reduced. In 2019, China
controlled an estimated 60% of global mine production, while Chinese refinery production is
probably as high as 10 years ago or even higher.

In the 1970s and 1980s, the United States dominated global rare earth production (Figure 7).
The Mountain Pass mine in California was a major producer controlled by the oil company,
Chevron. The process to extract and separate the rare earths from the ore is difficult because
the rare earth elements are chemically very similar to each other. The process can also be
heavily polluting. When environmental demands grew, new investments were necessary to
reduce emissions, production costs increased and profitability dwindled. It was at the time not
seen as a major issue that Chinese small-scale producers gradually became the main suppliers
of REEs, in view of the environmental and health problems of the production processes (Rao
2016).

23 | P a g e
You can also read