The Green Deal and the CAP: policy implications to adapt farming practices and to preserve the EU's natural resources - Hal Inrae
←
→
Page content transcription
If your browser does not render page correctly, please read the page content below
STUDY
Requested by the AGRI committee

            The Green Deal and
               the CAP: policy
           implications to adapt
           farming practices and
            to preserve the EU’s
             natural resources
          __________________________________

                              ANNEXES

                Policy Department for Structural and Cohesion Policies
                        Directorate-General for Internal Policies
                             PE 629.214 - November 2020                  EN
                                        3
RESEARCH FOR AGRI COMMITTEE

 The Green Deal and
    the CAP: policy
implications to adapt
farming practices and
 to preserve the EU’s
  natural resources

                   ANNEXES
 Abstract
 This document provides the annexes of the final report on “The
 Green Deal and the CAP: policy implications to adapt farming
 practices and to preserve the EU’s natural resources’’
 (IP/B/AGRI/IC/2020-036).
This document was requested by the European Parliament's Committee on Agriculture and Rural Development. AUTHORS INRAE and AgroParisTech; Hervé GUYOMARD, Jean-Christophe BUREAU, Vincent CHATELLIER, Cécile DETANG-DESSENDRE, Pierre DUPRAZ, Florence JACQUET, Xavier REBOUD, Vincent REQUILLART, Louis- Georges SOLER, Margot TYSEBAERT Research manager: Albert MASSOT Project, publication and communication assistance: Catherine MORVAN, Kinga OSTAŃSKA Policy Department for Structural and Cohesion Policies, European Parliament LINGUISTIC VERSIONS Original: EN ABOUT THE PUBLISHER To contact the Policy Department or to subscribe to updates on our work for the AGRI Committee please write to: Poldep-cohesion@ep.europa.eu Manuscript completed in November 2020 © European Union, 2020 This document is available on the internet in summary with option to download the full text at: https://bit.ly/35HmZJg This document is available on the internet at: http://www.europarl.europa.eu/RegData/etudes/STUD/2020/629214/IPOL_STU(2020)629214(ANN01) _EN.pdf Further information on research for AGRI by the Policy Department is available at: https://research4committees.blog/AGRI/ Follow us on Twitter: @PolicyAGRI Please use the following reference to cite this study: Guyomard, H., Bureau J.-C. et al. (2020), Research for AGRI Committee – The Green Deal and the CAP: policy implications to adapt farming practices and to preserve the EU’s natural resources. European Parliament, Policy Department for Structural and Cohesion Policies, Brussels. Please use the following reference for in-text citations: Guyomard, Bureau et al. (2020) DISCLAIMER The opinions expressed in this document are the sole responsibility of the author and do not necessarily represent the official position of the European Parliament. Reproduction and translation for non-commercial purposes are authorized, provided the source is acknowledged and the publisher is given prior notice and sent a copy. © Cover image used under the licence from Adobe Stock.
The Green Deal and the CAP: policy implications to adapt farming practices and to preserve the EU’s natural resources

CONTENTS

LIST OF ABBREVIATIONS                                                                                              5
ANNEX A1.1. COMPOSITION OF THE THREE EXPERT PANELS AND SYNTHETIC REPORTS OF THE
   FIVE EXPERT MEETINGS                                                       9
     1. First meeting of the technical expert panel (26/08/2020)                                                 10
     2. First meeting of the policy analysis expert panel (31/08/2020)                                           12
     3. First meeting of the panel of stakeholders’ representatives (09/09/2020)                                 13
     4. Second meeting of the policy analysis expert panel (07/10/2020)                                          15
     5. Second meeting of the panel of stakeholders’ representatives (08/10/2020)                                16
ANNEX A3.1. AGRICULTURAL SUBSIDIES IN EU AGRICULTURE                                                             19
ANNEX A3.2. FERTILIZER AND PESTICIDE COST FOR EU FARMS                                                           21
ANNEX A3.3. EU TRADE IN AGRI-FOOD PRODUCTS                                                                       25
ANNEX A4.1. ORGANIC AND NON-ORGANIC FARMS IN THE EU                                                              29
ANNEX A4.2. THE “DE-INTENSIFICATION” OF AGRICULTURE AND FOOD SYSTEMS IN THE EU                                   37
     1. “Intensification” versus “de-intensification”                                                            37
     2. Global challenges of the “de-intensification” strategy                                                   40
ANNEX A5.1. DATA AND MODELLING NEEDS FOR ASSESSING THE CAP AND THE GREEN DEAL 43
     1. Main characteristics of models used in CAP impact assessments                                            43
     2. Data and modelling needs                                                                                 43
ANNEX A5.2. CRUDE ECONOMIC ASSESSMENT OF OUR PROPOSAL FOR THE FUTURE CAP BASED
   ON EU FADN DATA                                                          51
     1. Simulation S1: Threefold increase in the number of EU organic farms                                      52
     2. Simulation S2: Changes for conventional farms that remain conventional                                   56
     3. Sensitivity analysis for S2                                                                              59
     4. Farm gate demand price elasticities required to maintain unchanged conventional farms’
           incomes                                                                         60

                                                         3
IPOL | Policy Department for Structural and Cohesion Policies
4The Green Deal and the CAP: policy implications to adapt farming practices and to preserve the EU’s natural resources
LIST OF ABBREVIATIONS
AECM Agri-environmental and climatic measures
AKIS Agricultural Knowledge and Information System
AWU Average Work Unit
CAP Common Agricultural Policy
COP Cereals, Oilseeds and Protein crops
DASH Dietary Approaches to Stop Hypertension
EAFRD European Agricultural Fund for Rural Development.
EAGF European Agricultural Guarantee Fund
EC European Commission
ECA European Court of Auditors
EEA European Environment Agency
EFA Ecological Focus Area
EIP European Innovation Partnership
ELO European Landowners Organization
EMA European Medicines Agency
EP European Parliament
ETS Emissions Trading Scheme
EU European Union
FADN Farm Accounting Data Network
FAO Food and Agriculture Organization (of the United Nations)
F2FS Farm to Fork Strategy
GAEC Good Agricultural and Environmental Condition(s)
GDP Gross Domestic Product
5IPOL | Policy Department for Structural and Cohesion Policies
GHG GreenHouse Gas
HRI Harmonized Risk Indicator
IEEP Institute for European Environmental Policy
IPCC Intergovernmental Panel on Climate Change
IUCN International Union for Conservation of Nature
IPM Integrated Pest Management
LU Livestock Unit
LULUCF Land Use, Land-Use Change and Forestry
MEP Member of the European Parliament
MFF Multiannual Financial Framework
MFN Most Favoured Nation
MS Member State
MT Million tonnes
NDM New Delivery Model
NGEU Next Generation EU (recovery plan)
NGO Non-Governmental Organization
NSP National Strategic Plan
OECD Organization for Economic Co-operation and Development
PCU Population Correction Unit
PES Payment for Environmental Services
PGP Provider-Gets Principle
PPP Polluter-Pays Principle
SDG Sustainable Development Goal
6The Green Deal and the CAP: policy implications to adapt farming practices and to preserve the EU’s natural resources
SMR Statutory Management Requirement
SWOT Strenghts, Weaknesses, Opportunities and Threats
TFEU Treaty on the Functioning of the European Union
UAA Utilized Agricultural Area
VAT Value Added Tax
WTO World Trade Organization
WTP Willingness To Pay
7IPOL | Policy Department for Structural and Cohesion Policies
8The Green Deal and the CAP: policy implications to adapt farming practices and to preserve the EU’s natural resources
ANNEX A1.1. COMPOSITION OF THE THREE EXPERT PANELS AND
SYNTHETIC REPORTS OF THE FIVE EXPERT MEETINGS
Members of the three panels
Experts of the technical panel
Name Institution
Marc Benoit INRAE
Nicole Darmon INRAE
Luc Delaby INRAE
Hugo de Vries INRAE
Christian Ducrot INRAE
Emmanuelle Kesse-Guyot INRAE
Paul Leadley Orsay University
Jean-Louis Martin CNRS
Sylvain Pellerin INRAE
Jean-Louis Peyraud INRAE
Clelia Sirami INRAE
Alban Thomas INRAE
Experts of the policy analysis panel
Name Position and institution
Hrabrin Bachev Professor, Institute of Agricultural Economics,
Sofia, Bulgaria
John Finn Senior Researcher, TEAGASC and Agriculture
and Food Development Authority, Ireland
Xavier Irz Professor, Natural Resources Institute (Luke),
Finland
Roel Jongeneel Senior Scientist and Business Developer, LEI-
WUR, The Netherlands
Cathie Laroche-Dupraz Professor, Agrocampus Ouest
Alan Matthews Professor Emeritus, Trinity College of Dublin,
Ireland
Costică Mihai (Ticu) Professor of the “Alexandru Ioan Cuza”
University of Iasi, Romania
Bernhard Osterburg Senior Researcher, von Thünen Institute,
Germany
Tomas Ratinger Senior Scientist, Technology Centre of the Czech
Academy of Sciences, Czechia
Tania Runge Senior Researcher, von Thünen Institute,
Germany
Sophie Thoyer Senior Researcher, INRAE, France
Davide Viaggi Professor, University of Bologna, Italy
Panel of stakeholders’ representatives
9IPOL | Policy Department for Structural and Cohesion Policies
Name Position and institution
Cécile Bauzy Director of Scientific Affairs, Regulatory and
Nutrition, Nestlé France
Francesca Bignami Senior Manager for Economic Affairs, in charge
of the Farm to Fork Strategy watch, Food Drink
Europe
Katharina Brandt Agricultural specialist, German Watch, Germany
Alice Budniok Director of legal & Administrative Affairs,
LIFE+/Natura2000, H2020, Marie Curie,
European Land Owners
Fabien Delaere Dietary Impact Team Leader, Danone
Samuel Feret Board Member of ARC 2020: Agricultural and
Rural Actors Working Together for Good Food,
Good Farming and Better Rural Policies in the
EU, Mediterranean Agronomic Institute of
Montpellier, France
Trees Robijns Expert for Agriculture Policy, Nature and
Biodiversity Conservation Union, Germany
José Fernando Robles Senior Advisor for Environment, ASAJA –
Agricultural Association of Young Farmers,
Seville, Spain
Marc Rosiers Director at MR F&A Consult, Belgium
The following summaries try to get closer to what has been said during the experts’ meetings and
these retranscriptions apply only to the authors of the report.
1. First meeting of the technical expert panel (26/08/2020)
In order to reach carbon neutrality, N20 leakages have to decrease, which is harder in intensive farming
areas and requires structural measures. The number of ruminants should also decrease – to limit enteric
CH4 emissions – while reducing productivity. However, if the reduction in the number of ruminants is
too significant, then intensive livestock production risks being replaced with crops, which need a lot of
fertilizers. Ruminants should be bred with locally grazing systems to decrease imported or locally
produced N20 emissions because of the use of soybeans. Finally, bare grounds should be avoided so
that carbon sequestration and storage are sufficient. For example, intermediate crops, permanent
grassland or agroforestry practices could contribute to this storage if they represent more than the 10%
of protected areas mentioned in the F2FS.
As regards antimicrobials, the following actions levers have been suggested:
- Monitoring the use of antimicrobials on a European scale;
- Upgrading regulations in alternative medicine; and
- Generalisation of separating the sale from the prescription of medicines.
An indicator defined at the MS level might be more relevant than at the EU level one because past
efforts strongly vary from one MS to another. The reference period could start from when the sales of
antimicrobials peaked. Finally, it is essential to apply the same regulations to importations from non-
European countries to avoid a distortion in competition.
10The Green Deal and the CAP: policy implications to adapt farming practices and to preserve the EU’s natural resources
A 25% reduction in the overall use of pesticides seems possible without significant changes in crop
production systems and farmers’ income while a reduction beyond 25% requires such changes – crop
rotations, reallocation of different productions among lands, etc. – and strong public policies. In
addition, the future CAP has to find an EU shared method to measure the reduction of pesticides.
Finally, the toxic-free environment objective by 2050 will not be achieved through innovation only or
using a circular bio-economy: it requires more radical changes in agricultural systems with direct
implications on incentives’ (conditional) distribution.
Several European countries seem to struggle to go over 20% of organic farming areas. Today organic
food is hardly affordable for low-income families and the main way to increase its share is to decrease
meat consumption. The following action levers are suggested to decrease costs of organic production:
robotics to decrease labour force costs, for example in market gardening; research to increase organic
farming yields and thus, keeping production costs low; and a better organization of the entire organic
sector.
Reducing food losses and waste and setting appropriate public policies – for example, significant aids
per hectare to decrease the use of synthetic pesticides (to be removed in the case of organic farming)
– could help to decrease organic food prices. Finally, could the organic food supply and demand lower
the price of organic food in the future? Would the farmers continue to shift to organic farming if the
products no longer profit from higher prices?
Concerning the restoration of agroecosystems, the EU Biodiversity Strategy for 2030 should detail the
definition and the scale of “high-diversity landscapes features”. Heterogeneous features of rural
landscapes, size of plots, crop diversifications are interesting levers for biodiversity if they are used on
several geographical scales, such as plot, farm and rural landscape. However, going over 10% of
agricultural area under high-diversity landscapes features (10% of semi-natural areas and elements)
seems to be the target to reach significant and more visible effects.
Concerning diets, research results clearly show that reducing the carbon impact of diets by 30%, while
increasing their nutritional quality, could be relatively easy to achieve by a combination of dietary
changes, such as the substitution of meat (especially red meat) with other animal products, the increase
of fruit and vegetables and other plant-based unrefined products, and the reduction of high fat-high
sugar foods and alcoholic drinks. These changes required to increase diet sustainability are fully in line
with food based dietary guidelines (FBDG) worldwide. However, going beyond a 30% carbon impact
reduction would involve more changes in diets (red meat avoidance, predominance of whole cereals
and legumes) than what the majority of the population might currently accept. Nutrition education –
especially on dietary balance – could help to go beyond the 30% CO2 reduction threshold, by helping
each individual to take a step further, starting from where he/she is currently standing. An increasing
number of countries are currently revising their national FBDGs in order to better incorporate the
sustainability objectives. There should be a shared recommendations’ baseline in the EU in terms of
sustainable and healthy diets. Finally, food labelling can remain hazardous, because the best functional
unit to consider in order to improve the sustainability of tomorrow’s diets is the whole diet, not 100g,
nor 100kcal nor 100g proteins of individuals’ foods.
To conclude, a major point at stake is ruminant production, where numbers could be reduced and
whose management could be reconsidered to optimize its role and impact, noting these changes can
also have positive effects on health, climate and environment. In addition, the Green Deal should
include quantitative objectives for changes in diets and food loss and waste. Moreover, food prices
could be redesigned taking externalities into account, but raising food prices is a societal question (if
the price of food has to be increased, social and redistributing policies should be implemented given
11IPOL | Policy Department for Structural and Cohesion Policies
that an increasing number of people are already experiencing food insecurity and dietary unbalance
due to cost constraints). Finally, today we produce considerably more than we need, and perhaps one
of the highest stakes of this century is to rethink production and reject “productivism”.
2. First meeting of the policy analysis expert panel (31/08/2020)
Agriculture GHG emissions in the EU have barely changed since 2005. They are mostly due to nitrous
oxide and methane. The latter acts as a short-lived climate forcer, and there is a growing debate on
how to weight its impact. Note that taking into account GHG emissions of a more integrated agriculture
and land-use sector would be more relevant than agriculture emissions on their own. Land-use shifts
are needed in order to reach climate neutrality by 2050. In addition, the EU should set specific
objectives for both climate mitigation and climate adaptation. The CAP could propose price policies
such as carbon pricing or a nitrogen tax. The EU must be vigilant if policies lead to a decrease in activity
– which could be linked to de-intensification or a reduction in livestock production, for example – as
this could lead to carbon leakage effects outside of Europe and worsen the current global climate. Note
that policies involving a livestock reduction must be differentiated from one MS to another on historical
(newer and older MS, for example) and on an environmental and climate basis (northern and southern
countries, for example).
Reducing the use of fertilisers has a positive impact on GHG emissions’ reduction. The EU should explicit
the reference year for the objective of reducing the use of fertilizers by 20% by 2030 for each MS. The
following action levers have been suggested to reduce nutrient losses and the use of fertilisers:
- Increasing nitrogen efficiency by a better management of the nitrogen cycle: in Germany it
could lead to a 10-15% reduction in N2O emissions but going beyond this would require a
reduction in activity;
- Using innovative manure storage technologies, which might imply biogas production;
- Using denitrification inhibitors; and
- Developing agro-ecological alternatives to nutrients: research is lacking because fertilisers are
cheap and quality criteria are still linked to fertilizer levels (protein content).
All of these levers have to be cost-efficient and adapted to local needs. If not, they will not be
implemented.
Subsidies for organic farming have mainly led to an increase in organic land in the EU and, globally, the
EU seems to be on track to increase its organic land share. However, the net effects of organic farming
on the climate are still unclear. There is carbon capture, a reduction in chemical inputs and
antimicrobials, but yields are lower. In several countries:
- Most of these new organic lands are livestock pastures and grasslands so their transition does
not contribute to the reduction in chemical inputs. Thus, the EC should better specify its target
for organic farming;
- The organic market and demand are very limited so organic products are often sold as
conventional products, which incites farmers to go back to conventional methods and
products; and
- If subsidies are not maintained then organic farming might decrease: because of the costs of
labelling and controls, generally lower yields, even the steal effect, etc.
12The Green Deal and the CAP: policy implications to adapt farming practices and to preserve the EU’s natural resources
Efforts have been made in several European countries to decrease the use of pesticides. However,
climate change does not help (pesticides will be an insurance tool for bad weather and new diseases),
and innovations are needed. There are fewer opportunities to reduce pesticides on the same crop than
changing the crop mix or even the land use. Plus, the reduction in pesticides would be more efficient
for the environment at the landscape level rather than at farm or plot levels.
Concerning biodiversity, the EC should specify precisely what the 10% of high-diversity landscapes
features are. However, it is more and more documented that 10% is a minimum target area in order to
reach more significant effects. There should be also more focus on biodiversity outside of these
protected areas. Note that corridors could have a significant positive impact on biodiversity if put at
landscape level; a smart subsidy scheme could support that.
There is an increasing debate around the environmental and health impacts of diets. The Green Deal
should specify more precise targets on dietary changes. Up to 30% decrease in GHG emissions through
dietary adjustments seems achievable though it would require major changes in current diets in the
EU. Campaigns or high taxes – beyond 20% – could be used to influence dietary habits, for instance, to
decrease meat consumption. The latter could also be influenced by animal welfare duty. However, in
several newer MS, encouragement to decrease meat production might be difficult because
considerable efforts have been already made. Note that beef meat and dairy productions are closely
linked. Plus, aquaculture could be investigated as a potential source of more sustainable proteins.
Several trade-offs have been highlighted, such as:
- There is increasing pressure to afforest in order to capture and store carbon. Afforestation could
be in competition with keeping high nature grasslands that are sinks for biodiversity; and
- De-intensification incited by the Green Deal might lead to an increasing demand for land
outside of the EU, especially if changes in diets do not happen at the same speed that
agricultural practices are changing. This indirect land-use change is very difficult to control,
even with trade policies.
To conclude, governance of the policy implementation is very important. Many rules and policy
instruments are not properly enforced and miss their stated targets. Policy assessment and policy
design must address governance as well. How to implement EU policies at national levels should be
part of the future CAP.
3. First meeting of the panel of stakeholders’ representatives (09/09/2020)
To reach climate neutrality by 2050, it seems necessary that the F2FS sets specific targets in terms of
the number of farm animals. Reducing the use of fertilizers by 20% by 2030 might induce a decrease in
feed production and thus, an increase in the importations of feed from outside the EU if the European
consumption of animal products does not decrease simultaneously. In terms of trade, note that there
is still an important issue with the EU exportations of animal products. If the reduction of EU feed
production reduces EU exports only, this might be an emission leakage as well. A tax on meat
consumption has been discussed in Germany to improve animal welfare. A side effect might be the
reduction in meat consumption with climate benefits. For the diets to remain healthy and nutritionally
balanced, meat alternatives might need further research and innovation.
It might be relevant to set differentiated objectives for pesticide reduction in the different MS. It would
be even more relevant to distinguish the different supply chains and the different pesticides to assess
each situation with a SWOT analysis, from the farm to the food industry, and from 2020 to 2027. To find
pesticide alternatives in each specific issue (alternatives to glyphosate, for example), the CAP could
13IPOL | Policy Department for Structural and Cohesion Policies
reinforce the EIP-AGRI to further support innovations and the exchange of experiences between
farmers. Note that several representatives of European scaled organizations or companies would
ideally like to see the same rules applied in all MS.
In order to stop the decline of biodiversity, the EC should specify and revise the definition of high-
diversity landscapes features in the future CAP. It might be relevant to remove cropping elements –
such as nitrogen fixing plants and catch crops – within the ecological focus areas. Plus, there is a need
for relevant indicators in order to assess the performance of biodiversity elements. The participation of
farmers and landowners in such policy decisions (definition of the features, how to implement them so
that it is feasible and how to assess biodiversity) could help considerably. Incentives could come from
different CAP instruments, such as eco-schemes, cross-compliance, agri-environmental and climate
schemes, training measures, EIP-AGRI programmes, etc., provided there is more synergy between them
and substantial funds available. In addition, delays in terms of payments (which have reached more
than two years in the present CAP) are not acceptable in terms of business and accountancy.
All stakeholders have to work hand-in-hand to reach the Green Deal and F2FS objectives. For example,
manufacturers have to work with farmers to manage and share the risks of switching to more agro-
ecological practices. Such environmentally friendly practices imply higher costs for farmers. A major
debate that is still ongoing is how to include externalities – positive and negative – in prices. The CAP
must accompany the farmers, financially and with adapted training schemes. The relevant information
about these changes in practices at the farm level needs to be relayed to consumers. Indeed, higher
costs for farmers might induce higher food prices. There is a need to raise consumers’ willingness to
pay. This question might be included in the CAP, but it is more generally a societal question, and can
have huge impact, especially on low-income consumers, who might switch to the cheapest products
and end with non-healthy diets.
It might be possible to change the diets to more sustainable ones – for the health and the environment
– with a relatively small increase in cost. It requires switches between food categories: less meat and
fish but more nuts, legumes, fruit and vegetables. Such changes have to be supported and
accompanied in order to be accepted and affordable. An appropriate tax scheme could be designed to
induce dietary changes and its tax income could be used to help lower income families to afford these
new diets. Note that the recommended diets could be similar in terms of nutrients intakes all over the
EU, but the pathways (that is, the recommendations in terms of shifting from one range of food
products to others) must be different across the MS.
Some manufacturers believe in a harmonised and simple nutritional label across the EU. Using a label
requires communication towards consumers to raise their awareness. Moreover, labelling has to be
feasible and affordable for all stakeholders. Indeed, manufacturers are aware that labelling adds
constraints and costs at the farm level. This is also the reason why such a process requires a
participatory approach with all of the parties – including farmers – that will use this labelling system.
In terms of food waste and losses, the EC should propose a harmonized tool in order to have reliable
and comparable data across the EU. The EU, MS and regions should work hand-in-hand to achieve this
because managing waste is a regional competence. Therefore, regional authorities have to be included
in the talks. Efforts are necessary along the whole food chain. Farmers can have losses due to bad
weather so alternatives to pesticides are crucial, especially if some of them are forbidden.
Manufacturers can work on reusable or compostable packaging but this requires the harmonisation of
the legal rules regarding packaging for food safety, to facilitate the use of recycled plastics, the
collection of packaging waste, etc. There are many research projects on the circular bioeconomy and a
major point at stake is that there is a real need at the EU level to ease the process in terms of legislation
14The Green Deal and the CAP: policy implications to adapt farming practices and to preserve the EU’s natural resources
and to work on the acceptance waste products, such as the re-use of water. Moreover, research and
innovations are needed to deal with the competition between bioenergy or biomaterials on the one
hand, and food and feed productions on the other hand. Finally, the Green Deal offers the opportunity
to reframe the issue of food waste to a more circular economy perspective, so that the EU goes beyond
food redistribution schemes.
In terms of trade-offs:
- This transition in the EU should be accompanied by a transition at the world level so that the
EU agri-food sector remains a competitive player on a global level;
- Forbidding the use of some pesticides should not induce a food safety issue; and
- Healthier and more sustainable diets have to be affordable and accepted.
4. Second meeting of the policy analysis expert panel (07/10/2020)
The study team introduces the session with the comparison between the Green Deal ambition and the
observed trends of key indicators describing the EU farm and food sector. The team also presents its
proposals to adapt the future CAP, especially the CAP green architecture, in order to address these
Green Deal challenges. Three rounds of debates successively discuss: first, the requirements for the
National Strategic Plans (NSP); second, the indicators and procedures to monitor, coordinate and
enforce the NSP in the new delivery model; and third, the need for additional policy tools to address
nutritional stakes, waste and circular bioeconomy goals and trade effects.
It is important to articulate the CAP architecture with the sustainable development goals (SDG) through
the Green Deal actions. To do so, the NSP must clearly distinguish the measures and expenses targeting
global public goods and global issues from the measures targeting local public goods and local
development supports. The stakes at the EU level are clear with few favourable trends in organic
farming development and a decline in antimicrobial use, and big challenges regarding the recent
trends in GHG emissions and sequestration, pesticide use and the increase in overweight and obesity
rates. However, several MS diverge from the EU average. A clear view of the different MS regarding
each Green Deal target is necessary, firstly, to calibrate their NSP and secondly, to calibrate the effort
sharing between MS. In NSP, the proposal clearly combines the mandatory requirements of the new
conditionality and the eco-scheme measures, which are optional for farmers. However, the articulation
between eco-scheme and the rural development measures, especially the agri-environment and
climate measures (AECM), must be better elaborated and explained. Referring to fiscal federalism, the
eco-scheme payments must target global public goods (that is, climate mitigation and biodiversity
recovery), and rural development measures must target the local public goods (such as water quality
and the adaptation to climate changes). The provision of local public goods and the provision of global
ones are not independent of each other. In many cases, water quality correlates with biodiversity
protection; therefore, AECM may reinforce or complement the eco-schemes where necessary. In other
cases, the high local stakes may conflict with global ones and AECM can be justified to address them in
geographically designated areas. The NSP design should articulate those local conflicting objectives as
smoothly as possible.
The NSP design already started in MS. Given the available information, the NSP are elaborated on a very
heterogeneous basis across MS, regarding two main aspects. The first aspect concerns the weak
enforcement of conditionality in the Netherlands and in Bulgaria, for instance. In the Netherlands, the
enforcement of the private standards of the value chains largely dominates the CAP inspection and
penalty system. In Bulgaria, the conditionality requirements are very weakly implemented to fight
unbalanced fertilization. In Romania, the same problem occurs for pesticide use. Clearly, a level playing
15IPOL | Policy Department for Structural and Cohesion Policies
field does not exist in the EU and the NSP may increase competition distortions due to environmental
dumping. Different MS are elaborating their NSP with very different priorities and strategies. For
example, Germany targets biodiversity with few well-designed measures and Ireland raised its climate
mitigation goals shifting from a 3% to a 7% yearly reduction in net emissions. However, the NSP
includes no agricultural production reduction; voluntary measures, especially AECM, will enhance
better technology adoption.
In its 2018 legislative proposals for the future CAP (annex XII), the EC produced a long list of context,
output, result and impact indicators to monitor, coordinate and enforce the NSP in the so-called New
Delivery Model (NDM). Note that only output and result indicators are binding in the EC proposal. This
list and its indicators face many criticisms. Experts believe that the indicators do not meet several key
policy objectives of the Green Deal. For example, there are no indicators for production losses and food
waste. The indicator quality looks quite poor and even inadequate for climate mitigation. For
biodiversity, only research projects are able to report sound indicators. Therefore, the CAP must set up
independent assessment schemes rather than rely on national administrative reports. Some MS
government and lobbies have very different points of view. Stating that many Green Deal objectives
are not legally binding, many CAP indicators are useless and should be deleted because the EC will not
have any legal tool to set and enforce National targets. Gathered experts agree on the high necessity
of common indicators across the EU. In addition, they prefer a reduced list of efficient and better-
focused indicators. However, the indicator list must integrate key directives such as the National
Emission Ceilings Directive. This is important for the effort sharing between MS in the CAP
implementation and avoid deleterious effects regarding land use and land-use changes. Action is
needed at the EU level to improve the trust in the CAP indicator list.
The CAP mainly focuses on the farm sector. International trade may well offset the CAP achievements
for climate and the environment if no consistent action targets food and energy consumption within
the EU. The average EU diet must evolve towards sustainability at the same pace as the agricultural
sector. To avoid pollution leaks, the global climate and land-use effect of international trade must be
scrutinized commodity-by-commodity, and international trade agreements adjusted accordingly.
Within the CAP, the public support for EU farm product promotion must take into account the climatic
and environmental impact of those products. This is far from being the case presently. Accordingly, the
support to producers’ organizations could be modulated according to the joint public goods. Shifting
the human diet remains challenging. Climate and environmental labelling of food products might help
but will not be sufficient in the Green Deal schedule. Research produces more and more evidence to
calibrate food tax schemes for climate-friendly diets. Reconciling the average climate-friendly diet with
individual heathier diets remains a challenge that requires voluntarist policy and collective efforts in
out-of-home catering, education and social cohesion.
5. Second meeting of the panel of stakeholders’ representatives
(08/10/2020)
Several stakeholders agree on the fact that there should be incentives within the CAP for farmers and
other stakeholders for horizontal cooperation between farmers and vertical cooperation along the
food chain. This could lead to better results, such as increasing biodiversity, increasing crop
diversification (by analysing market opportunities), etc.
A representative of an association explains that there should be at least 10% of non-productive area in
the conditionality (excluding nitrogen-fixing crops or catch crops from the ecological focus areas). Plus,
50% of the first pillar and 50% of the second pillar should be dedicated to environment, climate and
nature measures.
16The Green Deal and the CAP: policy implications to adapt farming practices and to preserve the EU’s natural resources
In general, the feasibility of each proposed measure for the CAP should be easy to implement and easy
to monitor by the administration in order to be effective, efficient and bring added value to taxpayers.
If not, this could lead to a delay in payments to farmers and a misuse or waste of public money. For
example, a GAEC to calculate GHG emissions at farm level could be interesting to identify possible
changes in fertilisation, manure management and herd practices, but it might not be easy to
implement. Using the UNFCCC GHG inventory rules could be a first step to take into account both
regional heterogeneity and climate-friendly techniques.
Several stakeholders ask for a level playing field as much as possible. This is needed for the future eco-
schemes: the EC could set a guideline to help the MS understand what practices could be funded by
the eco-scheme in order to harmonize them across the EU. More generally, setting a level playing field
within the CAP requires dialogue among all MS and not only bilateral negotiations between each MS
and DG AGRI.
There is also a need for a legislation in which the EC would clarify the F2FS targets by detailing some
requirements, target values and quantification methods for some indicators, etc. Plus, the set of
indicators proposed by the EC should be simplified to be more understandable and improved because
they are poorly aligned with Green Deal action objectives. Moreover, new indicators could be
introduced in order to take into account viability or competitiveness objectives.
In addition to changes on the supply side, dietary changes are needed to reach the ambitious climate
goals of the Green Deal. In the EU, there is a need for a reduction in global energy intakes, meat intakes,
added sugars, etc., and an increase in various plant-based products, such as legumes, grains, fruits, etc.
Changes in diets is occurring among the higher social classes of the population but for economic
reasons, these dietary changes do not occur in the whole population.
Dietary changes will not be driven by spontaneous changes in consumers’ preferences. Education is
important but has no sufficient impact to change current diets. Moreover, in the short term, given the
current food production and agricultural practices, there is a risk that healthier and more sustainable
products will be more expensive and affordable for a niche market only. That is why there must be a
long-term and systemic transition with a scaling up of agricultural practices to produce such products
and economic incentives so that this food is affordable by the whole population.
The private sector and the public sector should work together to achieve this transition.
The private sector could improve the products, improve the ingredients within the products, influence
the supply, promotion and broader distribution of healthier and more sustainable products at retailers’
level, etc. Efficient promotion requires dialogue and partnerships between producers, processors and
retailers. Moreover, a private stakeholder calls for a European common scheme for nutritional and
environmental labelling, which would help to create trust with consumers. Plus, there could be
restrictions in terms of advertising, placements, digital marketing, etc., especially to children for
products that have the lowest nutritional quality. Finally, the private sector can also incite changes in
practices through long-term contracts or contracts that value the efforts of farmers that are achieved.
Note that premium prices could be an economic incentive for farmers who produce such products but
one has to be careful not to go against the competition.
Actions of the public sector are also needed to give a general context that favours healthier and more
sustainable food products, that limits those that are not and valorises efforts made by the private
sector. The public sector can build a level playing field across the EU and among sectors and create a
food environment that makes healthier and more sustainable food choices easier and more accessible
than they currently are.
17IPOL | Policy Department for Structural and Cohesion Policies
Policies beyond the CAP could be useful. It could involve establishing new policies (such as a Common
Food Policy as proposed in the IPES-Food report), or by using existing policies (such as the EU obesity
policies, trade agreements, the EU school food schemes, carbon policies, etc.). There should also be
European food based dietary guidelines that include local and cultural angles.
Moreover, there could be an added or increased tax for products that have the lowest nutritional
quality and an exemption or reduced level of tax for fruit and vegetables or no-added sugar products,
etc. Some representatives of the food industry consider that positive incentives, rewarding virtuous
commitments, are better than penalizing actions and negative interventions through taxes. In case of
a tax policy implementation, such a tax should be accompanied by a redistribution scheme at the
national level to use the collective revenue in order to make the total policy less regressive.
Redistribution could be within the food chain: increasing the price of some products but decreasing
the price of other products. It could also be within the food chain as the German government have
established: a levy on meat, which could be used to invest back into the sector to change animal
housing, animal welfare and environmental aspects.
There should also be a global coordination. Indeed, if efforts are only made at the EU level, the EU risks
to facing competition from outside its borders that may cancel out the effectiveness of its efforts.
18The Green Deal and the CAP: policy implications to adapt farming practices and to preserve the EU’s natural resources
ANNEX A3.1. AGRICULTURAL SUBSIDIES IN EU AGRICULTURE
Table A3.1.1: Direct aids granted to EU farms in function of their economic size class (2018)
Number Direct aids (total)
of farms
Per Per Per hectare % of
farm (€) AWU (€) of UAA (€) agricultural
Economic size classes production
(1) 2 000 - < 8 000 EUR 867 800 1 900 1 900 324 27%
(2) 8 000 - < 25 000 EUR 1 373 900 5 400 4 700 375 29%
(3) 25 000 - < 50 000 EUR 574 900 11 300 8 100 400 27%
(4) 50 000 - < 100 000 EUR 496 300 18 700 11 400 340 24%
(5) 100 000 - < 500 000 EUR 610 900 33 500 14 200 328 15%
(6) >= 500 000 EUR 112 000 95 200 11 900 350 9%
Total 4 035 700 13 900 8 700 347 16%
Source: FADN 2018 – Authors’ calculations.
Note: AWU for Agricultural Work Unit; UAA for Utilized Agricultural Area.
Table A3.1.2: Direct aids granted to EU farms in function of their specialisation (2018)
Number Direct aids (total)
of farms Per Per Per ha % of
farm (€) AWU (€) of UAA (€) agricultural
Types of farming production
15 Specialist COP 653 800 18 900 14 600 265 27%
16 Specialist other field crops 426 500 14 500 9 600 373 18%
20 Specialist horticulture 140 000 2 800 800 420 1%
35 Specialist wine 224 300 4 500 2 600 287 4%
36 Specialist orchards - fruits 259 600 5 500 3 200 483 10%
37 Specialist olives 173 200 7 800 7 700 566 28%
38 Permanent crops combined 97 800 5 100 4 500 449 17%
45 Specialist milk 438 600 20 600 10 900 439 13%
48 Specialist sheep and goats 328 000 14 400 10 200 297 33%
49 Specialist cattle 356 800 22 800 17 000 401 36%
50 Specialist granivores 111 200 16 900 7 000 399 4%
60 Mixed crops 180 400 7 100 4 500 335 15%
70 Mixed livestock 100 400 10 700 6 800 357 13%
80 Mixed crops and livestock 545 100 12 100 8 100 353 21%
-- Total 4 035 700 13 900 8 700 347 16%
Source: FADN 2018 – Authors’ calculations.
19IPOL | Policy Department for Structural and Cohesion Policies
Table A3.1.3: Direct aids (total) granted to EU farms in the different MS (2018)
Number Direct aids (total)
of farms Per farm Per AWU per ha of UAA % agricultural
(€) (€) (€) output
Austria 70 790 20 400 13 600 616 21%
Belgium 28 230 22 800 10 800 439 8%
Bulgaria 61 440 18 800 6 500 276 26%
Croatia 72 440 7 100 4 200 417 25%
Cyprus 10 510 4 800 3 400 449 12%
Czechia 18 160 98 200 19 000 511 31%
Denmark 26 090 40 000 20 500 359 9%
Estonia 7 630 30 000 16 600 214 24%
Finland 34 120 54 500 44 300 810 46%
France 296 730 27 900 14 100 316 14%
Germany 179 750 38 000 17 100 417 14%
Greece 336 790 6 600 6 500 691 31%
Hungary 110 820 16 600 11 100 370 22%
Ireland 93 170 18 200 16 300 374 24%
Italy 559 540 9 800 7 300 455 13%
Latvia 25 020 16 900 8 300 255 26%
Lithuania 62 530 11 100 7 000 225 30%
Luxembourg 1 410 53 300 30 100 623 23%
Malta 3 100 2 200 1 700 844 6%
The Netherlands 46 710 17 300 5 800 440 3%
Poland 746 110 6 400 4 100 326 22%
Portugal 106 580 7 800 4 800 345 20%
Romania 525 600 4 100 3 300 234 19%
Slovakia 4 150 142 800 13 500 321 24%
Slovenia 44 390 6 500 5 400 620 23%
Spain 434 500 11 600 7 200 249 14%
Sweden 28 620 39 700 26 100 372 22%
United Kingdom 100 770 39 600 18 300 250 15%
UE 4 035 680 13 900 8 800 347 16%
Source: FADN 2018 – Authors’ calculations.
Note: AWU for Agricultural Work Unit; UAA for Utilized Agricultural Area.
20The Green Deal and the CAP: policy implications to adapt farming practices and to preserve the EU’s natural resources
ANNEX A3.2. FERTILIZER AND PESTICIDE COST FOR EU FARMS
Table A3.2.1: Cost of fertilizers in 2007-2018 and 2018 according to farm specialisation (million
euros)
Average 2007-2018 2018
Per farm Per hectare of % of agri. Per farm Per hectare of % of agri.
UAA Production UAA Production
15 Specialist COP 9 390 137 14.4% 9 290 130 13.2%
16 Specialist other field crops 6 150 169 9.0% 6 400 165 8.0%
20 Specialist horticulture 5 730 880 3.4% 6 630 999 2.9%
35 Specialist wine 1 910 132 2.4% 2 280 145 2.1%
36 Specialist orchards - fruits 2 020 191 4.6% 2 630 231 4.8%
37 Specialist olives 1 500 125 6.7% 2 100 152 7.6%
38 Permanent crops combined 1 370 119 4.9% 1 550 135 5.3%
45 Specialist milk 3 640 100 3.5% 4 590 98 2.9%
48 Specialist sheep and goats 1 100 27 3.1% 1 240 26 2.8%
49 Specialist cattle 2 680 53 4.9% 2 750 48 4.3%
50 Specialist granivores 3 860 112 1.3% 4 570 108 1.1%
60 Mixed crops 2 680 133 6.8% 2 960 140 6.2%
70 Mixed livestock 1 270 79 3.5% 2 190 73 2.6%
80 Mixed crops and livestock 3 250 110 7.2% 3 610 106 6.3%
-- Total 3 820 114 5.6% 4 480 112 5.1%
Source: FADN 2018 – Authors’ calculations.
Table A3.2.2: Cost of crop protection products in 2007-2018 and 2018 according to farm
specialisation (million euros)
Average 2007-2018 2018
Per farm Per hectare of % of agri. Per farm Per hectare of % of agri.
UAA production UAA production
15 Specialist COP 5 870 86 9.0% 6 500 91 9.2%
16 Specialist other field crops 4 820 133 7.1% 5 430 140 6.8%
20 Specialist horticulture 4 200 643 2.4% 5 370 809 2.4%
35 Specialist wine 3 680 255 4.6% 4 490 286 4.1%
36 Specialist orchards - fruits 2 950 280 6.7% 3 610 318 6.5%
37 Specialist olives 1 030 87 4.7% 1 170 84 4.2%
38 Permanent crops combined 1 310 114 4.7% 1 430 124 4.8%
45 Specialist milk 1 180 32 1.1% 1 500 32 1.0%
48 Specialist sheep and goats 220 5 0.6% 260 5 0.6%
49 Specialist cattle 710 14 1.3% 750 13 1.2%
50 Specialist granivores 3 170 92 1.1% 4 080 97 1.0%
60 Mixed crops 2 110 105 5.4% 2 430 115 5.1%
70 Mixed livestock 730 45 2.0% 1 440 48 1.7%
80 Mixed crops and livestock 2 060 70 4.5% 2 450 72 4.3%
-- Total 2 540 76 3.7% 3 220 81 3.6%
Source: FADN 2018 – Authors’ calculations.
21IPOL | Policy Department for Structural and Cohesion Policies
Table A3.2.3: Cost of fertilizers in 2007-2018 and 2018 in EU MS (euros and percent)
2007-2018 2018
Per Per hectare % Per Per hectare %
farm of agricultural farm of agricultural
UAA output UAA output
(BEL) Belgium 8 380 171 3.5% 8 360 161 2.9%
(BGR) Bulgaria 3 620 85 8.4% 6 370 94 8.7%
(CYP) Cyprus 1 610 171 4.4% 1 560 146 3.8%
(CZE) Czechia 19 380 94 6.7% 18 960 99 6.0%
(DAN) Denmark 11 780 118 2.9% 13 190 118 3.1%
(DEU) Germany 12 180 141 5.2% 10 360 113 3.9%
(ELL) Greece 1 430 157 6.3% 1 410 147 6.7%
(ESP) Spain 3 460 84 5.9% 4 270 92 5.2%
(EST) Estonia 9 310 71 9.2% 10 470 75 8.5%
(FRA) France 12 500 144 6.7% 11 280 128 5.5%
(HRV) Croatia 2 140 128 8.5% 2 270 133 8.0%
(HUN) Hungary 4 660 95 6.8% 4 400 98 5.7%
(IRE) Ireland 5 490 116 9.4% 6 360 130 8.3%
(ITA) Italy 2 460 135 4.0% 3 040 141 4.0%
(LTU) Lithuania 4 320 91 12.0% 4 800 97 12.9%
(LUX) Luxembourg 9 280 114 5.0% 8 580 100 3.8%
(LVA) Latvia 4 770 70 9.0% 5 100 77 8.0%
(MLT) Malta 780 277 2.0% 810 308 2.1%
(NED) The Netherlands 7 170 193 1.5% 7 090 180 1.3%
(OST) Austria 2 050 66 2.7% 2 320 70 2.3%
(POL) Poland 2 610 138 9.2% 2 880 147 9.9%
(POR) Portugal 1 480 60 4.8% 1 600 71 4.1%
(ROU) Romania 720 71 5.6% 1 420 80 6.6%
(SUO) Finland 6 670 115 7.0% 7 010 104 5.9%
(SVE) Sweden 10 210 101 5.7% 9 920 93 5.4%
(SVK) Slovakia 38 750 77 7.4% 39 330 88 6.5%
(SVN) Slovenia 930 88 3.7% 810 77 2.8%
(UKI) United Kingdom 15 310 97 6.5% 14 350 91 5.4%
UE 3 820 114 5.6% 4 480 112 5.1%
Source: FADN – Authors’ calculations.
22The Green Deal and the CAP: policy implications to adapt farming practices and to preserve the EU’s natural resources
Table A3.2.4: Cost of crop protection products in 2007-2018 and 2018 in EU MS (euros and
percent)
2007-2018 2018
Per Per hectare % Per Per hectare %
farm of agricultural farm of UAA agricultural
UAA output output
(BEL) Belgium 7 440 152 3.1% 8 420 162 2.9%
(BGR) Bulgaria 2 170 50 5.0% 4 190 62 5.7%
(CYP) Cyprus 970 104 2.7% 940 88 2.3%
(CZE) Czech Republic 17 410 84 6.0% 17 890 93 5.7%
(DAN) Denmark 8 690 87 2.1% 9 790 88 2.3%
(DEU) Germany 9 060 105 3.9% 8 900 97 3.4%
(ELL) Greece 930 101 4.1% 1 000 104 4.7%
(ESP) Spain 2 230 54 3.7% 3 170 68 3.8%
(EST) Estonia 3 190 24 3.1% 4 190 30 3.4%
(FRA) France 9 800 113 5.3% 10 220 116 5.0%
(HRV) Croatia 1 130 68 4.5% 1 390 82 4.9%
(HUN) Hungary 3 560 72 5.2% 3 520 79 4.6%
(IRE) Ireland 860 18 1.5% 950 20 1.2%
(ITA) Italy 1 910 105 3.1% 2 260 105 3.0%
(LTU) Lithuania 1 710 36 4.8% 2 030 41 5.5%
(LUX) Luxembourg 5 030 62 2.7% 5 040 59 2.2%
(LVA) Latvia 2 150 31 4.0% 2 640 40 4.1%
(MLT) Malta 670 239 1.7% 580 221 1.5%
(NED) Netherlands 8 510 229 1.8% 10 220 260 1.8%
(OST) Austria 1 410 45 1.8% 1 810 54 1.8%
(POL) Poland 1 120 59 4.0% 1 180 60 4.0%
(POR) Portugal 1 100 45 3.6% 1 320 59 3.4%
(ROU) Romania 420 41 3.2% 880 50 4.1%
(SUO) Finland 1 790 31 1.9% 1 980 29 1.7%
(SVE) Sweden 3 970 39 2.2% 4 020 38 2.2%
(SVK) Slovakia 34 050 68 6.5% 35 800 80 5.9%
(SVN) Slovenia 530 50 2.1% 560 53 1.9%
(UKI) United Kingdom 9 400 59 4.0% 10 220 64 3.8%
UE 2 540 76 3.7% 3 220 81 3.6%
Source: FADN 2018 – Authors’ calculations.
23IPOL | Policy Department for Structural and Cohesion Policies
24The Green Deal and the CAP: policy implications to adapt farming practices and to preserve the EU’s natural resources
ANNEX A3.3. EU TRADE IN AGRI-FOOD PRODUCTS
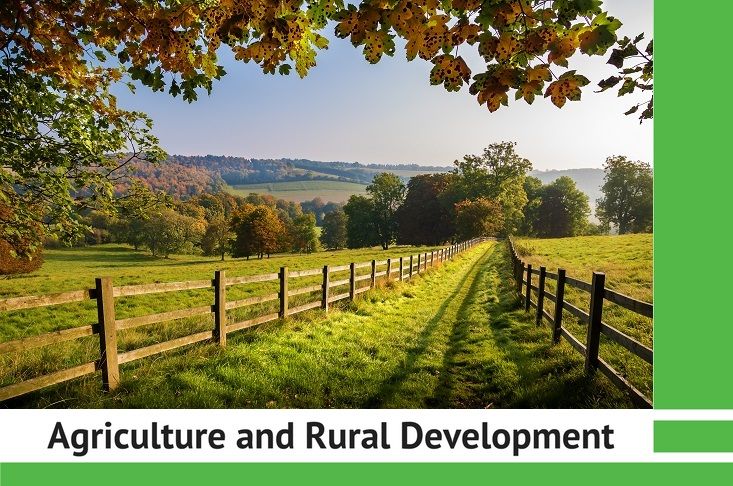
Figure A3.3.1: EU-28 exports, imports and trade balance in agri-food products (2000-2019,
current billion euros)
Source: COMEXT – Authors’ calculations.
Table A3.3.2: EU-28 exports, imports and balance in agri-food products in 2019 (billion euros)
Exports Imports Trade balance
- Dairy products 24.11 1.96 22.15
- Cattle sector 2.12 1.79 0.33
- Sheep and goat sector 0.51 0.85 -0.35
- Pork sector 10.22 0.08 10.15
- Poultry sector 2.75 2.10 0.65
- Other animal productions 3.14 2.33 0.81
Animal productions 42.85 9.11 33.74
- Fruits 3.63 21.25 -17.61
- Vegetables 3.22 5.35 -2.12
- Fruit & Vegetable Preparations 6.30 5.57 0.73
- Cereals and mill products 10.60 7.19 3.41
- Cereal-based preparations 6.77 1.71 5.06
- Oilseeds 3.63 10.94 -7.30
- Sugars 2.28 1.86 0.42
- Horticulture 2.53 1.84 0.69
- Coffee, tea, cocoa 7.83 16.94 -9.11
- Other plant productions 25.05 30.56 -5.51
Vegetal productions 71.86 103.21 -31.35
Drinks (water, wine, spirit…) 33.04 6.57 26.47
Fish 5.92 27.02 -21.10
Total 153.67 145.90 7.77
Source: COMEXT – Authors’ calculations.
25IPOL | Policy Department for Structural and Cohesion Policies
Table A3.3.3: EU-28 trade in cereals and animal products in 2019 (million tonnes)
Production Consumption Exports Imports Exports in % Imports in %
production consumption
Cereals 312.1 288.0 39.8 23.4 13% 8%
Wheat 154.0 126.6 26.6 5.7 17% 5%
Maize 66.7 82.8 2.9 16.0 4% 19%
Oilseed 29.7 49.7 0.8 20.9 3% 42%
Oilseed meal 30.5 52.0 1.2 22.6 4% 43%
Sugar 17.5 18.6 1.3 1.9 7% 10%
Milk 165.3 147.1 19.1 0.9 12% 1%
Meat 48.7 44.8 5.1 1.3 10% 3%
Pig meat 24.1 21.0 3.2 0.0 13% 0%
Beef meat 7.9 8.0 0.3 0.3 4% 4%
Poultry meat 15.6 14.8 1.6 0.8 10% 5%
Sheep and goat 0.9 1.0 0.0 0.1 4% 20%
Source: EC - DG-AGRI - EU agricultural outlook.
Table A3.3.4: EU trading partners in agri-food products in 2019 by continent (billion euros)
Exports Imports Trade balance
Asia 61.67 37.12 24.54
Europe (others) 29.93 27.40 2.53
North America 29.16 16.20 12.97
Africa 18.19 22.05 -3.86
Oceania 4.68 4.96 -0,.8
South America 4.50 30.52 -26.02
Central America and the Caribbean 3.91 7.34 -3.43
Total 153.67 145.90 7.77
Source: COMEXT – Authors’ calculations.
Table A3.3.5: EU trading partners in agri-food products in 2019 by country (billion Euros)
Exports Imports Trade balance
Top 10 countries with an EU positive trade balance
China 18.76 7.34 11.42
Japan 7.78 0.44 7.34
Russia 6.96 2.28 4.68
Switzerland 8.59 4.70 3.89
Saudi Arabia 3.62 0.08 3.54
South Korea 3.25 0.30 2.96
United Arab Emirates 2.66 0.09 2.57
Algeria 2.40 0.07 2.33
Singapore 2.42 0.47 1.94
Top 10 countries with an EU negative trade balance
Thailand 1.26 2.64 -1.37
Vietnam 1.25 2.71 -1.46
Ecuador 0.25 1.87 -1.62
India 0.77 3.42 -2.64
Ivory Coast 0.63 3.30 -2.67
Norway 4.81 7.61 -2.80
Indonesia 0.93 4.29 -3.36
Ukraine 2.46 7.14 -4.68
Argentina 0.22 5.19 -4.97
Brazil 1.71 10.26 -8.56
Source: COMEXT.
26The Green Deal and the CAP: policy implications to adapt farming practices and to preserve the EU’s natural resources
Table A3.3.6:. EU MS exports, imports and trade balance in agri-food products in 2019 (billion
euros)
Trade with EU countries Trade with non-EU countries Total
Exports Imports Balance Exports Imports Balance Exports Imports Balance
The Netherlands 69.36 33.50 35.86 22.42 30.15 -7.72 91.78 63.64 28.14
Spain 36.99 21.18 15.81 14.47 16.45 -1.98 51.46 37.63 13.83
Poland 23.75 15.93 7.83 6.08 4.26 1.82 29.83 20.19 9.64
France 39.16 44.71 -5.55 24.63 12.43 12.19 63.79 57.14 6.64
Denmark 11.46 8.77 2.69 7.14 4.60 2.54 18.60 13.37 5.23
Belgium 31.61 24.92 6.69 6.90 8.48 -1.58 38.52 33.40 5.12
Ireland 9.78 8.27 1.50 4.37 1.40 2.96 14.14 9.68 4.47
Hungary 6.99 4.86 2.13 1.31 0.52 0.78 8.29 5.38 2.91
Lithuania 3.57 3.33 0.24 1.87 0.72 1.15 5.45 4.06 1.39
Bulgaria 2.95 2.53 0.42 1.58 0.90 0.68 4.52 3.43 1.09
Latvia 1.38 2.26 -0.87 1.46 0.34 1.11 2.84 2.60 0.24
Estonia 0.96 1.41 -0.44 0.37 0.13 0.24 1.33 1.54 -0.20
Malta 0.02 0.56 -0.54 0.23 0.10 0.13 0.25 0.66 -0.42
Austria 8.88 10.72 -1.84 3.13 1.83 1.30 12.01 12.55 -0.54
Greece 4.45 5.54 -1.09 2.14 1.72 0.42 6.59 7.26 -0.68
Italy 26.26 30.27 -4.00 16.39 13.10 3.29 42.65 43.37 -0.71
Cyprus 0.29 0.91 -0.61 0.14 0.25 -0.11 0.43 1.15 -0.73
Slovenia 1.53 2.04 -0.51 0.54 0.86 -0.32 2.06 2.90 -0.84
Romania 4.25 6.69 -2.43 2.64 1.25 1.38 6.89 7.94 -1.05
Croatia 1.33 2.79 -1.46 0.85 0.45 0.40 2.17 3.23 -1.06
Luxembourg 1.05 2.13 -1.09 0.06 0.11 -0.04 1.11 2.24 -1.13
Slovakia 2.57 4.42 -1.85 0.12 0.13 -0.01 2.69 4.55 -1.86
Czech R. 7.05 9.06 -2.00 0.70 0.75 -0.05 7.75 9.80 -2.05
Finland 1.14 4.26 -3.13 0.74 0.91 -0.17 1.88 5.17 -3.29
Portugal 5.34 9.05 -3.71 2.02 2.40 -0.38 7.36 11.45 -4.09
Sweden 6.52 9.06 -2.55 2.26 5.99 -3.73 8.78 15.06 -6.28
Germany 52.95 64.58 -11.63 17.63 18.39 -0.76 70.57 82.97 -12.40
United Kingdom 16.82 39.60 -22.77 11.48 17.26 -5.78 28.30 56.86 -28.55
Source: COMEXT.
27IPOL | Policy Department for Structural and Cohesion Policies
28The Green Deal and the CAP: policy implications to adapt farming practices and to preserve the EU’s natural resources
ANNEX A4.1. ORGANIC AND NON-ORGANIC FARMS IN THE EU
This annex compares the structural and economic characteristics of conventional versus organic farms
based on the EU FADN for the year 2018. 1 In Table A4.1.1, holdings were grouped in three classes: (1)
the holding does not use organic production methods (class 1 of “conventional” farms); (2) the holding
uses organic production methods for all its products (class 2); and (3) other holdings including farms
with both organic and other production methods, as well as farms in conversion to organic production
methods (class 3). In other tables, we considered conventional farm, organic farm and all farms
together.
Table A4.1.1: Number of European farms according to types of farming and conventional/organic
production methods in 2018
Conventional Organic farms Other farms All
farms (only) farms
Types of farming
15 Specialist COP 622 000 19 100 12 700 653 800
16 Specialist other field crops 391 200 20 800 14 400 426 500
20 Specialist horticulture 128 100 5 100 6 800 140 000
35 Specialist wine 195 300 19 400 9 500 224 300
36 Specialist orchards - fruits 221 900 20 800 16 800 259 600
37 Specialist olives 112 500 29 300 31 400 173 200
38 Permanent crops combined 79 300 10 500 8 100 97 800
45 Specialist milk 400 100 32 500 6 000 438 600
48 Specialist sheep and goats 289 600 20 000 18 400 328 000
49 Specialist cattle 308 300 35 600 13 000 356 800
50 Specialist granivores 105 700 3 500 2 000 111 200
60 Mixed crops 158 800 13 200 8 500 180 400
70 Mixed livestock 95 200 3 200 1 500 100 400
80 Mixed crops and livestock 506 200 25 700 13 100 545 100
-- Total 3 614 300 258 600 162 900 4 035 700
Source: DGAGI - FADN 2018 – Authors’ calculations.
1
We gratefully thank the European Commission (DG AGRI) for kindly and quickly providing us access to the EU FADN.
29IPOL | Policy Department for Structural and Cohesion Policies
Table A4.1.2: Average characteristics of organic and non-organic farms in 2018 in the EU-28
(all specialisations)
Conventional Organic farms All
farms (only) farms
Number of farms 3 614 260 258 560 4 035 680
Agricultural work unit (AWU) 1.58 1.59 1.58
- Family AWU 1.15 1.13 1.15
- Non-Family AWU 0.43 0.46 0.44
Usable agricultural area (UAA in hectares) 40 41 40
- Cereals 15 7 14
- Forage crops 16 27 16
Yield of wheat (q/ha) 59 34 58
Livestock Units total (LU - total) 33 24 32
Grazing Livestock Units per forage UAA 1.30 0.79 1.23
Direct aids (€) 13 100 21 800 13 900
- Decoupled payments 8 910 9 790 8 970
- Subsidies on crops 380 320 390
- Subsidies on livestock 890 910 900
- Rural development measures 1 990 9 940 2 700
* Environmental subsidies 880 7 340 1 480
* Less Favoured Areas (LFA) subsidies 540 490 530
* Other rural development payments 150 380 170
- Other subsidies 930 840 940
Direct aids by AWU (€) 8 300 13 700 8 700
Direct aids by UAA (€) 330 528 347
Direct aids in % of agricultural prod. (with aids) 13% 21% 14%
Agricultural production, with aid (€) 102 800 103 500 102 500
- by AWU 65 100 65 100 64 700
- per hectare of UAA 2 596 2 503 2 568
Intermediate consumptions (€) 55 600 46 800 54 400
- per hectare of UAA 1 404 1 133 1 362
- In % of agricultural production (with aids) 54% 45% 53%
Fertilizers (€) 4 740 1 520 4 480
- per hectare of UAA 120 37 112
- In % of agricultural production (with aids) 4.6% 1.5% 4.4%
Plant protection products (€) 3 440 780 3 220
- per hectare of UAA 87 19 81
- In % of agricultural production (with aids) 3.3% 0.8% 3.1%
Specific Livestock costs / LU 611 613 608
Energy (€) 5 950 5 460 5 880
- per hectare of UAA 150 132 147
- In % of agricultural production (with aids) 5.8% 5.3% 5.7%
Gross Operating Surplus (EBE in French) (€) 34 500 42 700 35 200
- per family AWU 29 900 37 700 30 600
- per hectare of UAA 871 1 033 882
- In % of agricultural production (with aids) 34% 41% 34%
Agricultural income (€) 22 600 28 300 23 300
- per family AWU 19 600 25 000 20 300
- per hectare of UAA 572 685 584
- In % of agricultural production (with aids) 22% 27% 23%
Total liabilities (€) 416 500 489 700 418 800
General debt ratio (%) 16% 16% 16%
Source: DGAGRI - FADN 2018 – Authors’ calculations.
30You can also read