Guidance for operational practices in HDR television production - Report ITU-R BT.2408-4 (03/2021) BT Series Broadcasting service (television) ...
←
→
Page content transcription
If your browser does not render page correctly, please read the page content below
Report ITU-R BT.2408-4
 (03/2021)

Guidance for operational practices
 in HDR television production

 BT Series
 Broadcasting service
 (television)
ii Rep. ITU-R BT.2408-4

 Foreword
The role of the Radiocommunication Sector is to ensure the rational, equitable, efficient and economical use of the radio-
frequency spectrum by all radiocommunication services, including satellite services, and carry out studies without limit
of frequency range on the basis of which Recommendations are adopted.
The regulatory and policy functions of the Radiocommunication Sector are performed by World and Regional
Radiocommunication Conferences and Radiocommunication Assemblies supported by Study Groups.

 Policy on Intellectual Property Right (IPR)
ITU-R policy on IPR is described in the Common Patent Policy for ITU-T/ITU-R/ISO/IEC referenced in
Resolution ITU-R 1. Forms to be used for the submission of patent statements and licensing declarations by patent holders
are available from http://www.itu.int/ITU-R/go/patents/en where the Guidelines for Implementation of the Common
Patent Policy for ITU-T/ITU-R/ISO/IEC and the ITU-R patent information database can also be found.

 Series of ITU-R Reports
 (Also available online at http://www.itu.int/publ/R-REP/en)

 Series Title

 BO Satellite delivery
 BR Recording for production, archival and play-out; film for television
 BS Broadcasting service (sound)
 BT Broadcasting service (television)
 F Fixed service
 M Mobile, radiodetermination, amateur and related satellite services
 P Radiowave propagation
 RA Radio astronomy
 RS Remote sensing systems
 S Fixed-satellite service
 SA Space applications and meteorology
 SF Frequency sharing and coordination between fixed-satellite and fixed service systems
 SM Spectrum management

 Note: This ITU-R Report was approved in English by the Study Group under the procedure detailed in
 Resolution ITU-R 1.

 Electronic Publication
 Geneva, 2021
 © ITU 2021
All rights reserved. No part of this publication may be reproduced, by any means whatsoever, without written permission of ITU.
Rep. ITU-R BT.2408-4 1

 REPORT ITU-R BT.2408-4

 Guidance for operational practices in HDR television production
 (2017-2018-04/2019-07/2019-2021)

Summary
This Guidance for operational practices is intended to help ensure optimum and consistent use of high dynamic
range in television production using the Perceptual Quantization (PQ) and Hybrid Log-Gamma (HLG)
methods specified in Recommendation ITU-R BT.2100. Additional background information on HDR is
available in Report ITU-R BT.2390, while Report ITU-R BT.2446 provides guidance towards the design of
methods of conversion between HDR and SDR content.

 TABLE OF CONTENTS
 Page

Policy on Intellectual Property Right (IPR) ............................................................................. ii

1 Introduction .................................................................................................................... 4

2 Reference levels and signal format ................................................................................. 4
 2.1 HDR Reference White ........................................................................................ 5
 2.2 Signal levels for line-up in production ............................................................... 5
 2.3 Bit depth.............................................................................................................. 7
 2.4 Signal range ........................................................................................................ 7
 2.5 Colour representation.......................................................................................... 8

3 Monitoring ...................................................................................................................... 8
 3.1 Display of PQ signals ......................................................................................... 8
 3.2 Display of HLG signals ...................................................................................... 10

4 Image brightness ............................................................................................................. 12
 4.1 Comfortable brightness of static images............................................................. 13
 4.2 Tolerance to programme brightness shifts .......................................................... 14

5 Inclusion of standard dynamic range content ................................................................. 15
 5.1 Display referred mapping ................................................................................... 16
 5.2 Scene referred mapping ...................................................................................... 19
 5.3 Handling negative values in format conversion ................................................. 21
 5.4 Adjustments to BT.709 cameras ......................................................................... 21
 5.5 Use of 8-bit content............................................................................................. 22
 5.6 Mapping of SDR graphics .................................................................................. 22

2 Rep. ITU-R BT.2408-4

6 Conversion between PQ and HLG ................................................................................. 23
 6.1 Transcoding concepts ......................................................................................... 23
 6.2 Conversion concepts using a reference condition at 1 000 cd/m 2 .................................. 23
 6.3 Cameras using a common OOTF at a reference peak luminance of 1 000 cd/m2
 ............................................................................................................................ 24
 6.4 Handling PQ signals with greater than 1 000 cd/m2 peak luminance ................. 25
 6.5 Possible colour differences when converting from PQ to HLG ......................... 25

7 Transitioning from SDR BT.709 to HDR BT.2100 production ..................................... 27
 7.1 HDR focused production .................................................................................... 27
 7.2 SDR focused production ..................................................................................... 29
 7.3 SDR-HDR and HDR-SDR format conversion ................................................... 31
 7.4 SDR-HDR-SDR “Round-Tripping” ................................................................... 36
 7.5 Hardware colour matrix compensation ............................................................... 36
 7.6 Signal line-up ...................................................................................................... 37

8 Conversion practices for camera and display RGB colorimetry .................................... 37

Annex 1 – Study to evaluate levels for PQ content ................................................................. 38

Annex 2 – Analysis of reference levels ................................................................................... 40
 A2.1 Introduction......................................................................................................... 40
 A2.2 Analysis of reference levels ................................................................................ 40
 A2.3 Diffuse white elements in live HLG encoded broadcast content........................ 41
 A2.4 Diffuse white in an HDR dataset of 1 000 cd/m2 PQ encoded images............... 42
 A2.5 Discussion ........................................................................................................... 44
 A2.6 Conclusions......................................................................................................... 44

Annex 3 – Two studies of skin tones, using a reflectance database and using real subjects ... 45
 A3.1 Study 1: using a skin tone database and an ideal model of a camera ................. 45
 A3.2 Study 2: using human subjects and a RAW recording camera ........................... 47
 A3.3 Conclusions......................................................................................................... 49

Annex 4 – Study of facial skin tones in broadcast content ...................................................... 50
 A4.1 Facial skin tones in SDR news and information programmes in studio ............. 50
 A4.2 Comparison of facial skin tones in HLG HDR and SDR content in a music
 programme .......................................................................................................... 51
 A4.3 Conclusion .......................................................................................................... 52

Rep. ITU-R BT.2408-4 3

Annex 5 – Displaying PQ - calculating the EETF ................................................................... 53

Annex 6 – Comparison of the native looks of HDR and SDR production .............................. 56
 A6.1 Differences in chromaticity and saturation ......................................................... 57
 A6.2 Quantifying the total colour differences ............................................................. 60
 A6.3 Comparison with the reference colour pattern data ............................................ 61

Annex 7 – Calculating the normalized primary matrix............................................................ 63
 A7.1 Conversion of normalized linear colour signals to Recommendation
 ITU-R BT.2100................................................................................................... 64
 A7.2 Conversion of BT.2100 to arbitrary linear colour signals for display systems .. 66

References ................................................................................................................................ 66

Glossary ................................................................................................................................... 68
4 Rep. ITU-R BT.2408-4

1 Introduction
Recommendation ITU-R BT.2100 (BT.2100) specifies HDR-TV image parameters for use in
production and international programme exchange using the Perceptual Quantization (PQ) and
Hybrid Log-Gamma (HLG) methods. Since its first publication in 2016, television programme
production in high dynamic range (HDR) continues to grow and is attracting increasing interest from
content creators and broadcasters wishing to benefit from the improved viewing experience that HDR
offers. At the same time, standard dynamic range (SDR) and high dynamic range will need to coexist
for many years to come. These operational practices propose guidance to programme makers and
broadcasters based on knowledge and practical experience gained so far. A glossary of terms is
included at the end of this Report.
Production in PQ is similar to standard dynamic range production. During capture, the scene may be
exposed to produce the desired appearance on a reference monitor, ideally operating in the reference
environment. Exposure setting may be assisted for example by setting a grey or diffuse white card to
the desired signal level. It is possible for the PQ system to capture and encode information that is
beyond the capabilities of a specific monitor, if that monitor cannot reach both the ideal peak
luminance of 10 000 cd/m2 and the full extent of the BT.2100 wide colour gamut. If the PQ signal is
not actively constrained to the capability of the reference monitor in use, more information may be
revealed on a subsequent display with higher peak luminance or colour gamut.
HLG has been designed to enable a straightforward migration towards HDR television production,
with few changes to SDR production working practices. The compatible nature of the HLG signal
allows standard dynamic range monitors to be used in non-critical monitoring areas. HDR monitors
are necessary only for critical monitoring, such as when colour grading, camera shading (or racking)
and monitoring programme and preview outputs in a production gallery.
Just as line-up levels are useful for audio production, nominal signal levels for standard test charts
are also useful for HDR television production. Nominal signal levels are given in order to facilitate
camera line-up to help ensure consistency both within and between programmes, together with advice
on monitoring and displaying HDR content.
Initial findings are presented on viewer tolerances to variations in image brightness, aimed in
particular at avoiding viewer discomfort at junctions between programmes and other items of content,
as well as when switching between programme channels.
Techniques are described for including SDR content in HDR productions, as are the principles of
transcoding between PQ and HLG. Experience gained from trials with live production is documented,
offering a practical guide for transitioning from SDR to HDR.
Annexes provide further technical details and background information. Annexes 1, 2, 3 and 4 present
the results of studies analysing skin tones and other existing content which have been used to help
inform guidance on video levels in HDR production.
Annex 5 compares various approaches that can be used to map PQ signals to displays with a lower
dynamic range than contained in the signal; such processes may also be required during conversion
from PQ to HLG.
Annex 6 compares the native displayed “look” of each SDR and HDR production format.
Annex 7 gives technical details on how to calculate the normalized primary matrix (NPM) needed for
conversion to and from the CIE XYZ colour space and the BT.2100 colour space.

2 Reference levels and signal format
During set-up, camera controls such as gain and shutter and others may be pre-adjusted to make best
use of camera sensor capabilities, i.e. a balance between signal to noise ratio (SNR) and achieved
Rep. ITU-R BT.2408-4 5

sensor peak capability, and to establish a creative intent. During capture, the exposure may then be
adjusted taking consideration of the reference levels listed below as well as the creative intent.

2.1 HDR Reference White
The reference level, HDR Reference White, is defined in this Report as the nominal signal level
obtained from an HDR camera and a 100% reflectance white card resulting in a nominal luminance
of 203 cd/m2 on a PQ display or on an HLG display that has a nominal peak luminance capability of
1 000 cd/m2. That is the signal level that would result from a 100% Lambertian reflector placed at the
centre of interest within a scene under controlled lighting, commonly referred to as diffuse white 1.
There may be brighter whites captured by the camera that are not at the centre of interest, and may
therefore be brighter than the HDR Reference White.
Graphics White is defined within the scope of this Report as the equivalent in the graphics domain of
a 100% reflectance white card: the signal level of a flat, white element without any specular highlights
within a graphic element. It therefore has the same signal level as HDR Reference White, and graphics
should be inserted based on this level.
The nominal signal level corresponding to HDR Reference White, diffuse white and Graphics White
is shown in Table 1.
Signal levels for common test charts and reflectance cards with different reflectances are calculated
using scene-light (the light falling on a camera sensor), from HDR Reference White. Details are given
in § 2.2.

2.2 Signal levels for line-up in production
Signal levels in these operational practices are specified in terms of %PQ and %HLG. These
percentages represent signal values that lie between the minimum and maximum non-linear values
normalized to the range 0 to 1.
The values in Table 1 are presented as nominal recommendations for test charts and graphics for PQ
production and for HLG production on a 1 000 cd/m 2 (nominal peak luminance) display, under
controlled studio lighting2. For PQ, the nominal luminance values are consistent on PQ reference
displays. For HLG, the nominal luminance values will differ from those in Table 1 when the display’s
peak luminance is lower or higher than 1 000 cd/m 2. The nominal signal levels in Table 1 do not
change. There is a practical benefit to the use of common levels for both PQ and HLG and Table 1
reflects guidance to use common levels. However, as PQ and HLG have different capabilities, and as
HLG levels are influenced by a desire to maintain a degree of compatibility with SDR displays and
PQ levels are not, as experience is developed in the use of both PQ and HLG this guidance to use
common levels may need to be adjusted. Annex 1 describes a study of early HDR movies graded on
a 4 000 cd/m2 PQ monitor. According to that study, luminance levels for indoor scenes were found
to be typically about two thirds of the values indicated in Table 1, however those for outdoor scenes
were found to be brighter. As producers of PQ content gain more experience, it is possible that levels
in PQ indoor content may increase.

1 Diffuse white is the white provided by a card that approximates to a perfect reflecting diffuser by being
 spectrally grey, not just colorimetrically grey, by minimizing specular highlights and minimizing spectral
 power absorptance. A “perfect reflecting diffuser” is defined as an “ideal isotropic, nonfluorescent diffuser
 with a spectral radiance factor equal to unity at each wavelength of interest”.
2 The test chart should be illuminated by forward lights and the camera should shoot the chart from a non-
 specular direction.
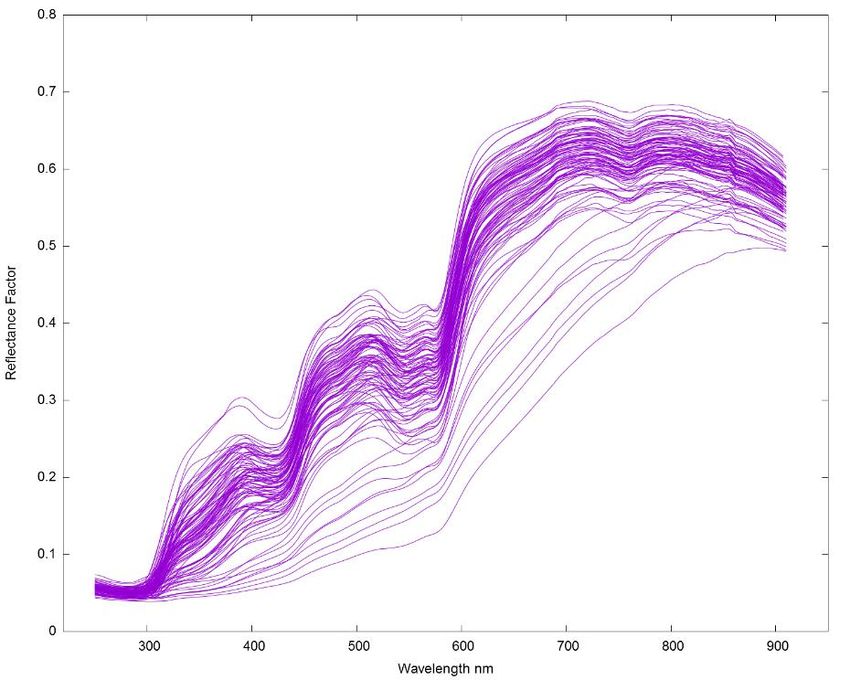
6 Rep. ITU-R BT.2408-4

It is important to know the reflectance of greyscale charts and white cards, to ensure that cameras are
aligned to deliver the appropriate signal level and consistency in production.
An 18% grey card is commonly used for camera set-up in non-live workflows as it is the closest
standard reflectance card to skin tones. It may also be useful when trying to match SDR and HDR
cameras as the 18% grey should not be affected by any SDR camera “knee”.
A 75%HLG or 58%PQ marker on a waveform monitor, representing the reference level, will help the
camera shader ensure that objects placed at the centre of interest within a scene are placed within the
appropriate signal range, and that sufficient headroom is reserved for specular highlights.

 TABLE 1
 Nominal levels for PQ and HLG production
 Nominal luminance, Nominal signal level
 cd/m2
 Reflectance object or reference
 (for a PQ reference
 (luminance factor, %)3 %PQ %HLG
 display, or a 1 000 cd/m2
 HLG display)
 Grey Card (18%) 26 38 38
 Greyscale Chart Max (83%) 162 56 71
 Greyscale Chart Max (90%) 179 57 73
 Reference Level: HDR Reference White
 203 58 75
 (100%) also diffuse white and Graphics White
 NOTE – The signal level of “HDR Reference White” is not directly related to the signal level of SDR
 “peak white”.

In an experiment described in full in Annex 2, the levels of white objects in different types of HDR
content were assessed, including an early live shoot of a baseball game, as well as a collection of
HDR still photographs. In both cases, the mean white level is consistent with the HDR Reference
White level as given in Table 1. However, for both types of content the spread around this mean value
is significant, indicating that in practice the measured white levels can be expected to vary
significantly around this target value.
When test charts are either not available or impractical, other objects such as skin tones or grass are
often used to set signal levels. Approximate signal levels are given in Table 2.
The Fitzpatrick Skin Tone Scale [1] is used to classify skin types, which will vary by region. It was
originally developed as a way to estimate the response of different types of skin to ultraviolet light.
It may be used to provide a convenient classification method for the range of skin tones seen in
television production.
Annex 3 describes how both experimental data, and a theoretical model of an ideal HDR television
camera, have been used to determine the expected signal ranges for the Fitzpatrick skin types
illustrated in Table 2. These ranges assume that content has been produced using the HDR Reference
White signal levels specified in Table 1.
Annexes 1 and 4 report on skin tones in broadcast SDR content produced in studios in different
regions. The skin tones in SDR content were found to be much different by regions. This may be

3 “Luminance factor” is the ratio of the luminance of the surface element in the given direction to the
 luminance of a perfect reflecting or transmitting diffuser identically illuminated.
Rep. ITU-R BT.2408-4 7

mainly due to a difference in long-standing production practice for SDR rather than a difference in
skin reflectance. Annex 4 also reports on a study on skin tones in HLG HDR content with camera
shading compliant to the reference level of 75%HLG in comparison with SDR content, both produced
independently for the same programme. The facial skin tones in the HLG content correspond to the
Type 3-4 (medium skin tone) in Table 2.
Variations in these signal levels can be expected. The value for grass, for example, will depend on
the type of grass planted for a given sport. Creatives making programme content may choose to
encode content at differing levels, i.e. a dark indoor drama may put a grey card (and thus skin tones)
at a lower level than shown in Table 1. Also, some productions may employ higher/brighter levels
for outdoor scenes or for dramatic effect.
As with the values for HDR Reference White, the nominal luminance values for PQ are the same on
a PQ reference display, whereas the nominal luminance values vary for HLG depending on the
display’s peak luminance. Table 2 gives values for an HLG display with 1 000 cd/m 2 nominal peak
luminance. The nominal signal levels do not change.

 TABLE 2
 Preliminary levels for common objects in PQ and HLG production
 Nominal Luminance, cd/m2 Signal level
 (for a PQ reference display,
 Reflectance object
 or a 1 000 cd/m2 HLG %PQ %HLG
 display)
 Skin Tones (Fitzpatrick Scale)
 Type 1-2 Light skin tone4 65-110 45-55 55-65
 Type 3-4 Medium skin tone 40-85 40-50 45-60
 4
 Type 5-6 Dark skin tone 10-40 30-40 25-45
 Grass 30-65 40-45 40-55

2.3 Bit depth
High quality HDR programmes can be produced using conventional 10-bit infrastructure and 10-bit
production codecs, with similar bitrates used for standard dynamic range production.
The use of 12-bit production systems will, however, give greater headroom for downstream signal
processing for both PQ and HLG.

2.4 Signal range
Recommendation ITU-R BT.2100 specifies two different signal representations, “narrow” and “full”.
Narrow range signal representations are traditionally used for television programme production. They
provide headroom above the code value of the nominal peak (where the signal E′ > 1.0) and below
zero light (where the signal E′ < 0.0) to accommodate signal overshoots and undershoots. Signals
above the nominal peak are often termed “super-whites” and those below zero light termed “sub-
blacks”, although they need not be achromatic signals. Full range signal representations are more
common in cinematic workflows. The movie industry has traditionally followed the computer

4 Experimental data for Type 1, Type 5 and Type 6 skin types is limited. So there is less certainty on the
 signal ranges for these skin types.
8 Rep. ITU-R BT.2408-4

graphics industry and placed zero light at digital code value “0”, and the code value of the nominal
peak at the maximum code value for the given bit-depth. Full range signals do not, therefore, provide
any headroom for signal overshoots or undershoots.
Signal overshoots and undershoots are produced by video processing techniques such as image re-
sizing, filtering and compression, that are common in television production workflows. Overshoots
and undershoots may also be present in the SDR signal after HDR to SDR down-mapping,
particularly if the SDR super-white signal range is used to accommodate some of the highlights from
the HDR source (see § 7.3.4). In order to maintain image fidelity, it is important that such overshoots
and undershoots are not clipped. Any signal clipping introduces harmonic distortion, which makes
the task of subsequent video compression or filtering even harder. Full range signals, which cannot
accommodate signal overshoots and signal undershoots, are thus generally avoided in broadcasting
systems. Furthermore, the black level of a display to represent an HLG signal should be adjusted
using the Recommendation ITU-R BT.814 PLUGE signal, which is only possible if sub-blacks are
present in the signal. Where HLG is used for programme production and exchange the full range
signal representation should not be used.
The full range representation for PQ signals may, however, be useful as it provides an incremental
advantage against visibility of banding/contouring and for processing. Furthermore, because the range
of PQ is so large, it is rare for content to contain pixel values near the extremes of the range. Signal
overshoots are therefore less likely to exist. It should be noted that full range signals may not be
supported by broadcast distribution systems. For broadcast contribution, programme exchange or
distribution, the full range signal representation of PQ should be used only when all parties agree. In
the absence of such agreement, any PQ full range signals should be mapped to narrow range.

2.5 Colour representation
Recommendation ITU-R BT.2100 describes two luminance and colour difference signal
representations, suitable for colour sub-sampling and/or source coding: the non-constant luminance
Y′C′BC′R signal format and the constant intensity ICTCP format.
As the ICTCP signal format is not compatible with conventional SDR monitors, and any benefits of
the ICTCP colour representation are anticipated to be less for HLG than for PQ, so the non-constant
luminance Y′C′BC′R signal format is preferred for HLG.
For PQ, the ICTCP format has been shown to be advantageous in a number of respects (see Report
ITU-R BT.2390), but compatibility with signal handling equipment must be considered before
choosing to employ this format.

3 Monitoring
Ideally, critical monitoring, such as the production switcher’s “programme” and “preview” outputs,
should take place using a display that supports the full colour gamut and dynamic range of the signals.
Monitors that support the BT.2100 colour space should include means to manage colours outside of
their native display gamut.

3.1 Display of PQ signals
The content represented by PQ signals may be limited to the expected capabilities of the displays on
which they are intended to be viewed, or they may be unlimited and represent the full level of
highlights captured by the camera. In practice, monitors may not reach the full extent of the BT.2100
gamut or the 10 000 cd/m2 limit of the PQ signal, resulting in the possibility that some encoded
colours may not be displayable on some monitors.
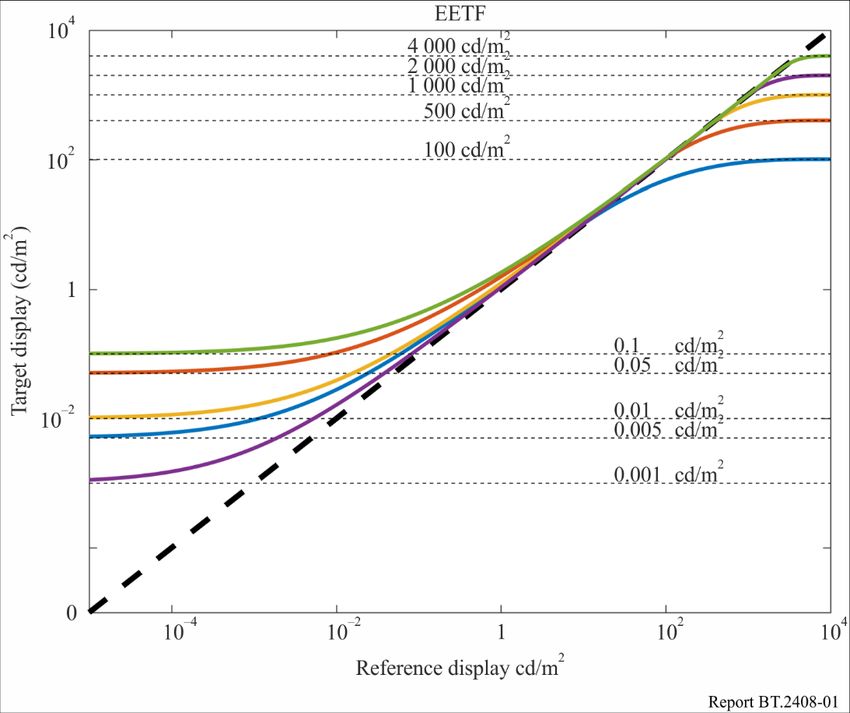
Rep. ITU-R BT.2408-4 9

Monitors that support PQ may or may not include tone-mapping to bring very high brightness signals
down to the capability of that monitor. Some monitors may clip at their peak output capability (e.g.
2 000 cd/m2). Some monitors may contain tone mapping that provides a soft-clip.
For production use, monitors should generally perform a hard clip to the display capabilities, and
should provide a means to identify pixels that are outside the display’s capability (either in brightness
or colour). If a soft-clip is desired, a Look-up-table (LUT) such as that described in § 3.1.1 can be
applied to the signal to provide any desired tone mapping. Care should be taken for any content that
is allowed to go outside the reference monitor colour gamut or dynamic range as that would not have
been accurately presented to the operator and cannot be trusted as part of the approved or intended
appearance. Reference monitors could provide a selectable overall brightness-attenuation in order to
temporarily bring high brightness signals down to be within the display capability in order to provide
a check on any content encoded brighter than the capability of the reference display.
If the BT.2100 PQ signal is presented to a monitor that expects a Recommendation ITU-R BT.709
(BT.709) input, the image will appear dim and washed out; colours will be desaturated and there will
be some hue shifts. An external 3D LUT can provide the down-mapping function necessary to bring
both colour and brightness into the BT.709 colour volume, thus allowing satisfactory display on the
BT.709 monitor. Some monitors may provide this function by means of an internally provided 3D
LUT. While this allows viewing on the BT.709 monitor, the resulting images should not be used to
make critical judgements of the HDR production.
If PQ signals must be monitored in an environment brighter than the reference environment (specified
in Recommendation ITU-R BT.2100 as having a 5 cd/m2 surround), manufacturers may provide
modified brightness and display characteristics intended to compensate for the different viewing
environment.
3.1.1 Mapping to displays with limited luminance range
To view the entire range of HDR content on displays with a lower dynamic range, display mapping
should be performed. This can take the form of an EETF (electrical-electrical transfer function) in the
display. This function provides a toe and knee to gracefully roll off the highlights and shadows
providing a balance between preserving the artistic intent and maintaining details. Figure 1 is an
example EETF mapping from the full 0 – 10 000 cd/m2 dynamic range to various target displays.
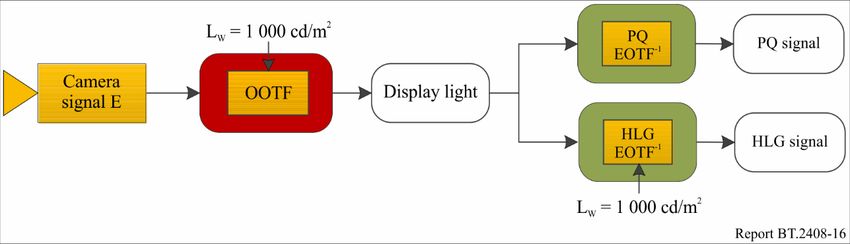
10 Rep. ITU-R BT.2408-4

 FIGURE 1
 Example EETF from 0 – 10 000 cd/m2 to various target displays

Annex 5 gives the specific mathematical steps to implement this tone mapping function for displays
of various black and white luminance levels. Figure 2 shows the block diagram of where the EETF
should be applied.

 FIGURE 2
 Block diagram of signal chain showing location of EETF application

3.2 Display of HLG signals
Table 5 of Recommendation ITU-R BT.2100 specifies the HLG EOTF (electro-optical transfer
function) for reference displays. Note 5f specifies how the display’s gamma is adjusted to compensate
for changes in the response of the human visual system as the eye adapts, when using HLG displays
of different peak luminance. The gamma adjustment allows consistent signals to be produced from a
range of displays with different peak luminance. Details can be found in § 6.2 of Report ITU-R
BT.2390.
The luminance on a production monitor corresponding to nominal peak, 100%, signal level, should
be adjusted to a comfortable level for the viewing environment. Nominal peak signal level does not
have to be set to the peak luminance of the monitor, which may be too bright for comfortable viewing.
The nominal peak luminance of 1 000 cd/m2, identified in Recommendation ITU-R BT.2100, has
been found to work well in typical production environments.
Rep. ITU-R BT.2408-4 11

Note 5g of Recommendation ITU-R BT.2100 recognises that the display’s gamma should further be
adjusted to compensate for the adaptation state of the eye in non-reference production environments.
A formula specifying the gamma adjustment is also given in § 6.2 of Report ITU-R BT.2390.
Contrast, brightness and display system gamma (α, β and γ in Table 5 of Recommendation ITU-R
BT.2100) are adjusted according to the viewing environment and nominal peak luminance of the
display, as appropriate.
Firstly, the monitor gamma is adjusted, according to the formula in Note 5f of Recommendation
ITU-R BT.2100, to the appropriate value for the target nominal peak luminance of the display. The
target nominal peak luminance may depend on the viewing environment.
Table 3 shows the gamma values for a range of typical production monitors in the reference viewing
environment (5 cd/m2 surround).

 TABLE 3
 HLG display gamma
 Nominal peak
 Display Gamma
 luminance (cd/m2)
 400 1.03
 600 1.11
 800 1.16
 1 000 1.20
 1 500 1.27
 2 000 1.33

The display’s nominal peak luminance is then adjusted using the user gain control (legacy “contrast”
control) and a photometer, with an HDR reference white (75%HLG) window test patch (typically 1%
screen area). Table 4 shows the luminance levels for a range of typical production monitors.

 TABLE 4
 Test patch luminance levels for different nominal peak displays
 Nominal peak luminance HDR reference white
 (cd/m2) (cd/m2)
 400 101
 600 138
 800 172
 1 000 203
 1 500 276
 2 000 343

In non-reference viewing environments, a further adjustment should be made to the display’s system
gamma to compensate for the adaptation state of the eye. Table 5 illustrates the recommended gamma
adjustments for a range of common production environments, assuming a surround reflectance of
approximately 60%, typical of light coloured walls. However, for the greatest signal consistency, the
reference conditions specified in Recommendation ITU-R BT.2100 should be used.
12 Rep. ITU-R BT.2408-4

 TABLE 5
 Typical production environments with different surround conditions
 Typical Illumination5 Typical luminance6 Typical gamma
 Typical environment
 (Lux) (cd/m2) adjustment
 Office based production sunny day 130 25 −0.05
 Office based production cloudy day 75 15 −0.04
 Edit Suite 50 10 −0.02
 Grading Suite 25 5 0.00
 Production gallery/
 3 0.5 +0.08
 Dark grading suite

As a guide, a gamma adjustment of 0.03 is just visible to the expert viewer when viewed side-by-
side. Thus, no additional gamma adjustment is necessary across the majority of critical television
production environments.
However, a gamma adjustment is suggested for bright environments such as those sometimes used
for news production, or where a colourist prefers to work in a very dark environment.
Lastly, the display black level is adjusted using the black level lift control (legacy “brightness”
control) and the Recommendation ITU-R BT.814 PLUGE signal, such that the negative stripes on
the test pattern disappear, whilst the positive stripes remain visible.
3.2.1 Display of HLG signals on SDR screens
For best results when displaying HLG signals on SDR screens, the SDR monitor should support the
Recommendation ITU-R BT.2020 (BT.2020) colour gamut. However, for simple confirmation of the
presence or absence of a signal, BT.709 colour monitoring may be sufficient. However, BT.709
colour monitors will show a de-saturated image with visible hue shifts.
Non-critical production monitors, such as multi-view production monitors, may be SDR BT.709
displays. A three-dimensional look-up table (3D-LUT) may be included in the monitoring chain to
down-convert from BT.2100 HDR signals to BT.709 SDR, minimising colour distortions on such
displays. Suitable look-up tables are often included within the display monitors themselves.

4 Image brightness
Work has commenced on developing automatic objective measures for brightness, akin to those in
common use for audio loudness today. Experimental results [2] show that a simple mean of displayed
pixel luminances provides a good correlation with subjective brightness at 3.2 picture heights from
the screen. The effectiveness of this simple objective metric suggests that real-time brightness
monitoring in production is a realistic goal. This would give guidance to content producers, enabling
comfortable viewing in the home, whilst allowing a range for artistic freedom. The metric could be
used further to characterise long-term and short-term average brightness.

5 Measured perpendicular to the screen.
6 Assuming ~ 60% reflectance surround.
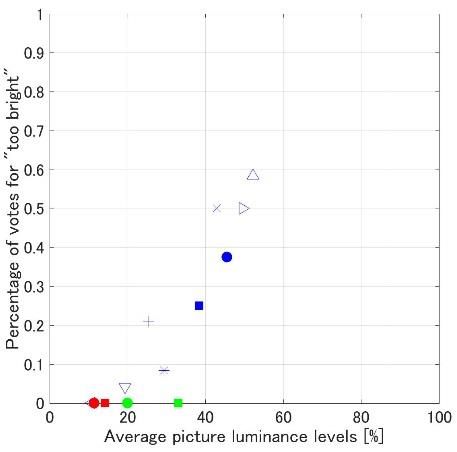
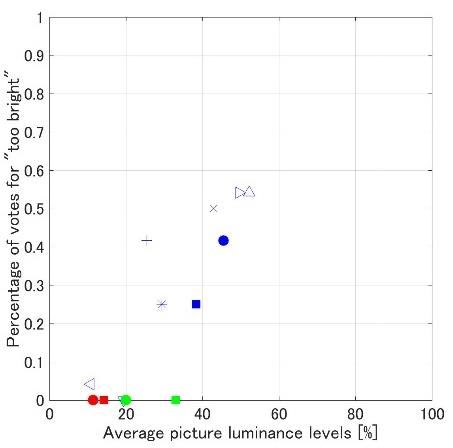
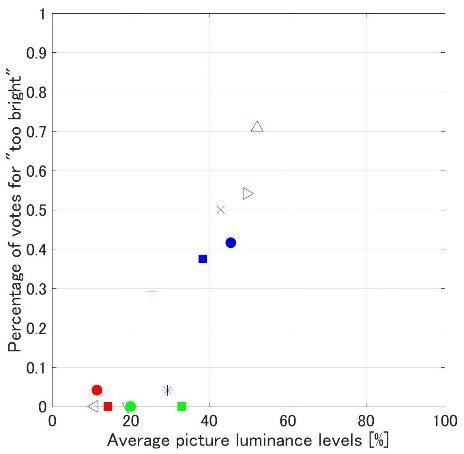
Rep. ITU-R BT.2408-4 13

4.1 Comfortable brightness of static images
A study was performed by NHK to learn what range of luminances are judged comfortable by
viewers. A number of SDR images that, on a 100 cd/m 2 reference monitor, varied in average
luminance over a range of 10-50 cd/m2, were used. The study was conducted using a relative display
system that employed a 3 500 cd/m 2 display that was adjusted to simulate a range of display
luminance levels, thus the results are relevant to the HLG system that also employs displays with
relative luminance. Peak luminances of 500, 1 000, 2 000, and 2 500 cd/m2 were simulated. Viewers
were asked to judge whether images were “appropriate”, “too bright”, or “too dark”.
Figure 3 shows the results in the reference viewing environment (dim surround). For each simulated
display peak luminance, images with average luminance less than 25% of the peak luminance being
simulated were not judged as “too bright”. Images with average luminance greater than 25% of peak
luminance began to be judged as “too bright” by many viewers. The judgements were essentially
independent of the peak luminance being simulated on the display; this indicates that viewers’ eyes
were adapting to the different display luminances. The implication of these results is that HLG images
with average luminance of less than 250 cd/m2 on a 1 000 cd/m2 HLG monitor, would not be judged
as too bright on an HLG monitor of any luminance up to at least 2 500 cd/m 2.

 FIGURE 3
 Percentage of votes for “too bright” in the reference environment (dim surround)
 Peak luminance 500 cd/m2 Peak luminance 1 000 cd/m2

 Peak luminance 2 000 cd/m2 Peak luminance 2 500 cd/m2

This is consistent with informal comments from subjects in separate tests performed by the BBC,
which were targeted at measuring tolerance to brightness jumps (see § 4.2). Having seen HDR video
sequences on HLG displays with peak luminance levels of 1 000 cd/m 2 and 4 000 cd/m2, 25% of
14 Rep. ITU-R BT.2408-4

subjects commented informally that the brightest scenes were uncomfortably bright regardless of any
jumps. These scenes had average luminance levels of 268 and 363 cd/m 2 on a 1 000 cd/m2 display.
Similar comments were not made about the test scenes that had average luminances of 144 and
128 cd/m2 on a 1 000 cd/m2 display.
Even when the static levels would be acceptable, sudden changes in brightness can be uncomfortable
even when the static levels would be acceptable, so different requirements are needed to ensure viewer
comfort when brightness jumps can occur.

4.2 Tolerance to programme brightness shifts
Unexpected changes in image brightness might occur between programmes, for example with
interstitials. It is important to ensure that the brightness variations within HDR programmes are
constrained to avoid viewer discomfort.
Subjective tests reported by the BBC investigated viewer tolerance to sudden changes in overall
brightness for HDR television, using the mean pixel display luminance as a measure of brightness as
described in [2]. This measure has been shown to correlate well with subjective ratings of the overall
brightness, but there may occasionally be a scene with a non homogeneous spatial luminance
distribution where the measure does not fully correspond to subjective brightness. For the tests, the
luminance behind the screen was 5 cd/m 2, and the peak screen luminance was 1 000 cd/m2 [3].
Subjects were asked to rate the change in overall brightness between two still HDR images.
Figure 4 shows the overall results, with transitions from the first mean luminance A to the second
mean luminance B categorised according to whether they are “not annoying”, “slightly annoying”, or
“annoying”. Two regions are marked in the figure with thick blue lines. The inner region, with mean
display luminance levels of 5 to 80 cd/m2, contains only one possible “slightly annoying” jump, and
so could be considered a suitable range for operation that will not cause viewer discomfort. The outer
region, with mean display luminance levels up to 160 cd/m 2, includes several slightly annoying
jumps, and so could be considered an extended range for creative effect. Further experiments reported
by the BBC show that this outer region can be extended down to 2.5 cd/m 2, and production trials with
a prototype meter suggest that this extended range is appropriate.
Specific delivery requirements for luminance ranges are left to individual service providers,
depending on their requirements. An example of requirement could be that the suggested ranges can
be freely exceeded over a short timescale, but the mean luminance over the length of a programme is
kept within an operating range of 5 to 80 cd/m2. It should be noted that this range still allows for
significant differences in brightness between programmes, so, for example, a “moody” or “bright”
look can be achieved overall.
The results presented previously in Fig. 3 provide evidence that the eye adapts to a particular
luminance level. Hence the scene-light levels corresponding to specified brightness shift tolerances
are likely to be broadly applicable for HLG displays over a range of different peak luminances. This
is supported by experiments reported by the BBC, which suggest that the ranges are applicable for
HLG displays up to a peak luminance of 4 000 cd/m2.
It should be noted that shadow detail may be lost after a transition from a bright scene to a very dark
scene, even if the transition is not uncomfortable, because it takes time for the eyes to adapt. Also, a
comfortable overall brightness does not ensure that the content makes good use of the available
dynamic range. Further guidance may be useful to characterise best use of the dynamic range for
common scene types.
Rep. ITU-R BT.2408-4 15

 FIGURE 4
 Transitions from mean luminance A (cd/m2) to mean luminance B (cd/m2)
 categorised by level of annoyance

5 Inclusion of standard dynamic range content
Definitions
Tone Mapping (TM) – Compression of the image dynamic range of content. It may be used to “down-
map” (down-convert) HDR content to SDR content.
Inverse Tone Mapping (ITM) – Expansion of the image dynamic range of content. It may be used to
“up-map” (up-convert) SDR content to emulate the appearance of HDR content. Also referred to as
“up-mapping”.
Direct Mapping – In the context of converting SDR content to HDR content, Direct Mapping
preserves the appearance of the SDR content so that the HDR version displayed on a reference HDR
monitor will look identical to the original SDR version displayed on a reference SDR monitor. A
luminance gain (e.g. 2x) and other processing will provide a better match to the luminance of a native
HDR image while maintaining the SDR appearance.
Hard Clipping – When converting from HDR to SDR there are some circumstances when hard
clipping rather than tone mapping (akin to soft clipping) may be more appropriate. With hard clipping
all signals above a threshold are clipped to that threshold. Hard clipping is useful when the signal
from an HDR camera is required to look similar to the signal delivered by an SDR camera operated
without a “knee”.
Artistic Intent – A creative choice that the programme maker would like to preserve, primarily
conveyed through the use of colour and tone.
Look – A characteristic of the displayed image. The native appearance of colours and tones of a
particular system (for example, PQ, HLG, BT.709) as seen by the viewer.
SDR content may either be directly mapped or inverse tone mapped (up-mapped) into an HDR format
for inclusion in HDR programmes. Direct mapping places SDR content into an HDR container,
analogously to how content specified using BT.709 colorimetry may be placed in a BT.2020
container. This approach is intended to preserve the appearance of the SDR content when shown on
an HDR display. In contrast, inverse tone mapping (up-mapping) is intended to expand the content to
use more of the available HDR luminance range, and thereby leverage more of the display
capabilities. Up-mapping is intended to make content captured in SDR look more as if it had been
captured in HDR.
16 Rep. ITU-R BT.2408-4

There are two possible approaches to both SDR direct mapping and up-mapping depending on the
application:
– Display-referred mapping is used when the goal is to preserve the colours and relative tones
 seen on an SDR display, when the content is shown on an HDR display; an example of which
 is the inclusion of SDR graded content within an HDR programme. Display-referred
 mappings are derived by scaling the light reproduced by a reference display. These are known
 as “display-light” conversions.
– Scene-referred mapping is used when the goal is to match the colours and relative tones of
 an HDR and SDR camera; an example of which is the inter-mixing of SDR and HDR cameras
 within a live television production. Scene-referred mappings are based on the light falling on
 the camera sensor, but they include any camera characteristics, white balance, and any artistic
 camera adjustments. These are known as “scene-light” conversions.
The nominal signal levels described in § 2.2 may be helpful to guide mid-tone levels during mapping.

5.1 Display referred mapping
Figure 5 illustrates the display-referred mapping of SDR signals into either HLG or PQ.

 FIGURE 5
 Generic method for “display-referred” mapping of SDR into HLG or PQ

The SDR signal is first passed through the BT.1886 reference EOTF to derive SDR linear display
light. An approximation of the electro-optical transfer function (EOTF) from Recommendation
ITU-R BT.1886 may be used:
 = ( ′)2.40 , 0 ≤ ′ ≤ 1
where:
 E′ is the non-linear signal (R′, G′, B′) in the range [0:1]
 E is the normalised linear display light in the range [0:1].
A colour space conversion from BT.709 primaries to BT.2020/BT.2100 colour primaries is performed
if necessary, details of which can be found in Recommendation ITU-R BT.2087.
The linear SDR display light may then be scaled to ensure that SDR and native HDR content have a
similar level for HDR reference white. Where scaling is performed, a small optional adjustment to
the OOTF (opto-optical transfer function) may then be applied to compensate for the subjective
change in appearance of the SDR signal arising from a simple linear scaling; thereby ensuring that
the visibility of detail in the shadows is maintained and that the level of skin tones in HDR and
mapped SDR content are similar.
Rep. ITU-R BT.2408-4 17

Having scaled and adjusted the SDR display light, the resulting signal is passed through an HLG or
PQ inverse EOTF to provide either an HLG or PQ signal.
5.1.1 Display referred mapping of SDR into PQ
The following procedure may be followed to achieve consistent mid-tone luminance levels when
mapping standard dynamic range content into PQ.
Standard dynamic range BT.2020 content should be mapped to PQ by applying the BT.1886 display
EOTF and then applying the PQ EOTF-1.
 −1
 ′ = [ × .1886[ , , ]]
 : Input SDR video signal level (normalized, black at V = 0, to white at V = 1)
 : SDR screen luminance for white = 100 cd/m2
 : Screen luminance for black = 0 cd/m2
 ′ : Output PQ video signal level (normalized [0:1])
 Scaling: EOTFPQ (E′V=1) / 100 cd/m2
Example: for scaling = 2.0, E′V=1 = 0.58 and EOTFPQ (E′V=1) = 200 cd/m2

For unity mapping the peak signal of standard dynamic range content would be set to 100 cd/m2 or
51%PQ.
Unity mapping does not change the display of the SDR content (it will display on the PQ HDR
reference monitor the same as it displayed on the reference SDR monitor). Thus, no OOTF adjustment
of the SDR display light signal is necessary.
If the SDR content is being inserted into HDR programming, and there is desire to more closely match
the brightness of the HDR content, and that brightness is known, scaling can be done to bring up the
brightness of the mapped SDR content. Scaling should be performed with care lest scaled SDR
content, in particular skin tones, becomes brighter than in the HDR content.
A scaling factor of 2.0 is consistent with the HDR level guidance of § 2.2, as that will map the 100
cd/m2 peak white level of SDR to approximately the 203 cd/m 2 level suggested for HDR or 58%PQ.
Also noteworthy is that MovieLabs has recommended a scaling factor of 2.0 when converting for
consumer displays, as MovieLabs has found this to provide a good match to the way such displays
show SDR content in their “home cinema” viewing modes [4].

For standard dynamic range BT.709 content the same process may be used, with the BT.709 to
BT.2020 conversion matrix applied before the scaling as shown in Fig. 5.

5.1.2 Display referred mapping of SDR into HLG
5.1.2.1 Mapping without gamma adjustment
The ‘display-referred’ method of mapping SDR content into a Hybrid Log-Gamma (HLG) container
is illustrated below in Fig. 6.
18 Rep. ITU-R BT.2408-4

 FIGURE 6
 SDR to HLG mapping without gamma adjustment (display-referred)

5.1.2.2 Mapping with gamma adjustment
For the case when gamma adjustment is made to the scaled SDR display light, the process is shown
in Fig. 7.

 FIGURE 7
 Model for “display-referred” mapping with gamma adjustment of SDR into HLG

The linear SDR display light is scaled to ensure that 100% of the SDR signal is mapped to the HLG
reference level 75%HLG. A small gamma adjustment may then optionally be applied to the
luminance component, to compensate for the subjective change in appearance of the SDR signal
arising from a simple linear scaling of the SDR display light signal.
Having scaled and adjusted the SDR display light, the resulting signal is passed through an HLG
inverse EOTF to provide the HLG signal.
5.1.2.3 Scaling
When (100X)%SDR signal is mapped to (100Y)%HLG signal, a scaling gain is calculated by the
following equation:
 EOTFHLG (Y )
 Gain =
 EOTFSDR (X )

For example, when 100%SDR signal is mapped to 75%HLG (203 cd/m2 on a 1 000 cd/m2 display),
the scaling gain is calculated as follows:
Rep. ITU-R BT.2408-4 19

 Gain = =
 (
 EOTFHLG (0.75 ) OOTFHLG OETFHLG
 -1
 )
 (0.75 ) = 0.2651.2 = 0.203
 EOTFSDR (1.0 ) EOTFSDR (1.0 ) 1.0 2.4

5.1.2.4 Simplification of the HLG mapping process
Through careful choice of the HLG inverse EOTF parameters, it is possible to avoid the need to scale
and adjust the gamma of the SDR linear display light signal. By configuring the HLG inverse EOTF
with a nominal peak luminance, LW, of 392 cd/m2, an input of 100 cd/m2 from the SDR EOTF will
directly deliver an HLG signal of 75%, satisfying the requirement to map 100%SDR signal to
75%HLG signal, without further scaling and gamma adjustment.
Figure 8 illustrates how, for all but the most critical applications, it is possible to simplify the
conversion yet further. When applying the HLG inverse EOTF with LW set to 392 cd/m2, Note 5e of
Recommendation ITU-R BT.2100 requires a gamma value of 1.03. As this is close to unity, in most
applications there is no need to apply the inverse OOTF gamma to the luminance component, it can
instead be applied independently to R, G and B components; greatly simplifying the mapping process.
Colour distortions that usually arise through applying gamma to red, green and blue, rather than
luminance, are barely visible for such low values of gamma.

 FIGURE 8
 Simplified (display-referred) SDR to mapping into HLG

As normalised signals are used throughout, a different scaling is required to match the signal ranges
of the SDR EOTF and HDR inverse EOTF, thereby ensuring that 100%SDR signal maps to 75% of
the HLG HDR signal. Note that as the normalised signals are dimensionless, the scaler is not adjusting
the peak luminance of the SDR display light, so no additional gamma compensation for the signal
scaling is required. Allowing for the inverse OOTF gamma of 1.03, the correct scale factor is 0.2546.

5.2 Scene referred mapping
It is particularly important that the scene-referred mapping is used for matching signals from BT.709
and BT.2020 SDR cameras with signals from HLG cameras. This is because, direct from the camera
(and prior to subjective adjustment), both signals represent light from the scene captured by the
camera.
If the display-referred mapping were used, which maintains the appearance of SDR images on an
HLG display, the signals from SDR cameras and HLG cameras would not match. This is because the
displayed ‘look’ of SDR and HLG images, from cameras that implement the reference OETFs (opto-
electronic transfer functions), is different (see § 7.3.3 and Annex 6).
Scene-referred mapping will also work for mapping SDR to PQ. However, because the ‘look’ of PQ
and BT.2020 SDR signals is very similar, for BT.2020 SDR signals the display-referred mapping will
20 Rep. ITU-R BT.2408-4

generally work well. To best match the PQ ‘look’, BT.709 SDR camera signals could be converted
to BT.2020 SDR camera signals (using an OETF-based conversion similar to that specified in
Recommendation ITU-R BT.2087) before display-referred mapping is applied.
The schematic diagram of the scene-referred mapping is illustrated in Fig. 9 for both PQ and HLG. It
includes an optional artistic OOTF adjustment, for example to match the ‘traditional colour
reproduction’ described in § 6.5 of Report ITU-R BT.2390.

 FIGURE 9
 SDR to HDR mapping (scene-referred)

Figure 9 above shows how the non-linear SDR BT.709 or BT.2020 video signal is converted to linear
‘scene light’ by applying the approximate inverse of SDR OETF, =( ′)2, as described in BT.2087.
When the SDR source is with the BT.709 colorimetry, the conversion is followed by the colour
conversion matrix as described in Recommendation ITU-R BT.2087.
The scene light signal is then scaled so that the non-linear signal, after applying the reference PQ or
HLG OETF, is at the appropriate signal level for HDR reference white: 58%PQ or 75%HLG
respectively. Following any OOTF adjustment, the HLG or PQ OETFs are applied to derive the
non-linear signals.
Section 5.2.1 describes how to calculate the scale factor for HLG, as well as how to adjust the OOTF
to preserve a traditional SDR look.
5.2.1 Scene referred mapping of SDR into HLG
When (100X)%SDR signal is mapped to (100Y)%HLG signal, a scaling gain is calculated by the
following equation:

 Gain =
 -1
 OETFHLG (Y )
 OETFSDR (X )
 -1

For example, when 100%SDR signal is mapped to 75%HLG signal, the scaling gain is calculated as
follows:

 Gain =
 -1
 OETFHLG (0.75 ) = 0.265 = 0.265
 OETFSDR (1.0 ) 1.0 2.0
 -1

Where the SDR “look” is maintained during the conversion from SDR to HDR or the HLG camera
is designed to deliver a traditional ‘look’ (see § 6.5 of Report ITU-R BT.2390), a small optional
adjustment to the OOTF may then be applied to compensate for the subjective change in appearance
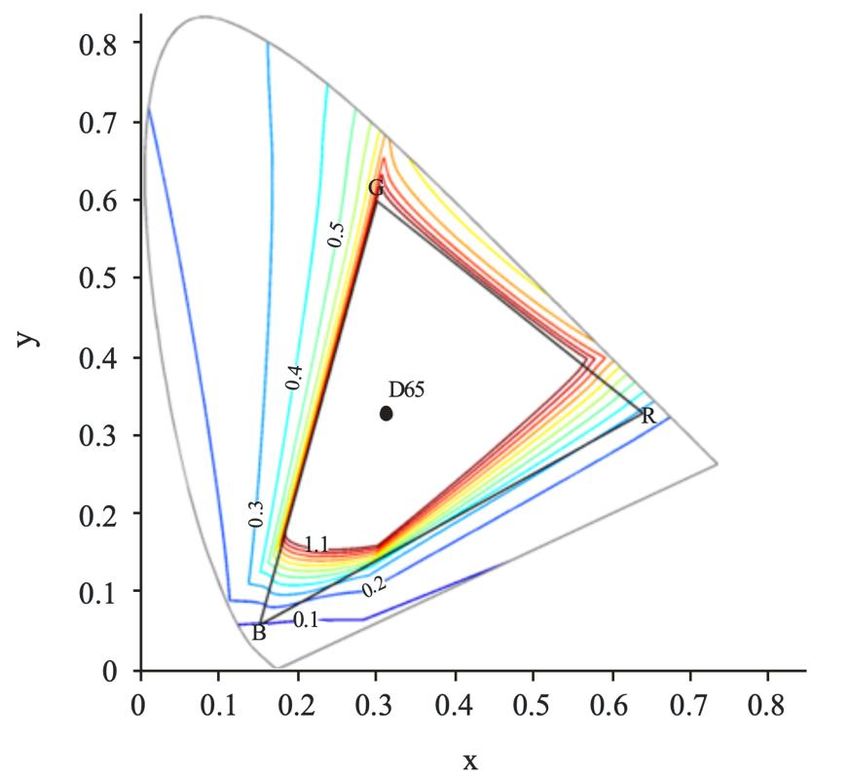
Rep. ITU-R BT.2408-4 21

of the SDR signal arising from a difference between HLG and SDR OOTFs. For the case when
gamma adjustment is made to the scaled SDR scene light, the process is illustrated in Fig. 10.

 FIGURE 10
 SDR to HLG mapping with gamma adjustment (scene-referred)

5.3 Handling negative values in format conversion
It is common practice for camera OETFs and display EOTFs implemented within format converters
to be extended to handle negative signals by reflecting the transfer functions around the zero light
and zero signal axes. Extending the transfer functions in this way can be useful for increasing the
colour gamut carried by a “narrow” range signal (see § 5.4) and for processing test signals such as
PLUGE.
In format conversion, however, this could lead to an increase in “round-trip” errors. So the best
approach will depend on the application.

5.4 Adjustments to BT.709 cameras
It may be beneficial to include signals below black (sub-blacks) and above the SDR nominal peak
white (super-whites) in the conversion process from SDR BT.709 to HDR. Such signals, which are
often present in live SDR television production, effectively increase the colour gamut captured by the
camera beyond the BT.709 colour primaries. More details are provided in Report ITU-R BT.2250.
The permitted SDR signal ranges vary between geographical regions. By way of an example, EBU
R103 [5] allows SDR signals to span −5% to +105%. Figure 11 illustrates the maximum transmissible
Y′C′BC′R colour gamut. The contours are drawn for each normalized Y at an interval of 0.1 on the
CIE 1931 xy chromaticity diagram. Negative values of R′, G′ and B′ widen the effective colour
primaries. The gamut is increased in the red and the blue, and a smaller increase is also made in the
green. Allowing the R′G′B′ signals to extend above 100% increases the colour volume by allowing
more saturated colours at higher luminance.
22 Rep. ITU-R BT.2408-4

 FIGURE 11
 Extending the BT.709 camera colour gamut

The technique can be used to ensure a closer match between BT.709 and BT.2100 cameras for colours
that are close to the BT.709 colour volume boundary.
Where the SDR BT.709 camera output is only used for shading and as the input to an SDR to HDR
format converter, the signal clippers can be fully relaxed to maximise the captured colour volume.
Not all format converters and production infrastructure are capable of passing the sub-black and
super-white signals.

5.5 Use of 8-bit content
Although a minimum of 10-bits should be used for HDR production, there may be occasions when it
might not be possible to avoid including 8-bit SDR content within an HDR programme. In such cases,
care should be taken if up-mapping rather than direct mapping is used to place the content into an
HDR signal container. The up-mapping process typically expands the SDR highlights. The 8-bit
resolution, compounded by any 8-bit video compression, will limit the amount of highlight expansion
that can be applied before banding and other artefacts become visible.

5.6 Mapping of SDR graphics
SDR graphics should be directly mapped into the HDR signal at the “Graphics White” signal level
specified in Table 1 (75%HLG or 58%PQ) to avoid them appearing too bright, and thus making the
underlying video appear dull in comparison. Where the desire is to maintain the colour branding of
the SDR graphics, a display-light mapping should be used. Where the desire is to match signage
within the captured scene (in-vision signage; e.g. a score board at a sporting event), a scene-light
mapping is usually preferred.
You can also read