A Toad More Traveled: The Heterogeneous Invasion Dynamics of Cane Toads in Australia
←
→
Page content transcription
If your browser does not render page correctly, please read the page content below
vol. 171, no. 3    the american naturalist              march 2008

E-Article

A Toad More Traveled: The Heterogeneous Invasion Dynamics
                of Cane Toads in Australia

Mark C. Urban,1,* Ben L. Phillips,2 David K. Skelly,3 and Richard Shine2

1. National Center for Ecological Analysis and Synthesis, Santa            Keywords: range models, dispersal evolution, niche expansion, in-
Barbara, California 93101;                                                 vasion biology.
2. School of Biological Sciences A08, University of Sydney, Sydney,
New South Wales 2006, Australia;
3. School of Forestry and Environmental Studies, Department of             Invasive species pose critical threats to native biological
Ecology and Evolutionary Biology, Yale University, New Haven,              diversity and impose a substantial financial burden on
Connecticut 06511
                                                                           economies throughout the world (Wilcove et al. 1998; Pi-
Submitted March 24, 2007; Accepted October 8, 2007;                        mentel et al. 2005). Despite the global significance of in-
Electronically published January 17, 2008                                  vasive species, our ability to predict their spread remains
                                                                           limited (Holt et al. 2005). Improved understanding of the
                                                                           mechanisms underlying rates of range expansion by in-
                                                                           troduced species can serve to clarify why some species
                                                                           spread rapidly across novel environments while others only
abstract: To predict the spread of invasive species, we need to
                                                                           incrementally expand their range or fail to spread at all.
understand the mechanisms that underlie their range expansion. As-
                                                                           In this way, invasive species offer a window into the general
suming random diffusion through homogeneous environments, in-
vasions are expected to progress at a constant rate. However, envi-        mechanisms that underlie the range dynamics of all species
ronmental heterogeneity is expected to alter diffusion rates, especially   (Elton 1958; Holt et al. 2005), a topic of clear relevance
by slowing invasions as populations encounter suboptimal environ-          as species shift their ranges because of climate change (Par-
mental conditions. Here, we examine how environmental and land-            mesan 2006). Here, we use data from one of the best-
scape factors affect the local invasion speeds of cane toads (Chaunus      documented invasions in natural history, the cane toad’s
[Bufo] marinus) in Australia. Using high-resolution cane toad data,        (Chaunus [Bufo] marinus) continuing colonization of Aus-
we demonstrate heterogeneous regional invasion dynamics that in-           tralia, to evaluate regional heterogeneities in the speed of
clude both decelerating and accelerating range expansions. Toad in-
                                                                           its range expansion and then to relate these patterns to
vasion speed increased in regions characterized by high temperatures,
                                                                           environmental variation.
heterogeneous topography, low elevations, dense road networks, and
high patch connectivity. Regional increases in the toad invasion rate         Historically, invasion has been modeled as a simple
might be caused by environmental conditions that facilitate toad           random-diffusion process. Assuming random and local-
reproduction and movement, by the evolution of long-distance dis-          ized dispersal through homogeneous environments, the
persal ability, or by some combination of these factors. In any case,      radial (area1/2) range of an invading species is expected to
theoretical predictions that neglect environmental influences on dis-      increase linearly with time (Fisher 1937; Skellam 1951).
persal at multiple spatial scales may prove to be inaccurate. Early        In many cases, such as the muskrat in Europe (Skellam
predictions of cane toad range expansion rates that assumed constant       1951), the sea otter in California (Lubina and Levin 1988),
diffusion across homogeneous landscapes already have been proved
                                                                           and the coypu in Great Britain (Reeves and Usher 1989),
wrong. Future attempts to predict range dynamics for invasive species
                                                                           predictions based on linear diffusion perform well. How-
should consider heterogeneity in (1) the environmental factors that
determine dispersal rates and (2) the mobility of invasive populations     ever, in other cases, accelerating invasion dynamics have
because dispersal-relevant traits can evolve in exotic habitats. As an     been described (Andow et al. 1990; Shigesada et al. 1995;
invasive species spreads, it is likely to encounter conditions that        Silva et al. 2002; Liebhold and Tobin 2006). Accelerating
influence dispersal rates via one or both of these mechanisms.             range expansions often are attributed to a nonzero prob-
                                                                           ability of long-distance dispersal that generates a “fat-
* Corresponding author; e-mail: urban@nceas.ucsb.edu.                      tailed” dispersal kernel (where the dispersal kernel is the
Am. Nat. 2008. Vol. 171, pp. E134–E148. 䉷 2008 by The University of
                                                                           probability density function describing the displacement
Chicago. 0003-0147/2008/17103-42488$15.00. All rights reserved.            of individuals from a point over time; Kot et al. 1996;
DOI: 10.1086/527494                                                        Caswell et al. 2003; Clark et al. 2003). Fat-tailed dispersal

                                          This content downloaded from 137.111.013.200 on June 30, 2019 20:29:53 PM
                        All use subject to University of Chicago Press Terms and Conditions (http://www.journals.uchicago.edu/t-and-c).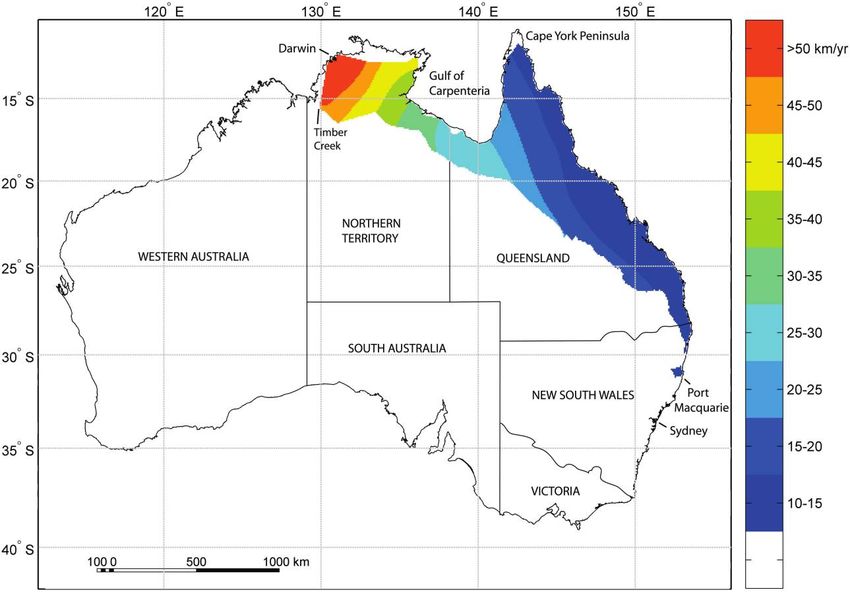
Toad Invasion Dynamics         E135

kernels can lead to a rapid acceleration of invasion dy-              al. [2005]), rarely have ecological and landscape variables
namics as long-distance dispersers form multiple satellite            been linked explicitly with observed invasion rates. The
populations that then coalesce into an ever-widening range            few attempts at evaluating the relationship between local
(Shigesada et al. 1995).                                              invasion speed and environmental heterogeneity have gen-
   An alternative and perhaps complementary reason for                erally been limited to assessments of expansions across
accelerating or decelerating invasion patterns involves the           separate geographic regions (e.g., regions with either high
effect of environmental conditions on a species’ movement             or low minimum temperatures; Liebhold et al. 1992), in-
and demography. Underlying landscape heterogeneity in                 direct analyses of the probability of patch colonization over
factors such as climate, resources, or habitat connectivity           time (Silva et al. 2002; Smith et al. 2002), or a post hoc
may give rise to strongly differing expansion rates across            explanation for divergent invasion rates along two tran-
space (Lubina and Levin 1988; Grosholz 1996; Smith et                 sects (Lubina and Levin 1988). Few studies have analyzed
al. 2002). These differing expansion rates can occur simply           the environmental determinants of invasion speed because
because species-specific movement behavior or fitness co-             such analyses require large data sets that document in-
varies with the underlying environment and landscape ma-              vasions over a long enough time period to allow for ac-
trix (With 2002). In such cases, separate regions of the              curate estimates of speed and acceleration. Fortuitously,
invasion will likely be characterized by different dynamics           concern for the effect of cane toads on native Australian
(e.g., linear, decelerating, or accelerating). In addition, we        wildlife has prompted an expansive and enduring effort
can expect that as an organism realizes the spatial limits            to catalog its spread. This attention has resulted in the
of its niche, suboptimal environments will curb the for-              documentation of cane toad invasion dynamics by 1,911
ward progress of an invasion and demarcate a stable range             unique spatially and temporally referenced occurrence rec-
boundary (Shigesada et al. 1995; Wangen and Webster                   ords beginning with their introduction and continuing to
2006).                                                                the present. We used this data set to examine patterns of
   Thus far, most proposed mechanisms of variable range               range expansion through time in populations of the in-
expansion have been based on the assumption that the                  vasive cane toad to evaluate their rates of spread into di-
dispersal kernel or the environmental dependence of the               verse geographic and climatic regions within Australia.
dispersal kernel remains constant over time and space (re-               Cane toads are considered to be one of the world’s worst
viewed by Hastings et al. [2005]). This assumption of ker-            invasive species, reflecting their multiple introductions to
nel constancy is likely to be violated when evolution mod-            islands and continents (from the Caribbean Sea to the
ifies either the kernel or its relationship to environmental          Indian Ocean) and their deleterious effects on local wildlife
variables. Such evolution can occur when landscape het-               (IUCN 2001; Lever 2001; Phillips and Shine 2004). Since
erogeneity creates regions of variable natural selection and          their introduction along a 1,200-km stretch of the north-
lowered gene flow. Under these circumstances, natural se-             eastern Australian coast in 1935–1937, cane toads have
lection may change dispersal rates across an invasive spe-            expanded their range to more than 1.2 million km2 of
cies’ expanding range in response to local environmental              northeastern Australia (Urban et al. 2007). Further range
conditions. Evolution may also drive an increase in dis-              expansion is expected because of an increasing breadth of
persal ability through simple spatial assortment by dis-              habitat suitability in regions of both colder and warmer
persal ability on the invasion front. Simulations and em-             temperatures than forecast from their ancestral range in
pirical data suggest the possible evolution of higher                 Central and South America (Sutherst et al. 1996; Urban
dispersal rates at the edges of expanding populations                 et al. 2007). Moreover, range expansion rates have in-
(Travis and Dytham 2002; Simmons and Thomas 2004;                     creased in the Northern Territory of Australia, and the
Phillips et al. 2006, 2008). Spatial variability in demo-             evolution of enhanced dispersal ability has been implicated
graphic or dispersal rates could thus interact with evolu-            in these accelerated invasion dynamics (Phillips et al.
tionary shifts in the organism to generate divergent in-              2006). However, the question remains, are these acceler-
vasion trajectories that include heterogeneous accelera-              ated dynamics restricted to only one region, or do they
tions of advance.                                                     represent a continent-wide pattern?
   Discriminating among divergent patterns of spatial                    To answer this question, we assessed range expansion
spread by invasive species can generate insights into the             dynamics of cane toads throughout their invasive range,
mechanisms underlying range expansion and can identify                including three regions characterized by different envi-
regions for intensive control efforts (Shigesada et al. 1995).        ronments. We analyzed each invasion trajectory to deter-
Although more sophisticated theoretical frameworks are                mine whether range expansion has accelerated, deceler-
beginning to incorporate heterogeneous environmental                  ated, or proceeded in a linear fashion, as predicted by
conditions in order to predict rates of range expansion               random diffusion models. We then explored the hypothesis
(reviewed by Shigesada and Kawasaki [1997]; Hastings et               that invasion speed is influenced by conditions that likely

                                      This content downloaded from 137.111.013.200 on June 30, 2019 20:29:53 PM
                    All use subject to University of Chicago Press Terms and Conditions (http://www.journals.uchicago.edu/t-and-c).
E136 The American Naturalist

affect cane toad population growth and dispersal, includ-                        Toad Distribution and Colonization Data
ing favorable climates, anthropogenic environments, long-
distance dispersal corridors (roads), and landscape con-              More than 2,500 records of toad locality (latitude and
nectivity. Unlike prior researchers, we evaluated the                 longitude) and observation year were assembled from
correspondence between invasion speed and environmen-                 the Queensland Museum, published sources (Floyd et al.
tal factors by fitting a data-driven model of localized La-           1981; Sabath et al. 1981; Easteal et al. 1985; Estoup et al.
placian approximations to point data in order to highlight            2004; Phillips and Shine 2004; Phillips et al. 2007; Urban
spatial differences in invasion speeds. We then analyzed              et al. 2007), and new records collected in the Northern
the residuals from the environment-speed relationship to              Territory (http://www.frogwatch.org.au/canetoads/default
identify regions where predictor variables did a relatively           .cfm). These records include data associated with museum
poor job of predicting invasion speed and thus may require            specimens, the results of systematic postal surveys (Sabath
additional explanation. We expected that invasion dynam-              et al. 1981; Easteal et al. 1985), ongoing regional surveys
ics should at first occur linearly and then saturate as toads         of the expanding invasion front (Estoup et al. 2004; Phil-
reached the edge of their native niche envelope, where low            lips et al. 2007), and continued management efforts to
fitness, combined with disruptive gene flow from dense                track the spread of cane toads into new territories. Past
core populations, would limit future expansion (Kirkpat-              work has used these data to map the continuing spread
rick and Barton 1997).                                                of cane toads in Australia (Sabath et al. 1981; Easteal et
                                                                      al. 1985) and to evaluate the relationship between envi-
                                                                      ronmental variables and toad colonization probability (Ur-
                  Material and Methods                                ban et al. 2007). Redundant samples from the same grid
                                                                      locations (minute-by-minute grids) were removed from
             Natural History and Distribution                         analysis. Eleven points were eliminated from consideration
The cane toad is a large anuran (up to 24 cm in snout-                either because they represented island populations (north
vent length and 2.8 kg in weight, although rarely exceeding           of the Cape York Peninsula) that were not representative
14 cm and 0.7 kg, respectively; Lever 2001; B. L. Phillips,           of the toad’s continental expansion or because they con-
unpublished data) that is native to tropical and subtropical          stituted human-aided introductions that have not resulted
regions of Central and South America (Lever 2001). The                in establishment (south of Port Macquarie, New South
cane toad inhabits a variety of habitats but reaches its              Wales). This reduced data set yielded 1,911 unique toad
highest densities in open grassland and disturbed habitats            presences recorded from the date of the toads’ introduc-
(Zug and Zug 1979; Brown et al. 2006). Females lay their              tion in 1935 until 2006. Data density increased through
eggs in temporary or permanent water bodies. Aquatic                  time, with about 50 records available during the late 1930s
tadpoles metamorphose into terrestrial juveniles after 1–             and more than 400 records available during the first half
2 months of development (Zug and Zug 1979). On the                    of the 2000s. However, the number of records per year
northern expansion front, adult toads can move up to 22               was not significantly correlated with an increase in ex-
km in a single month, a distance greater than that reported           pansion rates (see “Results”), suggesting that the bias in-
for most other amphibians (Phillips et al. 2007).                     troduced by differential observation intensity was minimal
   The cane toad was introduced from 1935 to 1937 to                  in our analyses.
multiple locations spanning 1,200 km of coastal Queens-
land, Australia, in an ill-fated attempt to control sugar                                         Toad Ranges
cane pests. Since that time, the cane toad has expanded
its range to 1.2 million km2 (Urban et al. 2007). Across              Cane toad range boundaries were estimated annually from
its invasive range in Australia, the toxic and often com-             1935 through 2006. The range boundary was determined
petitively superior cane toad has initiated declines in native        using the method of a-hull polygons in a program written
species, and further declines may occur as it expands into            in MATLAB, version 7.1, with the Mapping Toolbox 2.2
new regions (Phillips et al. 2003; Murray and Hose 2005).             (MathWorks, Natick, MA). We chose the a-hull approach
The distribution of cane toads is constrained by extreme              over standard minimum convex polygons because the lat-
maximum and minimum temperatures, precipitation,                      ter approach can be biased toward larger ranges when
evaporation, and the availability of open habitats in their           species distributions follow nonconvex patterns (Burgman
native ranges (Zug and Zug 1979; Sutherst et al. 1996).               and Fox 2003). The a-hull algorithm first creates a De-
However, cane toads in Australia increasingly are found               launay triangulation of all the toad presences recorded up
colonizing regions of more extreme maximum and min-                   to a given year. A Delaunay triangulation connects all the
imum temperatures and drier conditions in different parts             points in a data set subject to the constraint that a circle
of Australia (Urban et al. 2007).                                     passing through any three connected points does not in-

                                      This content downloaded from 137.111.013.200 on June 30, 2019 20:29:53 PM
                    All use subject to University of Chicago Press Terms and Conditions (http://www.journals.uchicago.edu/t-and-c).
Toad Invasion Dynamics E137
clude any other points (Legendre and Legendre 1998). The Invasion Speed
outermost line segments from this Delaunay triangulation
form the minimum convex hull that is commonly used
Estimating invasion speed requires information on both
in species range determinations. However, in the a-hull
toad arrival dates and the spatial distribution of those
approach, all of the line segments that surpass a prede-
arrival dates. We first constructed a grid surface indicating
termined limit (a) to the average length of all triangle the locally averaged time since colonization of toads and
sides are removed from further analysis. In this way, the then derived from this grid a second surface estimating
a-hull eliminates long segments that span across empty invasion speed. An averaged invasion surface, as opposed
concavities or that connect isolated island populations and to an interpolated surface, was used to control for the
is thus more conservative than a standard minimum con- nonsystematic effort by which most toad presences were
vex hull. We decided on the a value by iteratively finding recorded over the years. Beginning with the latest and
the value that reproduced the contiguous toad distribution ending with the earliest range estimate, we deleted new
found along coastal Australia and determined by other records embedded in the hulls of previous time periods.
methods (Urban et al. 2007). We calculated toad ranges Thus, only data points located on the edge of estimated
for each year from 1935 until 2006 to form 72 range hulls. range boundaries were used to calculate invasion speed.
We extracted the radial invasion range at time t, We also bordered our analysis by our previous prediction
of the toads’ potential range (Urban et al. 2007), a process
that leads to more conservative estimates of range expan-
rt p 冑2 7 parea ,
t
sion by excluding rare, highly isolated, and possibly non-
persistent toad populations.
We used the MATLAB “gridfit” program (D’Errico
2006) to construct the surface of time since colonization.
as an estimate of the idealized radial expansion of a semi- In gridfit, a bilinear interpolation was fitted to each data
point. Then a finite difference approximation to the La-
circle originating from a single introduction point (Shi-
placian operator was used to smooth the interpolated sur-
gesada and Kawasaki 1997). Clearly, given the multiple
face. The balance between interpolation and estimation
introductions of toads that occurred along the Queensland
was determined by an adjustable smoothing factor. We
coast (Sabath et al. 1981), this approach is a simplification;
objectively determined the smoothing factor by finding
thus, we also measured radial expansion rates as the annual
the model with a minimal likelihood cross-validation cri-
progression of range distance from the perimeter of the
terion (CVC), a model fit parameter analogous to the
original introduction region for three superimposed tran-
Akaike Information Criterion (Horne and Garton 2006).
sects (e.g., Andow et al. 1990). These transects originate The CVC estimates the Kullback-Leibler distance by mea-
at specific introduction points and traverse divergent geo- suring the sum of the negative log likelihoods between
graphic and climatic regions of toad range expansion: the partitions of the data set into training and prediction sub-
Gordonvale–Timber Creek transect (from an original in- sets. We calculated the CVC across a range of smoothing
troduction point in Gordonvale northwest to Normanton parameter values (0.1 : 0.1 : 1, 10 : 10 : 1,200) after apply-
and west to Timber Creek); Mackay West transect (from ing a 10-fold partition of the data set (van der Laan et al.
a central introduction point west to the interior range 2004). For our data, CVC values quickly reached an as-
limit); and the Isis–Brisbane–Port Macquarie transect ymptote. Therefore, we chose the smoothing factor that
(south from the southernmost introduction point to Bris- produced a model with a CVC that approached this as-
bane and then to Port Macquarie). ymptote. In practice, we chose the model with a CVC that
To discriminate among possible invasion patterns was 99.9% of the asymptotic value estimated from an ex-
through time, we estimated the power exponent of the ponential asymptotic nonlinear regression (Crawley 2002).
nonlinear regression (y p a ⫹ bx b ⫹ ) of radial toad Further increases in fit after this point were marginal, and
range versus time since introduction. A linear relationship this model retained known regional heterogeneities in toad
was not rejected if the 95% confidence intervals of the invasions. The final invasion surface was constructed at a
estimated exponent included 1. An exponent that was sig- resolution of one-fifth of a degree to facilitate manageable
nificantly greater than 1 indicated an accelerating function; run times of the difference equations.
an exponent less than 1 denoted a decelerating function. Finally, we calculated invasion speed as the inverse of
Confidence intervals for regression coefficients were esti- the change in time since colonization versus distance and
mated using 10,000 bootstrapped samples in a program converted it to kilometers per year, using a latitude-
written in MATLAB, version 7.1. dependent grid cell-to-area correction factor. This map
This content downloaded from 137.111.013.200 on June 30, 2019 20:29:53 PM
All use subject to University of Chicago Press Terms and Conditions (http://www.journals.uchicago.edu/t-and-c).E138 The American Naturalist
was then linearly interpolated to a minute-by-minute grid (mean variance inflation factor [VIF] p 2.1, maximum
to match the finer-scale resolution of toad data. VIF p 5.4; Hall et al. 1999). The Akaike Information Cri-
terion (AIC) was used to select the best (minimal AIC)
model (Burnham and Anderson 2002). Six other models
The Effect of Environmental and Landscape Factors
were detected with AIC values close to that of the best
on Invasion Speed
model (≤2.0; Burnham and Anderson 2002). These models
We restricted predictors to a set of environmental variables retained the same variables as the minimum-AIC model,
based on prior knowledge of cane toad physiology and except that they also retained precipitation, developed area,
habitat (Zug and Zug 1979; Sutherst et al. 1996; Lever or patch density. Because including these variables resulted
2001). These variables, the expected directions of their in little difference in variation explained (!0.001) and no
effects, and relevant citations can be found in table A1. difference in the sign of parameter estimates, we inter-
We predicted that annual temperature (minimum and preted results from the minimum-AIC model.
maximum and their squared terms), annual precipitation, The contribution of spatial autocorrelation to invasion
elevation, topographical heterogeneity, and proportional speed was assessed by fitting a cubic trend surface to the
road and developed land cover would affect cane toad data (Legendre and Legendre 1998). The spatial variables
range expansion speeds. Details on the derivation of these for describing the invasion surface were selected on the
variables can be found in Urban et al. (2007). basis of those retained by the minimum-AIC model. The
In addition to environmental variables, we also evaluated same technique was used to select variables used in the
the relationship between invasion speed and the landscape full model, which included both spatial and environmental
connectivity of predicted habitat patches. The connectivity variables. The variation attributed to environmental and
of suitable habitat was measured in two ways: patch density spatial variables alone and their interaction were deter-
and patch connectivity (C index; Hanski 1994; Vos et al. mined by a standard partitioning of the explained variation
2001). The two statistics differ in that the first measures the (Legendre and Legendre 1998).
simple density of patches per defined landscape, whereas
the second incorporates the total area of surrounding
patches weighted by their distance from the focal patch. We Results
measured patch density in FRAGSTATS (McGarigal et al. Toad Range Size
2002) in a 55-km-radius moving window, which corre-
sponds to the maximum observed annual invasion speed By 2006, cane toads were reported about 300 km north
of cane toads. The patch connectivity index takes the sum of Sydney (Port Macquarie, New South Wales) and as far
of surrounding patch area weighted as a decaying expo- west as Timber Creek and Darwin in the Northern Ter-
nential function of distance. We modified this algorithm ritory (fig. 1). Much of the recent expansion in toad range
somewhat by assuming that each grid cell of suitable habitat has occurred along the western invasion front in the
was a patch and making it a relative measure by dividing Northern Territory and, to a lesser degree, south along the
it by the total possible value (Cmax) for each estimated region. coast in New South Wales.
We calculated the metric within the same 55-km-radius After the period of the initial multiple introductions
moving window used for the patch density statistic in a (1935–1937), total radial toad range [(2 7 area total /p)1/2] in-
program written in MATLAB. The species-specific a pa- creased rapidly at first and then entered a slower stage of
rameter (different from the a parameter used in hull con- expansion (fig. 2; table 1), suggesting a decelerating pattern
struction) was estimated via maximum likelihood as the over the entire time period. However, this saturating pat-
probability that observed toad displacements from a radio- tern can be decomposed into two accelerating phases, oc-
tracking survey (Phillips et al. 2007) fell into one of 13 curring at different initial velocities but with similar ac-
binned distances. Because these displacements were col- celerations, that characterize expansion dynamics before
lected over variable periods of time, they were first stan- and after the colonization of the Northern Territory in the
dardized to reflect a 100-day wet season (the period during 1970s (table 1). If the observed increase in range expansion
which the majority of annual movement occurs; Phillips et rates could be attributed to increases in the detection of
al. 2007). toads as surveys became better or more intensive in later
We modeled invasion speed in relation to environmental years, then we would expect to a see a positive relationship
and landscape factors. Maximum and minimum temper- between the number of records in a year and the absolute
atures were centered, and squared terms were calculated increase in total range area. However, we found that this
after centering to eliminate inherent colinearity between relationship was not significant (F p 0.6, df p 1, 70,
squared terms and their roots (Legendre and Legendre P p .452).
1998). Subsequent colinearity among variables was low Within specific regions, toad range expansion rates de-
This content downloaded from 137.111.013.200 on June 30, 2019 20:29:53 PM
All use subject to University of Chicago Press Terms and Conditions (http://www.journals.uchicago.edu/t-and-c).Toad Invasion Dynamics E139
Figure 1: Map of Australia depicting the a-hull representations of cane toad range in 5-year increments (6 years for the latest estimate). Invasion
hulls are shown only for the area of estimated suitable habitat (isolated interior populations are not plotted). Key cities and geographic features are
indicated.
celerated as toads moved west from Mackay into the hotter tinued to accelerate as toads colonized areas in northern
and drier climate of interior Australia (fig. 2). In a similar Australia. This includes hot, dry inland areas that were
way, toad expansion has slowed as toads moved south previously expected to be of low suitability for cane toads
along the eastern Australian coast toward Sydney along because of native habitat conditions (Sutherst et al. 1996).
the Isis–Brisbane–Port Macquarie transect (table 1). Note As toads approached the western part of the Northern
that both of these decelerating range dynamics still dem- Territory, their invasion speed increased up to a maximum
onstrated a decelerating pattern when range boundaries rate of 60 km/year.
were not limited to suitable habitat, suggesting that these We next turned to an evaluation of the climate and
patterns are not due to this constraint. In contrast to these landscape factors associated with cane toad invasion speed.
decelerating patterns, toad range expansion has accelerated We predicted that invasion speed would decrease as toads
as toads moved northwest along the Gulf of Carpenteria approached less hospitable areas of hotter and drier con-
and into the Northern Territory. ditions in interior regions and more fragmented potential
habitat. The minimum-AIC regression model of invasion
speed retained maximum and minimum temperature plus
Invasion Speed
their squared terms, precipitation # topographical het-
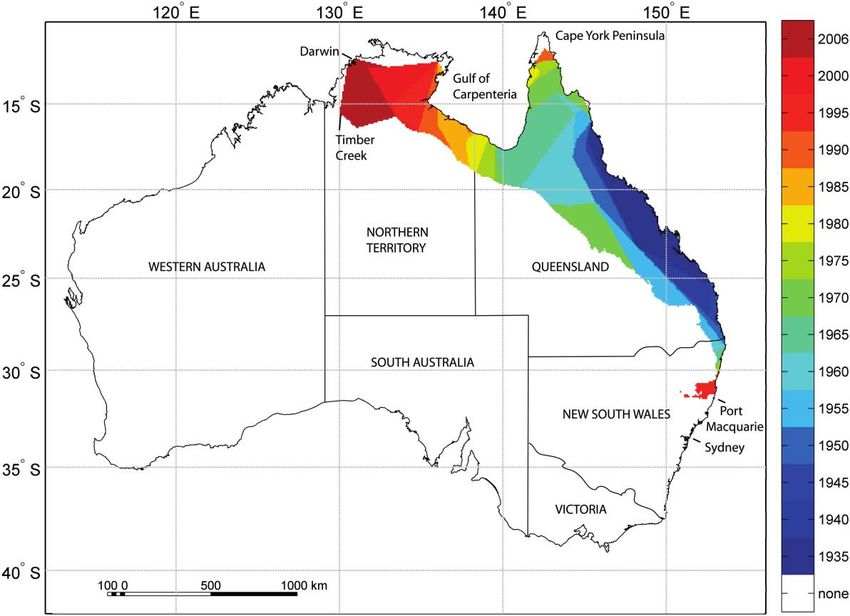
Invasion proceeded at a rate of 10–15 km/year along the erogeneity, elevation, proportional road area, and patch
east coast of Australia during the initial phase of coloni- connectivity (table 2). The variables in this model signif-
zation (fig. 3). However, invasion speeds accelerated up icantly predicted toad invasion speed (F p 365.5, df p
to 30 km/year as toads expanded their range along the 8, 1,064, P ! .001) and accounted for 73.3% of its variation.
Gulf of Carpenteria in northern Australia. These rates con- The relationships between invasion speed and each re-
This content downloaded from 137.111.013.200 on June 30, 2019 20:29:53 PM
All use subject to University of Chicago Press Terms and Conditions (http://www.journals.uchicago.edu/t-and-c).E140
Figure 2: Radial range size for cane toads by year for the entire range and for three separate transects (map at top left) that represent different environmental regions. The Gordonvale–Timber
Creek transect intersects a region of hot tropical savanna, the Mackay West transect begins in moist tropical forest and ends in dry desert interior, and the Isis–Brisbane–Port Macquarie transect
follows the general contours of the coastline into cooler regions of southeastern Australia.
This content downloaded from 137.111.013.200 on June 30, 2019 20:29:53 PM
All use subject to University of Chicago Press Terms and Conditions (http://www.journals.uchicago.edu/t-and-c).Toad Invasion Dynamics E141
Table 1: Power regressions of radial cane toad range expansion through time for the entire range and for separate transects
through different geographic regions
Estimated power 95% bootstrapped CIs Suggested
Range exponent (b) (lower, upper) relationship
Entire toad range (1937–2006) .73 .57, .82 Decelerating
Initial expansion (1937–1973) 1.54 1.43, 1.71 Accelerating
Beginning with northwestern expansion (1974–2006) 1.72 1.18, 2.41 Accelerating
Gordonvale–Timber Creek 1.63 1.50, 1.76 Accelerating
Mackay West .72 .64, .81 Decelerating
Isis–Brisbane–Port Macquarie .66 .61, .71 Decelerating
Note: The power regression function used in these analyses took the form y p a ⫹ bxb ⫹ . The intercept (a) in this regression model was set
to 0 in models that were evaluated at the beginning of the cane toad invasion. The power exponents were estimated in a nonlinear regression
model, and their upper and lower ninety-fifth-percentile confidence intervals (CIs) were estimated with 10,000 bootstrap samples (including the
original estimate). A coefficient of 1 indicates a linear relationship between toad radial range and time. A coefficient significantly greater than 1
signifies an accelerating relationship; a coefficient significantly less than 1 signifies a decelerating relationship. The entire toad range was evaluated
during two periods: from the end of the consolidation of initial introductions until 1973, when the westward expansion began across coastal
Northern Territory, and after that period until 2006.
tained variable were in the directions expected, with the variables were retained in the minimum-AIC spatial trend
exceptions of squared maximum and minimum temper- model. This spatial trend model explained 99.5% of the
atures. In contrast to predictions, the estimated relation- variation (table A2). Note, however, that we expect a high
ships between squared maximum and minimum temper- degree of variance explained because spatial variables are
ature and invasion speed were positive, indicating a general being used to predict a smoothed surface. All variables
pattern of increasing invasion speed with increasing except squared maximum temperature, latitude # lon-
temperatures. gitude, and cubed latitude were retained in the global
We plotted residuals from the regression model to eval- model with both spatial and environmental variables. The
uate the spatial distribution of departures (15 km/year) global model explained 99.6% of the variation in invasion
from expectations developed in the previous regression (fig. speed. By far the most variation in the invasion surface
4). This analysis of residuals can suggest regions where toad was explained by the interaction between spatial and en-
invasion speeds are disconnected from environmental var- vironmental factors (73.2%), suggesting that environmen-
iation and thus may represent regions where cane toad pop- tal variation contributes to differences in invasion speed
ulations differ in traits related to their spread. The residuals but that these contributions differ, depending on region.
analysis demonstrated three broad areas where invasion Environment and space alone explained 0.1% and 26.3%
speeds diverged from model predictions. The toads moved of the variation, respectively.
more quickly than expected along the coast in the region
of their introduction. This rapid early expansion can be
Discussion
attributed to the consolidation of multiple introductions
along the coast. Relatively slower invasion rates were as- Understanding the spread dynamics of invasions can pro-
sociated with their northern expansion into the Cape York vide insights into the basic mechanisms underlying range
Peninsula and their northwestern expansion along the Gulf expansion and can inform efforts to control invasive spe-
of Carpenteria. Faster rates were associated with recent ex- cies (Elton 1958; Andow et al. 1990; Holt et al. 2005).
pansions into the Northern Territory. The overall message Practical limitations meant that early predictions from in-
from this analysis is that toads have invaded different regions vasion theory depended on the assumptions that invasion
at divergent rates even after key underlying environmental rates remained constant over time, environments were ho-
variables were taken into account. mogeneous, and dispersal occurred as a local diffusion
We next looked at the contribution of spatial autocor- process. Under these assumptions, invasions were expected
relation in environmental variables to patterns of invasion to progress at constant linear rates. However, empirical
speed. To do this, we estimated a regression model of studies suggest that invasion dynamics can be character-
invasion speed based on spatial variables from a trend ized by accelerating (Kot et al. 1996; Caswell et al. 2003;
surface analysis and a regression model of both spatial and Clark et al. 2003), decelerating (Silva et al. 2002), or
environmental variables and then evaluated the variance environment-dependent linear range expansions (Lubina
explained independently by the environment, space, and and Levin 1988; Andow et al. 1990; Grosholz 1996). By
the interaction between environment and space. All spatial relaxing these restrictive assumptions, more recent theory
This content downloaded from 137.111.013.200 on June 30, 2019 20:29:53 PM
All use subject to University of Chicago Press Terms and Conditions (http://www.journals.uchicago.edu/t-and-c).E142 The American Naturalist
Figure 3: Cane toad invasion speed (km/year) in areas of suitable habitat. The map was generated by smoothing a bilinear interpolation of the
arrival times of cane toads and taking the derivative at each grid point. The color ramp from dark blue to red illustrates increasing range expansion
rates.
predicts a wide range of possible dynamics (Hastings et erogeneity or in more complex ways as niches or dispersal
al. 2005). In particular, jump dispersal provides one po- abilities evolve (Garcia-Ramos and Rodriguez 2002; Sim-
tentially important explanation for findings of accelerating mons and Thomas 2004; Holt et al. 2005). To some degree,
dynamics (Kot et al. 1996). However, strong Allee effects, environmental variation should play a role in all invasions,
such as might characterize sexual organisms like toads, can if only to limit a species’ further range expansion once it
severely restrict the establishment of peripheral popula- encounters the spatial limits of its conserved niche (Kirk-
tions outside range boundaries and thus can prevent jump patrick and Barton 1997; Wiens and Graham 2005). There-
dispersal from generating accelerating dynamics (Lewis fore, a comprehensive theory of species invasions requires
1997). An alternative explanation involves interactions be- a reconciliation of existing theory with a niche-based per-
tween dispersal, demography, and the environment. spective on the limits to a species’ range. The success of
Clearly, invasions usually proceed across heterogeneous this integration depends on a better understanding of how
landscapes, and environmental variation can affect the environmental variation interacts with spatial position to
spread of invasive species (With 2002; Hastings et al. 2005). determine interregional variation in population demog-
For instance, the invasion rates calculated for the invasive raphy and the distribution of dispersal abilities.
European green crab (Carcinus maenas) in California
poorly predicted green crab invasion rates in Maine and
Cane Toad Invasion Rates across Regions
South Africa (Grosholz 1996). Therefore, invasion speed
may be affected directly by environmental (e.g., distri- Cane toads offer an exceptional model system to study
bution of habitats) and spatial (e.g., fragmentation) het- invasion dynamics across heterogeneous environments.
This content downloaded from 137.111.013.200 on June 30, 2019 20:29:53 PM
All use subject to University of Chicago Press Terms and Conditions (http://www.journals.uchicago.edu/t-and-c).Toad Invasion Dynamics E143
Table 2: Regression results for environmental and landscape variables retained in the minimum-AIC model
of invasion speed
Standardized
Partial regression regression t
Variable coefficients (bk)a coefficients (bk) (df p 1, 1,064) P
Maximum temperature 1.62 .42 14.83 !.001
Maximum temperature2 .46 .42 17.01 !.001
Minimum temperature .37 .10 4.59 !.001
Minimum temperature2 .28 .27 13.51 !.001
Annual precipitation …
Topographic variation # precipitation 1.11⫺5 .04 1.97 .049
Elevation ⫺1.22⫺2 ⫺.17 ⫺9.35 !.001
Percent built-up area …
Road density 54.39 .05 2.58 .010
Patch density …
Patch connectivity 26.61 .03 1.91 .057
Note: The magnitude of standardized regression coefficients can be interpreted as the relative importance of variables in determining
invasion speed.
a
Ellipses indicate variables that were not selected via the method of minimum Akaike Information Criterion (AIC).
Their invasion has been well documented, and their in- the suitability of different regions to cane toad invasion.
troduced range now encompasses more than a million Future research will be needed to address the confluence
square kilometers, including diverse ecological zones of of spatiotemporal environmental changes and cane toad
tropical rain forest, tropical grasslands, and subtropical range expansion rates.
savanna. We found that the total radial range of cane toads
in Australia has decelerated over time as the result of two
Explaining Divergent Invasion Rates
distinct periods of expansion, with the later period char-
acterized by a slower initial velocity but the same accel- What differentiates the cane toad’s accelerating invasion
eration. However, this overall decelerating pattern dis- of the Northern Territory from its expansion into other
guises highly divergent invasion dynamics that are unique parts of its range? Two scenarios might give rise to an
to different geographic regions. Range expansion has been accelerating dynamic. The populations at the current in-
slow in hot, dry regions of interior Australia and in cooler vasion front might be producing a greater proportion of
regions in the southern part of the range. In these regions, long-distance “jump” dispersers. Species that sometimes
the cane toads’ southward and westward expansion rates disperse great distances can accelerate their range expan-
rarely exceeded 20 km/year, and the decelerating power sion by forming multiple nuclei outside of the main range
exponents estimated for invasions in these regions suggest body, which then coalesce into an ever-widening range
that cane toads may be reaching their niche-determined (Andow et al. 1990; Shigesada et al. 1995; Silva et al. 2002).
range limits. In contrast, cane toads in the Northern Ter- Alternatively, median dispersal rates might increase as the
ritory have dramatically accelerated their invasion rates. environment becomes progressively more conducive to
At the leading edge of the invasion, cane toads are ex- movement, the environment provides a greater advantage
panding their range at up to 60 km/year. to long-distance dispersal (e.g., finding scarce resources in
To estimate these invasion speeds, we applied a data- a resource-limited environment), or the traits that deter-
driven method of choosing the smoothing factor for the mine dispersal distance evolve. Hence, a species’ invasion
invasion surface. Ultimately, the best model fit was ob- rate may accelerate as a collection of piecewise linear ex-
tained for a highly smoothed invasion surface. Hence, we pansions without a change in the proportion of long-
caution that our interpretations reflect this broader scale distance jump dispersers.
of inquiry. However, it is encouraging that our model Several pieces of evidence suggest that accelerated dy-
predicted relationships between environmental variables namics of toads in the Northern Territory reflect an in-
and invasion speed similar to those determined by ground- crease in overall dispersal distances rather than a propor-
based monitoring of radio-tracked toads (Phillips et al. tional increase in long-distance dispersers. The median
2007; for details see “The Role of the Environment”). We displacement distances of populations at the Northern Ter-
also cannot exclude the possibility that changes in climate ritory invasion front were more than 13 times the median
and anthropogenic development over time have increased displacement distances of populations at sites colonized
This content downloaded from 137.111.013.200 on June 30, 2019 20:29:53 PM
All use subject to University of Chicago Press Terms and Conditions (http://www.journals.uchicago.edu/t-and-c).E144 The American Naturalist
Figure 4: Residuals of invasion speed versus the predictions generated by the regression of invasion speed on environment. Absolute residuals less
than 5 km/year were excluded. Remaining symbols indicate whether the invasion speed was higher (plus signs) or lower (circles) than that predicted
in the regression. Symbol size is proportional to absolute residual size (see key). Regions characterized by large residuals indicate where toads moved
slower or faster than expected by the model developed in this article for toad invasion speed based on underlying environmental variables.
50 years before the year of sampling (Schwarzkopf and fect both median dispersal distances and the proportion
Alford 2002; Phillips et al. 2007). Intensive field surveys of long-distance dispersers.
conducted during the toad’s 2004–2005 wet-season range
expansion in the Northern Territory showed little evidence
The Role of the Environment
for jump dispersal during the time window evaluated
(Phillips et al. 2007). Instead, toads moved westward at a Our analyses suggest that the tropical environment of the
constant rate. Also, preliminary evidence suggests that kur- Northern Territory may facilitate toad dispersal. Toads
tosis in dispersal kernels, an indicator of a high proportion moved faster in regions characterized by hot weather, abun-
of long-distance dispersers, has declined in populations dant water bodies suitable for breeding (topographical
from the current Northern Territory front (2.2) relative complexity # precipitation), low elevation, and high road
to long-established populations (4.3–8.1; Phillips et al. density. These results accord with field observations of
2008; R. A. Alford, G. P. Brown, L. Schwarzkopf, B. L. radio-tracked cane toads that moved farther on warm, wet,
Phillips, and R. Shine, unpublished data). These data sug- humid, and windy nights in open habitats and along road-
gest that the extent and perhaps even the shape of the ways (Schwarzkopf and Alford 2002; Brown et al. 2006;
dispersal kernel differ, depending on population and lo- Phillips et al. 2007). The environmental conditions in the
cation. However, we cannot discount a general influence Northern Territory may facilitate higher reproductive rates
of jump dispersal on cane toad dynamics, considering that or enhanced movement rates. Warmer temperatures might
kurtosis estimates are generally positive and that several allow for an increased number of reproductive events per
cases of long-distance introduction by humans have been year or facilitate sustained locomotion in ectothermic toads
documented. Rather, environmental heterogeneity may af- (Phillips et al. 2007). Alternatively, unfavorable environ-
This content downloaded from 137.111.013.200 on June 30, 2019 20:29:53 PM
All use subject to University of Chicago Press Terms and Conditions (http://www.journals.uchicago.edu/t-and-c).Toad Invasion Dynamics E145
mental conditions might also lead to increased dispersal by Conclusions
promoting the fitness advantages of locating new and un-
exploited habitat patches (e.g., breeding pools) or scarce Cane toads reached the western Northern Territory in
food resources in a meager environment. 2006, a full 21 years before a 1985 forecast that assumed
constant expansion rates predicted their arrival (Freeland
and Martin 1985). The failure to predict the accelerated
The Potential Role of Evolution range expansion of cane toads in Australia suggests that
invasion dynamics may have to be considered at multiple
The evolution of higher dispersal or reproductive rates also spatial scales and in the context of environmental hetero-
could explain part of the observed increase in toad ex- geneity and evolutionary dynamics. This may be partic-
pansion rates in the Northern Territory. The specific en- ularly true for invasive species that have expanded across
vironmental context in this region might select for higher a large geographic region characterized by heterogeneous
rates of reproduction or of dispersal. Higher reproductive environments and variable selection regimes. Future work
rates are expected to evolve in invasive species if trade- will benefit from measuring relationships between dis-
offs between reproduction and enemy defenses no longer persal rates and environment gradients and incorporating
operate because of an absence of natural enemies in the these parameter dependencies into predictive models.
novel environment (Wolfe 2002; Blair and Wolfe 2004). Along these lines, invasion models are beginning to in-
Faster dispersal also might evolve in toads at the invasion corporate spatial heterogeneity in environments by in-
front either because selection favors movement to locate cluding context-dependent diffusion rates or biased move-
unoccupied or high-quality habitat in a low-quality land- ment in gravity models or by simulating dispersal on
scape (i.e., higher fitness of dispersers; Lubina and Levin spatially explicit landscapes (reviewed by Hastings et al.
1988; Pulliam 1988; McPeek and Holt 1992; Winker et al. [2005]). In addition, we need to understand the conditions
1995) or because of spatial assortment by dispersal ability that generate natural selection for enhanced dispersal at
during range expansion (irrespective of fitness; Travis and the leading edge of an invasion and how selection changes
Dytham 2002; Phillips et al. 2006, 2008). However, our a population’s dispersal kernel. Ultimately, knowing the
data suggest that differences in the environment or the specific mechanisms responsible for invasion speed will be
population genetics of toads in the Northern Territory play critical for applying the limited funds available for invasive
some role in the toad’s accelerating dynamics. Otherwise, species control and, more generally, for understanding the
we would expect to see increasing invasion rates at all edges processes by which species expand their ranges under al-
of the toad’s range, and this was not the case. tered conditions.
The environment of the Northern Territory may have
influenced toad dispersal rates in two ways: directly, by
Acknowledgments
facilitating toad movement, and indirectly, by imposing
selection on those dispersal rates. While both ecological Research was supported by a grant from the MacMillan
and evolutionary mechanisms likely have interacted to ac- Center for International and Area Studies at Yale Univer-
celerate invasion speeds, available data do not yet allow sity, and data accumulation was supported by the Austra-
us to distinguish between ecological and evolutionary lian Research Council. We thank the many organizations
mechanisms of range expansion. However, research sug- and individuals that did, and continue to do, the difficult
gests that cane toads at the invasion front have longer work of monitoring the spread of cane toads across remote
limbs and altered behavior, which may have evolved to areas of Australia. M.C.U. was supported as a postdoctoral
support longer-distance dispersal (Phillips et al. 2006, associate at the National Center for Ecological Analysis
2008). Besides the alteration of morphology, we expect and Synthesis, a center funded by the National Science
that behavioral traits should evolve, such as the decisions Foundation (grant DEB-0553768), the University of Cal-
to leave shelter sites or to continue moving. Common- ifornia, Santa Barbara, and the state of California. D.K.S.
garden experiments are currently under way to determine was supported by a Multiple University Research Initiative
whether a genetic basis underlies these dispersal-related from the U.S. Department of Defense. J. Urban provided
traits in populations at the invasion front. helpful comments.
This content downloaded from 137.111.013.200 on June 30, 2019 20:29:53 PM
All use subject to University of Chicago Press Terms and Conditions (http://www.journals.uchicago.edu/t-and-c).E146 The American Naturalist
APPENDIX
Choice of Predictor Variables and Results from the Spatial Trend Model
Table A1: A priori choice of model variables and their assumed relationship with cane toad performance and invasion speed
Variable Relationshipa Justification References
Minimum annual temperature
(squared term) Positive Poor larval and adult performance at low Zug and Zug 1979;
(negative) temperature (∼6⬚–17⬚C); requires suffi- Floyd 1985;
cient number of degree days for Sutherst et al. 1996
development
Maximum annual temperature
(squared term) Positive Poor larval performance at high temperature Floyd 1985;
(negative) (38⬚–43⬚C) Sutherst et al. 1996
Annual precipitation Positive Requires moist conditions and wetlands for Zug and Zug 1979;
breeding Sutherst et al. 1996
Elevation Negative Native range generally occurs at low altitude Zug and Zug 1979
Topographical variation #
annual precipitation Positive Likelihood of breeding pools increases with Sutherst et al. 1996
topographical relief and precipitation
Road density Positive Accidental human transport- or disturbance- Estoup et al. 2004
mediated effects on invader success
Percent built-up area Positive Accidental human transport- or disturbance- Estoup et al. 2004
mediated effects on invader success
Patch density Positive Higher patch density is expected to be Hanski 1999
associated with higher persistence
Patch connectivity index Positive Higher patch connectivity is expected to be Hanski 1994
associated with higher persistence
a
Assumed relationship with toad performance and invasion speed.
Table A2: Results from the regression of invasion speed on spatial
variables
Partial regression t
Variable coefficients (bk) (df p 1, 1,063) P
Latitude ⫺92.39 ⫺2.2 .030
Longitude ⫺103.69 ⫺2.8 .006
Latitude2 4.92 6.7 !.001
Longitude2 .81 2.9 .004
Latitude # longitude 2.93 3.5 !.001
Latitude2 # longitude ⫺3.91⫺2 ⫺6.4 !.001
Latitude # longitude2 ⫺1.60⫺2 ⫺4.4 !.001
Latitude3 ⫺1.22⫺2 ⫺4.2 !.001
Longitude3 ⫺2.59⫺3 ⫺3.3 !.001
Note: Model residual standard error was 0.90 with 1,063 degrees of freedom, and
model R2 was 99.5.
Literature Cited Brown, G. P., B. L. Phillips, J. K. Webb, and R. Shine. 2006. Toad
on the road: use of roads as dispersal corridors by cane toads (Bufo
Andow, D. A., P. M. Kareiva, S. A. Levin, and A. Okubo. 1990. Spread marinus) at an invasion front in tropical Australia. Biological Con-
of invading organisms. Landscape Ecology 4:177–188. servation 133:88–94.
Blair, A. C., and L. M. Wolfe. 2004. The evolution of an invasive Burgman, M. A., and J. C. Fox. 2003. Bias in species range estimates
plant: an experimental study with Silene latifolia. Ecology 85:3035– from minimum convex polygons: implications for conservation and
3042. options for improved planning. Animal Conservation 6:19–28.
This content downloaded from 137.111.013.200 on June 30, 2019 20:29:53 PM
All use subject to University of Chicago Press Terms and Conditions (http://www.journals.uchicago.edu/t-and-c).Toad Invasion Dynamics E147
Burnham, K. P., and D. R. Anderson. 2002. Model selection and a selection from the global invasive species database. Available at
multimodel inference: a practical information-theoretic approach. http://www.issg.org/booklet.pdf.
Springer, New York. Kirkpatrick, M., and N. H. Barton. 1997. Evolution of a species’
Caswell, H., R. Lensink, and M. G. Neubert. 2003. Demography and range. American Naturalist 150:1–23.
dispersal: life table response experiments for invasion speed. Ecol- Kot, M., M. A. Lewis, and P. van den Driessche. 1996. Dispersal data
ogy 84:1968–1978. and the spread of invading organisms. Ecology 77:2027–2042.
Clark, J. S., M. Lewis, J. S. McLachlan, and J. HilleRisLambers. 2003. Legendre, P., and L. Legendre. 1998. Numerical ecology. Develop-
Estimating population spread: what can we forecast and how well? ments in environmental modeling 20. Elsevier, New York.
Ecology 84:1979–1988. Lever, C. 2001. The cane toad: the history and ecology of a successful
Crawley, M. J. 2002. Statistical computing: an introduction to data colonist. Westbury, Otley.
analysis using S-Plus. Wiley, New York. Lewis, M. A. 1997. Variability, patchiness, and jump dispersal in the
D’Errico, J. 2006. Gridfit. Available at http://www.mathworks.com/ spread of an invading population. Pages 46–74 in D. Tilman and
matlabcentral/fileexchange. P. Kareiva, eds. Spatial ecology: the role of space in population
Easteal, S., E. K. van Beurden, R. B. Floyd, and M. D. Sabath. 1985. dynamics and interspecific interactions. Princeton University
Continuing geographical spread of Bufo marinus in Australia: Press, Princeton, NJ.
range expansion between 1974 and 1980. Journal of Herpetology Liebhold, A. M., and P. C. Tobin. 2006. Growth of newly established
19:185–188. alien populations: comparison of North American gypsy moth
Elton, C. S. 1958. The ecology of invasions by animals and plants. colonies with invasion theory. Population Ecology 48:253–262.
Chapman & Hall, London. Liebhold, A. M., J. A. Halverson, and G. A. Elmes. 1992. Gypsy moth
Estoup, A., M. Beaumont, F. Sennedot, C. Moritz, and J.-M. Cornuet. invasion in North America: a quantitative analysis. Journal of Bio-
2004. Genetic analysis of complex demographic scenarios: spatially geography 19:513–520.
expanding populations of the cane toad, Bufo marinus. Evolution Lubina, J. A., and S. A. Levin. 1988. The spread of a reinvading
58:2021–2036. species: range expansion in the California sea otter. American Nat-
Fisher, R. A. 1937. The wave of advance of advantageous genes. uralist 131:526–543.
Annals of Eugenics 7:355–369. McGarigal, K., S. A. Cushman, M. C. Neel, and E. Ene. 2002.
Floyd, R. B. 1985. Effects of photoperiod and starvation on the tem- FRAGSTATS: spatial pattern analysis program for categorical
perature tolerance of larvae of the giant toad, Bufo marinus. Copeia maps. Available at http://www.umass.edu/landeco/research/
1985:625–631. fragstats/fragstats.html.
Floyd, R. B., W. C. Boughton, S. Easteal, M. D. Sabath, and E. K. McPeek, M. A., and R. D. Holt. 1992. The evolution of dispersal in
van Beurden. 1981. The distribution records of the marine toad spatially and temporally varying environments. American Natu-
(Bufo marinus). Vol. 1. School of Australian Environmental Stud- ralist 140:1010–1027.
ies, Griffith University, Brisbane. Murray, B. R., and G. C. Hose. 2005. Life-history and ecological
Freeland, W. J., and K. C. Martin. 1985. The rate of range expansion correlates of decline and extinction in the endemic Australian frog
by Bufo marinus in Northern Australia, 1980–84. Australian Jour- fauna. Austral Ecology 30:564–571.
nal of Wildlife Research 12:555–559. Parmesan, C. 2006. Ecological and evolutionary responses to recent
Garcia-Ramos, G., and D. Rodriguez. 2002. Evolutionary speed of climate change. Annual Review of Ecology, Evolution, and Sys-
species invasions. Evolution 56:661–668. tematics 37:637–669.
Grosholz, E. D. 1996. Contrasting rates of spread for introduced Phillips, B. L., and R. Shine. 2004. Adapting to an invasive species:
species in terrestrial and marine systems. Ecology 77:1680–1686. toxic cane toads induce morphological change in Australian
Hall, R. I., P. R. Leavitt, R. Quinlan, A. S. Dixit, and J. P. Smol. 1999. snakes. Proceedings of the National Academy of Sciences of the
Effects of agriculture, urbanization, and climate on water quality USA 101:17150–17155.
in the northern Great Plains. Limnology and Oceanography 44: Phillips, B. L., G. P. Brown, and R. Shine. 2003. Assessing the potential
739–756. impact of cane toads on Australian snakes. Conservation Biology
Hanski, I. 1994. A practical model of metapopulation dynamics. 17:1738–1747.
Journal of Animal Ecology 63:151–162. Phillips, B. L., G. P. Brown, J. K. Webb, and R. Shine. 2006. Invasion
———. 1999. Metapopulation ecology. Oxford University Press, New and the evolution of speed in toads. Nature 439:803.
York. Phillips, B. L., G. P. Brown, M. Greenlees, J. K. Webb, and R. Shine.
Hastings, A., K. Cuddington, K. F. Davies, C. J. Dugaw, S. Elmendorf, 2007. Rapid expansion of the cane toad (Bufo marinus) invasion
A. Freestone, S. Harrison, et al. 2005. The spatial spread of in- front in tropical Australia. Austral Ecology 32:169–176.
vasions: new developments in theory and evidence. Ecology Letters Phillips, B. L., G. P. Brown, J. M. J. Travis, and R. Shine. 2008. Reid’s
8:91–101. paradox revisited: the evolution of dispersal in range-shifting pop-
Holt, R. D., M. Barfield, and R. Gomulkiewicz. 2005. Theories of ulations. American Naturalist (forthcoming).
niche conservatism and evolution. Pages 259–290 in D. F. Sax, J. Pimentel, D., L. Lach, R. Zuniga, and D. Morrison. 2005. Environ-
J. Stachowicz, and S. D. Gaines, eds. Species invasions: insights mental and economic costs of nonindigenous species in the United
into ecology, evolution, and biogeography. Sinauer, Sunderland, States. BioScience 50:53–65.
MA. Pulliam, H. R. 1988. Sources, sinks, and population regulation. Amer-
Horne, J. S., and E. O. Garton. 2006. Selecting the best home range ican Naturalist 132:652–661.
model: an information-theoretic approach. Ecology 87:1146–1152. Reeves, S. A., and M. B. Usher. 1989. Application of a diffusion
IUCN (International Union for the Conservation of Nature and model to the spread of an invasive species: the coypu in Great
Natural Resources). 2001. 100 of the world’s worst invasive species: Britain. Ecological Modelling 47:217–232.
This content downloaded from 137.111.013.200 on June 30, 2019 20:29:53 PM
All use subject to University of Chicago Press Terms and Conditions (http://www.journals.uchicago.edu/t-and-c).You can also read