Broad-scale acoustic telemetry reveals - OPENPEN CCESS
←
→
Page content transcription
If your browser does not render page correctly, please read the page content below
Vol. 673: 117–134, 2021              MARINE ECOLOGY PROGRESS SERIES
                                                                                                Published September 2
https://doi.org/10.3354/meps13818                Mar Ecol Prog Ser

                                                                                                   OPEN
                                                                                                   ACCESS

       Broad-scale acoustic telemetry reveals
  long-distance movements and large home ranges
     for invasive lionfish on Atlantic coral reefs
 Stephanie J. Green1,*, Jordan K. Matley2, D. Elizabeth Smith3, Bernard Castillo II3,
  John L. Akins4, 5, Richard S. Nemeth6, Clayton Pollock7, Kynoch Reale-Munroe3
                 1
                   Department of Biological Sciences, University of Alberta, Edmonton, AB T6G 2R3, Canada
            2
              Department of Aquatic Resources, St. Francis Xavier University, Antigonish, NS B2G 2W5, Canada
         3
          College of Science & Mathematics, University of the Virgin Islands, RR1 Box 10 000, St. Croix, USVI 00850
                         4
                          Reef Environmental Education Foundation, Key Largo, Florida 33037, USA
                           5
                            Phillip and Patricia Frost Museum of Science, Miami, Florida 33132, USA
6
 Center for Marine and Environmental Studies, University of the Virgin Islands, 2 John Brewers Bay, St. Thomas, USVI 00802
         7
           National Parks Service, Buck Island Reef National Monument, Christiansted, St. Croix, USVI 008020-4611

       ABSTRACT: Tracking studies for invasive lionfish (Pterois volitans and P. miles) in the Western
       Atlantic can provide key information on habitat use to inform population control, but to date have
       likely underestimated home range size and movement due to constrained spatial and temporal
       scales. We tracked 35 acoustically tagged lionfish for >1 yr (March 2018−May 2019) within a
       35 km2 acoustic array in Buck Island Reef National Monument, St. Croix, US Virgin Islands (an
       area 10× larger than previous studies). Tracking lionfish at this scale revealed that home range
       size is 3−20 times larger than previously estimated and varies more than 8-fold across individuals
       (~48 000−379 000 m2; average: 101 000 m2), with estimates insensitive to assumptions about poten-
       tial mortality for low-movement individuals. Lionfish move far greater distances than previously
       reported, with 37% of fish traveling >1 km from the initial tagging site toward deeper habitats,
       and 1 individual moving ~10 km during a 10 d period. Movement rates, home range size, and
       maximum distance traveled were not related to lionfish size (18−35 cm total length) or lunar
       phase. Lionfish movement was lowest at night and greatest during crepuscular periods, with fish
       acceleration (m s−2) increasing with water temperature during these times. Our results help recon-
       cile observed patterns of rapid recolonization following lionfish removal, and suggest complex
       drivers likely result in highly variable patterns of movement for similarly sized fish occupying the
       same habitat. Culling areas ≥ the average lionfish home range size identified here (i.e. ~10 ha) or
       habitat patches isolated by ≥ ~180 m (radius of average home range) may minimize subsequent
       recolonization. If the shallow−deep long-distance movements observed here are unidirectional,
       mesophotic habitats may require culling at relatively greater frequencies to counteract ongoing
       migration.

       KEY WORDS: Animal movement · Home range size · Habitat use · Acoustic telemetry ·
       Invasive species · Population control · Marine conservation

                 1. INTRODUCTION                               particular, information on rates and patterns of
                                                               movement can inform habitat conservation plans for
   Understanding patterns and drivers of animal                populations of imperiled species (Hays et al. 2019),
movement is a fundamental pursuit in ecology with              and guide population control and management activ-
important conservation and management implica-                 ities for non-native species (Lennox et al. 2016). The
tions (Börger et al. 2008, van Beest et al. 2011). In          invasion of Indo-Pacific lionfish (Pterois volitans and
                                                               © The authors 2021. Open Access under Creative Commons by
*Corresponding author: stephanie.green@ualberta.ca             Attribution Licence. Use, distribution and reproduction are un-
                                                               restricted. Authors and original publication must be credited.
                                                               Publisher: Inter-Research · www.int-res.com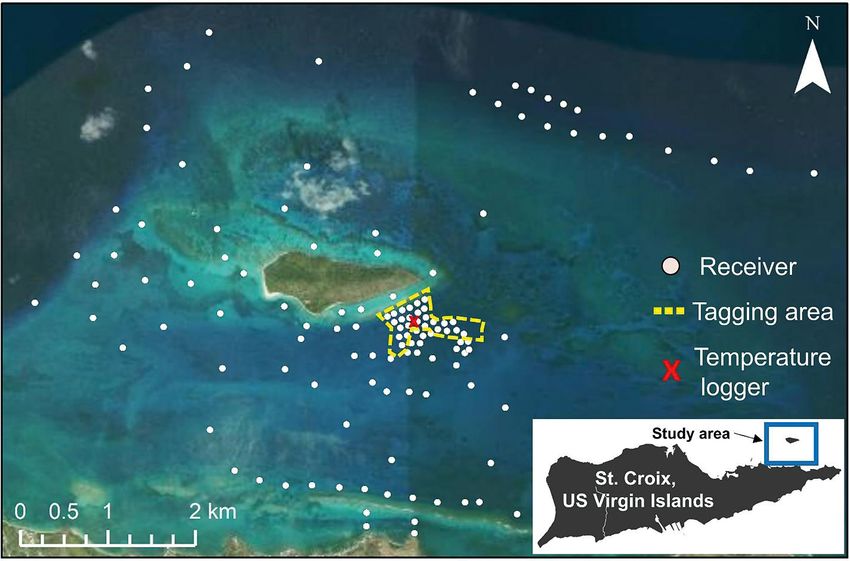
118                                     Mar Ecol Prog Ser 673: 117–134, 2021

                                                                Table 1. Literature describing lionfish movement in terms of home range sizes and maximum distance traveled. Studies show variability in both home range size and
P. miles) into coastal marine habitats in the Tropical

                                                                                                                                                                                                                                                                                                            Tamburello & Côté (2015)
Western Atlantic Ocean and Caribbean Sea repre-

                                                                                                                                                                                                                                                       McCallister et al. (2018)
                                                                                                                                                                                                                                                       Dahl & Patterson (2020)

                                                                                                                                                                                                                                                                                                                                       Jud & Layman (2012)
                                                                                                                                                                                                                                                                                   Bacheler et al. (2015)
sents a conservation issue for which information on
the species’ movement patterns and home range size
is urgently needed to inform ongoing management.
Lionfish represent the first successful introduction of

                                                                                                                                                                                                                                                       This study
                                                                                                                                                                                                                                    Reference
marine fish from the Western Pacific Ocean to Atlantic
waters (Whitfield et al. 2002, Sutherland et al. 2010),
and were first reported in the Atlantic in the early
1980s, possibly as a result of aquarium releases

                                                                                                                                                                                                                                    Maximum distance
(Semmens et al. 2004). By 2010, lionfish were estab-

                                                                                                                                                                                                                                                                                                                                       420 (at liberty)
                                                                                                                                                                                                                                                       daily distance)
                                                                                                                                                                                                                                      traveled (m)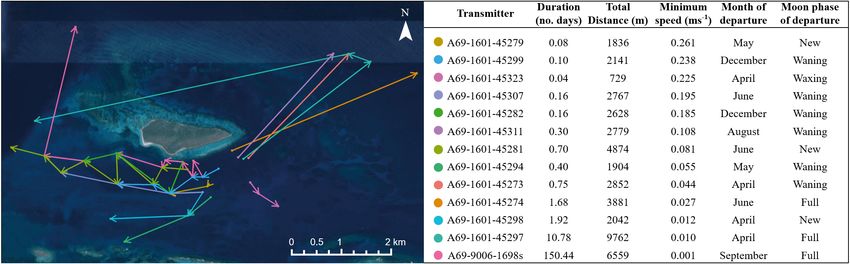
Green et al.: Lionfish home range and movement drivers                           119

sample sizes (Table 1), but taken together, they suggest     tal drivers (e.g. temperature, seasons, lunar phases)
the species exhibits high site fidelity (Jud & Layman        and biological processes (e.g. across ontogeny).
2012, Bacheler et al. 2015, Tamburello & Côté 2015,             Here, we present a full year of tracking invasive
McCallister et al. 2018, Dahl & Patterson 2020). Tam-        lionfish using acoustic telemetry in Buck Island Reef
burello & Côté (2015) estimated the average lionfish         National Monument (BIRNM) in the US Virgin Is-
home range size to be 552 m2 for 79 lionfish fitted with     lands, covering 35 km2 of coastal marine habitat. The
external visual streamer tags in the Bahamas tracked         scale and duration of the study should give a more
via daytime re-sighting over 7 wk across coral reef          complete picture of the range of variation in annual
habitats distributed within a 2 km2 area (Table 1).          habitat use by this important invasive species. Track-
Bacheler et al. (2015) inferred lionfish home range to       ing invasive lionfish across a full set of annual sea-
be between 1963 and 125 663 m2 from detections of 25         sons and at a range of body size classes also allowed
acoustically tagged fish collected over 5 winter months      us to test several hypotheses about potential drivers
from 9 receivers spaced ~300 m apart in coastal habi-        of lionfish home range size and movement patterns.
tats off North Carolina, USA (Table 1). McCallister et          First, studies suggest that the extent of a home
al. (2018) estimated average home range size to be           range is set by the body size of the individual (Minns
3979 ± 1599 m2 (mean ± 95% kernel utilization distri-        1995), with home range estimates increasing signifi-
bution [UD]) for 14 acoustically tagged lionfish tracked     cantly across fish species of increasing body size
for up to 4 mo over 4 sites covering a  500 m; Smith et al. 2017; Table 1).    periods of intense activity centered around crepuscu-
Moreover, allometric scaling relationships between           lar (dawn and dusk) periods, with periods of relative
marine fish body size and home range also suggest            inactivity during day and night (Green et al. 2011,
that large adult lionfish (≥ 1000 g mass) might have         Cure et al. 2012). We hypothesized that rates of
home range sizes in the range of ~150 000 m2 (Tam-           movement for lionfish in BIRNM will follow these
burello & Côté 2015), which is above the upper limit         diel cycles, but that this pattern may be mediated by
of range size estimated from previous work. These            variation in seasonal water temperature, with rates of
observations suggest that the restricted spatial and         activity lower in seasons where cooler temperatures
temporal scale of previous work on lionfish move-            result in lower metabolic demands.
ment, presumably due to logistical constraints, may             Finally, acoustically tagged animals repeatedly de-
underestimate home range sizes and movements                 tected on one or few adjacent receivers are typically
across the seascape. In particular, studies that take        assumed to represent mortality events (Klinard &
place over small spatial scales are more likely to           Matley 2020). However, this method is not likely
underestimate home range as individuals that move            appropriate for lionfish because visual tagging stud-
‘out of bounds’ are excluded from analysis. Likewise,        ies have indicated that a single individual could be
studies that take place over short temporal scales           highly resident (i.e. < 20 m movement from tagging
have a reduced likelihood that observations are tak-         site) for more than 6 mo (Akins et al. 2014). We there-
ing place across the range of environmental factors          fore explored assumptions about mortality (vs. resi-
and conditions that influence movement across the            dent behavior) for individuals with highly localized
seascape, especially if the focal species undergoes          detections on estimates of average home range size,
shifts in habitat occupancy as a result of environmen-       rate of movement, and maximum distance traveled
120 Mar Ecol Prog Ser 673: 117–134, 2021
for the species. We hypothesized that while maxi- restricted to habitats near the center of the monu-
mum estimates of home range size and rates of ment within a cluster of closely spaced receivers (N =
movement will be unaffected by assumptions about 36) covering an area ~0.25 km2 and located at depths
mortality, average estimates for these properties of 5−8 m along the fringing reef and 12−18 m in
may be higher when fish that might otherwise be patch reef areas south of Buck Island with a mini-
assumed to represent mortality events (but could in- mum of 100 m and maximum of 125 m between each
stead represent sedentary individuals) are included (Fig. 1). The closely spaced cluster of receivers was
in our analyses. designed as a fine-scale positioning system (FPS; for-
merly Vemco Positioning System) and located within
the center of the broader array of 95 receivers cover-
2. MATERIALS AND METHODS ing 35 km2. Range testing conducted by Selby et al.
(2016) within this cluster of receivers (where tagging
2.1. Study area occurred) and throughout the broader array area
indicated that a receiver−transmitter distance of
The study took place in BIRNM off of St. Croix, 100 m resulted in 58.2% of transmissions being
USVI (17° 47’ 11“ N, 64° 37’ 14“ W). The monument detected across all habitats.
includes a relatively small (712 000 m2) and un-
inhabited island approximately 2.4 km north of
St. Croix, as well as 76.2 km2 of coral reef, colonized 2.2. Fish collection and tagging
pavement, seagrass, and sandy-bottom habitats
where fishing, including for lionfish, is prohibited In March 2018, 40 (of 42 sighted) lionfish were cap-
(Pittman et al. 2008). VR2W acoustic receivers (Inno- tured and tagged underwater by SCUBA divers from
vaSea, formerly Vemco, 69 kHz) were installed patch (n = 30) and continuous fringing reef (n = 10)
throughout the park in depths between 5 and 60 m habitats south of Buck Island (Fig. 1) following meth-
(N = 131 receivers) and covered an area of approxi- ods adapted from Akins et al. (2014). Captured fish
mately 35 km2. Lionfish collection and tagging were were held, unanesthetized, by divers in clear vinyl
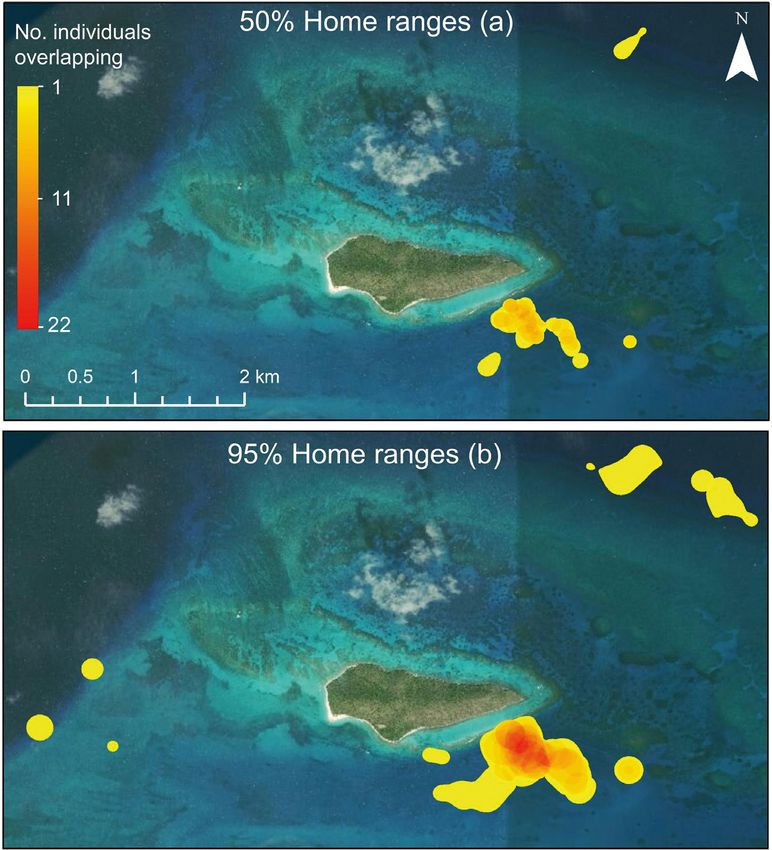
Fig. 1. Receiver array (N = 131) within the Buck Island Reef National Monument (BIRNM) off the northeast coast of St. Croix,
US Virgin Islands (USVI; inset). Six receivers deployed ~20 km to the northeast of the tagging area did not record any detections
and were omitted from the map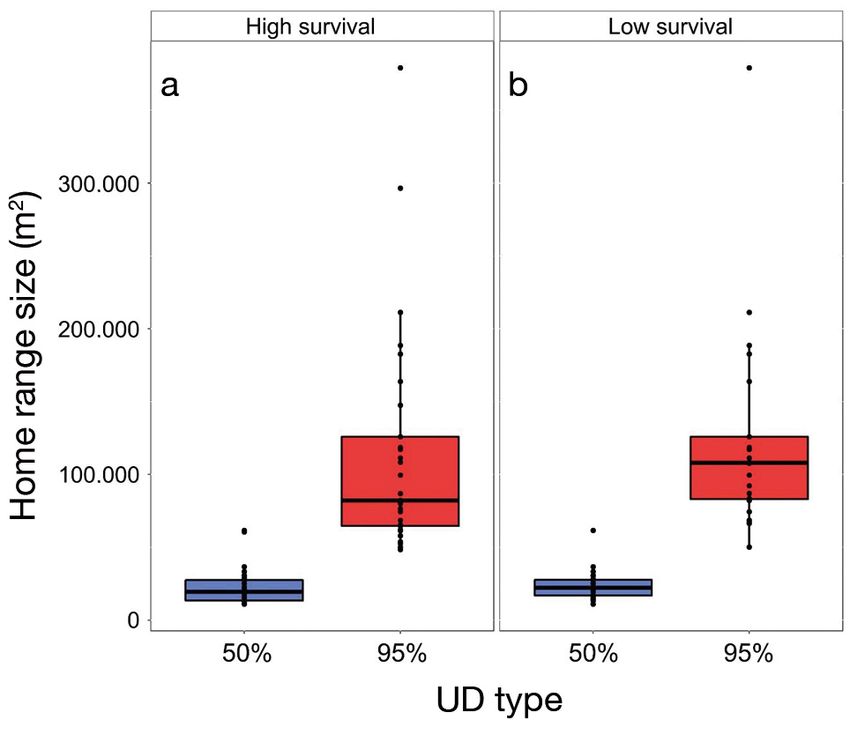
Green et al.: Lionfish home range and movement drivers                             121

nets, and fish total length (TL, ±1 mm) was recorded.       fish. Instances of the latter were identified as individ-
Fish >18 cm (n = 35) were implanted with an internal        ual detections occurring remotely in space or time
acoustic transmitter (InnovaSea, V9-2h, 110−250 s           without demonstrating any sequential movement
delay, 492 d battery life, 9 mm × 43 mm, 3.3 g in           pathways (e.g. a singular detection observed several
water) and fitted with an external streamer tag (Floy,      kms away from where the individual was routinely
FTSL-73). Seven transmitters (InnovaSea, V9AP-2h,           detected during the same period). Second, data from
170−270 s delay, 365 d battery life, 9 mm × 48 mm,          the first 24 h after tagging were removed from spatial
3.6 g in water) also included acceleration and pres-        analyses, unless stated otherwise, to allow for a re-
sure sensors to provide additional movement infor-          covery period from surgery where behavior may be
mation. Since V9AP tags were larger and heavier,            unduly affected (Fig. 2). Third, data from individuals
they were implanted in the larger lionfish (> 24 cm).       were excluded if they were detected on less than 8
Fish
122 Mar Ecol Prog Ser 673: 117–134, 2021
ing individuals with low movement rates, with all ble, the effect was minimal because designations
detection data (after initial filtering steps described were conducted weekly.
above) incorporated in analyses. Conversely, the low We then conducted all further analyses for both
survival scenario assumed that highly restricted high and low survival scenarios, in order to help us to
detections were from ejected tags or dead individu- explore the effect of assumptions about the fate of
als, with data from these individuals excluded from animals (i.e. mortality events) versus animal behavior
analyses (see next paragraph). (i.e. sedentary habits) on patterns of movement and
We identified highly restricted detections by first home range generated from telemetry data (Klinard
calculating the maximum distance a stationary tag & Matley 2020). In particular, the high survival sce-
could be detected in the array using detections from nario may underestimate the average home range
the 5 individuals equipped with both acoustic trans- size, rate of movement, and distance moved for this
mitters and acceleration sensors for which mortality species, because fish that have died (and thus are not
events had occurred based on acceleration values moving) may be included in the analysis. Conversely,
consistently < 0.1 m s−2, which was estimated to be the low survival scenario may overestimate the aver-
~175 m. We then used this distance when evaluating age home range size, rate of movement, and distance
transmitter location data at a weekly scale for all moved if resident fish are erroneously assumed to
tagged fish. Specifically, during weeks when each have died and removed from analyses.
animal’s transmitter was detected on
receivers greater than 175 m apart, the
animal was deemed to be alive during
that period (and thus included in all
analyses; Fig. 2); alternatively, if the
transmitter was only detected on re-
ceivers less than 175 m apart (i.e. a
highly restricted detection), the animal
was included in the high survival sce-
nario, but excluded from the low sur-
vival scenario, due to the possibility of
a mortality event (Fig. 2). Since these
classifications were conducted weekly,
all periods prior to the last week with
detections >175 m apart were identi-
fied as ‘living’ and any following highly
restricted detections were either incor-
porated (high survival scenario) or
excluded (low survival scenario). We
chose the described approach of iden-
tifying possible mortality events as
opposed to setting distance limits by
traditional range testing techniques
(e.g. Kessel et al. 2014) because sen-
tinel tags that were deployed within
the array, as part of another study ob-
jective, were deployed relatively high
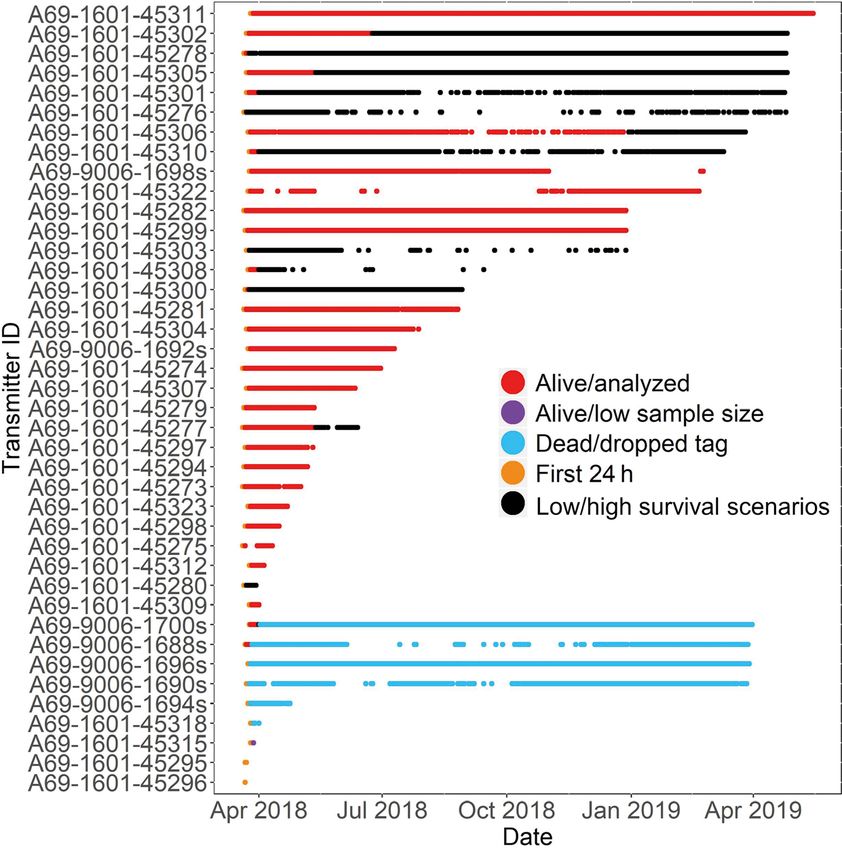
in the water column. This led to over- Fig. 2. Detections of acoustically tagged lionfish within the 35 km2 BIRNM
estimates of detection range when array off St. Croix, USVI, across the study period. Colors represent the various
filtering stages applied to detection data prior to analysis of home range and
compared with tagged lionfish that movement. Detections collected for all fish < 24 h from tagging (orange), from
remained near the substrate in rugose any evident mortality event based on acceleration sensor data (blue; acceler-
habitat where detection efficiency was ation < 0.1 m s−2), and for fish detected on fewer than 8 d after tagging (purple)
reduced. Consequently, the use of were excluded from our analyses. Fish detected >175 m apart within 1 wk
(red) were designated as living and were included in all analyses. Weekly
dropped tags was more representative detectionsTable 2. Summary of tagging, detection, and residency history of each tagged lionfish (denoted by transmitter number) within the Buck Island Reef National Monument array
reported for both high and low survival scenarios. Transmitter codes ending in ‘s’ indicate V9AP accelerometer tags. Asterisks (*) indicate individuals that made long-distance
movements (>1 km from release site). FR: fringing reef; PR: patch reef; RI: residency index; TL: total length. Blank cells in the ‘Low survival scenario’ represent fish that were
not identified as a possible mortality event, resulting in the same data used in both low and high survival scenarios. Cells with dashes indicate metrics that were not analyzed
due to low sample size
Transmitter Habitat TL High survival scenario Low survival scenario
(at release) (cm) No. No. No. Detection Max Detection Tag- Analyzed? Possible No. Analyzed?
detections receivers days period distance RI life mortality? days
detected (d) from RI detected
release (m)
A69-1601-45311 PR 23.5 138231 49 416 416 3460* 1 0.99 Yes
A69-1601-45302 FR 19 62585 39 400 400 984 1 0.95 Yes Yes 93 Yes
A69-1601-45305 PR 27 91634 30 400 400 467 1 0.95 Yes Yes 51 Yes
A69-1601-45278 PR 26 135264 29 398 401 263 0.99 0.95 Yes Yes 4 No
A69-1601-45301 PR 19 35370 43 301 398 972 0.76 0.72 Yes Yes 9 Yes
A69-1601-45306 PR 20 12614 13 287 368 364 0.78 0.68 Yes Yes 278 Yes
A69-1601-45282 PR 25 108720 43 283 283 2519* 1 0.67 Yes
A69-1601-45299 PR 19 106666 42 282 282 2224* 1 0.67 Yes
A69-1601-45310 PR 24 38889 45 275 351 972 0.78 0.65 Yes Yes 7 No
A69-9006-1698s PR 28 115154 51 221 336 4725* 0.66 0.61 Yes
A69-1601-45300 PR 25.5 38291 36 161 161 342 1 0.38 Yes Yes 3 No
A69-1601-45281 PR 23 61591 51 152 159 4009* 0.96 0.36 Yes
A69-1601-45276 PR 20.5 4589 25 149 401 333 0.37 0.35 Yes Yes 0 No
A69-1601-45322 FR 19 7868 38 140 334 511 0.42 0.33 Yes
A69-1601-45304 PR 19 22112 24 125 128 588 0.98 0.3 Yes
A69-9006-1692s PR 26 36118 34 109 109 883 1 0.3 Yes
A69-1601-45274 PR 21.2 54361 39 102 103 4603* 0.99 0.24 Yes
A69-1601-45303 FR 21 2044 18 99 281 409 0.35 0.24 Yes Yes 2 No
A69-1601-45307 PR 21.5 38565 45 80 81 4473* 0.99 0.19 Yes
A69-1601-45277 PR 23.6 52562 39 79 86 662 0.92 0.19 Yes Yes 54 Yes
A69-1601-45279 PR 30.3 102889 48 53 53 2476* 1 0.13 Yes
A69-1601-45294 PR 25.5 53628 38 48 48 2489* 1 0.11 Yes
A69-1601-45297 PR 22 22067 39 46 51 3880* 0.9 0.11 Yes
A69-1601-45273 PR 20.5 14826 36 38 44 3098* 0.86 0.09 Yes
A69-1601-45308 FR 20 6491 30 34 175 898 0.19 0.08 Yes Yes 7 No
Green et al.: Lionfish home range and movement drivers
A69-1601-45323 PR 21.5 22615 36 30 30 1617* 1 0.07 Yes
A69-1601-45298 PR 23 9830 38 25 26 2624* 0.96 0.06 Yes
A69-1601-45275 PR 21.5 1222 32 14 23 964 0.61 0.03 Yes
A69-1601-45312 PR 18 1572 12 12 12 470 1 0.03 Yes
A69-1601-45280 PR 18.2 1086 17 10 10 349 1 0.02 Yes Yes 0 No
A69-9006-1700s FR 25.5 10247 32 8 8 893 1 0.02 Yes Yes 7 No
A69-1601-45309 PR 24.5 7994 30 8 8 726 1 0.02 Yes
A69-9006-1688s FR 24 459 33 5 5 − − − No Yes 5 No
A69-1601-45315 PR 23 599 19 3 3 − − − No Yes 0 No
A69-1601-45318 FR 20.5 14 4 2 2 − − − No Yes 0 No
A69-9006-1690s FR 35 139 11 2 2 − − − No Yes 2 No
A69-9006-1694s FR 24.5 408 12 2 2 − − − No Yes 2 No
A69-9006-1696s FR 26.5 501 38 2 2 − − − No Yes 2 No
A69-1601-45295 PR 19 369 30 2 2 − − − No
123
A69-1601-45296 PR 25 89 12 1 1 − − − No Yes 0 No124 Mar Ecol Prog Ser 673: 117–134, 2021
2.3.3. Residency events of tagged lionfish (i.e. long-distance move-
ments faster than expected for this species).
For both scenarios (i.e. high survival and low sur-
vival) we calculated 2 different residency indices
(RIs) to indicate individual presence within the re- 2.3.5. Rates and drivers of movement
ceiver array (i.e. study area) through time. The first,
hereafter referred to as the ‘detection RI’, was de- For lionfish detected on 8 or more days at any time
fined as the number of unique days with detections following release, we estimated activity levels, quan-
(including the release day) divided by the number of tified as rates of movement. Rates of movement were
days between the first and last detection. The second calculated as the speed (m s−1) of movements over
RI was referred to as the ‘tag-life RI’ and was calcu- the course of at least 1 h when detected consecu-
lated as the number of unique days detected divided tively at 10 min intervals (i.e. at least 6 intervals of
by either the number of days expected in the battery 10 min had to be included). To calculate speed, we
life of the tag (e.g. 365 d for sensor tags), the number first estimated average location for each fish every
of days in the study period (e.g. the study period was 10 min as centers of activity (COAs; Simpfendorfer et
420 d, i.e. shorter than the battery life of non-sensor al. 2002). COAs are calculated by taking the mean
tags), or number of days until the tag was deemed position of all detections from receiver locations dur-
dead/dropped, whichever option was shorter in dura- ing a specified time interval, providing an estimated
tion. Both indices required at least 2 detections in a location during each period which helps account for
day to be considered present to reduce the possible receivers with overlapping detection ranges (i.e.
inclusion of false detections (Simpfendorfer et al. pseudo-replication from multiple receivers detecting
2015). Two RIs were used because they provide dif- singular transmissions) and drift in receiver clocks.
ferent representations of presence within the array; The distances (in m) between each consecutive COA
for example, detection RI provides information relat- location (every 10 min) were then added together
ing to presence only during the period in which an and the sum was divided by the total time and con-
individual is using areas with receivers, whereas tag- verted to m s−1. Acceleration values from the 2 trans-
life RI incorporates absence after the animal was last mitters with acceptable acceleration data (i.e. regis-
detected within the array area. tering > 0.1 m s−2, indicative of movement of live fish;
Fig. S1 in the Supplement) were averaged each
10 min to compare with rates of movement estimated
2.3.4. Long-distance movements from COA positions over time, although it should be
noted that these metrics represent different aspects
We evaluated the relationship between lionfish of activity (e.g. longer-term speed [rates of move-
size (TL) and maximum distance moved (i.e. from ment] vs. shorter-term acceleration).
release location) via linear regression. We also Next, we created 2 linear mixed effects models
summarized spatial trends in the timing and location (LMMs; i.e. with Gaussian distributions) to determine
of movements for fish that traveled ≥ 1 km from their whether rates of movement were influenced by bio-
release location (considered ‘long-distance move- logical and environmental factors: one model for rate
ment’ based on existing knowledge of lionfish move- of movement under the low survival scenario and a
ment patterns). These movements were examined second model for movement under the high survival
qualitatively in relation to time of year and lunar scenario. We checked our response data (rates of
phases to explore the possibility of spawning- (or movement) for each model for normal distribution and
feeding)-related movement cues tied to moon phase, homogeneity of residuals prior to analysis, and log-
as for other reef fishes (Nemeth 2009). We calculated transformed when necessary. We included in each
speed during these movements based on the sum of model the following explanatory variables, which
distances between the last position before a long-dis- were all present in model selection explorations (i.e.
tance movement and the first position in the new present in at least 1 model with the difference in cor-
area of detection (divided by the sum of durations rected Akaike's information criterion ΔAICc < 2): diel
between the long-distance detections). As the path- period (dawn, day, dusk, night), moon phase (new,
way of movement between receivers is unclear, this waxing, full, waning), capture location (fringing or
rate, calculated as a straight line, likely reflects the patch reef), TL of the individual, and water tempera-
minimum speed that individuals traveled. This met- ture. Dawn and dusk diel periods were defined as the
ric was also used to explore possible predation hourly periods on each side of sunrise and sunset, re-Green et al.: Lionfish home range and movement drivers 125
spectively, which were calculated locally using the R terson 2020), which typically used the same approach
package ‘maptools’ (Bivand & Lewin-Koh 2019). Day to estimate home range sizes. The locations used for
and night diel periods consisted of the time post-sun- KDEs were estimated from 30 min COAs, which rep-
rise/pre-sunset and post-sunset/pre-sunrise, respec- resent the average location where individuals were
tively. Rate of movement estimates were only retained present every 30 min (Simpfendorfer et al. 2002). We
for analysis when they occurred fully within a diel pe- selected UDs at 50 and 95% to represent the core use
riod (i.e. not between 2 different diel periods). Moon areas and extent of space use, respectively. We se-
phases were designated using the R package ‘lunar’ lected a smoothing factor (h) of 50 for UD estimates
(Lazaridis 2014). Water temperature was measured after fitting different smoothers to visually optimize
hourly within the center of the tagging area (16 m contour levels (e.g. values that were too high overesti-
depth; U22-001 HOBO® Water Temp Pro v2; Onset mated receiver detection ranges as demonstrated by
Computer; Fig. 1), and all measurements were aver- overlapping with adjacent ‘unused’ receivers; values
aged during each corresponding period in which that were too low underestimated expected detection
rates of movement were estimated. The R package ranges and resulted in highly disjointed polygons) as
‘nlme’ (Pinheiro et al. 2019) was used to run LMMs suggested by Calenge (2006). We used a paired t-test
with transmitter ID as a random variable and a first- to test for differences between the home range size for
order auto-correlation structure built in to account for each individual generated from the high survival and
serially auto-correlated data. Correlation among ex- low survival scenarios for 50 and 95% UDs separately.
planatory variables was tested using variance inflation We also constructed separate general linear models
factors (R package ‘car’; Fox & Weisberg 2019), which (GLMs) for high survival and low survival scenarios to
indicated no issues (i.e. variance inflation factor ≤ 3). test if the TL (in cm) of lionfish and the number of days
We also included an interaction effect between diel each fish was detected (2 explanatory variables) af-
period and water temperature because we predicted fected home range size as estimated by the size of 50
temperature may influence rates of movement differ- and 95% UDs separately (response variables). Data
entially depending on the activities lionfish conduct were assessed for normality and homoscedasticity as
(i.e. crepuscular feeding vs. mid-day resting) and described above. Finally, we plotted UDs to show spe-
after preliminary data exploration indicated it was cific areas used, as well as overlap among individuals.
contributory. We also conducted a similar LMM with
the 10 min mean acceleration sensor data (excluding
size and habitat because there were only 2 individu- 3. RESULTS
als) for comparison. Differences were considered sig-
nificant when p < 0.05. We tracked 35 tagged lionfish ranging in size from
18 to 35 cm TL (23.07 ± 3.62 cm TL; mean ± SD) from
20 March 2018 to 15 May 2019 (14 mo) over an area
2.3.6. Home range size of approximately 35.6 km2 (Table 2, Fig. 2). Fish with
V9 tags were 22.1 ± 2.91 cm TL (range = 18−30.3 cm
We quantified home ranges by kernel density esti- TL) and fish with V9AP tags were 27.1 ± 3.74 cm TL
mates (KDEs) using the package ‘adehabitatHR’ (range = 24−35 cm TL) (Table 1). After initial data fil-
(Calenge 2006) for both high and low survival scenar- tering, the high survival scenario included 1 417 695
ios. The KDE approach was selected over others such detections from 32 individuals (27 initially tagged on
as Brownian bridge movement models, which incor- patch reefs and 5 on fringing reefs), and the low sur-
porate movement corridors in space use estimates vival scenario included 1 005 667 detections from 24
(e.g. Becker et al. 2016), because the majority of re- individuals (21 tagged on patch reefs and 3 on fring-
ceivers were located south of Buck Island in a rela- ing reefs; Table 2). The mean (± SD) water tempera-
tively small area with overlapping detection ranges, ture within the main receiver cluster was 27.6 ± 0.9°C
negating the utility of movement corridors. The re- (range: 26.0−29.4°C)
maining receivers were sparsely arranged over a
large area, which also made it difficult to identify
pathways between receivers, especially when time 3.1. Residency and long-distance movements
differences were large. In general, we found the KDE
approach to be more robust to uncertainty in lionfish Lionfish were highly resident within the BIRNM
locations between detections and also more readily array during their detection periods (i.e. number of
comparable to other lionfish studies (e.g. Dahl & Pat- days between first and last detection), with a mean126 Mar Ecol Prog Ser 673: 117–134, 2021
detection RI of 0.86 (SD: 0.23; range: 0.19−1) for the representing mesophotic reef habitats > 40 m depth.
high survival scenario, and with individuals being There was no discernible pattern of drivers for these
detected for up to 416 d (Table 2). The mean tag-life movements relative to time of year, although almost
RI (i.e. detection days relative to expected duration of half of these movements (6 of 13 fish; Fig. 4) occurred
tag battery life, study period, or period that the indi- during the waning phase of the moon and during
vidual was deemed alive) was 0.36 (SD: 0.31; range: summer months (7 of 13 fish from May to September;
0.02−0.99) for the high survival scenario (Table 2). Fig. 4). Among individuals that made long distance
Nineteen of the 32 individuals (59%) for the high sur- movements (>1 km from tagging site), we estimated
vival scenario remained within the primary tagging maximum average speed to be 0.26 m s−1 during a 2 h
area throughout their detection periods, while the period (ID 45279), which is within the range ob-
remaining 13 fish (41%) moved into other adjacent served from visual observations of the species while
habitats or made long-distance movements within in transit between habitats (Green et al. 2011). There
the BIRNM array. was no relationship between maximum distance
Maximum distances traveled varied greatly among detected from the release location and lionfish size
tagged fish, with 22 individuals (63%) moving 1 km from the main study array to several 3.2. Rates and drivers of movement
different locations within the greater BIRNM array
(mean ± SD long-distance movement: 3.4 ± 2.3 km; Tagged lionfish movement speeds averaged
Fig. 3). The maximum distance any fish traveled ~0.051 m s−1 (high survival) and ~0.063 m s−1 (low sur-
within the BIRNM array from the location of tagging vival; Table 3) across the study period; these rates dif-
was ~10 km, which occurred during an 11 d period fered significantly among diel periods (high survival:
(Fig. 3; ID 45297). Of the 13 individuals making long- F3,10741 = 399.4, p < 0.001; low survival: F3, 8475 = 426.0,
distance movements, 9 individuals traveled up to p < 0.001) and were highest during dawn (high: mean
3 km after leaving the primary tagging area, 2 trav- ± SD: 0.091 ± 0.047 m s−1, low: 0.098 ± 0.045 m s−1) and
eled between 3 and 5 km, and 2 traveled > 5 km dusk (high: 0.074 ± 0.043 m s−1, low: 0.081 ± 0.041 m
(Fig. 3). Long-distance movements occurred in a s−1) compared to day (high: 0.069 ± 0.052 m s−1, low:
variety of directions; 6 individuals exhibited west- 0.077 ± 0.053 m s−1) and night (high: 0.052 ± 0.036 m
ward movements, 2 moved to the southwest, 4 indi- s−1, low: 0.057 ± 0.037 m s−1) in both survival scenarios
viduals moved to the northeast of the BIRNM array, (Fig. 4). Additionally, temperature interacted with diel
and 1 traveled to the southeast (Fig. 3). The majority periods (high survival: F3,10741 = 40.4, p < 0.001; low
of these movements were towards receiver locations survival: F3, 8475 = 12.6, p < 0.001), in which rates of
along the insular shelf edge in northern St. Croix movement at night decreased with temperature,
Fig. 3. Summary of long-distance movements (>1 km from location of tagging) by invasive lionfish tracked within the 35 km2
BIRNM acoustic array off St. Croix, USVI. Arrows indicate the direction of travel, as well as different areas in which individ-
uals were detected during these movements. These data did not include detections on adjacent receivers < 200 m for simplifi-
cation. Minimum speed was calculated based on the sum of distances and durations between each movement segment (i.e.
each line/arrow combination)Green et al.: Lionfish home range and movement drivers 127
Fig. 4. Effects of (a,b) time of day and (c,d) temperature by time of day on mean rates of movement for high (a,c) and low (b,d)
survival scenarios for invasive lionfish tracked within the 35 km2 BIRNM acoustic array off St. Croix, USVI. Black lines sur-
rounded by shaded areas (continuous variables) and points with error bars (discrete variables) represent the pointwise 95%
confidence band of fitted values based on standard errors, respectively, from LMMs. Vertical lines (rug-plot) above x-axis (in
c and d) represent observations recorded at different temperatures
whereas other periods typically remained consistent with home range extent (i.e. 95% UDs) ranging from
(Fig. 4). While limited to only 2 individuals with sen- 48 373 to 379 163 m2 and 50 164 to 379 163 m2 for
sors, diel acceleration trends were similar to rates of the high and low survival scenarios, respectively
movement identified above (i.e. activity highest at (Table 1). Mean home range estimates were larger
dawn/dusk, lowest at night). Also, night activity levels for the low survival scenario (95% UD mean ± SD:
remained constant across water temperatures, unlike 121 512 ± 67 037 m2; 50% UD: 23 848 ± 10 293 m2) rel-
other diel periods in which water temperature was ative to the high survival scenario (95% UD mean ±
positively associated with acceleration (Fig. S2 in the SD: 105 588 ± 66 398 m2; 50% UD: 21 320 ± 10 459 m2;
Supplement). Interestingly, lionfish size, habitat type, Fig. 5, Table 3); however, estimates for the 2 scena-
and moon phase were not significant drivers of rates rios were not significantly different from one another
of movement (p > 0.05; Fig. S3). (95% UD: t = 0.59, df = 24, p = 0.56; 50% UD: t = 0.49,
df = 24, p = 0.63). Most individuals remained near
where they were tagged and released, as demon-
3.3. Home range size strated by the high overlap in home range in the pri-
mary tagging area (e.g. up to 22 individuals within
Home range size and location varied greatly among overlapping 95% UDs of high survival scenario;
lionfish, but was far greater than observed previously, Fig. 6). Estimates of 50 and 95% UD were highly cor-128 Mar Ecol Prog Ser 673: 117–134, 2021
Table 3. Summary of rates of movement (m s−1) and 50 and 95% home range sizes for individual lionfish reported for both high
and low survival scenarios. UD: utilization distribution; COA: center of activity. Metrics for low survival scenarios were not
calculated for some individuals (i.e. blank cells) because of low sample size
Transmitter Rate of movement 50% UD (m2) 95% UD (m2)
High survival Low survival High survival Low survival High Low
No. Rate No. Rate No. UD No. UD UD UD
consecutive consecutive COA COA
movements movements locations locations
A69-1601-45311 1555 0.087 1555 0.087 14041 61669 14041 61669 379163 379163
A69-1601-45302 1310 0.020 383 0.050 16407 11435 3923 13326 52647 66516
A69-1601-45305 1710 0.009 129 0.083 16370 11448 1251 20383 53905 87098
A69-1601-45278 2019 0.007 17083 11245 49646
A69-1601-45301 400 0.043 42 0.086 5666 13435 365 15073 64734 92219
A69-1601-45306 195 0.029 195 0.029 4017 13835 3433 14448 65512 66868
A69-1601-45282 1283 0.056 1283 0.056 9840 15831 9840 15831 82228 82228
A69-1601-45299 1213 0.060 1213 0.060 10531 25406 10531 25406 117322 117322
A69-1601-45310 430 0.064 5673 14944 65094
A69-9006-1698s 904 0.041 904 0.041 7661 36619 7661 36619 211269 211269
A69-1601-45300 801 0.010 6964 11028 48373
A69-1601-45281 469 0.071 469 0.071 3971 30537 3971 30537 188651 188651
A69-1601-45276 40 0.055 1574 21690 81009
A69-1601-45322 56 0.048 56 0.048 1690 14111 1690 14111 68629 68629
A69-1601-45304 264 0.054 264 0.054 3177 17251 3177 17251 74378 74378
A69-9006-1692s 432 0.039 432 0.039 4232 30810 4232 30810 182679 182679
A69-1601-45274 529 0.075 529 0.075 4017 28380 4017 28380 125835 125835
A69-1601-45303 13 0.030 1091 12683 57931
A69-1601-45307 376 0.095 376 0.095 3076 25323 3076 25323 125911 125911
A69-1601-45277 343 0.060 337 0.060 2926 29144 2439 21950 147554 107770
A69-1601-45279 304 0.086 304 0.086 2427 19535 2427 19535 86980 86980
A69-1601-45294 296 0.081 296 0.081 2084 27527 2084 27527 117299 117299
A69-1601-45297 230 0.082 230 0.082 1597 22161 1597 22161 99526 99526
A69-1601-45273 125 0.076 125 0.076 1025 33302 1025 33302 163916 163916
A69-1601-45308 111 0.049 966 12835 62171
A69-1601-45323 159 0.085 159 0.085 1301 22793 1301 22793 118580 118580
A69-1601-45298 108 0.088 108 0.088 942 25013 942 25013 111363 111363
A69-1601-45275 5 0.000 5 0.000 191 10960 191 10960 50164 50164
A69-1601-45312 24 0.014 24 0.014 335 22601 335 22601 108430 108430
A69-1601-45280 13 0.047 93 18769 76599
A69-9006-1700s 40 0.046 270 13310 61367
A69-1601-45309 47 0.070 47 0.070 310 16615 358 17343 79980 83495
related in both low and high survival scenarios (> 0.97
Pearson correlation coefficient); we therefore only
tested for differences in 95% UD as a function of lion-
fish size and the time (days) spent within the array.
For the high survival scenario, neither size nor time in
the array significantly explained differences in 95%
Fig. 5. Summaries of home range size (50 and 95% utilization
distributions [UDs]) reported for (a) high and (b) low lionfish
survival scenarios. Black points represent estimates for each
individual. The distal ends of boxplot whiskers represent the
smallest and largest values that are 1.5 times the inter-quar-
tile range, the hinges (i.e. ends of boxes) represent the 25th
and 75th percentiles, and the inner horizontal line represents
the median. There were no statistically significant differ-
ences between the 2 scenarios for both UD levelsGreen et al.: Lionfish home range and movement drivers 129
150 d, and with a maximum cumula-
tive distance of approximately 10 km.
Our results suggest that lionfish
movement has been largely underes-
timated by past studies, likely due to
constraints on the area over which
previous visual tagging and acoustic
studies have taken place, and the
duration over which detections have
been collected. The presence of a
large acoustic array in BIRNM cover-
ing more than 35 km2 allowed us to
complete the largest-scale examina-
tion of lionfish movement to date.
Indeed, the full scale of a species’
movement is only revealed by study-
ing an area that exceeds its home
range size over a period that cap-
tures important ontogenetic or sea-
sonal shifts in habitat use, indicating
the importance of maintaining large
acoustic arrays. A growing number of
telemetry studies are taking advan-
tage of this array to study the move-
ment ecology of species with varied
life histories and trophic roles, includ-
ing sea turtles, sharks, and barra-
cuda. We suggest that future studies
Fig. 6. Estimated (a) 50% and (b) 95% home ranges (utilization distributions)
that incorporate native predators with
for individual lionfish tracked within BIRNM off St. Croix, USVI, based on the
high survival scenario. The color gradient represents the number of individu- similar ecologies to lionfish (e.g.
als with overlapping home ranges groupers and moray eels) could shed
additional light on the extent of spa-
UD size, whereas the size of 95% UDs was positively tial overlap and potential mechanisms governing
associated with a greater number of days detected in competition with this invasive taxon.
the array for the low survival scenario (F1, 24 = 2.519, Several features of our data and analyses increase
p = 0.020; Fig. S4 in the Supplement). our confidence that the long-distance movements we
observed are attributed to lionfish movement, as
opposed to movements by lionfish predators (i.e. a
4. DISCUSSION tagged fish being ingested and tag retained by pred-
ator). First, there is no evidence that average speeds
Our study reveals that while home range size and (interpreted as the minimum distance traveled) dur-
maximum distance traveled by invasive lionfish can ing the movements exceeded estimates of lionfish
vary greatly among individuals, it is at least 3 times swimming speed from previous work (e.g. Green et
larger than the largest home range previously re- al. 2011). Second, we expect that transmitters would
ported for the species (here, 0.379 versus 0.126 km2 pass through the digestive system of a predator or be
of Bacheler et al. 2015; Table 1). Moreover, we regurgitated relatively quickly. For example, Brunn-
found that lionfish travel greater distances than pre- schweiler (2009) estimated retention of hand-fed tags
viously recorded. For example, Dahl & Patterson (placed inside a dead fish) larger than those used in
(2020) found that the maximum distance traveled this study to be between 0 and 17 d (mean ~8 d) in
by lionfish across reef environments did not exceed 7 bull sharks Carcharinus leucas. Further, complete
2 km (the spatial limit of their array), while we doc- evacuation of food items from the stomach is esti-
umented ~40% of lionfish traveling >1 km from mated to take < 41 h in lemon sharks Negaprion bre-
their initial capture location during periods up to virostris (Wetherbee et al. 1990). Yet following the130 Mar Ecol Prog Ser 673: 117–134, 2021 long-distance movements observed in our study, we ranges, and advances in acoustic tagging technology observed subsequent movements that extended past facilitating inclusion of smaller individuals in track- a 10 d period for at least 6 individuals, indicating that ing studies, would help us to begin testing these these tags were not stationary/expelled and were alternative hypotheses. likely not within the gut of a predator. As described Variation in home range sizes and long-distance above, Dahl & Patterson (2020) observed movements movements among lionfish may be partially ex- from tagged lionfish up to 2 km from tagging loca- plained by differences in the quality and structure of tions which showed no patterns of being predated. the habitat types used (Nemtzov 1997, Saïd et al. Incorporating transmitters with additional predation 2009). In other species, habitat quality has been sensors (Weinz et al. 2020) would allow future studies shown to directly affect the size of an animal’s home to concretely distinguish between migration and pre- range, due to factors such as availability and compe- dation events. tition for food resources (e.g. McLoughlin et al. 2000, Van Beest et al. (2011) suggested factors that affect Schradin et al. 2010). Approximately 60% of the fish intraspecific home range variation included body tracked in this study were only detected in the main mass, age, reproductive status, resource availability tagging area, and those that did move into adjacent (e.g. for foraging), and temperature. Typically, home habitats or made long-distance movements within range size depends upon body mass as a function of the BIRNM array (Fig. 3) typically did so after several metabolic rate, with larger individuals maintaining months of high residency. The continued use of this larger home ranges (Ofstad et al. 2016). In this study, relatively large area (~0.5 km2), often with high fish size (TL) was not related to home range size or spatial overlap (e.g. up to 22 individuals, 95% UDs), maximum distance traveled. However, our transmit- suggests that adequate resources were available. ters were limited to lionfish >18 cm TL. Reproductive Nevertheless, many individuals were not detected size for Caribbean lionfish is 10 cm TL for males and throughout the battery life of the transmitters, indica- 18.9−19 cm TL for females (Morris 2009, Gardner et ting either movements to areas outside the range of al. 2015). Given that all lionfish in our study were the receivers or mortality/predation events (see above this size, we may not have captured general below). Therefore, there are likely additional drivers differences in movement and home range between influencing habitat use in this study. reproductive and immature portions of the population. The majority of lionfish were tagged within patch However, it is possible that the long-distance reefs, which likely represent smaller pockets of high- movements we observed are linked to individuals quality habitat (i.e. access to prey and shelter from engaging in reproductive behavior, which can be predators) surrounded by unsuitable sandy habitat. sustained throughout the year in regions (such as St. Compared to continuous reef habitat, individuals Croix) when environmental conditions are favorable inhabiting patch reefs may need to travel greater dis- (Morris & Whitfield 2009, Morris et al. 2011). In par- tances to access resources over time as they become ticular, cues for and constraints on reproduction re- limiting (Tamburello & Côté 2015). The relatively low lated to variation in water temperature and day number of lionfish tagged on the fringing reef habitat length across seasons are greatly dampened in lower with sufficient data to be included in the study (3 and latitude regions like the US Virgin Islands compared 5 fish within low and high survival scenarios, respec- with sub-tropical reef environments occupied by the tively) compared to patch reefs (21 and 27 fish, species in the Bahamas, Northern Gulf of Mexico, respectively) precluded a thorough comparison of and US Atlantic coast. Reduced environmental varia- movement between the 2 groups. Nevertheless, tion (e.g. in terms of seawater temperature; range: home ranges (50% UD, high survival) and rates of 26.0−29.4°C) in our study region may explain why movement (high survival) were typically larger on we did not observe clear seasonal or lunar patterns patch reefs (mean values, respectively: 22 884 m2 and relative to long-distance movements. Alternatively, it 0.055 m s−1) compared to continuous reefs (mean val- may be that the venomous dorsal spines of lionfish ues, respectively: 12 874 m2 and 0.039 m s−1) support- afford protection to size classes that would otherwise ing the possibility of limited resources on patch reefs. be more vulnerable to predation, reducing the poten- Goodbody-Gringley et al. (2019) found a strong po- tial for ontogenetic shifts in home range size seen in sitive correlation, albeit influenced by water tempera- other reef fish species. Additional studies of move- ture, between lionfish density on mesophotic reefs ment involving similar large-scale, long-term track- and prey fish density and biomass. As a result, move- ing in higher latitude regions with greater seasonal ment patterns may be driven more by prey abundance environmental variation and in the species’ home than competition and may also help explain why
Green et al.: Lionfish home range and movement drivers                                  131

some individuals made long-distance movements to-                use patterns is needed to further understand the spe-
wards the insular shelf and mesophotic reefs around              cific cues driving activity patterns.
BIRNM. Lionfish making these long-distance journeys                 We incorporated the possibility of tagged lionfish
either west or east around Buck Island to the insular            suffering a mortality event (or shed tag) via the low
shelf edge (Fig. 3) would pass through a variety of              survival scenario to explore whether differences in in-
habitat types including seagrass meadows inter-                  terpretation of behavior resulted. This is a common
spersed with sandy barrens, patch reef, hardbottom               concern in acoustic telemetry research, since ~50% of
habitat dominated by large sponges, and high-profile             recent studies did not consider the possibility of mor-
patch reef. Further work is needed to quantify fine-             tality, although it is estimated to occur on average in
scale habitat selection in this study area, as well as           at least 11% of tagged individuals (Klinard & Matley
drivers of habitat connectivity and the mechanisms               2020). Despite shorter detection periods for several in-
influencing large-scale movements.                               dividuals in the low survival scenario, comparisons of
   Despite uncertainty in specific drivers of home               home range, rates of movement, and long-distance
range size and long-distance movements, there were               movements between scenarios typically only differed
clear patterns influencing lionfish activity. Rates of           by small amounts (Table 4). This is not surprising
movement and acceleration estimates were highest                 given that individuals demonstrating restricted move-
during dawn and dusk periods. These periods often                ments were consistently resident in the same area (i.e.
afford the greatest access to food (i.e. increased forag-        high survival detections/individuals were not more
ing activity) or may represent transitioning periods             mobile than low survival detections/individuals). We
between resting and foraging locations (Green et al.             assumed that the high survival scenario would
2011, Benkwitt 2016). McCallister et al. (2018) simi-            provide lower estimates of home range size and rates
larly found that acoustically tracked lionfish in the            of movement since highly sedentary transmitters (po-
Florida Keys were most active during crepuscular                 tential shed tags or dead individuals) were included
periods. Lionfish are relatively inactive unless forag-          in the movement analyses. This trend was consistent
ing (Green et al. 2011, Cure et al. 2012); therefore, in-        with our prediction, but the differences were limited
creased activity during these periods is most likely             due to the reason explained above. Again, it is not
due to peak foraging behavior. Diurnal and nocturnal             clear which scenario best represented the detection
locations are often different (McCallister et al. 2018,          history of living individuals, due to the resident
Dahl & Patterson 2020), indicating that fish may tran-           nature of at least part of the lionfish population (Tam-
sition between habitats, as a result of foraging bouts.          burello & Côte 2015, Dahl & Patterson 2020), as well
   Water temperature also influenced activity pat-               as the relatively high detection range in the study
terns in this study, as demonstrated by its interaction          area. However, estimates of high and low survival
with diel periods. Night activity trends relative to             scenarios for more mobile species might produce
water temperature were often dis-
tinct from other diel periods; specifi-       Table 4. Comparison of high and low survival scenarios for the home range
                                              and movement metrics quantified in this study; ns: not statistically significant
cally, there appeared to be no influ-
                                                    at α = 0.05. ROM: rate of movement; UD: utilization distribution
ence of temperature on acceleration
estimates and a negative influence of
                                               Variable                                 High            Low       High vs.
temperature on rates of movement.
                                                                                      survival       survival        Low
We hypothesize that these differences                                                                               result
reflect the relative inactivity of lion-
fish during the night, resulting in less       Number of fish                             32             23         H>L
                                               Number of detections                   1417695        1005667        H>L
thermally coupled behaviors (Sey-
                                               Mean residency index                  0.86 ± 0.23    0.92 ± 0.16     H
132 Mar Ecol Prog Ser 673: 117–134, 2021
more distinct differences among survival scenarios. downloading and transfer. We also thank Caribbean Sea
Regardless, these estimates provide lower and upper Adventures, St. Croix Ultimate Bluewater Adventures
(SCUBA), and Dive Experience logistic and personnel sup-
ranges in values for ecologically relevant behavioral port for this research. Funding for this research was pro-
metrics for future comparison, and do not bias findings vided by the Virgin Islands Established Program to Stimu-
of long-distance movements. late Competitive Research (VI-EPSCoR) through NSF Grant
We suggest that lionfish control programs could 1355437, Gulf Research Program Disaster Recovery Grant
2000009518, NSERC Discovery Grant RGPIN-2018-05712,
benefit substantially from accounting for maximum
and an Association of Marine Laboratories of the Caribbean
lionfish home range size, movement rates, and pat- student-in-aid grant. This research was conducted under
terns of directional movement in identifying the loca- UVI Institutional Animal Care and Use Committee permit
tion and spatial coverage of target areas for culling. 949107 and National Park Service research permits BUIS-
00072 and BUIS-2016-SCI-0004. This is contribution num-
In particular, high rates of recolonization have been
ber 234 from the University of the Virgin Islands, Center for
reported in studies of lionfish removal on reefs that Marine and Environmental Studies. R code for our move-
are larger than the majority of previous home range ment and home range analyses are available at https://
estimates (i.e. 2500 m2; Green et al. 2015) and spaced github.com/CHANGE-Lab.
apart at distances greater than early estimates of
movement for the species (i.e. > 500 m; Smith et al. LITERATURE CITED
2017). Our study shows that lionfish home range is
highly variable, but likely far greater than estimated Akins JL, Morris JA, Green SJ (2014) In situ tagging tech-
previously, confirming that local management (in nique for fishes provides insight into growth and move-
ment of invasive lionfish. Ecol Evol 4:3768−3777
terms of culling) is likely to be affected by recoloniza-
Albins MA (2013) Effects of invasive Pacific red lionfish
tion from adjacent reefs. Thus, considering the spa- Pterois volitans versus a native predator on Bahamian
tial arrangement and size of focal habitats could coral-reef fish communities. Biol Invasions 15:29−43
assist in limiting recolonization following population Albins MA (2015) Invasive Pacific lionfish Pterois volitans
control, for example by targeting culling activities reduce abundance and species richness of native Baha-
mian coral-reef fishes. Mar Ecol Prog Ser 522:231−243
over priority areas that are least the size of the mean Bacheler NM, Whitfield PE, Muñoz RC, Harrison BB, Harms
home range estimated in our study (i.e. 101 000 m2 or CA, Buckel CA (2015) Movement of invasive adult lion-
~10 ha), or at sites that are isolated from other habi- fish Pterois volitans using telemetry: importance of con-
tats by the radius of circular home range of this size trols to estimate and explain variable detection probabil-
ities. Mar Ecol Prog Ser 527:205−220
(i.e. ~180 m). The relatively common occurrence of Becker SL, Finn JT, Danylchuk AJ, Pollock CG, Hillis-Starr
long-distance dispersal by mature lionfish of up to Z, Lundgren I, Jordaan A (2016) Influence of detection
10 km within a 10 d period also highlights additional history and analytical tools on quantifying spatial ecol-
management obstacles, as new habitats appear to be ogy of a predatory fish in a marine protected area. Mar
Ecol Prog Ser 562:147−161
readily explored by at least a portion of individuals
Benkwitt CE (2015) Non-linear effects of invasive lionfish
occupying a region. Most long-distance movements density on native coral-reef fish communities. Biol Inva-
by lionfish in this study represent transit from shal- sions 17(5):1383–1395
low reef tagging areas to deeper sites at the edge of Benkwitt CE (2016) Invasive lionfish increase activity and
the continental shelf and mesophotic reefs in BIRNM, foraging movements at greater local densities. Mar Ecol
Prog Ser 558:255−266
with no evidence of individuals moving back into Bivand R, Lewin-Koh N (2019) maptools: Tools for handling
shallow areas over the 14 mo study period. While we spatial objects. R package version 0.9-5. https://CRAN.
are not able to ascertain whether fish also move from R-project.org/package=maptools
deep habitats into shallow areas, net movement from Bolden SK (2000) Long-distance movement of a Nassau
grouper (Epinephelus striatus) to a spawning aggrega-
deep to shallow would suggest that culling fre-
tion in the central Bahamas. Fish Bull 98:642−645
quency may need to be even higher to sufficiently Börger L, Dalziel BD, Fryxell JM (2008) Are there general
suppress densities in these areas as a result of migra- mechanisms of animal home range behavior? A review
tion from other habitats. and prospects for future research. Ecol Lett 11:637−650
Brunnschweiler JM (2009) Tracking free-ranging sharks
Acknowledgements. We thank the many volunteer divers with hand-fed intra-gastric acoustic transmitters. Mar
who helped complete field work for this project: Marcia Tay- Freshw Behav Physiol 42:201−209
lor, Jack Downes, Michael Funk, Kim Gillespie, Norm Calenge C (2006) The package adehabitat for the R soft-
Gustafson, Mareike Duffing-Romero, Bonnie Barnes, and ware: a tool for the analysis of space and habitat use by
Gabby Magalski. We thank our partners, especially Zandy animals. Ecol Model 197: 516−519
Hillis-Starr, at the National Park Service for permits to work Chagaris D, Binion-Rock S, Bogdanoff A, Dahl K and others
within park boundaries and providing downloaded data for (2017) An ecosystem-based approach to evaluating im-
the study. Thanks to NPS Bio Sci Techs Nathaniel Hanna pacts and management of invasive lionfish. Fisheries 42:
Holloway and Tessa Code for assistance with telemetry data 421−431You can also read