Patterns of Population Structure for Inshore Bottlenose Dolphins along the Eastern United States
←
→
Page content transcription
If your browser does not render page correctly, please read the page content below
Journal of Heredity 2013:104(6):765–778                                  © The American Genetic Association. 2013. All rights reserved.
doi:10.1093/jhered/est070                                                 For permissions, please e-mail: journals.permissions@oup.com


Patterns of Population Structure for
Inshore Bottlenose Dolphins along the
Eastern United States
Vincent P. Richards, Thomas W. Greig, Patricia A. Fair, Stephen D. McCulloch,
Christine Politz, Ada Natoli, Carlos A. Driscoll, A. Rus Hoelzel, Victor David,
Gregory D. Bossart, and Jose V. Lopez
From the Department of Population Medicine and Diagnostic Sciences, College of Veterinary Medicine, Cornell University,

                                                                                                                                          Downloaded from http://jhered.oxfordjournals.org/ at Cornell University Library on August 10, 2014
Ithaca, NY 14853 (Richards); the Marine Mammal Research and Conservation Program, Harbor Branch Oceanographic
Institute at Florida Atlantic University, Ft. Pierce, FL (Greig and Fair); the National Oceanic and Atmospheric Administration,
Center for Coastal Environmental Health and Biomolecular Research, Charleston, SC (McCulloch, Politz, Driscoll, Bossart,
and Lopez); the School of Biological and Biomedical Sciences, University of Durham, South Road Durham, UK (Natoli
and Hoelzel); the Basic Research Laboratory of Genomic Diversity, National Cancer Institute, Frederick, MD (David);
the Georgia Aquarium, NW Atlanta, GA (Bossart); and the Nova Southeastern University Oceanographic Center, Dania
Beach, FL (Lopez). Ada Natoli is now at the Biology Department, United Arab Emirates University, Al-Ain, Abu Dhabi,
United Arab Emirates.

Address correspondence to Vincent P. Richards at the address above, or e-mail: vpr3@cornell.edu.

Data deposited at Dryad: http://dx.doi.org/10.5061/dryad.v2m91

Abstract
Globally distributed, the bottlenose dolphin (Tursiops truncatus) is found in a range of offshore and coastal habitats. Using
15 microsatellite loci and mtDNA control region sequences, we investigated patterns of genetic differentiation among puta-
tive populations along the eastern US shoreline (the Indian River Lagoon, Florida, and Charleston Harbor, South Carolina)
(microsatellite analyses: n = 125, mtDNA analyses: n = 132). We further utilized the mtDNA to compare these populations
with those from the Northwest Atlantic, Gulf of Mexico, and Caribbean. Results showed strong differentiation among
inshore, alongshore, and offshore habitats (ФST = 0.744). In addition, Bayesian clustering analyses revealed the presence of
2 genetic clusters (populations) within the 250 km Indian River Lagoon. Habitat heterogeneity is likely an important force
diversifying bottlenose dolphin populations through its influence on social behavior and foraging strategy. We propose that
the spatial pattern of genetic variation within the lagoon reflects both its steep longitudinal transition of climate and also its
historical discontinuity and recent connection as part of Intracoastal Waterway development. These findings have important
management implications as they emphasize the role of habitat and the consequence of its modification in shaping bottlenose
dolphin population structure and highlight the possibility of multiple management units existing in discrete inshore habitats
along the entire eastern US shoreline.
Key words: Indian River Lagoon, microsatellite, mtDNA, Tursiops truncatus

Determining population structure in highly mobile organisms           and genetic differentiation, possibly due to complex social
is important for facilitating effective conservation management       behavior and/or habitat specialization. Dolphin habitat is
and advances our understanding of the mechanisms that drive           often described as either “coastal” or “offshore,” and numer-
the evolution of population genetic structure (Hoelzel 1998).         ous studies have detected morphological and genetic differen-
Here, we focus on a marine species with a global geographic           tiation between coastal and offshore habitats for T. truncatus
distribution, the common bottlenose dolphin (Tursiops trunca-         (Hoelzel, Potter, et al. 1998; Natoli et al. 2005; Sellas et al.
tus). Despite this species’ ability for long-range dispersal (Wells   2005; Segura et al. 2006). Furthermore, genetic differentia-
et al. 1990; Wursig and Harris 1990; Defran et al. 1999; Wells        tion has been detected among multiple coastal populations
et al. 1999), populations often show measurable morphological         occupying discrete habitat zones for bottlenose dolphins in

                                                                                                                                  765
Journal of Heredity
general (Natoli et al. 2005; Möller et al. 2007; Rosel et al. 2009; The purpose of our study was to test hypotheses regard-
Mirimin et al. 2011). Coastal habitat can be further subdivided ing patterns of genetic population structure for this species
into inshore and alongshore. Here, we define inshore habi- in the context of habitat variation over a fine geographic
tat as bays, lagoons, sounds, tidal marshes, or estuarine waters scale. To this end, we investigated 2 inshore habitats along
(Leatherwood and Reeves 1983; Sellas et al. 2005) and refer to the eastern US coastline and compared these 2 regions
the remaining coastal habitat as alongshore. Despite the ubiq- with proximate alongshore and offshore populations in the
uity of inshore habitat, little work has been done to investigate Northwest Atlantic, Gulf of Mexico, and Caribbean. The 2
genetic population structure among T. truncatus populations inshore dolphin sample sets studied were from the Indian
occupying this type of habitat. A rare study of this kind was River Lagoon, Florida (IRL), and Charleston Harbor, South
that of Sellas et al. (2005) who found these populations to Carolina and its adjacent estuarine area (CHS) (Figures 1
be highly differentiated. Inshore habitat also has great poten- and 2). The US National Marine Fisheries Service now lists
tial for environmental heterogeneity within the bay or estuary, dolphins in these regions as distinct management stocks:
which increases the potential for fine-scale population subdi- the Indian River Lagoon Estuarine System Stock and the
vision, and studies of Indo-Pacific bottlenose dolphin popu- Charleston Estuarine System Stock (Waring et al. 2010). The
lations (Tursiops aduncus) within Australian embayments have management of cetaceans is a difficult problem as popula-
confirmed these expectations (Krützen, Sherwin, et al. 2004; tions often show complex patterns of sympatry, parapatry,
Downloaded from http://jhered.oxfordjournals.org/ at Cornell University Library on August 10, 2014
Wiszniewski et al. 2010; Ansmann, Parra, Lanyon, et al. 2012). and mixed assembly (Hoelzel 1998). Consequently, genetic
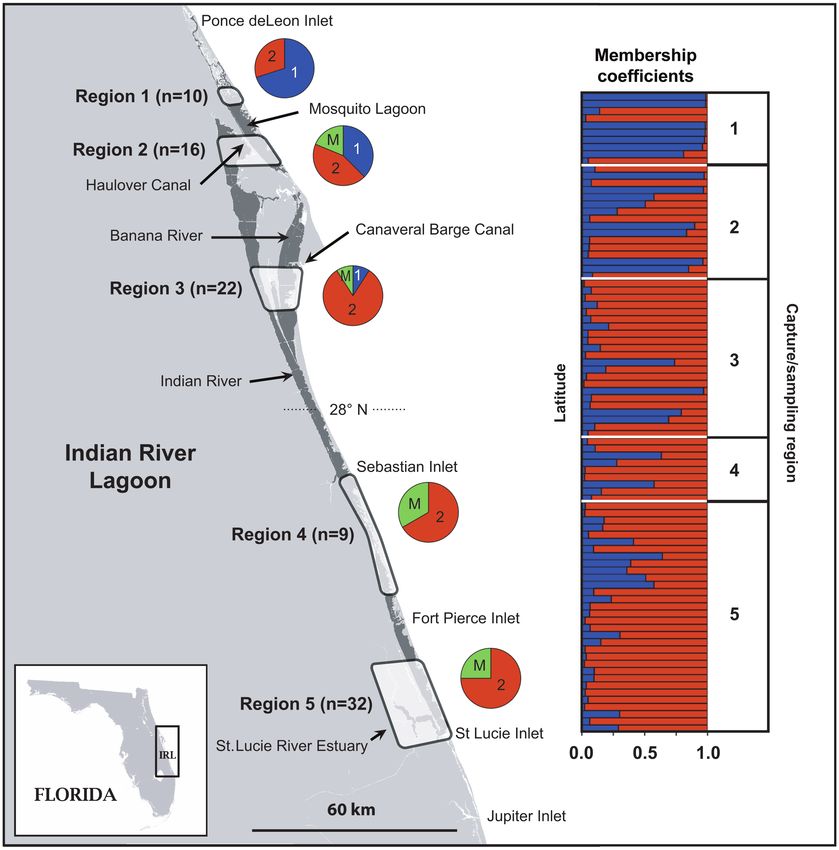
Figure 1 Map of the Indian River Lagoon showing capture/sampling regions (1–5). Membership coefficients (Q) generated by
STRUCTURE for each individual are shown in the bar chart. Each individual is positioned in the chart according to its capture/
sampling latitude (region is shown in column to the right). The distribution of individuals assigned to clusters 1 and 2 for each
region is shown in pie charts (1 = cluster 1, 2 = cluster 2, and M = individuals with mixed ancestry [Q < 0.75]).
766Richards et al. • Bottlenose Dolphin Inshore Differentiation
Bahamas
Charleston Harbor (n = 35) haplotype
Indian River Lagoon (n = 97)
NW Atlantic alongshore (n = 28) H5
Gulf of Mexico - USA (n = 15) H4
Gulf of Mexico - Mexico (n = 34)
USA
Bahamas (n = 68)
Cuba (n = 57)
H1
Puerto Rico (n = 5) H2
US Virgin Islands (n = 1) H3
Downloaded from http://jhered.oxfordjournals.org/ at Cornell University Library on August 10, 2014
Bahamas
Cuba
Puerto Rico
400 km USVI
Mexico
Figure 2 Map showing geographic location of mitochondrial control region sequences used in the statistical parsimony analysis
and the resulting network. Northwest Atlantic offshore haplotypes and haplotypes described as “worldwide form” (Caballero
et al. 2012) were not included in the analysis. Sample sizes are shown top left (also see Table 1). In the network, circles represent
different haplotypes, color indicates geographic sampling location, and size represents frequency of occurrence. Lines connecting
haplotypes represent mutational steps and small black circles represent hypothetical haplotypes that were not sampled. Dashed
lines show haplotype connections considered less likely following criteria based on coalescent theory (Crandall and Templeton
1993). The 5 haplotypes discovered as part of this study are indicated as follows: H1–H5. A single individual sampled in the
Bahamas possessing haplotype H4 is indicated.
population data are valuable for reliable stock identification serve as potential factors shaping population substructure.
and effective management of bottlenose dolphins (Hoelzel In contrast, Charleston Harbor and its adjacent estuarine
1998; Waring et al. 2002), and the data provided here will be area (including the Ashley, Cooper, and Wando Rivers, and
directly applicable to US National Marine Fisheries Service Stono River Estuary), which is about 426 km from the most
management of the Indian River Lagoon Estuarine System northern Indian River Lagoon inlet, is considerably smaller,
Stock and Charleston Estuarine System Stock (Hoelzel 1998; possesses temperate estuaries, and is more accessible to open
Waring et al. 2002). The habitats studied have contrasting bio- ocean. Here, we test the hypothesis that these differences
geographic features. For example, the Indian River Lagoon in habitat will be reflected in differences in the structure
on Florida’s east coast experiences a dynamic range of hydro- of local populations and that the inshore populations will
logic and climatic conditions that has created a highly hetero- be differentiated from each other and from alongshore and
geneous environment possessing resident fauna adapted to offshore populations (as seen in earlier, similar studies in the
both temperate and tropical conditions (White 1970; Steward Gulf of Mexico and Australia).
and VanArman 1987; Gilmore 1995; McRae et al. 1998). The
lagoon is a shallow estuary encompassing approximately
3600 km2 that stretches 250 km from the Jupiter Inlet in the Materials and Methods
south to the Ponce de Leon Inlet in the north (Steward et al.
Sample Collection and DNA Extraction
1994) and is considered one of the most biodiverse estuaries
in North America (Gilmore 1995). Furthermore, in addition Dolphin skin samples were collected using capture–release
to the Indian River, which runs the length of the estuary, the over a 5-year period (1999–2004) under the appropriate
Indian River Lagoon system also includes smaller, less acces- National Marine Fisheries Service (NMFS)/National Oceanic
sible areas, such as the Mosquito Lagoon, Banana River, St. and Atmospheric Administration (NOAA) permits for the
Lucie River, and several tributaries (Figure 1). The lagoon Dolphin Health and Risk Assessment (HERA) Project (see
has only 6 inlets from the Atlantic Ocean, which could Acknowledgments). IRL samples were collected from 5
767Journal of Heredity
subregions of the lagoon system that included the Banana (FDR) procedure of Benjamini and Hochberg (1995) was
River, Mosquito Lagoon, Indian River, and St. Lucie River used to correct for multiple hypothesis testing (FDR = 0.05).
(Figure 1). Charleston Harbor samples included individuals Observed and expected frequencies of heterozygotes were
from the Wando River, and the adjacent Stono River Estuary. calculated using GENETIX v4.03 (Belkhir et al. 1996–2004).
Tissue samples were stored in NaCl-saturated 20% dimethyl Each locus was checked for null alleles, scoring errors, and
sulfoxide (DMSO) (Amos and Hoelzel 1990) at 4 °C. For the large allele dropout using MICRO-CHECKER v2.2.3 (Van
microsatellite analyses, 125 samples were collected (CHS = 36 Oosterhout et al. 2004). The discriminatory power of the
and IRL = 89) (see Figure 1 for the distribution of samples microsatellite data was assessed by calculating the prob-
within the IRL). The CHS samples included 3 from the Wando ability of identity (PI) for the combined set of loci using
River and 10 from the Stono River Estuary. Genomic DNA was GENALEX v6.5 (Peakall and Smouse 2012). PI is an esti-
isolated from skin using Qiagen DNeasy Tissue Kits (Qiagen, mate of the average probability that 2 unrelated individu-
Inc., Valencia, CA) following manufacturer’s instructions for als drawn from the same randomly mating population will
animal tissue. Extracted DNA quality was evaluated by electro- have the same multilocus genotype by chance. To exclude
phoresis on 0.7% agarose gels and quantified by spectropho- the possibility that population structure analyses were influ-
tometer, ND1000 (ThermoScientific, Waltham, MA). enced by the presence of related individuals (i.e., the family
For the mitochondrial analyses, 82 samples were collected affect), we determined whether individuals were more closely
Downloaded from http://jhered.oxfordjournals.org/ at Cornell University Library on August 10, 2014
by capture–release (CHS = 35 and IRL = 47). To these sam- related than expected in a randomly mating population as fol-
ples, we added 11 acquired via biopsy dart and 39 oppor- lows: 1) average pairwise relatedness among CHS and IRL
tunistic samples from dolphin strandings either from within individuals was calculated using the Queller and Goodnight
the Indian River Lagoon proper or from the Atlantic Ocean (1989) relatedness index (r) and 2) the null hypothesis of no
side of the lagoon (n = 3). IRL samples were collected from relatedness was tested by comparing this average to that of a
the same 5 subregions described above. Charleston Harbor null distribution created using IDENTIX v1.1 (Belkhir et al.
samples again included individuals from the Wando River 2002) (1000 permutations).
(n = 7), and the adjacent Stono River Estuary (n = 15). The The number of genetic clusters (K) was estimated by
additional tissue samples were stored in NaCl-saturated 20% performing a Bayesian evaluation of genetic partitioning, as
DMSO (Amos and Hoelzel 1990) at 4 °C. Total genomic implemented in the program STRUCTURE v2.2.3 (Pritchard
DNA was extracted using a standard proteinase K digestion et al. 2000) and then calculating the ad hoc statistic ΔK
for 4 h at 45 °C, followed by 3 phenol/chloroform extrac- (Evanno et al. 2005). ΔK was calculated for K = 1–5 by aver-
tions (Sambrook and Russell 2001). The DNA was then aging 20 Markov chains for each value of K. Length of each
resuspended in Tris–ethylenediaminetetraacetic acid buffer chain was 50 000 steps following an initial burn in of 50 000
and stored at −20 °C. Overlap between the 2 data sets was 49 steps. The admixture ancestry and correlated allele frequency
individuals for the microsatellite data and 10 individuals for models were used. ΔK is a measure of the second-order rate of
the mitochondrial data. Sex of individuals was determined in change of the probability of the data Pr(X|K) for each value
the field for capture–release individuals and strandings. Dart of K. The highest value for ΔK identifies the optimum value of
biopsy samples were sexed using the polymerase chain reac- K, and the method has been shown to perform well when dif-
tion (PCR) test of Rosel (2003). ferentiation among populations is modest (FST ≥ 0.03) (Latch
et al. 2006). However, when hierarchal levels of population
structure exist, this method usually detects the uppermost level
Microsatellite DNA Genotyping and Analysis
of partitioning (Evanno et al. 2005). To estimate the number
Using 18 microsatellite loci, 125 individuals (CHS = 36 and of clusters at the next level of structure (i.e., population sub-
IRL = 89) were genotyped. We employed 14 Tursiops-specific structuring), we repeated the analysis on each of the separate
loci: MK5, MK6, MK8, MK9 (Krützen et al. 2001), Ttr04, genetic clusters identified in the previous run, as suggested by
Ttr11, Ttr19, Ttr34, Ttr48, Ttr58, Ttr63, TtrFF6 (Rosel et al. Pritchard (2007). Final individual membership coefficients (Q)
2005), TexVet5, and TexVet7 (Rooney et al. 1999), and 4 addi- were obtained using a run of 5 000 000 steps with a 20% burn
tional loci from other cetacean species: EV14, EV94 (Valsecchi in at the optimum overall value of K. Individuals with Q ≥ 0.75
and Amos 1996), KWM12a (Hoelzel, Dahlheim, et al. 1998), were considered a member of a cluster.
and PPHO130 (Rosel et al. 1999). Reaction conditions and Estimates of migration rates within the IRL were cal-
methods followed that of Rosel et al. (2009) and consisted of culated using the program MIGRATE version 3.51 (Beerli
25–50 µg of sample DNA in 25 µL reaction volumes. All reac- 2006). Using the Bayesian framework, we estimated param-
tions included both positive and negative controls. Samples eters Θ and m/μ using a chain of 6 000 000 steps with a
were genotyped on an Applied Biosystems 3130 xl Genetic burn in of 2 000 000 steps. Boundaries for uniform prior
Analyzer using the internal size standard GS-Liz 500 and distributions were established empirically via shorter prelimi-
GENEMAPPER v3.7 (Applied Biosystems, Foster City, CA). nary runs. The microsatellite stepwise mutation model was
GENEPOP v4.1 (Rousset 2008) was used to calculate employed.
Weir and Cockerham F-statistics (Weir and Cockerham Spatial genetic structure (SGS) within the IRL was
1984) and perform exact tests for significant population dif- assessed by comparing genetic similarity to spatial distance
ferentiation, Hardy–Weinberg equilibrium, and linkage dis- using GENALEX. Spatial distance was calculated using indi-
equilibrium between all locus pairs. The false discovery rate vidual sampling coordinates. Multilocus genetic distances as
768Richards et al. • Bottlenose Dolphin Inshore Differentiation
described by Smouse and Peakall (1999) were plotted against Northwest Atlantic alongshore (NWAa), and coastal animals
geographic distances between pairs of individuals using the from the Gulf of Mexico (United States of America), the
spatial autocorrelation method of Smouse and Peakall (1999). Gulf of Mexico (Mexico), Bahamas, and Cuba (see Table 1
SGS was calculated at 10 km distance intervals (distance for sample sizes). Significance of Ф statistics was determined
classes) up to 200 km. Significance of the spatial autocorrela- by permuting haplotypes among populations 10 000 times
tion coefficient (r) was tested by constructing a 2-tailed 95% (Excoffier et al. 2005). Molecular diversity indices were calcu-
confidence interval (95% CI) around the null hypothesis of lated using ARLEQUIN. Evolutionary relationships among
no SGS (i.e., r = 0) by performing 999 random permutations inshore/alongshore haplotypes (n = 31) (see Table 1 for indi-
of genotypes among geographic locations. The FDR proce- viduals included) were inferred by constructing an unrooted
dure of Benjamini and Hochberg (1995) was used to correct statistical parsimony network using the method of Templeton
for multiple hypothesis testing (FDR = 0.05). et al. (1992) as implemented in the software package TCS v1.13
We tested for sex-biased dispersal within the IRL, CHS, (Clement et al. 2000). Alignment gaps (indels) were treated
and both regions combined using the assignment method of as a fifth state. Evolutionary relationships among inshore/
Favre et al. (1997) and Mossman and Waser (1999) as imple- alongshore (n = 31) and offshore/worldwide form haplotypes
mented in GENALEX. The method calculates the log-likeli- (n = 25) were inferred by maximum likelihood phylogenetic
hood of an individual’s assignment to its population (in this analysis (see Supplementary Table S1 for accession num-
Downloaded from http://jhered.oxfordjournals.org/ at Cornell University Library on August 10, 2014
case, male or female). Log-likelihoods are corrected using bers). PhyML v3.0 (Guindon et al. 2010) was used to gener-
an assignment index correction (AIc) as follows: individual ate 500 bootstrap replicates using the HKY+I+G substitution
log-likelihood minus mean log-likelihood of the population. model, which was determined as the best fit for the data using
Negative values of AIc indicate individuals with a high prob- MODELTEST v3.7 (Posada and Crandall 1998). A bootstrap
ability of being immigrants. Sex-biased dispersal is inferred consensus tree was constructed using the Triple Construction
if there is significant difference in the frequency distribution Method as implemented in the program TRIPLEC (Ewing
of AIc values for males versus females. et al. 2008). This procedure is based on the observation that the
most probable 3-taxon gene tree consistently matches the spe-
cies tree (Degnan and Rosenberg 2006). The method searches
Mitochondrial DNA Sequencing and Analysis
all input trees for the most frequent of the 3 possible rooted
Using established PCR primers (Rosel et al. 1995), we triples for each set of 3 taxa. Once found, the set of rooted
obtained 296 bp of DNA sequence data from the 5′ end of triples are joined to form the consensus tree using the quartet
the mtDNA control region for 132 individuals (CHS = 35 puzzling heuristic (Strimmer and von Haeseler 1996). The pro-
and IRL = 97). PCR amplification conditions were as follows: cedure has been shown to be a statistically consistent estimator
10–100 ng of genomic DNA, 2 mM deoxyribonucleotide of the species tree topology and to out perform majority rule
triphosphates, 10× PCR buffer (1.5 mM MgCl2), 25 pmol of and greedy consensus methods (Degnan et al. 2009).
each primer, and 0.5 U Taq DNA polymerase. The amplifica- In fulfillment of data archiving guidelines (Baker 2013),
tion reactions followed the profile: 1 cycle at 94 °C for 1 min, we have deposited the primary data underlying these analyses
followed by 30 cycles of 94 °C for 40 s, 53 °C for 1 min, with Dryad (http://datadryad.org).
72 °C for 1 min, and ending with 1 cycle at 72 °C for 30 min.
PCR products were purified with Qiaquick PCR purification
columns (Qiagen) for DNA sequencing. Both forward and Results
reverse strands were sequenced using the BigDye Terminator
Microsatellite Characterization
Cycle Sequencing Kit (Applied Biosystems). Products were
separated and bases called by the Interdisciplinary Center None of the 18 microsatellite loci showed significant devia-
for Biotechnology Research at the University of Florida. tion from Hardy–Weinberg equilibrium (Table 2). However,
Haplotype sequences are available from GenBank (accession 8 loci showed significant linkage disequilibrium (FF6, MK8,
numbers: KF366717–KF366721). EV14, TTR11, MK6, PPHO130, TXVT7, and TTR58) (10
Mitochondrial control region sequences (n = 279) pairwise comparisons). Multiple population events could be
from 11 additional geographic regions were obtained from responsible for this disequilibrium, for example, admixture
GenBank and/or previous publications (Table 1). Including between populations with different allele frequencies (Smith
the Charleston Harbor area and the Indian River Lagoon, et al. 2001), inbreeding (Chakraborty and Weiss 1988), the
these sampling sites represented a range of temperate and founding of populations by a small number of individuals
tropical offshore, alongshore, and inshore habitats. followed by rapid population growth (Sheffield et al. 1998;
Individual sequences were cropped to the same length Shifman and Darvasi 2001), and a relatively small and sta-
(258 bp) and aligned using MAFFT v6.814b (Katoh et al. 2002) ble population size (Hill and Robertson 1968). None of the
as implemented in GENEIOUS PRO v5.5.3 (Drummond loci showed evidence for large allele drop out. However, 3
et al. 2010). Genetic population structure among the fol- loci showed evidence for the presence of null alleles (EV94,
lowing 8 geographic regions was examined by an analysis of MK9, and TTR11). We excluded these 3 loci from all subse-
molecular variance and exact tests of haplotype frequency dif- quent analyses. Rosel et al. (2009) also detected null alleles
ferentiation as implemented in ARLEQUIN v3.11 (Excoffier for EV94. Average pairwise relatedness among CHS and
et al. 2005): CHS, IRL, Northwest Atlantic offshore (NWAo), IRL individuals using the remaining 15 loci was −0.0301
769Journal of Heredity
Table 1 Description of Tursiops truncatus mtDNA samples included in various analyses and population diversity indices
Region N n-pop H h π θS θπ TCS Source
Charleston Harbor (inshore) 35 35 5 0.63 0.0032 0.97 0.81 35 (yellow) 1
Indian River Lagoon (inshore) 97 97 2 0.02 0.0001 0.19 0.02 97 (red) 1
Northwest Atlantic offshore 25 25 11 0.88 0.0224 4.24 5.74 2
(NWAo)
Northwest Atlantic alongshore 28 28 5 0.38 0.0065 2.31 1.68 28 (purple) 2
(NWAa)
Gulf of Mexico (USA): Texas 10 10 (pink) 3
alongshore
Gulf of Mexico (USA): Texas 5 15 9 0.88 0.0113 3.07 2.91 5 (pink) 4
and central/west coast of
Florida, mixed alongshore/
inshore
Gulf of Mexico (Mexico): 40 34 9 0.82 0.0114 1.96 2.95 34 (light blue) 5
inshore ecotype = 34,
worldwide form = 6
Downloaded from http://jhered.oxfordjournals.org/ at Cornell University Library on August 10, 2014
Caribbean, Bahamas: Grand 55 53 (orange) 6
Bahama and Abaco Islands:
alongshore = 53, offshore = 2
Caribbean, Bahamas: Grand 13 66 6 0.72 0.0088 2.71 2.26 13 (orange) 5
Bahama, Abaco Islands, and
New Providence, inshore
ecotype
Caribbean, Cuba: inshore 65 57 5 0.44 0.0079 2.6 2.04 57 (green) 5
ecotype = 57, worldwide
form = 8
Caribbean, Puerto Rico: inshore 26 5 (brown) 5
ecotype = 5, worldwide
form = 21
Caribbean, US Virgin Islands: 1 1 (dark blue) 5
inshore ecotype
Caribbean, Colombia: worldwide 4 5
form
Caribbean, Jamaica: worldwide 1 5
form
Caribbean, Honduras: worldwide 6 5
form
N = total number of samples for each geographic region; n-pop = number of samples included in the analysis of population structure (all alongshore/
inshore samples from the Gulf of Mexico [United States] were pooled, all alongshore [53] and inshore ecotype samples [13] from the Bahamas were pooled);
H = number of haplotypes; h = haplotype diversity; π = nucleotide diversity. θS (Tajima 1989), and θπ (Tajima 1983). The Northwest Atlantic alongshore
samples (NWAa) ranged from Georgia to New Jersey and the offshore samples (NWAo) were collected 160–480 km offshore this same stretch of coastline
(Hoelzel, Potter, et al. 1998). TCS = samples included in statistical parsimony analysis (colors corresponding to those used to indicate geographic sampling
region in Figure 2 are shown in parentheses). 1 = this study, 2 = Hoelzel, Potter, et al. (1998), 3 = Natoli et al. (2004), 4 = Sellas et al. (2005), 5 = Caballero
et al. (2012), and 6 = Parsons et al. (2006). See Caballero et al. (2012) for description of inshore ecotype and worldwide form. Note: according to our delinea-
tion of environments, the sampling location for individuals described as “inshore ecotype” by Caballero et al. (2012) is regarded here as coastal as it is unclear
if any of these animals were located in an inshore environment as we define it.
and −0.0105, respectively, and neither population contained Figure S1b). The same analysis for CHS was not conclusive.
individuals more related than expected in a randomly mating ΔK could not be used due to a drastic drop in the mean
population (CHS: P = 0.059; IRL: P = 0.258). PI was 2.8E- log probability score [Pr(X|K)] for K = 2 relative to K = 1
12, indicating a very low probability that 2 unrelated individu- (Supplementary Figure S1c). The score for K = 3 was also
als would share the same multilocus genotype by chance. lower than the score for K = 1. The score for K = 4 was
slightly higher than for K = 1 and the score for K = 5 slightly
higher still. We performed additional STRUCTURE runs to
Microsatellite Population Structure and Migration Rates
determine if the scores continued to rise for K = 6–8. Results
The Charleston Harbor and Indian River Lagoon popula- showed the scores to decline steadily, with all scores lower
tions were highly differentiated (FST = 0.131, P < 0.0001), than that for K = 1. Consequently, the highest score was for
and the STRUCTURE analysis reflected this differentiation K = 5 followed by K = 4 and then K = 1. Without additional
with a ΔK of 2 (Supplementary Figure S1a). Analysis of samples to further explore these results, we suggest K = 1 as
substructuring for IRL produced a ΔK of 2 (Supplementary the most biologically realistic result.
770Richards et al. • Bottlenose Dolphin Inshore Differentiation
Table 2 Number of alleles, expected and observed heterozygote frequencies, and FIS values for each microsatellite locus within
Charleston Harbor and the Indian River Lagoon for Tursiops truncatus
Locus CHS IRL Locus CHS IRL
EV14 Ttr04
Na 5 6 Na 8 5
HE 0.683 0.649 HE 0.767 0.602
HO 0.611 0.602 HO 0.750 0.618
FIS 0.120 0.078 FIS 0.036 −0.021
EV94 Ttr11
Na 3 2 Na 4 6
HE 0.574 0.487 HE 0.559 0.728
HO 0.417 0.546 HO 0.472 0.607
FIS 0.287 −0.114 FIS 0.169 0.172
TtrFF6 Ttr19
Na 8 7 Na 5 5
HE 0.702 0.649 HE 0.510 0.546
HO 0.694 0.685 HO 0.472 0.598
Downloaded from http://jhered.oxfordjournals.org/ at Cornell University Library on August 10, 2014
FIS 0.025 −0.050 FIS 0.087 −0.090
KWM12a Ttr34
Na 5 6 Na 2 5
HE 0.547 0.467 HE 0.105 0.638
HO 0.686 0.409 HO 0.056 0.682
FIS −0.240 0.130 FIS 0.482 −0.062
MK5 Ttr48
Na 5 4 Na 4 4
HE 0.699 0.604 HE 0.496 0.277
HO 0.667 0.674 HO 0.457 0.291
FIS 0.060 −0.110 FIS 0.093 −0.045
MK6 Ttr58
Na 7 7 Na 4 5
HE 0.738 0.615 HE 0.641 0.594
HO 0.722 0.553 HO 0.611 0.562
FIS 0.036 0.107 FIS 0.060 0.060
MK8 Ttr63
Na 9 5 Na 12 11
HE 0.801 0.632 HE 0.874 0.767
HO 0.750 0.640 HO 0.806 0.809
FIS 0.078 −0.008 FIS 0.093 −0.049
MK9 TexVet5
Na 4 3 Na 4 4
HE 0.436 0.437 HE 0.705 0.400
HO 0.472 0.356 HO 0.657 0.432
FIS −0.070 0.190 FIS 0.082 -0.073
PPHO130 TexVet7
Na 6 5 Na 4 4
HE 0.619 0.638 HE 0.681 0.530
HO 0.543 0.562 HO 0.639 0.466
FIS 0.138 0.126 FIS 0.075 0.127
Na = number of observed alleles; HE = expected heterozygosity; HO = observed heterozygosity. No FIS values were significant after FDR correction (α = 0.05).
For the IRL, the proportion of individuals assigned to significant differentiation between both groupings; however,
the 2 clusters and those with mixed ancestry (Q < 0.75) was the first grouping showed the highest level of differentiation
not evenly distributed in each of the 5 sampling regions (I: FST = 0.0241, P < 0.0001; II: FST = 0.0120, P < 0.0001).
(Figure 1). Individuals assigned to cluster 1 were restricted Using the grouping that showed the highest differentia-
to the 3 northern regions (1–3), whereas individuals assigned tion (I), we additionally explored differentiation between
to cluster 2 occurred in all sampling regions. Individuals IRL regions and CHS as follows: (i) regions 1 and 2 versus
with mixed ancestry occurred in all regions except the most CHS and (ii) regions 3–5 versus CHS. The second com-
northern (region 1). Based on these findings, we investigated parison showed the highest differentiation (i: FST = 0.3687,
differentiation between northern and southern regions. We P < 0.0001; ii: FST = 0.4102, P < 0.0001). The migration rates
explored 2 groupings: (I) regions 1 and 2 versus regions between regions 1 and 2 versus regions 3–5 showed a strong
3–5 and (II) regions 1–3 versus regions 4 and 5. There was bias. The number of migrants per generation from regions 1
771Journal of Heredity
and 2 into regions 3–5 was 7.8 (95% CI = 2.1–18.4), whereas population (CHS vs. NWAa: ФST = 0.231, IRL vs. NWAa:
the number of migrants per generation from regions 3–5 ФST = 0.160), and in particular, Gulf of Mexico (Mexico) to
into regions 1 and 2 was 27.9 (95% CI = 14.6–47.0). Cuba (ФST = 0.052). Genetic diversity indices showed that
nucleotide diversity and theta were highest for the Northwest
SGS and Sex-Biased Dispersal Atlantic offshore population, followed by the 5 alongshore/
coastal populations, and finally, the inshore populations (CHS
The SGS analysis detected significant genetic structure at the and IRL) showed the lowest values (Table 1).
extremes of the distance classes (0–10, 20–30, and 190–200
km) (Figure 3). We detected no signal of sex-biased disper- Evolutionary Relationships
sal within the IRL, CHS, or both regions combined. IRL:
mean male AIc = −0.190 ± 0.392 (standard error, SE), mean The statistical parsimony analysis clustered CHS, IRL, and
female AIc = 0.338 ± 0.281 (SE), and no significant differ- Northwest Atlantic alongshore haplotypes into a distinct
ence in the male and female AIc distributions (Z = 0.166, group separate from haplotypes from the remaining 6 geo-
P = 0.868). CHS: mean male AIc = 0.029 ± 0.466 (SE), mean graphic regions (5 steps separated them) (Figure 2). A sin-
female AIc = −0.033 ± 0.362 (SE), and AIc distributions gle haplotype sampled in Cuba was connected to the CHS/
(Z = −0.283, P = 0.777). Both regions combined: mean male IRL/NWAa grouping by 3 steps, and a single individual
Downloaded from http://jhered.oxfordjournals.org/ at Cornell University Library on August 10, 2014
AIc = 0.051 ± 0381 (SE), mean female AIc = −0.079 ± 0492 sampled in the Bahamas shared the most frequent haplo-
(SE), and AIc distributions (Z = −0.172, P = 0.863). type (H4) within the CHS/IRL/NWAa grouping. The first
group of haplotypes connected to the CHS/IRL/NWAa
grouping was dominated by Bahamas haplotypes. The maxi-
Mitochondrial Population Differentiation and Diversity
mum likelihood phylogeny was concordant with the statisti-
For the samples collected in CHS and the IRL, we detected 5 cal parsimony analysis as it clustered CHS, IRL, and NWAa
haplotypes (H1–H5) (Figure 2), with only 2 occurring within haplotypes into a single strongly supported group that was
the IRL (H2 and H4). H4 was considerably more frequent separate from Caribbean and Gulf of Mexico inshore haplo-
within the IRL than H2 (H4 = 96 and H2 = 1). For CHS, hap- types (Figure 4). These latter haplotypes were also clustered
lotype frequencies were as follows: H1 = 1, H2 = 20, H3 = 5, into a single strongly supported group. All offshore/world-
H4 = 7, and H5 = 2. Due to the low number of haplotypes wide form haplotype groupings were basal to the inshore/
within the IRL, it was not possible to examine population alongshore group (also strongly supported). The CHS/
structure among the 5 regions within the lagoon. However, IRL/NWAa grouping again contained the single haplotype
examination of population structure over a wider geographic from Cuba.
scale (eastern USA, Gulf of Mexico, and Caribbean) revealed
a high level of overall genetic partitioning among the 8
regions (ФST = 0.744, P < 0.0001), with all pairwise compari- Discussion
sons significant after FDR correction (ФST and exact tests).
Patterns of Population Structure within Inshore Habitat
With 3 exceptions, all pairwise comparisons showed high dif-
ferentiation (Table 3). The 3 exceptions were the compari- Both the mitochondrial and microsatellite data showed
sons of CHS and IRL to the Northwest Atlantic alongshore the 2 inshore populations of CHS and IRL to be highly
Figure 3 Correlogram showing the spatial correlation r as a function of distance (20 distance classes, 10 km each). Sample
size (the number of pairs compared) for each distance class is shown in parentheses. r values are shown at the end point of each
distance class. Dashed lines show the 95% CI around the null hypothesis of a random distribution of dolphins for each distance
class. r shows significant deviation from a random distribution for 3 distance classes (0–10, 20–30, and 190–200 km).
772Richards et al. • Bottlenose Dolphin Inshore Differentiation
Table 3 mtDNA pairwise ФST values among 8 geographic regions (inshore, alongshore, and offshore individuals) for Tursiops truncatus
CHS IRL NWAa GOM-USA GOM-Mexico Bahamas Cuba
IRL 0.710Journal of Heredity
Stenella frontalis for Mosquito Lagoon individuals detected by Mazzoil et al.
(2008) despite the availability of habitat in the south lends
support to this hypothesis, and studies of inshore bottle-
nose dolphins within embayments in Australia have provided
evidence for fine-scale population structure resulting from
46.2 utilization of different habitats (Wiszniewski et al. 2010;
Ansmann, Parra, Lanyon, et al. 2012).
Communities with different habitat utilization skills may
NW Alt offshore
48.8
become reproductively isolated if each group continues to
43.2 Caribbean
(worldwide form*) invest in learned strategies and associate with social groups
using the same strategies, as suggested for killer whale popu-
lations (Hoelzel et al. 2007). However, the presence of mixed
ancestry individuals within the IRL indicates some level of
100
genetic exchange between cluster 1 and 2 populations, and
91.2 the distribution of these individuals throughout most of the
IRL suggests that they are generalists. One interpretation of
Downloaded from http://jhered.oxfordjournals.org/ at Cornell University Library on August 10, 2014
this observation is that the descendants of cluster 1 popu-
lation and cluster 2 population genetic exchange are more
likely to be retained in generalist communities. Alternatively,
it might reflect the gradual erosion of partitioning between
98.5
Caribbean these populations subsequent to their recent connection.
Gulf of Mexico A similar pattern has been observed for bottlenose dolphins
96.1 in Moreton Bay, Australia. Twenty years ago, 2 communi-
ties appeared partitioned due to different foraging strategies
(one of the communities fed on commercial trawling vessel
bycatch). However, trawling activity since then has been dra-
100 N matically reduced and this community structure now appears
C H1
to be breaking down (Ansmann, Parra, Chilvers, et al. 2012).
C H3
N
An interesting finding from the SGS analysis was the
99.8
C,I,N H2 IRL & CHS presence of genetic structure over very short geographic
U NW Atl alongshore
C H5 distances (distance classes of 0–10 and 20–30 km). This
C,I,N,B H4
N finding might be explained by any one or combination of
the following factors: 1) close associations among related
females (Möller et al. 2004), 2) male alliances among related
Figure 4 Maximum likelihood phylogeny showing individuals (Krützen et al. 2003; Parsons et al. 2003), 3) com-
relationship among 56 Tursiops truncatus mitochondrial munity subdivision into temporarily dynamic social groups
control region haplotypes sampled from the Northwest (Wiszniewski et al. 2009), and 4) geographically restricted
Atlantic, Gulf of Mexico, and Caribbean (see Materials and/or unique foraging bases (Olin et al. 2012).
and Methods). Asterisk indicates haplotypes described as
“worldwide form” (Caballero et al. 2012). Solid black circles
show haplotypes described as “inshore ecotype” (Caballero Sex-Biased Dispersal
et al. 2012). Haplotypes generated as part of this study are Previous studies of sex-biased dispersal for bottlenose dol-
shown (H1–H5). Haplotype sampling regions for the IRL phins have shown differing results. For example, several stud-
and CHS, NW Atlantic alongshore grouping are indicated as ies of inshore populations have shown male-biased dispersal
follows: C = CHS, I = IRL, N = NW Atlantic alongshore, (Krützen, Barré, et al. 2004; Bilgmann et al. 2007; Wiszniewski
B = Bahamas, and U = Cuba. Numbers over branches show et al. 2010), whereas studies within more homogeneous envi-
bootstrap support. ronments have found no evidence for sex-biased dispersal
(Natoli et al. 2005; Parsons et al. 2006; Bilgmann et al. 2007;
be due to reduced or more specialized habitat utilization Rosel et al. 2009). However, concordant with our findings,
skills of cluster 1 individuals when compared with cluster Ansmann, Parra, Lanyon, et al. (2012) found no evidence
2 individuals. Specifically, the cluster 2 population has likely for sex-biased dispersal within an inshore environment. One
developed habitat utilization skills suited to both northern hypothesis for increased female philopatry is that it may be
and southern environments, whereas the cluster 1 popula- advantageous for rearing offspring and defense from preda-
tion only has skills suited to the northern environment (as tors (sharks) (Möller and Beheregaray 2004). Due to low
a consequence of being restricted to the very north of the salinities, the only year-round resident shark species within
IRL until relatively recently). The finding of considerably the IRL is the euryhaline bull shark (Carcharhinus leucas) and
more migration from regions 3–5 into regions 1 and 2 than size distribution of individuals suggests that adults spend
in the opposite direction, coupled with the strong site fidelity most of their time outside the lagoon (Snelson and Williams
774Richards et al. • Bottlenose Dolphin Inshore Differentiation
1981). Although these observations suggest that there may inshore habitat can be subdivided still further. Despite this
be a reduced threat from sharks within the IRL, a study com- general pattern, long-range dispersal does appear possible, as
paring the prevalence of shark bites/individual between IRL we detected 2 haplotypes, one sampled in the Bahamas and
and CHS dolphins (Fair PA, unpublished data) showed no the other in Cuba, that were more closely related to eastern
significant difference (IRL = 28.9%, CHS = 31.0%), with US coast individuals than to the Bahamas or Cuban, respec-
these frequencies similar to those of other studies (Corkeron tively. However, our data suggest that this type of migration
et al. 1987; Urian et al. 1998), suggesting a similar risk of is rare.
shark predation. Lastly, despite our findings here of no sex- The phylogenetic analysis showed the offshore/world-
biased dispersal, additional samples may be required before it wide form haplotypes to be ancestral to the alongshore/
can be confidently rejected. inshore (coastal) haplotypes, and a younger age for the
coastal populations was supported by the measures of mito-
chondrial molecular diversity, which showed these popula-
Evolutionary Perspective
tions to have lower diversity than the Northwest Atlantic
Concordant with previous studies, the mtDNA showed an offshore population. Furthermore, the levels of diversity
overall pattern of strong genetic differentiation (all compari- showed a general decrease when moving from offshore to
sons were significant). Nevertheless, the statistical parsimony alongshore and then inshore. Rosel et al. (2009) found a sim-
Downloaded from http://jhered.oxfordjournals.org/ at Cornell University Library on August 10, 2014
network showed the Northwest Atlantic alongshore, CHS, ilar pattern of lower diversity for 2 estuarine (inshore) popu-
and IRL haplotypes to be closely related, and the levels of lations (Charleston Harbor, South Carolina and Jacksonville,
mitochondrial differentiation among these regions were rel- Florida) along the eastern US coastline when compared with
atively low, suggesting elevated levels of genetic exchange. alongshore populations. A possible explanation for these
For CHS, long-term sighting studies indicate migration of observations is that the inshore populations were recently
individuals in and out of the area and therefore the potential founded, possibly from an alongshore population. Detecting
for genetic exchange. For example, the photoidentification a similar pattern of diversity for bottlenose dolphins along
study of Zolman (2002) suggested that a small number of the west coast of Florida, Sellas et al. (2005) also argued that
individuals might seasonally migrate in and out of the area, this pattern was the signature of a founder event. Similarly,
and the more recent mark–recapture study of Speakman Natoli et al. (2004) and Hoelzel, Potter, et al. (1998) sug-
et al. (2010) identified 3 distinct groups: year-round residents, gested that the less diverse alongshore populations of the
seasonal residents, and transients. In addition, the photoiden- Western Atlantic were founded by the more diverse offshore
tification study of Laska et al. (2011) documented frequent population. An additional consideration is that low molecu-
mixing of individuals between an estuarine and coastal com- lar diversity can also reflect low population size, which could
munity. The only comparison to show less differentiation be due to limiting factors based on the physical size of the
than these 3 regions was the comparison between Cuba and inshore habitat.
the Gulf of Mexico (Mexico), suggesting elevated levels of
genetic exchange across the Yucatán Channel. The highest
level of differentiation, on the other hand, was between the
Conclusion
IRL and all regions in the Gulf of Mexico and Caribbean,
this despite the relatively short geographic distance from the Our study reports fine-scale genetic structure over very short
IRL to most of these regions. Similar to the previous work geographic distances within heterogeneous inshore habitat
of Rosel et al. (2009), the overall pattern of differentiation for a highly mobile marine mammal, with habitat and its
we detected combined with the statistical parsimony and utilization likely important mechanisms shaping population
phylogenetic analyses showed dolphins along the eastern US structure. Community structure and close association among
coastline to be strongly partitioned from the Gulf of Mexico related individuals may also be important factors shap-
and Caribbean. Differentiation between populations in the ing structure within inshore habitat. Importantly, we show
Gulf of Mexico and the NW Atlantic has been observed for the first time that the Indian River Lagoon Estuarine
for numerous taxa (Avise 2000; Soltis et al. 2006), with the System Stock (IRLES) is comprised of 2 distinct genetic
phylogeographic break typically located along the east coast populations that are partially sympatric and strongly dif-
of Florida. Our results suggest that the break for T. truncatus ferentiated from other eastern US coastal populations and
extends at least as far south as the IRL. Additional samples stocks. Furthermore, the high level of population differen-
from the southern tip of Florida including the Florida Keys tiation between the inshore habitats highlights the possibil-
would be informative in determining the precise location of ity of multiple discrete management units existing within
the break. this type of habitat along the entire length of the eastern
Overall, eastern US bottlenose dolphins show a hierarchal US shoreline. Of concern is the possible amalgamation of
pattern of population structure, with the strongest signal 2 discrete units of genetic diversity (populations) within the
grouping dolphins along the eastern US shoreline separately IRL as a consequence of habitat restructuring. Consideration
from those in the Gulf of Mexico and the Caribbean. Within of these inshore population characteristics and the poten-
these regions, dolphins are further subdivided into distinct tial detrimental effects of anthropogenic disturbance should
along and inshore populations. Lastly, as shown in this study contribute to the long-term success of bottlenose dolphin
and previously for Australian embayments, dolphins within management strategies.
775Journal of Heredity
Supplementary Material Bilgmann K, Moeller LM, Harcourt RG, Gibbs SE, Beheregaray LB. 2007.
Genetic differentiation in bottlenose dolphins from South Australia: asso-
Supplementary material can be found at http://www.jhered. ciation with local oceanography and coastal geography. Mar Ecol Prog Ser.
oxfordjournals.org/. 341:265–276.
Bowen B, Avise J. 1990. The genetic structure of Atlantic and Gulf of
Mexico populations of sea bass, menhaden, and sturgeon: the influence of
Funding zoogeographic factors and life history patterns. Mar Biol. 107:371–381.
Briggs J. 1974. Marine zoogeography. New York: McGraw-Hill.
State of Florida’s Protect Wild Dolphins Specialty License Briggs J, Bowen B. 2012. A realignment of marine biogeographic provinces
Plate Fund; NOAA/Center for Coastal Environmental with particular reference to fish distributions. J Biogeogr. 39:12–30.
Health and Biomolecular Research (CCEHBR); NOAA/ Caballero S, Islas-Villanueva V, Tezanos-Pinto G, Duchene S, Delgado-
NMFS Marine Mammal Health and Stranding Response Estrella A, Sanchez-Okrucky R, Mignucci-Giannoni A. 2012. Phylogeography,
Program; Intramural Research Program of the National genetic diversity and population structure of common bottlenose dolphins
Institutes of Health, National Cancer Institute. in the Wider Caribbean inferred from analyses of mitochondrial DNA con-
trol region sequences and microsatellite loci: conservation and management
implications. Anim Conserv. 15:95–112.
Acknowledgments
Downloaded from http://jhered.oxfordjournals.org/ at Cornell University Library on August 10, 2014
Chakraborty R, Weiss K. 1988. Admixture as a tool for finding linked genes
This research was conducted under NMFS permit 998-1678-00 issued to and detecting that difference from allelic association between loci. Proc Natl
G.D.B. The authors are grateful to Harbor Branch Oceanographic Institute Acad Sci USA. 85:9119–9123.
at Florida Atlantic University, the CCEHBR, and all associated collabora- Chilvers BL, Corkeron PJ. 2001. Trawling and bottlenose dolphins’ social
tors who participated and aided in this research. The authors acknowledge structure. Proc Biol Sci. 268:1901–1905.
L. Hansen, M. Mazzoil, L. Fulford, F. Townsend, E. Zolman, T. Speakman,
J. Adams, W. McFee, M. de Sieyes, K. Kroell, E. Murdoch-Titcolmb, Clement M, Posada D, Crandall KA. 2000. TCS: a computer program to
E. Howells, S. Bechdel-Rodgers, J. Goldstein, and all of the many dedicated estimate gene genealogies. Mol Ecol. 9:1657–1659.
staff and volunteers who assisted with IRL and CHS HERA collections. Corkeron P, Morris R, Bryden M. 1987. Interactions between bottlenose dol-
A special thanks to P. Rosel and the NMFS MMMGL for technical assis- phins and sharks in Moreton Bay, Queensland. Aquat Mamm. 13:109–113.
tance with microsatellites. Additional recognition is also given to the many Crandall KA, Templeton AR. 1993. Empirical tests of some predictions
dedicated members of the SEUS Marine Mammal Health and Stranding from coalescent theory with applications to intraspecific phylogeny recon-
Network who work tirelessly to respond, recover, and bring aid to sick and struction. Genetics. 134:959–969.
injured marine mammals. The content of this publication does not necessar-
Defran RH, Weller DW, Kelly DL, Espinosa MA. 1999. Range characteris-
ily reflect the views of the Department of Health and Human Services nor
tics of Pacific coast bottlenose dolphins (Tursiops truncatus) in the Southern
does the mention of trade names, commercial products, or organizations
California Bight. Mar Mamm Sci. 15:381–393.
imply endorsement by the US Government.
Degnan JH, DeGiorgio M, Bryant D, Rosenberg NA. 2009. Properties of
consensus methods for inferring species trees from gene trees. Syst Biol.
58:35–54.
References Degnan JH, Rosenberg NA. 2006. Discordance of species trees with their
Amos B, Hoelzel AR. 1990. DNA fingerprinting cetacean biopsy samples for most likely gene trees. PLoS Genet. 2:e68.
individual identification. Report of the International Whaling Commission Drummond A, Ashton B, Buxton S, Cheung M, Cooper A, Heled J, Kearse
Special Issue (No. 12). p. 79–85. M, Moir R, Stones-Havas S. 2010. Geneious v5.1. Available from: http://
Ansmann IC, Parra GJ, Chilvers BL, Lanyon JM. 2012. Dolphins restruc- www.geneious.com.
ture social system after reduction of commercial fisheries. Anim Behav. Evanno G, Regnaut S, Goudet J. 2005. Detecting the number of clusters of
84:575–581. individuals using the software STRUCTURE: a simulation study. Mol Ecol.
Ansmann IC, Parra GJ, Lanyon JM, Seddon JM. 2012. Fine-scale genetic 14:2611–2620.
population structure in a mobile marine mammal: inshore bottlenose dol- Ewing GB, Ebersberger I, Schmidt HA, von Haeseler A. 2008. Rooted triple
phins in Moreton Bay, Australia. Mol Ecol. 21:4472–4485. consensus and anomalous gene trees. BMC Evol Biol. 8:118.
Avise J. 1992. Molecular population structure and the biogeographic history Excoffier L, Laval G, Schneider S. 2005. Arlequin (version 3.0): an integrated
of a regional fauna: a case history with lessons for conservation biology. software package for population genetics data analysis. Evol Bioinform
Oikos. 63:62–76. Online. 1:47–50.
Avise J. 2000. Phylogeography: the history and formation of species. Favre L, Balloux F, Goudet J, Perrin N. 1997. Female-biased dispersal in the
Cambridge (MA): Harvard University Press. monogamous mammal Crocidura russula: evidence from field data and micro-
Baker CS. 2013. Journal of heredity adopts joint data archiving policy. J satellite patterns. Proc Biol Sci. 264:127–132.
Hered. 104:1. Gilmore R. 1995. Environmental and biogeographic factors influencing ich-
Beerli P. 2006. Comparison of Bayesian and maximum-likelihood inference thyofaunal diversity: Indian River Lagoon. Bull Mar Sci. 57:153–170.
of population genetic parameters. Bioinformatics. 22:341–345. Guindon S, Dufayard JF, Lefort V, Anisimova M, Hordijk W, Gascuel O.
Belkhir K, Borsa P, Chikhi L, Raufaste N, Bonhomme F. 1996–2004. 2010. New algorithms and methods to estimate maximum-likelihood phy-
GENETIX 4.03, logiciel sous Windows TM pour la génétique des popula- logenies: assessing the performance of PhyML 3.0. Syst Biol. 59:307–321.
tions. Montpellier (France): Université de Montpellier II. Hill W, Robertson A. 1968. Linkage disequilibrium in finite populations.
Belkhir K, Castric V, Bonhomme F. 2002. IDENTIX, a software to test for relat- Theor Appl Genet. 38:226–231.
edness in a population using permutation methods. Mol Ecol Notes. 2:611–614. Hoelzel AR. 1998. Genetic structure of cetacean populations in sympatry,
Benjamini Y, Hochberg Y. 1995. Controlling the false discovery rate: a practi- parapatry, and mixed assemblages: implications for conservation policy. J
cal and powerful approach to multiple testing. J R Stat Soc Ser B. 57:289–300. Hered. 89:451–458.
776Richards et al. • Bottlenose Dolphin Inshore Differentiation
Hoelzel AR, Dahlheim M, Stern SJ. 1998. Low genetic variation among killer Natoli A, Peddemors VM, Hoelzel AR. 2004. Population structure and spe-
whales (Orcinus orca) in the eastern North Pacific and genetic differentiation ciation in the genus Tursiops based on microsatellite and mitochondrial DNA
between foraging specialists. J Hered. 89:121–128. analyses. J Evol Biol. 17:363–375.
Hoelzel AR, Hey J, Dahlheim ME, Nicholson C, Burkanov V, Black N. 2007. Olin JA, Fair PA, Recks MA, Zolman E, Adams J, Fisk AT. 2012. Unique
Evolution of population structure in a highly social top predator, the killer seasonal forage bases within a local population of bottlenose dolphin
whale. Mol Biol Evol. 24:1407–1415. (Tursiops truncatus). Mar Mamm Sci. 28:E28–E40.
Hoelzel AR, Potter CW, Best PB. 1998. Genetic differentiation between Parsons KM, Durban JW, Claridge DE, Balcomb KC, Noble LR, Thompson
parapatric ‘nearshore’ and ‘offshore’ populations of the bottlenose dolphin. PM. 2003. Kinship as a basis for alliance formation between male bottlenose
Proc Biol Sci. 265:1177–1183. dolphins, Tursiops truncatus, in the Bahamas. Anim Behav. 66:185–194.
Katoh K, Misawa K, Kuma K, Miyata T. 2002. MAFFT: a novel method for Parsons KM, Durban JW, Claridge DE, Herzing DL, Balcomb KC, Noble
rapid multiple sequence alignment based on fast Fourier transform. Nucleic LR. 2006. Population genetic structure of coastal bottlenose dolphins
Acids Res. 30:3059–3066. (Tursiops truncatus) in the northern Bahamas. Mar Mamm Sci. 22:276–298.
Krützen M, Barré LM, Connor RC, Mann J, Sherwin WB. 2004. ‘O father: Peakall R, Smouse PE. 2012. GenAlEx 6.5: genetic analysis in Excel.
where art thou?’—Paternity assessment in an open fission-fusion society of Population genetic software for teaching and research—an update.
wild bottlenose dolphins (Tursiops sp.) in Shark Bay, Western Australia. Mol Bioinformatics. 28:2537–2539.
Ecol. 13:1975–1990. Posada D, Crandall KA. 1998. MODELTEST: testing the model of DNA
Downloaded from http://jhered.oxfordjournals.org/ at Cornell University Library on August 10, 2014
Krützen M, Sherwin WB, Berggren P, Gales N. 2004. Population structure substitution. Bioinformatics. 14:817–818.
in an inshore cetacean revealed by microsatellite and mtDNA analysis: bot- Pritchard J. 2007. Documentation for STRUCTURE software: version 2.2.
tlenose dolphins (Tursiops sp.) in Shark Bay, Western Australia. Mar Mamm Available from: http://pritch.bsd.uchicago.edu/structure.html.
Sci. 20:28–47.
Pritchard JK, Stephens M, Donnelly P. 2000. Inference of population struc-
Krützen M, Sherwin WB, Connor RC, Barré LM, Van de Casteele T, ture using multilocus genotype data. Genetics. 155:945–959.
Mann J, Brooks R. 2003. Contrasting relatedness patterns in bottlenose
Queller DC, Goodnight KF. 1989. Estimating relatedness using genetic
dolphins (Tursiops sp.) with different alliance strategies. Proc Biol Sci.
markers. Evolution. 43:258–275.
270:497–502.
Rooney AP, Merritt DB, Derr JN. 1999. Microsatellite diversity in captive
Krützen M, Valsecchi E, Connor R, Sherwin W. 2001. Characterization of
bottlenose dolphins (Tursiops truncatus). J Hered. 90:228–231.
microsatellite loci in Tursiops aduncus. Mol Ecol Notes. 1:170–172.
Rosel P. 2003. PCR-based sex determination in Odontocete cetaceans. Conserv
Laska D, Speakman T, Fair PA. 2011. Community overlap of bottlenose
Genet. 4:647–649.
dolphins (Tursiops truncatus) found in coastal waters near Charleston, South
Carolina. J Mar Anim Ecol. 4:10–18. Rosel PE, Forgetta V, Dewar K. 2005. Isolation and characterization of
twelve polymorphic microsatellite markers in bottlenose dolphins (Tursiops
Latch E, Dharmarajan G, Glaubitz J, Rhodes O Jr. 2006. Relative perfor-
truncatus). Mol Ecol Notes. 5:830–833.
mance of Bayesian clustering software for inferring population substruc-
ture and individual assignment at low levels of population differentiation. Rosel PE, France SC, Wang JY, Kocher TD. 1999. Genetic structure of har-
Conserv Genet. 7:295–302. bour porpoise Phocoena phocoena populations in the northwest Atlantic based
on mitochondrial and nuclear markers. Mol Ecol. 8:S41–S54.
Leatherwood S, Reeves RR. 1983. The Sierra Club handbook of whales and
dolphins. San Francisco (CA): Sierra Club Books. p. i–xviii, 1–302. Rosel PE, Hansen L, Hohn AA. 2009. Restricted dispersal in a continuously
distributed marine species: common bottlenose dolphins Tursiops truncatus
Mazzoil M, Reif JS, Youngbluth M, Murdoch ME, Bechdel SE, Howells E,
in coastal waters of the western North Atlantic. Mol Ecol. 18:5030–5045.
McCulloch SD, Hansen LJ, Bossart GD. 2008. Home ranges of bottlenose
dolphins (Tursiops truncatus) in the Indian River Lagoon, Florida: environ- Rosel PE, Haygood MG, Perrin WF. 1995. Phylogenetic relationships among
mental correlates and implications for management strategies. EcoHealth. the true porpoises (Cetacea:Phocoenidae). Mol Phylogenet Evol. 4:463–474.
5:278–288. Rousset F. 2008. genepop’007: a complete re-implementation of the
McRae G, Camp D, Lyons W, Dix T. 1998. Relating benthic infaunal com- genepop software for Windows and Linux. Mol Ecol Resour. 8:103–106.
munity structure to environmental variables in estuaries using nonmetric Sambrook J, Russell D. 2001. Molecular cloning: a laboratory manual. New
multidimensional scaling and similarity analysis. Environ Monit Assess. York: Cold Spring Harbor Laboratory Press.
51:233–246. Sargeant BL, Wirsing AJ, Heithaus MR, Mann J. 2007. Can environmental
Mirimin L, Miller R, Dillane E, Berrow SD, Ingram S, Cross TF, Rogan E. heterogeneity explain individual foraging variation in wild bottlenose dol-
2011. Fine-scale population genetic structuring of bottlenose dolphins in phins (Tursiops sp.)? Behav Ecol Sociobiol. 61:679–688.
Irish coastal waters. Anim Conserv. 14:342–353. Segura I, Rocha-Olivares A, Flores-Ramirez S, Rojas-Bracho L. 2006.
Möller L, Beheregaray L, Allen S, Harcourt R. 2004. Association patterns Conservation implications of the genetic and ecological distinction
and kinship in female Indo-Pacific bottlenose dolphins (Tursiops aduncus) of of Tursiops truncatus ecotypes in the Gulf of California. Biol Conserv.
southeastern Australia. Behav Ecol Sociobiol. 61:109–117. 133:336–346.
Möller L, Wiszniewski J, Allen S. 2007. Habitat type promotes rapid and Sellas AB, Wells RS, Rosel PE. 2005. Mitochondrial and nuclear DNA analy-
extremely localised genetic differentiation in dolphins. Mar Freshw Res. ses reveal fine scale geographic structure in bottlenose dolphins (Tursiops
58:640–648. truncatus) in the Gulf of Mexico. Conserv Genet. 6:715–728.
Möller LM, Beheregaray LB. 2004. Genetic evidence for sex-biased Sheffield VC, Stone EM, Carmi R. 1998. Use of isolated inbred human
dispersal in resident bottlenose dolphins (Tursiops aduncus). Mol Ecol. populations for identification of disease genes. Trends Genet. 14:391–396.
13:1607–1612. Shifman S, Darvasi A. 2001. The value of isolated populations. Nat Genet.
Mossman CA, Waser PM. 1999. Genetic detection of sex-biased dispersal. 28:309–310.
Mol Ecol. 8:1063–1067. Smith MW, Lautenberger JA, Shin HD, Chretien JP, Shrestha S, Gilbert
Natoli A, Birkun A, Aguilar A, Lopez A, Hoelzel AR. 2005. Habitat struc- DA, O’Brien SJ. 2001. Markers for mapping by admixture linkage disequi-
ture and the dispersal of male and female bottlenose dolphins (Tursiops librium in African American and Hispanic populations. Am J Hum Genet.
truncatus). Proc Biol Sci. 272:1217–1226. 69:1080–1094.
777You can also read