Genetic Diversity and Structure of Dalmatian Pyrethrum (Tanacetumcinerariifolium Trevir. Bip., Asteraceae) within the Balkan Refugium
←
→
Page content transcription
If your browser does not render page correctly, please read the page content below
Genetic Diversity and Structure of Dalmatian Pyrethrum
(Tanacetum cinerariifolium Trevir. /Sch./ Bip., Asteraceae)
within the Balkan Refugium
Martina Grdiša1*, Zlatko Liber2, Ivan Radosavljević2, Klaudija Carović-Stanko1, Ivan Kolak1,
Zlatko Satovic1
1 Department of Seed Science and Technology, Faculty of Agriculture, University of Zagreb, Zagreb, Croatia, 2 Department of Botany, Division of Biology, Faculty of
Science, University of Zagreb, Zagreb, Croatia

     Abstract
     Dalmatian pyrethrum (Tanacetum cinerariifolium Trevir. /Sch./ Bip.) is an outcrossing, perennial insecticidal plant, restricted to
     the eastern Adriatic coast (Mediterranean). Amplified fragment-length polymorphisms (AFLP) were used to investigate the
     genetic diversity and structure within and among 20 natural plant populations. The highest level of gene diversity, the
     number of private alleles and the frequency down-weighted marker values (DW) were found in northern Adriatic
     populations and gradually decreased towards the southern boundary of the species range. Genetic impoverishment of
     these southern populations is most likely the result of human-related activities. An analysis of molecular variance (AMOVA)
     indicated that most of the genetic diversity was attributed to differences among individuals within populations (85.78%),
     which are expected due to the outcrossing nature of the species. A Bayesian analysis of the population structure identified
     two dominant genetic clusters. A spatial analysis of the genetic diversity indicated that 5.6% of the genetic differentiation
     resulted from isolation by distance (IBD), while 12.3% of the genetic differentiation among populations followed the pattern
     of isolation by environmental distance (IBED). Knowledge of the genetic diversity patterns of the natural populations and
     the mechanism behind these patterns is required for the exploitation and possible conservation management of this
     endemic and economically important species.

  Citation: Grdiša M, Liber Z, Radosavljević I, Carović-Stanko K, Kolak I, et al. (2014) Genetic Diversity and Structure of Dalmatian Pyrethrum (Tanacetum
  cinerariifolium Trevir. /Sch./ Bip., Asteraceae) within the Balkan Refugium. PLoS ONE 9(8): e105265. doi:10.1371/journal.pone.0105265
  Editor: Igor Mokrousov, St. Petersburg Pasteur Institute, Russian Federation
  Received April 8, 2014; Accepted July 22, 2014; Published August 14, 2014
  Copyright: ß 2014 Grdiša et al. This is an open-access article distributed under the terms of the Creative Commons Attribution License, which permits
  unrestricted use, distribution, and reproduction in any medium, provided the original author and source are credited.
  Data Availability: The authors confirm that all data underlying the findings are fully available without restriction. All relevant data are within the paper and its
  Supporting Information files.
  Funding: This study was supported by the Ministry of Science, Education and Sports of the Republic of Croatia (public.mzos.hr), within the framework of Project
  No. 178-1191193-0212 (ZS), Project No. 178-0000000-3595 (IK) and Project No. 119-1191193-1232 (ZL). The funders had no role in study design, data collection,
  analysis, decision to publish, or preparation of the manuscript.
  Competing Interests: The authors have declared that no competing interests exist.
  * Email: mgrdisa@agr.hr

Introduction                                                                            the model ‘‘refugia within refugia’’ was developed [10,12–15].
                                                                                        Genetic divergence expressed as a rarity index (DW; frequency
   Conservation of genetic diversity is essential for any species                       down-weighted marker values) as an indicator of the historical
long-term survival [1], providing the ability to respond to selective                   processes of a species [16] enables the distinction between old
pressures caused by both anthropogenic and natural environmen-                          vicariance and recent dispersal. As a consequence of long-term
tal changes [2]. Patterns of genetic diversity and population                           isolation, populations in glacial refugia are characterized by high
structure are specifically shaped in response to many factors and                       levels of DW values and genetic diversity [17], whereas popula-
are result of both past history and present processes [3]. Primarily,                   tions that were established after the most recent glacial cycle show
climatic oscillations during the Quaternary causing repeated                            little genetic variation [18] as an outcome of successive founder
restriction-recolonization events have left distinguishing signatures                   events during postglacial colonization [6,9]. However, zones of
in modern species genetics [4]. These oscillations have had a                           secondary contact of divergent lineages can also exhibit high levels
considerable impact on the current distribution and genetic
                                                                                        of genetic diversity [11,19].
diversity in numerous animal and plant species [5–8] in which
                                                                                            The Balkan Peninsula itself represents a unique ecological and
altitudinal and latitudinal range shifts were a likely response to
                                                                                        biogeographical phenomenon in Europe possessing the tremen-
intense climatic changes [9–10]. Detailed phylogeographical
                                                                                        dous number of plant and animal species and pronounced richness
studies have revealed that three European peninsulas of the
                                                                                        in endemic taxa as well. This remarkable diversity is the result of
Mediterranean area (Apennines, Balkans and Iberia) have served
                                                                                        the variety of its regions, complex geological history, and
as refugia for many temperate species and a postglacial
                                                                                        interactions between populations, species and ecosystems [20].
recolonization source for central and northern Europe [3,7,9–
11]. However, this traditional interpretation of southern European                      In the last decade various phylogeographic and molecular studies
peninsulas as being single glacial refugia has been modified, and

PLOS ONE | www.plosone.org                                                          1                               August 2014 | Volume 9 | Issue 8 | e105265
Genetic Diversity of Tanacetum cinerariifolium have been conducted in this area with the aim of elucidating the determine impact of (i) Pleistocene climatic oscillations, (ii) genetic relationships of its flora and fauna [10,21–25]. geographic (IBD) and (iii) environmental isolation (IBED), and It is widely acknowledged that geographical and environmental (iiii) human activities through overexploitation and cultivation on factors can also play significant roles in the modeling of species- the obtained pattern of genetic diversity. AFLP markers have specific inter- and intra-population genetic structure. Spatially found the widest application in assessing the variability and genetic separated populations may experience isolation by distance (IBD) structure of populations in a variety of plants [47–53] and once phenomena in which geographical barriers and physical distances again have proven to be invaluable tools in describing the former. cause restricted pollen and seed dispersal, i.e., gene flow [26–30]. Despite its historical significance and value, the genetic diversity Greater genetic divergence between populations inhabiting and structure of Dalmatian pyrethrum has never been investigat- different environments suggests that various present and/or past ed; therefore, this study using AFLP markers represents the first ecological conditions may significantly impact the genetic differ- such attempt. Dalmatian pyrethrum is nationally strictly protected entiation of local populations [31–32], forming an isolation by by The Croatian Ordinance on the proclamation of protected and environmental distance (IBED) pattern [33]. A significant positive strictly protected wild taxa (Official Gazette 99/09; http:// partial correlation, after eliminating the effect of geographic narodne-novine.nn.hr/clanci/sluzbeni/dodatni/403046.pdf). To- distance, indicates the contribution of climatic gradients to day, as an endemic species, Dalmatian pyrethrum is threatened by patterns of genetic divergence [33–34]. anthropogenic habitat loss and degradation related to factors such Nevertheless, species are greatly affected by direct or indirect as urbanization and habitat conversion; therefore, the need and human activities including population fragmentation and over- importance of these species’ genetic resources protection must be harvesting pressures, all resulting in loss of genetic diversity and recognized even more. The gathered information could be of the alteration of their population genetic structure [35]. Moreover, utmost importance for future activities regarding the conservation founder effects and conscious or unconscious human selections for and breeding programs of this endemic and economically high yield and quality through cultivation of wild plants likewise important species. impose profound impacts on the genetic diversity patterns by narrowing genetic base of the plant material [36–38]. Materials and Methods For our investigation we have chosen Dalmatian pyrethrum (Tanacetum cinerariifolium Trevir. /Sch./ Bip.), an insecticidal Ethics statement perennial plant. Dalmatian pyrethrum is an outcrossing diploid Collecting of all samples from natural habitats in Croatia (2n = 18) [39], self-incompatible and thermophytic plant species of including Nature Park Biokovo was permitted by the authority of the family Asteraceae [40]. This species is restricted to the eastern Directorate for Nature Protection of the Ministry of Culture of the coast of the Adriatic Sea, and its distribution range expands from Republic of Croatia (532-08-01/6-06-02; 07.07.2006). the coastal region to 200 m.a.s.l., but in some cases, it is also present in higher mountainous Mediterranean zones at elevation Sampling of plant populations above 500 m.a.s.l. Continuously distributed populations of Dal- A total of 411 specimens of T. cinerariifolium were sampled matian pyrethrum can be found in extremely degraded habitats from 20 locations along the Adriatic coast in Croatia (Figure 1). with shallow rocky soils. In Croatia, abundant populations can be Between 13 and 25 samples per location were collected as fresh found in the southern parts of the Istrian Peninsula (Premantura), leaf tissue (Table 1). The vast majority of the species populations is the Kvarner islands (Krk, Cres and Lošinj), the Velebit and distributed in Croatia, therefore we focused our study exclusively Biokovo mountains and along the Dalmatian coastal region and its on a wide sampling of Croatian populations. islands (Brač, Hvar, Biševo, Vis, Korčula, Lastovo and Mljet) [41]. Apart from Croatia distribution range expands to the southern DNA isolation and AFLP analysis parts of Bosnia and Herzegovina, and coastal regions of The total genomic DNA was isolated from 90 to 110 mg of Montenegro and Albania [42]. Plants produce the natural fresh leaves tissue with DNA-GenElute Plant Genomic DNA insecticide pyrethrin, which attacks the nervous systems of the Miniprep Kit (Sigma Aldrich, Steinheim, Germany), according to insects causing a knock-down effect and death [43]. manufacturer’s instructions. Prior to isolation leaves tissue was The cultivation and use of Dalmatian pyrethrum and its quickly frozen in liquid nitrogen (2196uC) and ground to a fine products have a documented history in Croatia. The dust from powder with TissueLyzer homogenizer set (Qiagene, Hilden, grinding dried flowers has traditionally been used in Croatian Germany) at 30 Hz for 1 minute. The DNA concentrations were households and agriculture [44]. Originally, flowers were exces- measured using a Qubit Fluorometer (Invitrogen, Carlsbad, sively gathered from the wild resources; however, due to the high California). The AFLP analysis was carried out following the demand for plant material, cultivation began in 1850s near original protocol that was described by Vos et al. [54] with some Dubrovnik and rapidly expanded along the Dalmatian coastal modifications [55]. Restriction of the genomic DNA was region and the islands [45]. The first fields were established with performed using the restriction enzymes EcoRI and MseI. Specific seeds gathered from the wild. Dalmatian pyrethrum was primarily adapters were ligated using T4 DNA Ligase (Fermentas, Thermo reproduced through vegetative splits and later by directly sowing Scientific). The restriction digestion and adapter ligation, pre- the seeds [46]. It was grown in the middle and southern parts of amplification and selective amplifications were performed in a Dalmatia, including Zadar, Biograd, Šibenik, Split, Hvar, Brač, GeneAmp PCR System 9600 (Applied Biosystems, Carlsbad, Makarska, Korčula and Dubrovnik, as well as the northern SAD). Six primer combinations were selected for amplification; Adriatic islands Krk and Cres [44]. In 1914, Croatia became the VIC-EcoRI-ACGC+MseI-AGA, NED-EcoRI-AGA+MseI-CAG, leading producer with high quality plant material. The highest VIC-EcoRI-ACG+MseI-CGA, FAM-EcoRI-ACC+MseI-CGA, yield was achieved in 1926 with approximately 1,359 tons of dried NED-EcoRI-AGA+MseI-CGA, PET-EcoRI-ATG+MseI-CGA. pyrethrum flowers [46]. The amplified fragments were separated by capillary electropho- The goal of this study was to analyze the genetic diversity and resis in an ABI3130xl Genetic Analyzer (Applied Biosystems, structure within and among 20 populations of Dalmatian Carlsbad, USA). The amplified DNA fragments in the size range pyrethrum across their geographical range in Croatia and to of 50 to 125 bp were scored with GeneMapper 4.0 software PLOS ONE | www.plosone.org 2 August 2014 | Volume 9 | Issue 8 | e105265
Genetic Diversity of Tanacetum cinerariifolium

Figure 1. Map of geographic distribution and sampled populations of Tanacetum cinerariifolium in Croatia. Dashed line indicates
distribution range of T. cinerariifolium. Circles numbered 1–20 represent sampled populations.
doi:10.1371/journal.pone.0105265.g001

(Applied Biosystems, Carlsbad, USA) as being present (1) or absent           This approach assumes Hardy-Weinberg equilibrium (FIS = 0)
(0) in order to create a binary matrix.                                      justified by the outcrossing nature of Dalmatian pyrethrum. The
                                                                             obtained allelic frequencies were used in the analysis of genetic
Data analysis                                                                diversity within and between populations following the treatment
   The selection of markers for further statistical analysis and the         of Lynch and Milligan [62]. The population genetic structure was
estimation of the error rate per primer combination were                     described in terms of the total gene diversity (HT), the average
performed as suggested by Herrmann et al. [56]. Thirteen DNA                 gene diversity within populations (HW), the average gene diversity
samples were used as duplicated samples, two of which were                   among populations in excess of that which was observed within
chosen for multiple controls, while 14 samples represented                   populations (HB), and Wright’s FST statistics. The expected
negative controls. The output from GeneMapper (fragment size                 heterozygosity or Nei’s gene diversity (HE) [63] was calculated
and peak heights) was imported into the marker selection                     for each population as well as pairwise Nei’s genetic distances
algorithm scanAFLP 1.3r (www-leca.ujf-grenoble.fr/logiciels.htm).            (DNEI72) [62,64]. The unrooted tree was constructed using the
   The genetic diversity within populations was estimated by                 Fitch-Margoliash method in the PHYLIP ver. 3.6b software
determining the percentage of polymorphic bands (%P), the                    package [65]. A total of 1,000 distance matrices were computed by
number of private alleles (Npr) and Shannon’s information index              bootstrapping using the program AFLP-Surv, and the bootstrap
(I) [57–58]. Shannon’s information index was used to measure the             values were calculated from FITCH and CONSENSE within
total diversity (HT) as well as the average intra-population diversity       PHYLIP.
(HP) and the diversity within (HP/HT) and among populations                     An analysis of molecular variance (AMOVA) [66] was used to
[(HT–HP)/HT]. As a measure of divergence, the frequency down-                partition the total genetic variance within and among populations
weighted marker values (DW) [23] were calculated using the                   using Arlequin ver. 2.000 [67]. The variance components were
software AFLPdat [59].                                                       tested statistically by non-parametric randomization tests using
   The marker allelic frequencies were estimated from the                    10,000 permutations. Pairwise population comparisons that were
observed frequencies of the fragments using a Bayesian method                examined with AMOVA resulted in QST values that were
with non-uniform prior distribution of allele frequencies proposed           equivalent to the proportion of the total variance that was
by Zhivotovsky [60] as implemented in AFLP-Surv ver. 1.0 [61].               partitioned between the two populations and could be interpreted

PLOS ONE | www.plosone.org                                               3                         August 2014 | Volume 9 | Issue 8 | e105265
Table 1. Sampling sites and molecular diversity revealed by AFLP markers in 20 Dalmatian pyrethrum populations from Croatia.
Accession
No. Numbera Population Latitude (N)b Longitude (E)b Elevation (m) n P% Npr I HE DW
1 MAP02143 Osor 44.70 14.39 2 23 44.18 2 0.242 0.112 56.76
2 MAP02158 Cres 44.96 14.41 72 22 45.70 2 0.246 0.113 58.18
3 MAP02139 Mali Lošinj 44.53 14.47 42 21 50.93 4 0.284 0.131 95.20
PLOS ONE | www.plosone.org
4 MAP02156 Krk 45.08 14.67 24 24 52.11 3 0.268 0.118 62.74
5 MAP02148 Gornja Klada 44.82 14.90 589 22 40.64 1 0.214 0.105 48.82
6 MAP02138 Senj 44.93 14.92 6 19 37.61 2 0.214 0.105 42.91
7 MAP02180 Pašman 44.00 15.29 17 22 36.26 3 0.205 0.102 41.45
8 MAP02171 Zlarin 43.70 15.84 45 25 42.33 0 0.234 0.109 45.04
9 MAP02166 Primošten 43.58 16.05 190 22 45.53 4 0.239 0.110 46.09
10 MAP02144 Čiovo 43.51 16.29 143 19 47.22 2 0.251 0.118 48.67
11 MAP02153 Šolta 43.38 16.29 114 19 40.13 0 0.226 0.105 31.59
12 MAP02145 Kozjak 43.58 16.41 516 20 41.15 1 0.220 0.106 31.25
13 MAP02155 Brač 43.38 16.52 116 22 40.81 3 0.216 0.102 47.50
14 MAP02173 Hvar 43.17 16.53 333 21 37.44 0 0.209 0.102 29.40
15 MAP02170 Omiš 43.45 16.70 2 22 38.79 2 0.205 0.102 39.09
4
16 MAP02142 Kotiški 43.32 17.06 1335 13 26.14 1 0.160 0.092 18.92
Stanovi
17 MAP02140 Lad– ena 43.30 17.07 1295 18 34.40 1 0.196 0.099 47.38
18 MAP02141 Ravna 43.29 17.08 1228 22 34.23 3 0.196 0.096 48.53
Vlaška
19 MAP02184 Pelješac 42.92 17.40 18 14 42.50 1 0.247 0.125 33.18
20 MAP02152 Mljet 42.77 17.45 172 21 33.39 1 0.186 0.094 40.03
Average 40.57 0.223 0.107 45.64
Minimum 26.14 0.160 0.092 18.92
Maximum 52.11 0.284 0.131 95.20
a
Accession number from The Collection of Medicinal and Aromatic Plants, Zagreb, Croatia as available at the CPGRD (http://cpgr.zsr.hr);
b
N-North; E-East; Coordinates are in degree decimal format; n-sample size; %P-proportion of polymorphic bands; Npr -number of private bands; I-Shannon’s information index; HE -gene diversity of a population assuming Hardy-
Weinberg equilibrium; and DW-frequency down-weighted marker values.
doi:10.1371/journal.pone.0105265.t001
August 2014 | Volume 9 | Issue 8 | e105265
Genetic Diversity of Tanacetum cinerariifoliumGenetic Diversity of Tanacetum cinerariifolium as the inter-population distance average between any two populations represent isolation by environmental distance (IBED) populations [68]. pattern. The significance levels were obtained after 10,000 The genetic structure was assessed using the model-based permutations as implemented in NTSYS-pc ver. 2.10s [79]. clustering approach implemented by the software STRUCTURE 2.3.3 [69], which simultaneously identifies clusters and assigns Results individuals to clusters using a Bayesian approach. Ten runs of STRUCTURE were performed by setting the number of clusters ScanAFLP from 1 to 21 (K = 1–21). Each run consisted of a burn-in period of The initial number of polymorphic bands that were obtained 200,000 steps followed by 106 MCMC (Monte Carlo Markov with six selective primer combinations equaled 850, while after the Chain) replicates assuming an admixture model and correlated applying scanAFLP, the remaining dataset consisted of 593 allele frequencies. No prior information was used to define the polymorphic markers (43.35% of the initial number of polymor- clusters. The calculations were carried out at the Bioportal of the phic markers). The estimated error rate per primer combination University of Oslo (http://www.bioportal.uio.no/). The most ranged from 0.68% to 3.50% with a mean of 1.83%, which is likely number of clusters (K) was selected by calculating an ad within the typical range found in AFLP datasets [80]. hoc statistic DK based on the rate of change in the log probability of the data between successive K values as described by Evanno et Within population genetic diversity al. [70] and implemented in Structure-sum-2011 [71]. The runs The percentage of polymorphic markers varied among the with the maximum likelihood were selected, and by averaging the populations with the highest proportion in population 4 (52.11%) estimated membership coefficients of the individuals, the propor- and the lowest in population 16 (26.14%). Shannon’s information tion of ancestry of each population in each of the clusters was index indicated that the total diversity (HT) was 0.297, while the calculated. average intrapopulation diversity (HP) was 0.223. The proportion A further population mixture analysis was conducted using of diversity within populations (75.00%) was considerably higher BAPS ver. 5.3 [72] (a) without using the geographic origin of the than the proportion of diversity among populations. Out of 593 samples as an informative prior (‘clustering of individuals’) and (b) scored markers, 36 were private. The populations with the most with this prior (‘spatial clustering of individuals’) [73]. BAPS was private alleles (4) were pops. 3 and 9, while no such alleles were run with the maximal number of clusters (K) set to 20, and each found in the pops. 8, 11 and 14. The population 3 had the highest run was replicated 10 times. The results of the mixture analysis level of expected heterozygosity (HE), and the population 16 had were used as input for population admixture analysis [74] with the the lowest (0.131 and 0.92, respectively) (Table 1, Figure 2A). The default settings to detect admixture between the clusters. frequency down-weighted marker values (DW) ranged from 18.92 Isolation by distance (IBD) among the populations was tested in the population 16 to 95.20 in the population 3 (Table 1, using the method of Rousset [75]. Mantel’s test [76] was used to Figure 2B). compute and test the linear correlation between the matrix of the natural logarithm of geographic distances (in km) between pairs of Genetic structure among populations populations and the matrix of pairwise FST/(1-FST) ratios. A moderate level of population differentiation was observed The plausibility of patterns of isolation by environmental (FST = 0.078) ranging from 0.018 between pops. 10 and 11 to distance (IBED) was evaluated, where differences in the biocli- 0.161 between 6 and 18. matic variables among the sampling sites would better explain the The AMOVA analysis showed that although the most of the genetic distance patterns [33,77]. The climate data for 25 genetic diversity was attributable to differences among individuals sampling sites were obtained from the WorldClim database at a within populations (85.78%), the QST values among populations spatial resolution of approximately 1 km2 [78]. The ecological were highly significant (QST = 0.141 p,0.0001) confirming the characteristics of the sampling sites were described using 19 existence of population differentiation. The QST values ranged bioclimatic variables (11 temperature- and 8 precipitation-related) from 0.049 between pops. 4 and 11 to 0.278 between pops. 5 and representing the annual trends, seasonal variations and extremes 16. in temperature and precipitation (Table 2). Bioclimatic variables Nei’s distance (DNEI72) varied from 0.002 between pops. 10 and were used for the Principal Component Analysis (PCA) and 11 to 0.022 between pops. 6 and 18 with an average value of subsequently to calculate the environmental distances among 0.010. The pattern of grouping in the Fitch-Margoliash tree populations based on principal component scores rather than suggests a direct relationship between the populations and their original values to avoid intercorrelation among variables. PCA was geographical origins. This pattern revealed the existence of two performed using the PROC PRINCOMP procedure in SAS. The clades (northern vs. middle and southern Adriatics) supported by a number of principal components was determined by checking the bootstrap value of 88%. Inside the northern clade, the inland pops. eigenvalues of the principal components and the cumulative 5 and 6 along with the population 2 separated from the northern proportion of the explained variance. The biplot was constructed island populations with a bootstrap value of 72%. The pops. 9 and using two principal components showing populations and biocli- 11 separated from pops. 8 and 4 with a bootstrap value of 88%. matic variables (as vectors). The standardized scores of the first The populations from Mt. Biokovo (pops. 16, 17 and 18) grouped three principal components (eigenvalue .1) were multiplied by the together and showed a clear separation from the remaining root of their eigenvalues, and the pairwise Euclidean distance southern populations with a high bootstrap support of 99% between populations were calculated to obtain an environmental (Figure 3). distance matrix. The results of the STRUCTURE analysis are reported in A simple Mantel’s test was used to test the linear correlation Figure 2C and 2D. The average estimates of the likelihood of the between the matrix of environmental and genetic [FST/(1-FST)] data, conditional on a given number of clusters, [ln P(X|K)], were distances, and a three-way Mantel’s test was conducted between obtained for each of the 10 independent runs for each K (from the same distances matrices while considering the geographical K = 1 to 21). The estimates of [ln P(X|K] increased progressively distances among populations. Thus, the correlations between the as K increased. Using these estimates, the highest DK value was residual environmental and genetic distances among the analyzed observed for K = 2 (302.59). The second highest DK value was PLOS ONE | www.plosone.org 5 August 2014 | Volume 9 | Issue 8 | e105265
Table 2. Correlations between 19 environmental variables (BIO01–BIO19) and the first three principal components.
No. Environmental variable PC1 PC2 PC3
ns ns
BIO01 Annual Mean Temperature 0.942 *** 0.244 0.095
ns
BIO02 Mean Diurnal Range (Mean of monthly (max temp - min temp) 0.678 ** 0.546 * 20.357
ns
BIO03 Isothermality (P2/P7) (*100) 0.733 *** 0.474 * 20.251
ns
BIO04 Temperature Seasonality (standard deviation *100) 20.346 0.545 * 20.497 *
PLOS ONE | www.plosone.org
ns ns
BIO05 Max Temperature of Warmest Month 0.935 *** 0.322 0.027
ns ns
BIO06 Min Temperature of Coldest Month 0.928 *** 0.138 0.218
BIO07 Temperature Annual Range (P5–P6) 0.518 * 0.652 ** 20.482 *
ns ns
BIO08 Mean Temperature of Wettest Quarter 0.866 *** 0.285 20.179
ns ns
BIO09 Mean Temperature of Driest Quarter 0.935 *** 0.270 0.078
ns ns
BIO10 Mean Temperature of Warmest Quarter 0.938 *** 0.263 0.082
ns ns
BIO11 Mean Temperature of Coldest Quarter 0.950 *** 0.199 0.131
ns
BIO12 Annual Precipitation 20.712 *** 0.653 ** 0.234
ns
BIO13 Precipitation of Wettest Month 20.539 * 0.747 *** 0.380
ns ns
BIO14 Precipitation of Driest Month 20.860 *** 0.363 20.275
ns
BIO15 Precipitation Seasonality (Coefficient of Variation) 0.795 *** 0.061 0.476 *
ns
BIO16 Precipitation of Wettest Quarter 20.503 * 0.789 *** 0.348
6
ns ns
BIO17 Precipitation of Driest Quarter 20.844 *** 0.425 20.203
ns ns
BIO18 Precipitation of Warmest Quarter 20.873 *** 0.380 20.196
BIO19 Precipitation of Coldest Quarter 20.492 * 0.489 * 0.695 ***
Eigenvalue 11.55 4.00 1.97
% variance 60.79 21.04 10.39
ns - non-significant;
*significant at P,0.05;
**significant at P,0.01;
***significant at P,0.001.
doi:10.1371/journal.pone.0105265.t002
August 2014 | Volume 9 | Issue 8 | e105265
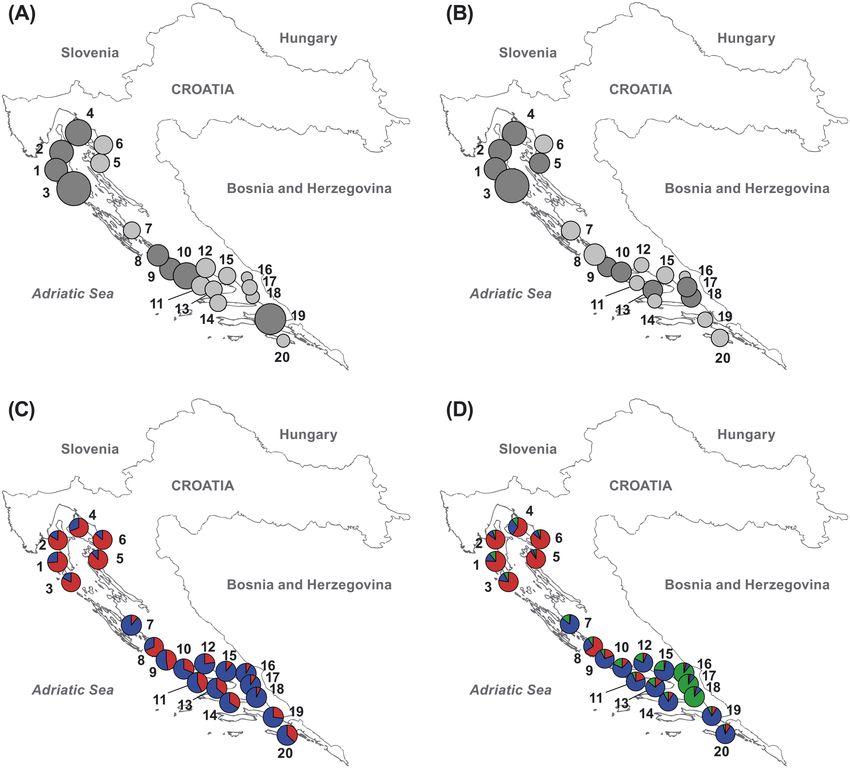
Genetic Diversity of Tanacetum cinerariifoliumGenetic Diversity of Tanacetum cinerariifolium Figure 2. AFLP variation of Tanacetum cinerariifolium. A) Gene diversity (HE), B) Frequency down-weighted marker values (DW). In (A) and (B), the size of the circles is proportional to the depicted values (dark gray color represents values above average across populations and light gray represents values below average). C) Bayesian analysis of the population structure using the software STRUCTURE assuming K = 2, D) Bayesian analysis of the population structure using the software STRUCTURE assuming K = 3. In (C) and (D), the proportions of the ancestry of each population in each of the defined gene pools are color-coded (gene pool A red; gene pool B-blue; and gene pool C-green). doi:10.1371/journal.pone.0105265.g002 observed for K = 3 (180.78). At Ks values greater than three, the of gene pool A were mainly those from the northern Adriatic, average [ln P(X|K)] values decreased, while the variances while the populations from the middle and southern Adriatic were increased substantially and, therefore, the DK values were representative of a separate gene pool B. The most admixed considerably lower (0.10 to 5.80) in comparison to K = 2 and 3. populations were 9 and 11 with almost equal proportions of Thus, the hypothesis of having more than three clusters (gene ancestry from the two gene pools (Figure 2C). At K = 3, a newly pools) was far from optimal. formed gene pool C was identified and was predominant in the The proportions of membership (ancestry) of each individual in pops. 16, 17 and 18 from Mt. Biokovo (Figure 2D). each of the gene pools were calculated for K = 2 to 3 based on the The BAPS mixture with or without spatially informative priors run with the highest [ln P(X|K)], and populations were assigned resulted in the congruent assignment of individuals to two clusters. to a particular gene pool (A, B or C). The results were in The best partitions received log marginal likelihoods of 2 accordance with the results that were obtained using the distance- 51646.2626 at P = 1 (without using geographical coordinates as based method. Representative populations of each gene pool that informative priors) and 251793.7943 at P = 1 (spatial clustering). were identified in the STRUCTURE analysis were located in The results were consistent with the results of the STRUCTURE proximity of each other. At K = 2, the representative populations analysis (Figure S1). PLOS ONE | www.plosone.org 7 August 2014 | Volume 9 | Issue 8 | e105265
Genetic Diversity of Tanacetum cinerariifolium

                                                                               A Principal Component Analysis based on the correlation
                                                                            matrix revealed that first three principal components had an
                                                                            eigenvalue .1 and explained more than 90% of the total variation
                                                                            (Table 2). Eight temperature-related variables (BIO01, BIO03,
                                                                            BIO05, BIO06, BIO08, BIO09, BIO10 and BIO11) and one
                                                                            precipitation-related variable (BIO15) were highly positively
                                                                            correlated (r.0.70; P,0.001) with the first principal component
                                                                            (PC1), while four precipitation-related variables (BIO12, BIO14,
                                                                            BIO17 and BIO18) were highly negatively correlated (r,20.70;
                                                                            P,0.001). Strong positive correlations (r.0.70; P,0.001) were
                                                                            observed between the second principal component (PC2) and two
                                                                            precipitation-related variables (BIO13 and BIO16). The biplot
                                                                            that was constructed by the two principal components showing
                                                                            populations and 19 environmental factors (as vectors) is presented
                                                                            in Figure 5. PC1, explaining 60.79% of the total variation,
                                                                            separated the middle (pops. 7–11) and southern (pops. 13–15, 19
                                                                            and 20) Adriatic populations occupying warmer habitats from
                                                                            pops. 12, 16, 17 and 18, which were sampled at higher elevation
                                                                            (516 to 1,335 m.a.s.l.). Along PC2, explaining 21.04% of the total
                                                                            variation, the northern Adriatic populations (pops. 1–6), occupying
                                                                            habitats that were characterized by greater rainfall, were separated
                                                                            from the remaining populations. The average Euclidean distance
                                                                            between the pairs of populations that was calculated based on the
Figure 3. Unrooted Fitch-Margoliash tree of 20 Tanacetum                    standardized scores of the first three principal components was
cinerariifolium populations. Bootstrap values greater than 50% that         5.34, ranging from 0.08 (between pops. 16 and 17) to 10.12
were obtained after 1000 permutations are indicated on the branches.        (between pops. 8 and 16, respectively).
doi:10.1371/journal.pone.0105265.g003
                                                                               A greater correlation was found between the genetic and
                                                                            environmental distances (r = 0.376; PMantel,0.001) than between
Isolation by distance (IBD) and isolation by                                the genetic and geographical distances (Figure 4B). After consid-
environmental distance (IBED)                                               ering the effect of the geographical distances in a three-way
   A significant correlation was found between the genetic and              Mantel test, the correlation between the residual genetic and
geographical distances (r = 0.236; PMantel = 0.012), suggesting that        residual environmental distances remained significant (r = 0.351;
5.6% of the genetic differentiation between populations could be            PMantel = 0.005) suggesting that isolation by environmental
explained by geographical distances (Figure 4A).                            distance (IBED) explains 12.3% of the observed genetic pattern
   As expected, 19 environmental variables were highly intercor-            (Figure 4C). The removal of the effect of environmental variation
related. Out of 171 pairwise correlations, 107 (62.57%) were                resulted in a still significant but much lower correlation between
significant at P,0.05 (Table S1). In 49 cases the strong positive           the genetic and geographic distances (r = 0.189; PMantel = 0.039).
correlations (r.0.70) were detected, mostly among eleven
temperature-related variables (BIO01–BIO11) and among eight                 Discussion
precipitation-related variables (BIO12–BIO19). The strong nega-
tive correlations (r,20.70) were found in 10 cases, usually                   Identification of genetic diversity patterns is of fundamental
between temperature-related and precipitation-related variables.            importance for effective management and species conservation

Figure 4. Isolation by distance and isolation by environmental distance. Plots of Mantel’s test showing the relationships between A) the
geographical and genetic distances, B) the environmental and genetic distances and C) the residual environmental and genetic distances considering
the geographical distances between 20 Dalmatian pyrethrum populations.
doi:10.1371/journal.pone.0105265.g004

PLOS ONE | www.plosone.org                                              8                          August 2014 | Volume 9 | Issue 8 | e105265
Genetic Diversity of Tanacetum cinerariifolium Figure 5. PCA plot based on 19 environmental variables (BIO01–BIO19) describing 20 Tanacetum cinerariifolium sampling sites. doi:10.1371/journal.pone.0105265.g005 [7], and as we expand our knowledge about the genetic diversity refugial areas, followed by a period (s) of isolation occurs. Three and structure of natural populations, it subsequently becomes genetically and geographically distinct and well-defined groups of important to understand the mechanisms behind the determined Dalmatian pyrethrum populations therefore support the ‘‘refugia patterns. Therefore, the genetic diversity and population genetic within refugia’’ model that was already confirmed in numerous structure of Dalmatian pyrethrum must be analyzed both in the studies in the Balkan Peninsula [10,21,23,24]. The restricted gene context of demographic history and biological traits of the species flow among inter-refugial populations has led to genetic differen- [3]. Additionally, understanding the impact of geographical tiation, resulting in well-defined gene pools [82]. Among the 20 distances and consequently restricted gene flow among the populations that were included in this study, the highest levels of analyzed populations as well as climatic characteristics of the gene diversity, private alleles and DW were found in group of sampling sites can contribute to a better comprehension of the northern Adriatic populations from Kvarner bay. The genetic relationships between the populations. Furthermore, the fact that structure of these populations, which are grouped together within human historical activities might have influenced the observed the same cluster as revealed by the STRUCTURE analysis, pattern must not be excluded. suggests their ancient origin and significant isolation through a The results of our study show genetic differentiation of T. recent period of evolution [17] Such northerly located micro- cinerariifolium into two (Figure 2C) to three (Figure 2D) distinct refugia for a thermophytic species like Dalmatian pyrethrum is groups. At K = 2 it is plausible that the north-south split in the quite unexpected but is strongly supported by the obtained results. study area is due to widely spaced canyon of karstic river Zrmanja Previous research in this region on Dalmatian wall lizard (Podarcis in northern Dalmatia as karst rivers are often major barriers to the melisellensis) [21], nose-horned viper (Vipera ammodytes) [83] and otherwise continuous distribution of species. The obtained results Edraianthus tenuifolius [10] found no evidence of a refugium that are somewhat similar to the phylogeographical patterns detected far north. Our results could possibly be explained by numerous in Edraianthus tenuifolius [10], Campanula pyramidalis [25] and glaciations and interglaciation periods that are characteristic of the Cardamine maritima [81] showing either phylogeographical or Quaternary and that were accompanied by vast species migra- taxonomical split in the area of river Neretva valley (central tions. During the last interglacial period (approximately 130,000 Dalmatia). However, the fact that north-south split might be the yr. B. P. to 116,000 yr. B. P.), the global climate was warmer than artefact of genetic impoverishment (discussed further in the text) of at present [84–85], and it is possible that the populations that were central and southern population must not be neglected. With initially located in the more southern and thus warmer parts of additional splitting of southern gene pool at K = 3, a new pattern Adriatic basin expanded far to the north-west. By tracking suitable that is congruent with the survival of the species in multiple microhabitats some populations survived during the cold period, PLOS ONE | www.plosone.org 9 August 2014 | Volume 9 | Issue 8 | e105265
Genetic Diversity of Tanacetum cinerariifolium

and isolation from their pool of origin eventually has led to strong           be expected in the present day. However, during some past
genetic differentiation that can now be detected through northern              periods that were warmer than present (Holocene Climatic
Adriatic gene pool. These microhabitats in Kvarner bay served as               Optimum) [94], such altitudinal shifts in species distribution are
microrefugia, and at the end of the last glacial period, these                 quite expected and have already been documented for the western
protected and long-lived populations recolonized the northern                  Balkans [10]. Therefore, these populations can be treated as relict
Adriatic regions. However, a major flaw of this hypothesis is that             populations, which are ecologically isolated from other popula-
in this scenario, there should be at least some evidence of ancient            tions. Evidently, a sufficient period of time has passed for this
populations in the southern parts of the Adriatic basin. Generally,            group of populations to diverge and form a separate, well-defined
in more southern populations, the levels of gene diversity, number             gene pool.
of private alleles and DW decrease. Overall, the detected pattern is              Evidence that both geography and environmental heterogeneity
not in concordance with the general predictions that the highest               contributed significantly to the obtained patterns of genetic
levels of diversity can be detected among southern regions of                  divergence was found. The IBD analysis showed positive and
species distribution range [5,82], thus suggesting either a more               significant correlations, which could in principal be the result of
recent origin of these populations or some past event which                    successive postglacial colonization from the refugia [28]. However,
resulted in abrupt changes of their genetic structure. At this point,          a large part of unexplained genetic variations among the
human activity and the excessive gathering of this species during              populations still remains after accounting for the geographical
the last century, primarily in the southern and, to a lesser extent, in        distances. Furthermore, a significant correlation between environ-
the northern parts of Adriatic, must be considered. In fact, until             mental and genetic variation was found, and 12.3% of the genetic
the 1850s, the only reliable source of pyrethrum material was from             variation was explained by environmental heterogeneity. The
wild plants [45]; hence, it is very likely that overexploitation alone         populations from Mt. Biokovo (pops. 16, 17 and 18), located at
is responsible for such low gene diversity and DW. An exception is             significantly higher elevation (from 1295 to 1335 m.a.s.l.),
the population 19 located in the southern parts of the species’                inhabiting environmentally distinct habitat in comparison to the
range. Because it exhibits high levels of gene diversity accompa-              remaining populations, are typical cases of environmental
nied by low levels of private alleles and DW, this population is               isolation. It is well acknowledged that microclimate strongly
likely the zone of secondary contact between the divergent lineages            influences plant phenology [95–96] whereas differences in
and is anthropogenic in origin. Additionally, some populations                 temperature, photoperiod and moisture are major factors in
show a quite admixed pattern comprising large fractions of                     shaping patterns of flowering and fruiting [97]. Due to cooler
different gene pools (pops. 8, 9, 11, etc.). The specific structure of         temperatures and higher precipitation the populations from Mt.
these populations could also easily be a consequence of the                    Biokovo tend to flower later (cca. 20 days) than do the low-
admixture of divergent lineages through secondary contact after                elevation populations (authors observations); therefore, there is no
postglacial colonization, however, more likely explanation of the              phenological overlap between them, resulting in genetic isolation
obtained results could lie in the cultivation practices of Dalmatian           and differentiation of Mt. Biokovo populations (pops. 16, 17, 18).
pyrethrum, which began in 1850s near Dubrovnik (Southern                       In addition, great influence of sea surface on coastal area
Dalmatia) and rapidly expanded along the Dalmatian coastal                     ecological conditions and consequently on vegetation cover [25]
region and the islands [45]. These populations could have been                 could have also served as a stimulus for such strong differentiation
founded through human activity by the exchange of seed material                between high altitude and lowland populations. Bathymetric
between farmers from different geographical regions. It is well                configuration of Adriatic Sea floor is characterized by very deep
documented that anthropogenic activities foster genetic homoge-                valley with steep slopes in southern region (South Adriatic Basin)
nization and decrease genetic differentiation among populations                and relatively shallow and plain central and northern region [98–
[36,86–87]. Therefore, we hypnotize that for southern populations              99]. For that reason northern Adriatic part has experienced more
overexploitation and process of cultivation are responsible for                pronounced substantial shifts in shoreline during the sea-level
substantial loss of private alleles, levels of gene diversity and DW.          fluctuations, while the southern regions remained almost un-
Moreover, extensive seed exchange between different populations                changed [100]. Therefore, in the past when the sea level was
caused admixture as observed in pops. 8, 9 and 11. Thus, this                  significantly lower than today [99,101], populations from middle
phylogeographical study could represent typical example of                     and especially southern parts of Dalmatia were located in
humans’ shaping the genetic structure of investigated plant                    proximity of the sea as they are today. However, this is not the
species. The genetic impoverishment as a result of either                      case for high altitude areas as they were never located near sea
overexploitation of wild resources or cultivation practices has also           surface, which might have resulted in divergent evolution
been demonstrated for American ginseng (Panax quinquefolius L.)                particularly observed in Mt. Biokovo populations (pops. 16, 17
[35], Rheum tanguticum [88], Scutellaria baicalensis [37],                     and 18). The strong influence of environmental factors on genetic
Eucommia ulmoides [89], Moringa peregrina [90], etc.                           divergence of populations has already been documented for
   The lowest values of gene diversity were detected in the                    several plant [77,102] and animal species [31,33]. For example,
populations from Mt. Biokovo (pops. 16, 17 and 18) (HE = 0.092–                Temunović et al. [77] determined genetic structuring of Croatian
0.096), which were also identified as a separate gene pool by the              Continental and Mediterranean ash trees populations (Fraxinus
Bayesian cluster analysis. The Mt. Biokovo populations (pops. 16,              angustifolia Vahl) due to contrasting ecological conditions of the
17 and 18) were sampled in geographically and ecologically                     sampling sites. Similarly, strong fine-scale spatial genetic structure
marginal areas of the species distribution, and it is generally                associated with habitat factors was detected in continuous
expected that in such peripheral populations, the amounts of                   population of Biscutella laevigata [102]. For the Franciscana
diversity may be reduced [91]. This reduction can be the result of,            dolphins genetically isolated populations in environmentally
small population size, increased isolation and consequently                    distinct areas of Argentina were observed [33] and for the grey
reduced gene flow [92–93]. At such high elevation (greater than                wolf (Canis lupus) genetic differentiation among local populations
1200 m.a.s.l.) with atypical climatic conditions for the species, it is        was correlated to contrasting climatic conditions [31].
highly unlikely that the spontaneous formation and development                    In our study the detected IBED pattern explained more than
of populations of such a pronouncedly thermophytic species could               twice the genetic divergence than did the IBD pattern (12.3 vs.

PLOS ONE | www.plosone.org                                                10                          August 2014 | Volume 9 | Issue 8 | e105265
Genetic Diversity of Tanacetum cinerariifolium

5.6%, respectively). Therefore it is clear that the revealed genetic                          Supporting Information
differentiation in Dalmatian pyrethrum is more strongly influ-
enced by the bioclimatic conditions of the sampling sites rather                              Figure S1      Genetic structure of T. cinerariifolium pop-
than by geographic distances per se.                                                          ulations. (A) using software Structure and assuming K = 2, (B)
                                                                                              using Structure and assuming K = 3; (C) using BAPS without
                                                                                              spatially informative prior, and (D) using BAPS with spatially
Conclusion                                                                                    informative prior. Each individual plant is represented by a single
   The aim of this study was to analyze the genetic diversity and                             vertical line divided into colors. Each color represents one cluster,
structure of natural Dalmatian pyrethrum (Tanacetum cinerar-                                  and the length of the colored segment shows the individual’s
iifolium Trevir. /Sch./ Bip.) populations from Croatia. Overall, our                          estimated proportion of membership in that cluster. White lines
results show that, as a thermophytic plant, Dalmatian pyrethrum                               separate populations that are labelled below the figure (1–20).
could have survived the Quaternary climatic oscillation along the                             (TIF)
eastern Adriatic coast by tracking suitable habitats, i.e., micro-                            Table S1 Correlations coefficients (r; lower diagonal)
refugia. Northern Adriatic populations, which were identified as a                            and its significance (P-values; upper diagonal) among 19
separate cluster by the STRUCTURE analysis, are characterized                                 environmental variables at 20 sampling sites of T.
by high levels of gene diversity and DW and should be treated as                              cinerariifolium in Croatia.
conservation priority sites. Human influence through overexploi-                              (DOCX)
tation and cultivation has resulted in the low genetic variability of
southern Adriatic populations. The results also provide evidence                              Author Contributions
that both IBD and especially IBED contributed to the genetic
                                                                                              Conceived and designed the experiments: ZS ZL MG. Performed the
differentiation among some populations.                                                       experiments: MG ZL. Analyzed the data: MG ZS ZL. Contributed
                                                                                              reagents/materials/analysis tools: ZL IR. Contributed to the writing of the
                                                                                              manuscript: MG ZS ZL IR KCS IK.

References
  1. Hamrick JL, Godt MJ (1996) Effect of life history traits on genetic diversity in          19. Hewitt GM (2001) Speciation, hybrid zones and phylogeography - or seeing
     plant species. Philos Trans R Soc Lond B Biol Sci 351: 1291–1298.                             genes in space and time. Mol Ecol 10: 537–549.
  2. Yamagishi M, Nishioka M, Kondo T (2010) Phenetic diversity in the Fritillaria             20. Savić IR (2008) Diversification of the balkan fauna: its origin, historical
     camschatcensis population grown on the Sapporo campus of Hokkaido                             development and present status. In: Makarov SE, Dimitrijević RN, editors.
     University. Landsc Ecol Eng 6: 75–79.                                                         Advances in Arachnology and Developmental Biology: papers dedicated to
  3. Hewitt GM (1999) Post-glacial re-colonization of European biota. Biol J Linn                  Prof. Dr. Božidar Ćurčić. Belgrade: Institute of Zoology, Faculty of Biology;
     Soc Lond 68: 87–112.                                                                          Sofia: BAS; Vienna: Faculty of Life Sciences; Belgrade: SASA; UNESCO MAB
  4. Pope LC, Domingo-Roura X, Erven K, Burke T (2006) Isolation by distance                       Serbia. 57–78.
     and gene flow in the Eurasian badger (Meles meles) at both a local and broad              21. Podnar M, Mayer W, Tvrtkovic N (2004) Mitochondrial phylogeography of the
     scale. Mol Ecol 15: 371–386.                                                                  Dalmatian wall lizard, Podarcis melisellensis (Lacertidae). Org Divers Evol 4:
  5. Taberlet P, Fumagalli L, Wust-Saucy AG, Cosson JF (1998) Comparative                          307–317.
     phylogeography and postglacial colonization routes in Europe. Mol Ecol 7:                 22. Lakušić D, Novčić R, Kučera J, Marhold K (2006) Cardamine pancicii Hayek
     453–464.                                                                                      (Brassicaceae), a neglected species of the Balkan Peninsula: Morphological and
  6. Hewitt G (2000) The genetic legacy of the Quaternary ice ages. Nature 405:                    molecular evidence. Willdenowia 36: 177–191.
     907–913.                                                                                  23. Previšić A, Walton C, Kučinić M, Mitrikeski PT, Kerovec M (2009) Pleistocene
  7. Schmitt T (2007) Molecular biogeography of Europe: Pleistocene cycles and                     divergence of Dinaric Drusus endemics (Trichoptera, Limnephilidae) in
     postglacial trends. Front Zool 4: 11. doi:10.1186/1742-9994-4-11.                             multiple microrefugia within the Balkan Peninsula. Mol Ecol 18: 634–647.
  8. Hofreiter M, Stewart J (2009) Ecological change, range fluctuations and                   24. Kryštufek B, Buzan EV, Hutchinson WF, Hänfling B (2007) Phylogeography of
     population dynamics during the Pleistocene. Curr Biol 19: R584–R594.                          the rare Balkan endemic Martino’s vole, Dinaromys bogdanovi, reveals strong
  9. Hewitt GM (1996) Some genetic consequences of ice ages, and their role in                     differentiation within the western Balkan Peninsula. Mol Ecol 16: 1221–1232.
     divergence and speciation. Biol J Linn Soc Lond 58: 247–276.                              25. Lakušić D, Liber Z, Nikolić T, Surina B, Kovačić S, et al. (2013) Molecular
 10. Surina B, Schönswetter P, Schneeweiss GM (2011) Quaternary range dynamics                    phylogeny of the Campanula pyramidalis species complex (Campanulaceae)
     of ecologically divergent species (Edraianthus serpyllifolius and E. tenuifolius,             inferred from chloroplast and nuclear non-coding sequences and its taxonomic
     Campanulaceae) within the Balkan refugium. J Biogeogr 38: 1381–1393.                          implications. Taxon 62: 505–524.
 11. Petit RJ, Aguinagalde I, de Beaulieu JL, Bittkau C, Brewer S, et al. (2003)
                                                                                               26. Wright S (1943) Isolation by distance. Genetics 28: 114–138.
     Glacial Refugia: Hotspots But Not Melting Pots of Genetic Diversity. Science
                                                                                               27. Ægisdóttir HH, Patrick Kuss P, Stöcklin J (2009) Isolated populations of a rare
     300: 1563–1565.
                                                                                                   alpine plant show high genetic diversity and considerable population
 12. Gomez A, Lunt DH (2007) Refugia within refugia: patterns of phylogeographic
                                                                                                   differentiation Ann Bot 104: 1313–1322.
     concordance in the Iberian Peninsula. In: Weiss S, Ferrand N, editors.
                                                                                               28. Campillo S, Serra M, Carmona MJ, Gómez A (2011) Widespread Secondary
     Phylogeography of Southern European Refugia. Dordrech: Springer. 155–188.
                                                                                                   Contact and New Glacial Refugia in the Halophilic Rotifer Brachionus
 13. Canestrelli D, Aloise G, Cecchetti S, Nascetti G (2010) Birth of a hotspot of
     intraspecific genetic diversity: notes from the underground. Mol Ecol 9: 5432–                plicatilis in the Iberian Peninsula. PLoS ONE 6(6): e20986. doi:10.1371/
     5451.                                                                                         journal.pone.0020986.
 14. Vega R, Amori G, Aloise G (2010) Genetic and morphological variation in a                 29. Hou Y, Lou A (2011) Population Genetic Diversity and Structure of a
     Mediterranean glacial refugium: evidence from Italian pygmy shrews, Sorex                     Naturally Isolated Plant Species, Rhodiola dumulosa (Crassulaceae). PLoS
     minutus. (Mammalia: Soricomorpha). Biol J Linn Soc Lond 100: 774–787.                         ONE 6(9): e24497. doi:10.1371/journal.pone.0024497.
 15. Canestrelli D, Salvi D, Maura M, Bologna MA, Nascetti G (2012) One Species,               30. Wang IJ, Glor RE, Losos JB (2013) Quantifying the roles of ecology and
     Three Pleistocene Evolutionary Histories: Phylogeography of the Italian                       geography in spatial genetic divergence. Ecol Lett 16: 175–182.
     Crested Newt, Triturus carnifex. PLoS ONE 7(7): e41754. doi:10.1371/                      31. Pilot M, Jedrzejewski W, Branicki W, Sidorovich VE, Jedrzejewska B (2006)
     journal.pone.0041754.                                                                         Ecological factors influence population genetic structure of European grey
 16. Paun O, Schönswetter P, Winkler M, Intrabiodiv Consortium, Tribsch A                         wolves. Mol Ecol 15: 4533–4553.
     (2008) Historical divergence vs. contemporary gene flow: evolutionary history             32. Manel S, Schwartz MK, Luikart G, Taberlet P (2003) Landscape genetics:
     of the calcicole Ranunculus alpestris group (Ranunculaceae) in the European                   combining landscape ecology and population genetics. Trends Ecol Evol 18:
     Alps and the Carpathians. Mol Ecol 17: 4263–4275.                                             189–197.
 17. Schönswetter P, Tribsch A (2005) Vicariance and dispersal in the alpine                  33. Mendez M, Rosenbaum HC, Subramaniam A, Yackulic C, Bordino P (2010)
     perennial Bupleurum stellatum L. (Apiaceae). Taxon 54: 725–732.                               Isolation by environmental distance in mobile marine species: molecular
 18. Wielstra B, Crnobrnja-Isailović J, Litvinchuk SN, Reijnen BT, Andrew K, et al.               ecology of franciscana dolphins at their southern range. Mol Ecol 19: 2212–
     (2013) Tracing glacial refugia of Triturus newts based on mitochondrial DNA                   2228.
     phylogeography and species distribution modeling. Front Zool 10: 13.                      34. Kozak KH, Wiens JJ (2006) Does niche conservatism drive speciation? A case
     doi:10.1186/1742-9994-10-13.                                                                  study in North American salamanders. Evolution 60: 2604–2621.

PLOS ONE | www.plosone.org                                                               11                               August 2014 | Volume 9 | Issue 8 | e105265
Genetic Diversity of Tanacetum cinerariifolium
35. Cruse-Sanders JM, Hamrick JL (2004) Genetic diversity in harvested and 67. Schneider S, Roessli D, Excoffier L (2000) ARLEQUIN Version 2.000: A
protected populations of wild American ginseng, Panax quinquefolius L. Software for Population Genetic Data Analysis. Geneva: Genetics and
(Araliaceae). Am J Bot 91: 540–5488. Biometry Laboratory University of Geneva.
36. Doebley JF, Gaut BS, Smith BD (2006) The molecular genetics of crop 68. Huff DR (1997) RAPD characterization of heterogeneous perennial ryegrass
domestication. Cell 127: 1309–1321. cultivars. Crop Sci 37: 557–564.
37. Yuan QJ, Zhang ZY, Hu J, Guo LP, Shao AJ, et al. (2010) Impacts of recent 69. Pritchard JK, Stephens M, Donnelly P (2000) Inference of population structure
cultivation on genetic diversity pattern of a medicinal plant, Scutellaria using multilocus genotype data. Genetics 155: 945–959.
baicalensis (Lamiaceae). BMC Genet 11: 29. 70. Evanno G, Regnaut S, Goudet J (2005) Detecting the number of clusters of
38. Bourguiba H, Audergon JM, Krichen L, Trifi-Farah N, Mamouni A, et al. individuals using the software STRUCTURE: a simulation study. Mol Ecol 14:
(2012) Loss of genetic diversity as a signature of apricot domestication and 2611–2620.
diffusion into the Mediterranean Basin. BMC Plant Biol 12: 49. 71. Ehrich D, Gaudeul M, Assefa A, Koch M, Mummenhoff K, et al. (2007)
39. MacDonald WL (1995) Pyrethrum flowers-production in Australia. In: Casida Genetic consequences of Pleistocene range shifts: Contrast between the Arctic,
JE, Quistad GB, editors. Pyrethrum flowers: Production, Chemistry, Toxicol- the Alps and the East African mountains. Mol Ecol 16: 2542–2559.
ogy, and Uses New York: Oxford University Press. 55–66. 72. Corander J, Waldmann P, Sillanpää MJ (2003) Bayesian analysis of genetic
40. Parlevliet JE (1975) Breeding pyrethrum in Kenya. Pyrethrum Post 13: 47–54. differentiation between populations. Genetics 163: 367–374.
41. Nikolić T. ed. (2014) Flora Croatica Database. Faculty of Science, University of 73. Corander J, Marttinen P, Sirén J, Tang J (2008) Enhanced Bayesian modelling
Zagreb. Available: http://hirc.botanic.hr/fcd. in BAPS software for learning genetic structures of populations. BMC
Bioinformatics 9: 539.
42. Heywood VH (1976) Tanacetum. In: Tutin TG, Heywood VH, Burges NA,
74. Corander J, Marttinen P (2006) Bayesian identification of admixture events
Moore DM, Valentine DH, Walters SM, Webb DA, editors. Flora Europaea,
using multi-locus molecular markers. Mol Ecol 15: 2833–2843.
Plantaginaceae to Compositae (and Rubiaceae). Volume 4. Cambridge:
75. Rousset F (1997) Genetic differentiation and estimation of gene flow from F-
Cambridge University Press. 169–171.
statistics under isolation by distance. Genetics 145: 1219–1228.
43. Head SW (1973) Composition of pyrethrum extract and analysis of pyrethrins.
76. Mantel N (1967) The detection of disease clustering and a generalized
In: Casida JE, editor. Pyrethrum, The Natural Insecticide. New York:
regression approach. Cancer Res 27: 209–220.
Academic Press. 25–49.
77. Temunović M, Fernández-Manjarrés JF, Satovic Z, Grgurev M., Frascaria-
44. Ožanić S (1930) Buhač (Pyrethrum cinerariaefolium D.C.). Beograd: Prosveta. Lacoste N, et al. (2012) Environmental heterogeneity explains the genetic
Beograd. structure of Continental and Mediterranean populations of Fraxinus
45. Bakarić P (2005) Buhač - prirodni insekticid. Gospodarski list 17: 41–45. angustifolia Vahl. PLoS ONE 7(8): e42764. doi:10.1371/journal.pone.
46. Ožanić S (1955) Poljoprivreda Dalmacije u prošlosti. Split: Izdanje društva 0042764.
agronoma NRH- Podružnica Split. 230–231 p. 78. Hijmans RJ, Cameron SE, Parra JL, Jones PG, Jarvis A (2005) Very high
47. Shim S, Jørgensen RB (1999) Genetic structure in cultivated and wild carrots resolution interpolated climate surfaces for global land areas. Int J Climatol 25:
(Daucus carota L.) revealed by AFLP analysi. Theor Appl Genet 101: 227–233. 1965–1978.
48. Schmidt K, Jensen K (2000) Genetic structure and AFLP variation of remnant 79. Rohlf FJ (2000) NTSYS-pc. Numerical Taxonomy and Multivariate Analysis
populations in the rare plant Pedicularis palustris (Scrophulariaceae) and its System, version 2.1. New York: Exeter Publications.
relation to population size and reproductive components. Am J Bot 87: 678– 80. Bonin A, Bellemain E, Bronken Eidesen P, et al. (2004) How to track and assess
689. genotyping errors in population genetics studies. Mol Ecol 13: 3261–3273.
49. Rivera-Ocasio E, Aide TM, McMillan WO (2002) Patterns of genetic diversity 81. Kučera J, Tremetsberger VJ, Marhold K (2008) Molecular study of the
and biogeographical history of the tropical wetland tree, Pterocarpus officinalis Cardamine maritima group (Brassicaceae) from the Balkan and Apennine
(Jacq.), in the Caribbean basin. Mol Ecol 11: 675–683. Peninsulas based on amplified fragment length polymorphism. Plant Syst Evol
50. Li Q, Xiao M, Guo L, Wang L, Tang L, et al. (2005). Genetic diversity and 275: 193–207.
genetic structure of an endangered species, Trillium tschonoskii. Biochem 82. Hampe A, Petit RJ (2005) Conserving biodiversity under climate change: the
Genet 43: 445–458. rear edge matters. Ecol Lett 8: 461–467.
51. Baldoni L, Tosti N, Ricciolini C, Belaj A, Arcioni S, et al. (2006) Genetic 83. Ursenbacher S, Schweiger S, Tomović L, Crnobrnja-Isailović J, Fumagalli L, et
Structure of Wild and Cultivated Olives in the Central Mediterranean Basin. al. (2008) Molecular phylogeography of the nose-horned viper (Vipera
Ann Bot 98: 935–942. ammodytes, Linnaeus (1758)): evidence for high genetic diversity and multiple
52. Yang D, Ma P, Liang X, Liang Z, Zhang M, et al. (2012) Metabolic Profiles refugia in the Balkan peninsula. Mol Phylogenet Evol 46: 1116–1128.
and cDNA-AFLP Analysis of Salvia miltiorrhiza and Salvia castanea Diel f. 84. Muhs DR, Ager TA, Begét JE (2001) Vegetation and paleoclimate of the last
tomentosa Stib. PLoS ONE 7(1): e29678. doi:10.1371/journal.pone.0029678. interglacial period, central Alaska. Quat Sci Rev 20: 41–61.
53. Wang T, Chen G, Zan Q, Wang C, Su Y-j (2012) AFLP Genome Scan to 85. Kukla GJ, Bender ML, de Beaulieu J-L, Bond G, Broecker WS, et al. (2002)
Detect Genetic Structure and Candidate Loci under Selection for Local Last interglacial climates. Quat Res 58: 2–13.
Adaptation of the Invasive Weed Mikania micrantha. PLoS ONE. 7(7): 86. Olden JD, Poff NL, Douglas MR, Douglas ME, Fausch KD (2004) Ecological
e41310. doi:10.1371/journal.pone.0041310. and evolutionary consequences of biotic homogenization. Trends Ecol Evol 19:
54. Vos P, Hogers R, Bleeker M, Reijans M, Van de Lee T, et al. (1995) AFLP: a 18–24.
new technique for DNA fingerprinting. Nucleic Acids Res 23: 4407–4414. 87. Wiersum KF, Dold AP, Husselman M, Cocks M (2006) Cultivation of
55. Carović-Stanko K, Liber Z, Politeo O, Strikić F, Kolak I, et al. (2011) medicinal plants as a tool for biodiversity conservation and poverty alleviation
Molecular and chemical characterization of the most widespread Ocimum in the Amatola region, South Africa. In: Bogers RJ, Craker LE, Lange D,
species. Plant Syst Evol 294: 253–262. editors. Medicinal and Aromatic Plants. Dordrech: Springer. 43–57.
56. Herrmann D, Poncet BN, Manel S, Rioux D, Gielly L, et al. (2010) Selection 88. Hua Y, Wang L, Xie X, Yang J, Li Y, Zhang H (2010) Genetic diversity of wild
criteria for scoring amplified fragment length polymorphisms (AFLPs) positively populations of Rheum tanguticum endemic to China as revealed by ISSR
affect the reliability of population genetic parameter estimates. Mol Ecol 53: analysis. Biochem Syst Ecol 38: 264–274.
302–310. 89. Yao X, Deng J, Huang H (2012) Genetic diversity in Eucommia ulmoides
(Eucommiaceae), an endangered traditional Chinese medicinal plant. Conserv
57. Shannon CE, Weaver W (1949) The Mathematical Theory of Communication.
Genet 13: 1499–1507.
Urbana: University of Illinois Press.
90. Zaghloul MS, Hamrick JL, Moustafa AA (2012) Conservation genetics of
58. Lewontin RC (1972) The apportionment of human diversity. Evol Biol 6: 381–
Sinai’s remnant populations of Moringa peregrina, an economically valuable
398.
medicinal plant. Conserv Genet 13: 9–19.
59. Ehrich D (2006) AFLPdat: a collection of R functions for convenient handling 91. Eckert CG, Samis KE, Lougheed C (2008) Genetic variation across species’
of AFLP data. Mol Ecol Notes 6: 603–604. geographical ranges: the central–marginal hypothesis and beyond. Mol Ecol
60. Zhivotovsky LA (1999) Estimating population structure in diploids with 17: 1170–1188.
multilocus DNA markers. Mol Ecol 8: 907–913. 92. Lesica P, Allendorf FW (2002) When Are Peripheral Populations Valuable for
61. Vekemans X, Beauwens BS, Lemaire M, Roldan-Ruiz I (2002) Data from Conservation? Conserv Biol 9: 753–760.
amplified fragment length polymorphism (AFLP) markers show indication of 93. Vucetich JA, Waite TA (2003) Spatial patterns of demography and genetic
size homoplasy and of a relationship between degree of homplasy and fragment processes across the species’ range: Null hypotheses for landscape conservation
size. Mol Ecol 11: 139–151. genetics. Conserv Genet 4: 639–645.
62. Lynch M, Milligan BG (1994) Analysis of population genetic structure with 94. Rossignol-Strick M (1999) The Holocene climatic optimum and pollen records
RAPD markers. Mol Ecol 3: 91–99. of sapropel 1 in the eastern Mediterranean, 9000–6000 BP. Quat Sci Rev 18:
63. Nei M (1973) Analysis of gene diversity in subdivided populations. Proc Nat 515–530.
Acad Sci 70: 3321–3323. 95. Fitter AH and Fitter RSR (2002) Rapid Changes in Flowering Time in British
64. Nei M (1972) Genetic distance between populations. Am Nat 106: 283–292. Plants. Science 296: 1689–1691.
65. Felsenstein J (1993) Phylogeny Inference Package (PHYLIP). Version 3.5. 96. Dahlgren JP, von Zeipel H, Ehrlen J (2007) Variation in vegetative and
Seattle: Department of genetics, University of Washington. flowering phenology in a forest herb caused by environmental heterogeneity.
66. Excoffier L, Smouse PE, Quattro JM (1992) Analysis of molecular variance Am J Bot 94: 1570–1576.
inferred from metric distances among DNA haplotypes: application to human 97. Warren RJ, Bahn V, Bradford MA (2011) Temperature cues phenological
mitocondrial DNA restriction sites. Genetics 131: 479–491. synchrony in ant-mediated seed dispersal. Glob Chang Bio 17: 2444–2454.
PLOS ONE | www.plosone.org 12 August 2014 | Volume 9 | Issue 8 | e105265You can also read