Molecular genetic diversity and differentiation of Nile tilapia (Oreochromis niloticus, L. 1758) in East African natural and stocked populations ...
←
→
Page content transcription
If your browser does not render page correctly, please read the page content below
Tibihika et al. BMC Evolutionary Biology  (2020) 20:16
https://doi.org/10.1186/s12862-020-1583-0

 RESEARCH ARTICLE                                                                                                                                 Open Access

Molecular genetic diversity and
differentiation of Nile tilapia (Oreochromis
niloticus, L. 1758) in East African natural
and stocked populations
Papius Dias Tibihika1,2* , Manuel Curto1, Esayas Alemayehu2,3, Herwig Waidbacher4, Charles Masembe5,
Peter Akoll5 and Harald Meimberg1

  Abstract
  Background: The need for enhancing the productivity of fisheries in Africa triggered the introduction of non-native
  fish, causing dramatic changes to local species. In East Africa, the extensive translocation of Nile tilapia (Oreochromis
  niloticus) is one of the major factors in this respect. Using 40 microsatellite loci with SSR-GBS techniques, we
  amplified a total of 664 individuals to investigate the genetic structure of O. niloticus from East Africa in comparison
  to Ethiopian and Burkina Faso populations.
  Results: All three African regions were characterized by independent gene-pools, however, the Ethiopian
  population from Lake Tana was genetically more divergent (Fst = 2.1) than expected suggesting that it might be a
  different sub-species. In East Africa, the genetic structure was congruent with both geographical location and
  anthropogenic activities (Isolation By Distance for East Africa, R2 = 0.67 and Uganda, R2 = 0.24). O. niloticus from Lake
  Turkana (Kenya) was isolated, while in Uganda, despite populations being rather similar to each other, two main
  natural catchments were able to be defined. We show that these two groups contributed to the gene-pool of
  different non-native populations. Moreover, admixture and possible hybridization with other tilapiine species may
  have contributed to the genetic divergence found in some populations such as Lake Victoria. We detected other
  factors that might be affecting Nile tilapia genetic variation. For example, most of the populations have gone
  through a reduction in genetic diversity, which can be a consequence of bottleneck (G-W, < 0.5) caused by
  overfishing, genetic erosion due to fragmentation or founder effect resulting from stocking activities.
  Conclusions: The anthropogenic activities particularly in the East African O. niloticus translocations, promoted
  artificial admixture among Nile Tilapia populations. Translocations may also have triggered hybridization with the
  native congenerics, which needs to be further studied. These events may contribute to outbreeding depression and
  hence compromising the sustainability of the species in the region.
  Keywords: Cichlids, Fish translocations, Genetic structure, Gene flow, Bottleneck

* Correspondence: papius.tibihika@students.boku.ac.at; papiust@yahoo.com
1
 Institute for Integrative Nature Conservation Research, University of Natural
Resources and Life Sciences Vienna (BOKU), Gregor Mendel Straße 33, 1180
Wien, Austria
2
 National Agricultural Research Organization, Kachwekano Zonal Agricultural
Research and Development Institute, P.O. Box 421, Kabale, Uganda
Full list of author information is available at the end of the article

                                         © The Author(s). 2020 Open Access This article is distributed under the terms of the Creative Commons Attribution 4.0
                                         International License (http://creativecommons.org/licenses/by/4.0/), which permits unrestricted use, distribution, and
                                         reproduction in any medium, provided you give appropriate credit to the original author(s) and the source, provide a link to
                                         the Creative Commons license, and indicate if changes were made. The Creative Commons Public Domain Dedication waiver
                                         (http://creativecommons.org/publicdomain/zero/1.0/) applies to the data made available in this article, unless otherwise stated.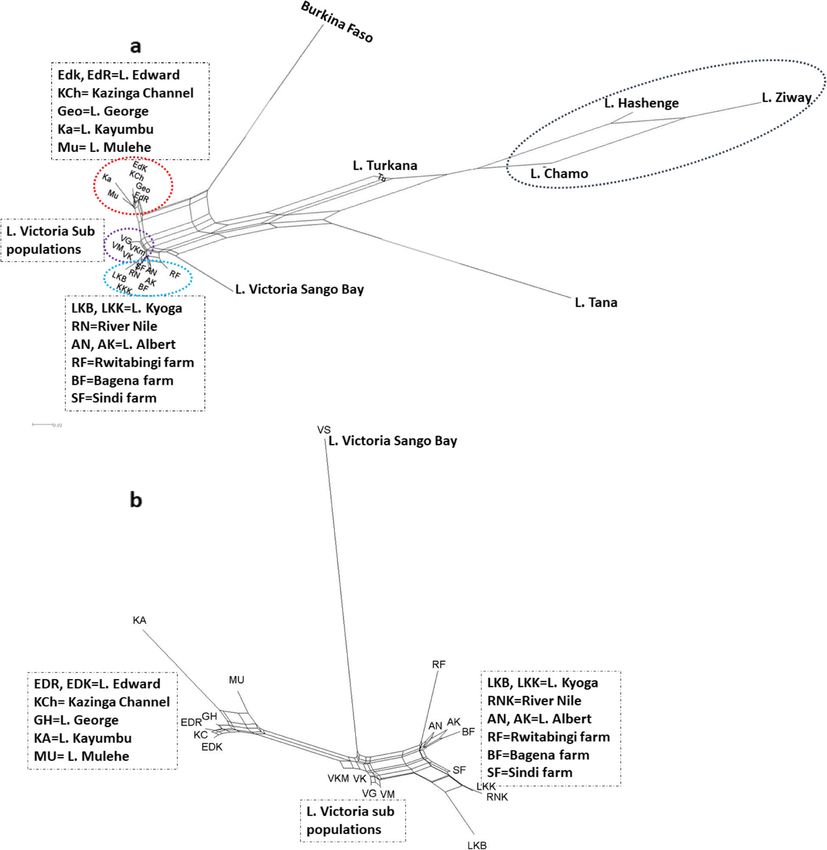
Tibihika et al. BMC Evolutionary Biology   (2020) 20:16                                                          Page 2 of 20

Background                                                       [4, 9, 12]. The loss of indigenous O. mossambicus due to
Nile tilapia, Oreochromis niloticus, is native to the Levant     hybridization with the introduced O. niloticus has been
and African freshwater systems e.g., in the Western part         reported in South Africa [13]. The situation in East Af-
of the continent (e.g., Senegal, Gambia, Niger, Benue,           rica may have worsened with the recent boom of fish
Chad) as well as to many of the East African rivers (e.g.        hatcheries and aquaculture production systems [14]. In
R. Nile) and Rift Valley Lakes like, Albert, Turkana,            this context, feral populations resulting from escapees
George, Edward, Tanganyika, Kivu, etc. [1, 2]. Although          might be an additional and serious threat to natural
O. niloticus is native to Africa, the cichlid is naturally ab-   systems.
sent in the world’s largest tropical freshwater body, Lake          In nearly the last two decades, the East African coun-
Victoria and the neighboring Lakes Kyoga and Nabu-               tries have been developing measures for fisheries sus-
gabo as well as many of the East African satellite lakes         tainable exploitation through the implementation of co-
[2–5]. These lakes were naturally inhabited by two tila-         management strategies [15]. Nonetheless, conservation
piine species; O. variabilis (Nyasalapia) and O. esculentus      and management of the already admixed species might
(Ngege) [2–4]. For more than nine decades, O. niloticus          not be achieved if the genetic structure of the species in
has been intentionally dispersed worldwide, in particular        question is not well understood, as the stocks are diffi-
for aquaculture and restocking programs [2, 6]. In East          cult to define [16]. Therefore, with respect to the East
Africa, various fish introductions are reported, starting        African O. niloticus, as the species were potentially af-
in the 1920s. For example, O. niloticus, and other tila-         fected by various anthropogenic activities, a thorough
piines e.g. Athi River Tilapia (Tilapia spilurus nigra,          characterization of the populations at the molecular level
Günther 1894) as well as Black bass (Micropterus sal-            might be needed.
moides), being initially translocated for enhancing fisher-         Based on the earliest studies, East African O. niloticus
ies productivity in water bodies naturally considered as         diversity has been studied using both traditional mor-
unproductive like the southwestern Uganda high-                  phometric methods and molecular markers, which led to
altitude lakes [7, 8]. A case in point is Lake Bunyonyi          contradictory patterns in the species description. For ex-
which was stocked in the 1920s with individuals of O.            ample, using biometrics and counts, seven O. niloticus
niloticus from Lake Edward [7]. Similarly, in the 1950s,         subspecies from African different regions or lakes were
several tilapiine species were stocked into Lakes Victoria,      described [2]. Nevertheless, this classification was con-
Nabugabo and Kyoga to counteract the decline of native           tradicted by subsequent studies using morphometric
fish species (O. variabilis and O. esculentus) [3–5, 9].         analyses accompanied by allozyme markers, which indi-
The introduced species; O. niloticus, O. leucosticus             cated that the O. niloticus strain from Lake Edward is
(Blue-spotted tilapia), Coptodon zillii (Red-belly tilapia)      closely related to that of the lower Nile (Egypt) [17].
and O. melanopleura, were all suspected to originate             Also, other investigations using restriction endonuclease
from Lake Albert [3, 4, 9, 10]. However, some introduc-          mitochondrial DNA found that O. niloticus from Lake
tions might have also originated from Lake Edward and            Tana is distinct, contrary to the earlier traditional mor-
Lake Turkana into Lake Victoria basin [2, 4, 8]. Follow-         phometric and meristic analyses [18]. Other earlier mo-
ing these introductions, the indigenous fish species in          lecular genetic studies employing allozymes and
Lakes Victoria, Kyoga, and Nabugabo, significantly de-           restriction fragment length polymorphism (RFLP) of
clined in the 1980s, coinciding with the dramatic in-            mitochondrial DNA (mtDNA), as well as randomly amp-
crease in the stock size of the non-native O. niloticus [3,      lified polymorphic DNA (RAPD) for investigating the
4, 11]. The potential reasons for the declined native fish       demography of O. niloticus populations in East Africa,
species (O. variabilis and O. esculentus) were suspected         shed some additional light to these incongruences [1, 19,
to a combination of factors including; competition, over         20]. Some of these studies reported that O. niloticus
fishing, as well as predation pressures from another in-         populations from Albert Nile (the Egyptian stretch of
troduced species, the Nile perch (Lates niloticus) [3, 5].       River Nile) are distinct from the West African popula-
But one additional factor might have been hybridization          tions, also contrary to earlier morphometric studies [1].
between the native cichlids (O. variabilis and O. esculen-       Furthermore, these past investigations based on trad-
tus) and the introduced tilapiines, particularly O. niloti-      itional markers indicated conflicting results amongst.
cus [4, 9, 11]. Based on these events, the expanded              For example, findings from a combination of allozymes
distribution of O. niloticus in East Africa complicates the      and restriction fragment length polymorphism (RFLP) of
differentiation and identification of genetic units for          mtDNA indicated that O. niloticus in from Lake Tana is
management and conservation. For example, the popula-            clustered with Lake Edward and the Kenyan Lake Tur-
tion considered as non-native O. niloticus in Lakes              kana system, which differs from the findings based on
Victoria and Kyoga might have genetically diverged via           restriction endonuclease analysis of mtDNA [1, 18].
admixture and hybridization with the indigenous species          These results are inconsistent probably because of the
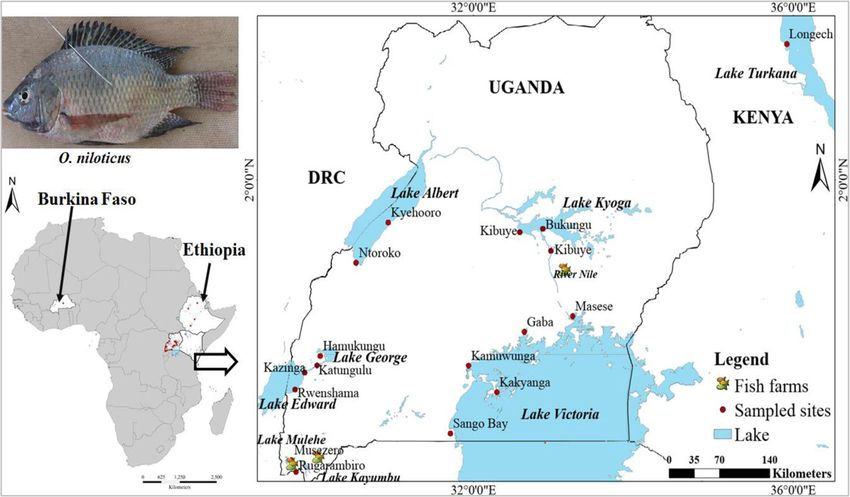
Tibihika et al. BMC Evolutionary Biology   (2020) 20:16                                                       Page 3 of 20

different methodological approaches used that comprise        genetic structure of the East African O. niloticus popula-
different information content [21–26]. Additionally, the      tions differ from those outside the region? 2) To what
markers used so far have low resolving power to               extent does the genetic structure of the East African O.
characterize variation within and between populations,        niloticus populations reflect the geography and an-
and the genetic fingerprinting markers like RAPD can-         thropogenic activities associated with the pathways of
not discern between homozygotes and heterozygotes             the translocation?
[22]. The lack of methodologies with high discriminating
power in the past studies, therefore, suggests that the       Results
genetic structure patterns of the East African O. niloticus   Variability of SSR loci
are insufficiently documented.                                In total, 13,530,228 paired reads were produced for
   In the present study, we utilize nuclear microsatellite    genotyping, from which 9,579,578 passed the quality
markers, simple sequence repeats (SSRs), to typify the O.     control steps, which were later used for allele calling.
niloticus in East Africa using next-generation sequen-        Genetic variation results for the 40 SSR loci are pre-
cing. SSR loci have been proven robust when investigat-       sented in the Additional file 1: Table S2. The number of
ing the genetic structure of O. niloticus, particularly,      alleles per locus had a mean value of 33.8 ± 20.5, ranging
using SSR genotyping by sequencing (SSR-GBS) [27].            from seven to 84, with a total of 1352 alleles generated
SSR-GBS approaches are useful because they reduce size        across all loci. Overall, 80% of the loci exhibited ex-
homoplasy, which is one of the constraints of traditional     pected heterozygosity (He) values greater than 0.5. Poly-
SSR fragment length analysis [28, 29]. However, SSR-          morphic Information Content (PIC) was generally
GBS is not without drawbacks [30]. For example, the           congruent with He, with 78% of loci indicating values of
presence of stutter complicates allele calling for di-        greater than 0.5 (Additional file 1: Table S2).
nucleotides, null alleles due to mutation on primer bind-
ing sites, and it does not recover genomic information        Genetic structure
hence overestimating events that had a small impact on        The UPGMA dendrogram showed that all East African
the gene-pool. Although generally, the use of SSR frag-       populations were more similar to each other than to the
ment length analysis can yield information for delineat-      other regions (Fig. 2). In this case, the three Ethiopian
ing populations, the recent studies in East Africa that       populations (Hashenge, Ziway, and Chamo) formed the
have used this approach on O. niloticus were limited to       most distant group followed by Burkina Faso and the
few water bodies in Kenya, with the broader scope of the      other Ethiopian water body, Lake Tana. Among the East
African Great Lakes missing [31–33]. It is important to       African natives, the largest separation was between the
conduct a comparative study of various water bodies           Kenyan, Lake Turkana, and the Ugandan water bodies.
where O. niloticus is present (native and non-native with     In Uganda, with exception of Lake Victoria, the non-
possible admixture). Such research would provide infor-       native lakes and fish farms grouped with a native popu-
mation on the genetic structure and diversity which           lation: the southern Ugandan high-altitude Lakes
would establish a firm base for management and conser-        (Kayumbu and Mulehe) with a group comprised by
vation of these cichlids [34].                                Lakes George, Edward and Kazinga Chanel; Lake Kyoga
   Here, we explicitly investigate the genetic structure of   populations- and Sindi Farm with River Nile; and Bagena
O. niloticus, in East Africa including some populations       and Rwitabingi farms with Albert. Four subpopulations
from Ethiopia and West Africa (Burkina Faso), repre-          of Lake Victoria (Gaba, Masese, Kakyanga, Kamuwunga)
senting the Sub-Saharan African Great Lakes. We com-          formed a sister group to the River Nile one. The Lake
pare natural/native with introduced/non-native O.             Victoria subpopulation Sango Bay showed the highest
niloticus populations, including other populations from       degree of divergence in Uganda.
aquaculture systems. With this approach, we investigate          Neighbor network results showed a similar pattern to
the impact of anthropogenic activities, particularly the      the UPGMA dendrogram both at regional and local
translocations, on the O. niloticus’ gene pool. This is es-   levels (Fig. 3). In this case, however, Burkina Faso was
pecially important to evaluate the genetic integrity of na-   observed to be closer to the Ugandan populations. In
tive stocks. We hypothesized that anthropogenic               general, network results reflected two Ugandan catch-
activities have affected the genetic divergence of O. nilo-   ment groups: the George, Kazinga Channel, and Edward
ticus populations, particularly in environments where         group together with the non-native Ugandan highland
the species was introduced. We also predict that the          lakes, and on the other end, Albert and River Nile sys-
geographical context exhibited by aquatic interconnec-        tems together with the non-native Lake Kyoga and all
tivity may influence the genetic homogeneity of cichlid       fish farms. Interestingly Lake Victoria exhibited an inter-
in such environments. We test these hypotheses by an-         mediate position between both groups with the subpop-
swering the following research questions: 1) Does the         ulation from Sango Bay showing a long branch,
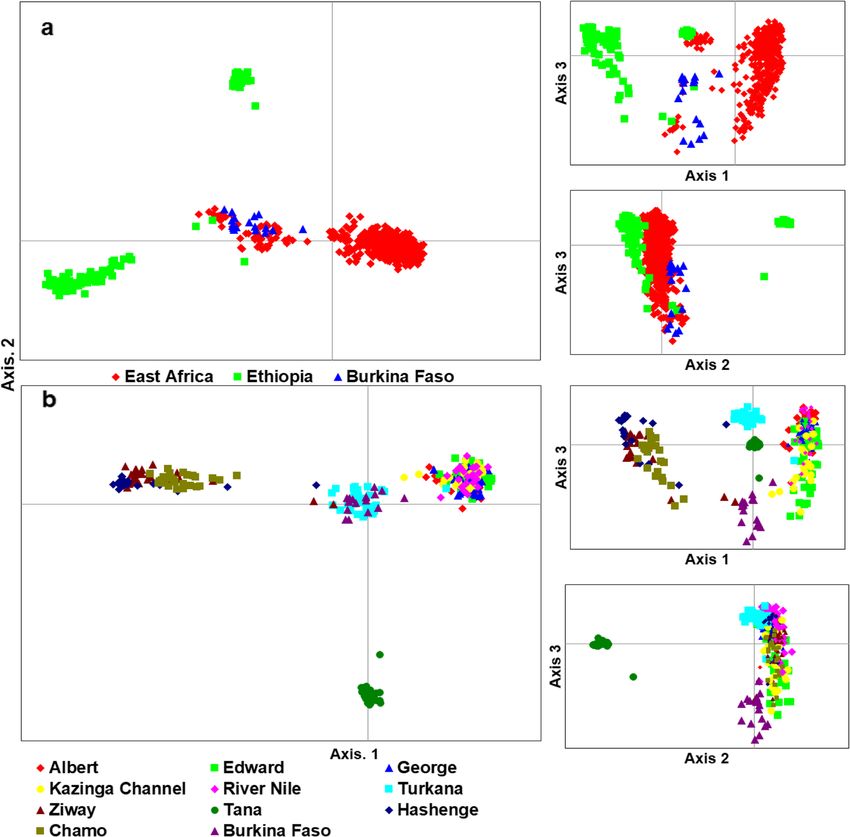
Tibihika et al. BMC Evolutionary Biology      (2020) 20:16                                                                               Page 4 of 20

 Fig. 1 Illustration of sample collection and sources in the African Great Lakes region; East Africa (Uganda and Kenya), Ethiopia and Burkina Faso;
 modified from our previous work [43]

suggesting high genetic differentiation. Overall, most of                    Bay formed a separate group from the remaining
the non-native populations (including farms) showed                          Ugandan individuals. A further group composed of
longer branches than the natives (Fig. 3).                                   Lake Hashenge individuals was found when only Ethi-
   Genetic distance between individuals which was vi-                        opian individuals were plotted (Fig. 5c). Substructure
sualized through principal coordinates analysis                              within the same lake was only evident for Lakes
(PCoA), analysis showed a separation of population                           Victoria and Kyoga (Fig. 6).
groups based on geographic regions (Fig. 4a). Samples                           The Bayesian analysis with STRUCTURE was por-
formed four groups when analyzed at the regional/                            trayed based on the optimal K values. For all popula-
country level (Fig. 4a): two groups with individuals                         tions, the best K was 10, all native populations, K = 7,
from Ethiopia, one with individuals from East Africa,                        East African native populations, K = 2, Ugandan native
and another intermediate group with samples from                             populations, K = 2, and all Ugandan populations includ-
both regions. The composition of these groups was                            ing farms, K = 4 (Additional file 1: Figure S2). O. niloti-
clearer when the distance between the native individ-                        cus populations from each African region were assigned
uals was plotted (Fig. 4b). At this level, Lake Turkana                      to different groups (Fig. 7a). Within each region, the
clustered with Burkina Faso, and a division between                          same assignments were observed with Lakes Tana and Tur-
the three Ethiopian Lakes (Hashenge, Chamo, and                              kana isolated from the rest of Ethiopians and East African
Ziway) and Lake Tana was clearly observed. Amongst                           populations, respectively (Fig. 7a). Among the Ugandan na-
East African populations, the separation between Lake                        tive populations, clustering was also congruent with the two
Turkana and the remaining native populations was                             water systems, as indicated earlier by both network and
evident (Fig. 4b). Individuals found in the Ugandan                          PCoA analyses, see Fig. 7b and c. However, there were cases
native populations were divided into two main groups                         where the non-native populations showed independent clus-
(Fig. 5a). One group was composed of Lake Albert                             ters from the native. For example, in all analyses, Lake
and River Nile individuals while the other by Lake                           Victoria clusters differed from other populations even when
Edward, Kazinga Channel, and Lake George. This div-                          only Ugandan O. niloticus were included in the analysis (Fig.
ision was less evident when individuals from non-                            7c). Apparently, admixture was more evident amongst the
native and fish farm populations were included in the                        East African populations but mostly detected when only
analysis (Fig. 5b). Here, some individuals from Sango                        non-native populations were considered (Fig. 7c).
Tibihika et al. BMC Evolutionary Biology (2020) 20:16 Page 5 of 20
Table 1 Details of the sampling sites and the total number of individuals collected per water body and location/site. The
indigenous O. niloticus populations, are also herein referred to as natives and introduced, non-natives and farms are the pond
culture systems
Lakes/River Sample Site Local name No. Country Pop. nature Coordinates Elev. (m)
Albert Ntoroko Ngege 21 Uganda Indigenous N.01.052060 E030.534640 618
Albert Kyehooro Ngege 16 Uganda Indigenous N.01.509900 E030.936100 615
0
Edward Rwenshama Ngege 27 Uganda Indigenous S.00.40459 E029.772830 908
Edward Kazinga Ngege 22 Uganda Indigenous S.00.207830 E029.892520 914
0 0
George Hamukungu Ngege 35 Uganda Indigenous S.00.01739 E030.08698 916
Kazinga Ch Katungulu Ngege 21 Uganda Indigenous S.00.125410 E030.047440 915
R. Nile (VN) Kibuye Ngege 24 Uganda Indigenousa N.01.187340 E032.968650 1062
Kyoga Kibuye Ngege 44 Uganda Introduced N.01.400280 E032.579490 1034
0 0
Kyoga Bukungu Ngege 22 Uganda Introduced N.01.43873 E032.86809 1045
Victoria Kakyanga Ngege 30 Uganda Introduced N.00.180790 E032.293320 1136
Victoria Gaba Ngege 26 Uganda Introduced N.00.258190 E032.637270 1146
Victoria Masese Ngege 23 Uganda Introduced N.00.436500 E033.240810 1136
0 0
Victoria Sango Bay Ngege 25 Uganda Introduced N.00.86772 E031.71332 1129
Victoria Kamuwunga Ngege 25 Uganda Introduced S.00.127470 E031.939990 1139
Mulehe kisoro Ngege 25 Uganda Introduced S.01.213450 E029.726680 1801
Kayumbu Kisoro Ngege 30 Uganda Introduced S.01.346790 E029.784460 1901
0 0
Rwitabingi Kamuli Ngege 29 Uganda Fish farm N.00.97116 E033.13924 1069
Bagena Kisoro Ngege 31 Uganda Fish farm S.01.256170 E029.736220 1857
Sindi Kabale Ngege 25 Uganda Fish farm S.01.175780 E030.061980 1733
Turkana Longech Ngege/Sato 35 Kenya Indigenous N.03.556170 E035.915990 364
Ziway Ziway Koroso 27 Ethiopia Indigenous N8.00730866 E38.8413922 1636
Tana Tana Koroso 32 Ethiopia Indigenous N12.0266003 E37.3036142 1831
Hashenge Hashenge Koroso 26 Ethiopia Indigenousa N12.5746028 E39.4966667 2443
Chamo Chamo Koroso 25 Ethiopia Indigenous N5.82128333 E37.5747222 1110
a
Loumbila Loumbila Tegr-pere 18 Burkina Fs Indigenous 12.5142528″N 01.3972222”w 276
Kazinga Ch Kazinga Channel, VN Victoria Nile, Burkina Fs Burkina Faso, and Population nature with the asterisk symbol (a) implies that the population might not be
indigenous, No. Number of samples, Pop. Population, and Elev. Elevation.
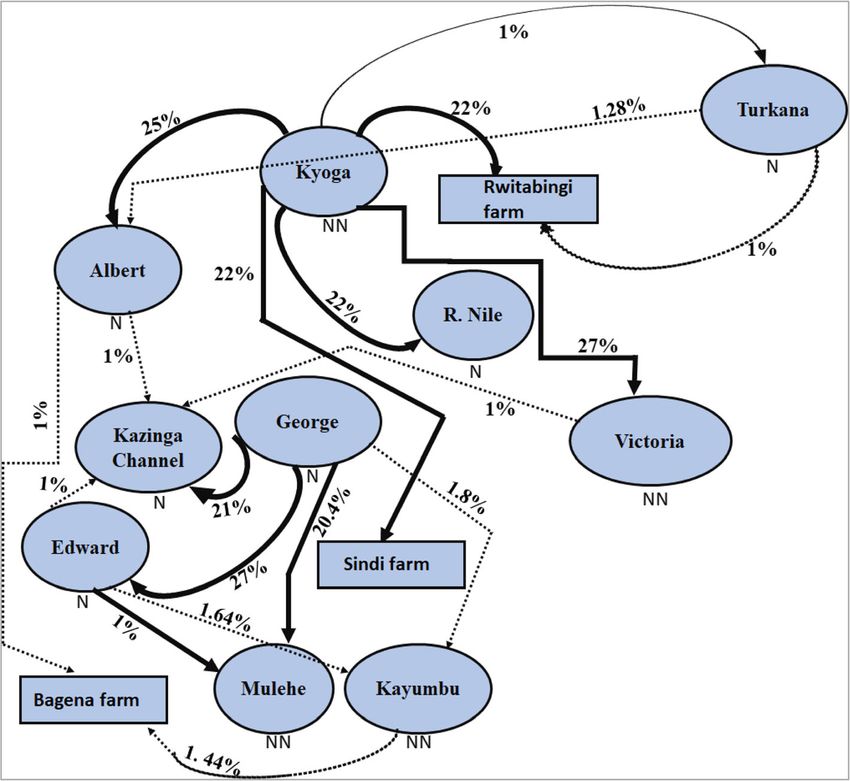
Gene flow between population niloticus populations are genetically distant from the
Results from recent migration rates estimated with Baye- Ethiopian and West African populations (Fig. 9a). Des-
sAss indicated that Lakes Kyoga and George were the pite O. niloticus populations from River Nile and Lake
main sources of migration (Fig. 8), with values for other Kyoga showing relatively high Fst values, results from the
populations generally falling below (< 2%). Noticeable East African populations generally showed low genetic
gene flow was from Lakes Kyoga to Victoria and George differentiation. Also, the East African O. niloticus popu-
to Edward (27%), Kyoga to Albert (25%), Kyoga to lations were genetically more diverse when compared to
Bagena farm (23%), Kyoga to Sindi farm, River Nile and either Ethiopian or Burkina Faso (Fig. 9b-d). Based on
Rwitabingi farm (22%), George to Kazinga Channel all statistics, the non-native Lake Victoria and native
(21%) and finally George to Mulehe (20.4%) (Fig. 8). Mi- Lake Turkana O. niloticus populations were the most
gration rates estimated through Genalex were congruent genetically diverse. On the other hand, Lake Kyoga and
with BayesAss, but with the difference that the O. niloti- River Nile O. niloticus populations were consistently the
cus population from Lake Victoria was also a source of least diverse even when investigated at the subpopula-
migrants (Additional file 1: Table S3). tion level (additional file 1: Figure S4).
Results from the Garza-Williamson index (G-W), gen-
Genetic differentiation, diversity, and isolation by erally indicated that nearly all of the studied populations
distance went through a bottleneck, apart from the Ethiopian
Genetic differentiation of O. niloticus was consistent Lake Tana (Fig. 10a). In the analysis, only Lake Tana ex-
with the STRUCTURE results. For instance, the Fst hibited G-W values > 0.5 (0.56 ± 0.44). Regarding popu-
values clearly demonstrated that the East African O. lation genetic diversity, however, Lakes Victoria and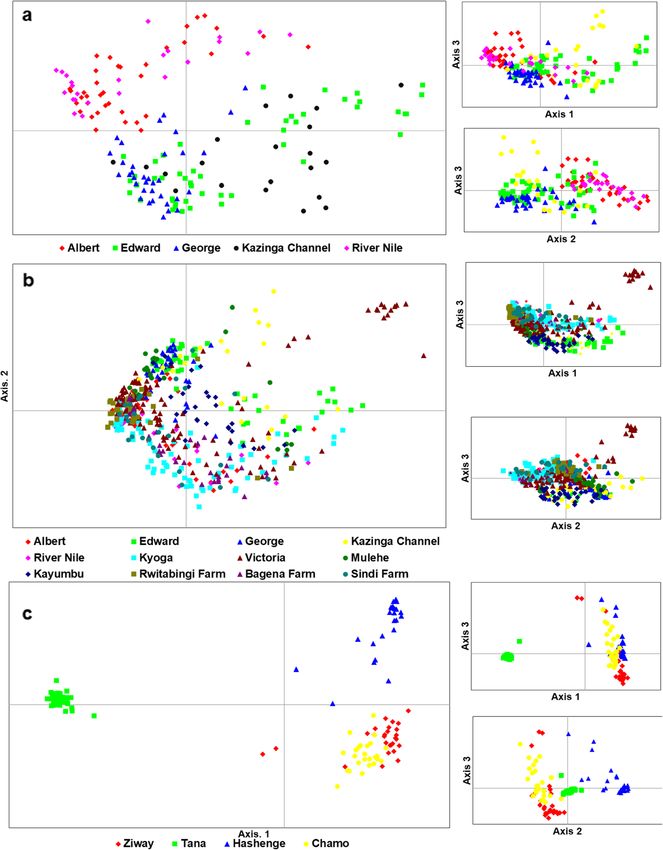
Tibihika et al. BMC Evolutionary Biology           (2020) 20:16                                                             Page 6 of 20

Table 2 15 new primer pairs developed in the present study. The other 26 tested primers developed by [27] can be found in the
additional file section, Additional file 1: Table S1
Locus                   F: Primer sequence (5′-3′)                R: Primer sequence (5′-3′)            Repeat motif            Asr
Ti39                    TACCTGCCAGTCATGTGCTG                      TGCTCAGACTGGTCCCTTCT                  (ATGG)8                 368–420
Ti41                    TCGCAGCTGCTCCTGTTTAA                      TTGTGCACGTGGACATGTTG                  (AAAC)11                381–471
Ti43                    ATTGCCATCACCAGGAACCA                      TGCTAGCCCAGAGCATTTGA                  (GAATA)6                425–478
Ti44                    TGCTCCTGACTCAGCATCAC                      GCAGCACTCTGACATGAAGC                  (GAAAA)6                419–469
Ti49                    TCGAAGTAGCGTGGAAAACCT                     ACAACAACAACAGGTCGGGA                  (TGT)8                  395–403
Ti50                    CCTGTGACAGACTGGTGACC                      ACACTGATGCGGTTTACGGT                  (ATGG)7                 442–517
Ti51                    TGCTAAACGCCAGCTGATGA                      TTACCACACGATGTCGCAGG                  (TGT)8                  401–428
Ti52                    GAGAAACGTCCAGTGGCAGA                      TTTCGATCTGCTGCCCCTTT                  (TAT)8                  373–429
Ti54                    TTTCTTGCCAGCAAAAACAGT                     CAGATTCTTCCAGTGCTTGTGC                (GGAT)7                 390–480
Ti55                    GAGCCCAGACAGCAGACAAT                      AGGACCTTCTATGGCCCTGT                  (TCTA)7                 417–491
Ti56                    TGCAGTGAATTTGGCACCTG                      AGCCTGAGATACCTGTGCCT                  (TGTT)6                 310–462
Ti57                    CAGTGGGAGGAAGCTCCAAA                      GCTGCATGGATCCAATAGGC                  (TCCA)7                 400–444
Ti59                    ATGGACTTAAGCTGCACCCC                      TGAGCATTTGACCCCAGCAT                  (AGGA)6                 429–461
Ti60                    GAGCCGCCATAGTGTCACTT                      CCTGCTCTCACTCAAAGAGGG                 (ATCC)7                 473–516
Ti61                    GCTACACAGGAAAGCAGAGC                      ACTCAATGCTGGACGTGACC                  (TGGA)6                 474–501
F Forward and R Reverse, Asr Allelic size range.

Turkana showed the highest number of private alleles                        deeper understanding of population dynamics, in par-
(Fig. 10b).                                                                 ticular, the East African O. niloticus, towards the align-
   When we partitioned Lake Victoria to assess the gen-                     ment of management and conservation strategies. In this
etic diversity patterns within the water body, generally                    study, we investigated the phylogeographical patterns
one sub-population was distinguished from the others                        and we found large differences between lakes (e. g. Lake
(Fig. 11). Sango Bay, in particular, was isolated based on                  Tana) and also differences between natural water catch-
Fst values, and consistently exhibited higher genetic di-                   ments that allow populations to be identified. Here, we
versity indices (Na, He and Ar) (Fig. 11).                                  discuss the current state of O. niloticus in reference to
   Mantel tests for isolation by distance (IBD) across all                  phylogeographical patterns and anthropogenic activities.
samples showed a positive correlation between geo-
graphical and genetic distance (R2 = 0.30) (Fig. 12a).                      Phylogeography of east African O. niloticus
However, the strong correlation (R2 = 0.67) between the                     In all analyses, we found a clear differentiation among
populations was only found when Burkina Faso was ex-                        all three African regions included in this study (East Af-
cluded from the analysis (Fig. 12b). The genetic differen-                  rica, Burkina Faso, and Ethiopia), indicating a low degree
tiation between the East African and the Ethiopian                          of connectivity amidst them and highlighting the high
populations appears to inflate this correlation. Similarly,                 level of differentiation between regions. Lake Tana was
a strong IBD was also found amongst East African popu-                      completely distinct from the remaining populations.
lations (Fig. 12c), which was not the case when only                        This applies not only to the Ethiopian populations but
Ugandan populations (excluding Turkana) were consid-                        also to the East African ones. So, the genetic distance in
ered (Fig. 12d).                                                            Ethiopia is higher than between the East African and
                                                                            West Africa populations, indicating a divergence higher
Discussion                                                                  than we would expect within a species. These results are
Fisheries and fishery products are vital in the developing                  consistent with previous genetic reports [18], but not the
world but heavily threatened through various anthropo-                      findings of the subspecies treatment based on the trad-
genic activities which may compromise the continuity of                     itional morphometric and meristics [2]. This high level
the resources [35]. One aspect of the anthropogenic                         of differentiation argues for a revision of the species de-
threats is the change or alteration of the natural genetic                  limitation for these populations.
structure of fish stocks through admixture [36, 37]. Un-                       Lake Tana lies in the Ethiopian mountains and is iso-
derstanding the admixture of stocks is only possible if                     lated from the Lakes in the Rift valley [38]. This might
the source populations can be differentiated using gen-                     explain the high degree of differentiation of this lake be-
etic markers. We show the importance of SSR-GBS for a                       cause of the lack of connectivity and divergent ecological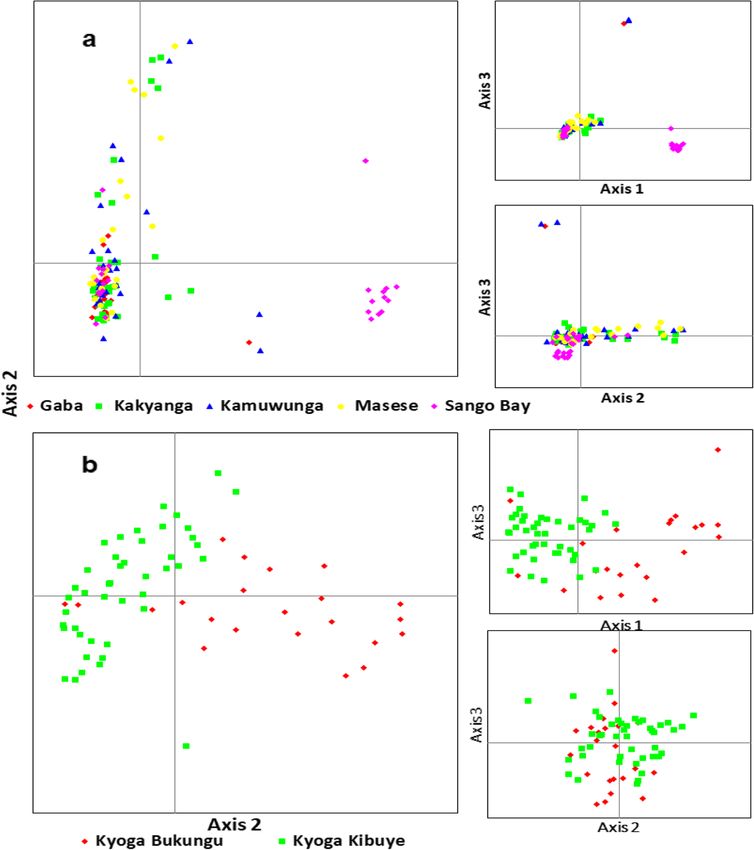
Tibihika et al. BMC Evolutionary Biology   (2020) 20:16                                                                       Page 7 of 20

 Fig. 2 Genetic structure of O. niloticus populations based on UPGMA dendrogram. Node values correspond to bootstrap values

conditions. Contrary, Lake Hashenge which is also in the                   In Uganda, despite the high degree of connectivity and
Ethiopian mountains is related to the Rift Valley lakes.                 proximity between the water bodies, O. niloticus popula-
Lake Hashenge is reported to have been stocked with O.                   tions were clearly structured. These reflected three main
niloticus following mass mortalities of the native species               groups: 1) (Lakes George and Edward, as well as Kazinga
[39]. The native status of this lake is unclear since it could           Channel, 2) Lake Albert, River Nile, and Kyoga and 3)
have been restocked with O. niloticus that originated from               Lake Victoria system. The 2nd and 3rd groups are dis-
the Rift Valley Lakes. Besides that, we see a slight differen-           cussed in more detail under anthropogenic activities
tiation in PCoA between Lake Hashenge and the Rift Val-                  subsection. The 1st group, Lakes George and Edward
ley Lakes in Ethiopia, which may reflect an unsampled                    are connected via the Kazinga channel which also ex-
source of stocking or differentiation accumulated because                plains the high natural migration rates between these
of the high degree of isolation of the lake.                             populations. The different genetic structure between the
   In East Africa, genetic structure reflected different                 western Rift Valley Lakes (Edward-George-Kazinga
catchments. The population from Lake Turkana was                         Channel and Albert) was conserved despite being con-
genetically distinct from the Ugandan populations which                  nected through River Semliki that flows from Lake Ed-
is expected given its high geographical isolation [40].                  ward and Albert [41]. The strong rapids and falls
Our findings concur with the previous works that                         present in this river [41, 42], might constitute a strong
treated the Turkana population as a different subspecies                 barrier to gene flow, which maintains these systems
(O. vulcani) [2]. The high diversity and number of pri-                  apart. These findings are congruent with recent work on
vate alleles found in Lake Turkana can be a consequence                  O. niloticus geometric morphometrics [43] but do not
of this isolation. The East African arid, Lake Turkana,                  concur with past studies [2, 20]. This incongruity might
naturally is also characterized by a remarkable genetic                  be associated with different methodological approaches
diversity. One factor might be introgression perhaps                     utilized between the earliest studies and the current one.
from anthropogenic activities or influx of gene flow from                For example, using morphometric and meristics
River Omo (Ethiopia). However, this is not clear and a                   methods, O. niloticus from the Edward-George system
better sampling from the region needs to be included to                  and Albert was treated as one subspecies; O. niloticus
evaluate the extent of the observed current genetic                      eduardianus [2]. However, inference from traditional
structure of the population.                                             morphometrics are weak due to the lack of informative
Tibihika et al. BMC Evolutionary Biology     (2020) 20:16                                                                             Page 8 of 20

 Fig. 3 Genetic structure based on unrooted network tree illustrating population relationships based on genetic distance. a represents a network
 tree for all the populations and b for only the Ugandan populations. Dotted oval and rectangular shapes depict closely related genetic groups

characters [18]. Similarly, while we used SSR-GBS tech-                    both non-native water bodies and fish farms. All genetic
niques, [20] employed random amplified polymorphic                         structure analyses and migration rates showed that the
DNA (RAPD) markers, which due to their dominance                           two Ugandan groups (the George-Edward complex and
genotypic nature, provide only part of the information                     Lake Albert) contributed to the stocking of different water
content [22].                                                              bodies. O. niloticus from the southwestern Ugandan high-
                                                                           altitude Lakes; Mulehe and Kayumbu, originated from the
Anthropogenic activities-fish translocations                               Western Rift Valley Lakes – Edward and George. For the
In East Africa, we know that O. niloticus was introduced                   2nd group, Lake Kyoga and River Nile (Victoria Nile) are
into several water bodies through stocking activities. We                  genetically similar to Lake Albert, suggesting that, the lat-
were able to genetically track these translocation events to               ter population might have contributed genes to the gene-
Tibihika et al. BMC Evolutionary Biology (2020) 20:16 Page 9 of 20 Fig. 4 Genetic scatter plots of O. niloticus exhibited by Principal Coordinate Analysis (PCoA). a populations per region, b all indigenous populations. PCoA was constructed with respect to unbiased Nei’s genetic distance among individuals pool of the former systems. Although Lake Kyoga is con- results show that Lakes Albert, and Kyoga, as well as nected to Lake Albert via River Nile, their genetic similar- River Nile, contributed to the gene pool of the farmed ity is unlikely related to the consequence of natural populations (Figs. 3, 8 & 7c). Based on genetic distance, migration via water flow. The main reason here is the nat- Lake Albert was the main contributor to Rwitabingi and ural occurrence of Murchison Falls on the River Nile that Bagena farms while Kyoga to Sindi farm. However, we acts as a barrier between the systems [3, 41]. For this mat- also observed a high amount of gene flow from Kyoga to ter, the genetic similarity between River Nile, Lakes Kyoga, Rwitabingi and all these farms appeared to be admixed and Albert populations may have resulted in stocking re- with other populations including Lake Victoria. Apart gimes using the latter as source [3]. from farms, evidence of admixture was probable in the Fish farms seem to have sourced fish seed from mul- East African natural populations, which seems to have tiple populations, resulting in admixed stocks. Our been promoted by anthropogenic activities [3, 9]. This is
Tibihika et al. BMC Evolutionary Biology     (2020) 20:16                                                                             Page 10 of 20

 Fig. 5 Genetic scatter plots of O. niloticus based-on Principal Coordinate Analysis (PCoA). a Ugandan native populations, b all Ugandan
 populations including non-natives, natives, and farms, and c all Ethiopian populations

supported by the fact that when non-native populations                      niloticus in Lake Victoria is generally isolated, based on
were unconsidered in the STRUCTURE and PCoA ana-                            the distance neighbor Network tree (Fig. 3), the popula-
lyses, signals of admixture were minimal, and clear gen-                    tion occupied an intermediate position between the
etic structure assignments could be observed. In East                       above described; 1st and 2nd, Ugandan groups. Thus, it
African, admixture in O. niloticus populations may stem                     is clearly possible that multiple stockings might have
from three main processes: 1) translocation from mul-                       contributed to the gene-pool indicated by the Lake
tiple sources into the non-native water bodies, 2) back                     Victoria population. For example, [2] suggests that intro-
translocation from non-native to native populations, and                    ductions into Lake Victoria may have originated from
3) hybridization of O. niloticus with congeneric species                    Lake Edward, with other authors suggesting multiple
promoted by translocations.                                                 sources [4, 5, 12, 44], which support our results. The
  The first and third processes may explain partly the                      highly diverse and differentiated gene-pool in Lake
genetic variation found in the 3rd group; Lake Victoria                     Victoria could have originated from the admixture of
(see above the three Ugandan groups). Although O.                           several lineages due to multiple sources.
Tibihika et al. BMC Evolutionary Biology      (2020) 20:16                                                                Page 11 of 20

 Fig. 6 Genetic scatter plots of O. niloticus exhibited by PCoA within Lakes Victoria (a) and Kyoga (b) populations

  On the other hand, possible hybridization of the intro-                    originated from introgression by species that have not
duced O. niloticus with the indigenous relative species                      been included in the analysis. Similarly, the probable
(O. variabilis and O. esculentus) in Lake Victoria may                       hybridization may explain the high genetic diversity and
explain some of the genetic variation patterns found in                      divergent gene-pool detected in the system. Within Lake
this lake. First, this lake together with Turkana showed                     Victoria, the Sango Bay subpopulation appears to be an
values of private alleles up to four times higher than the                   extreme case from this by showing the highest degree of
remain populations. This genetic variation could have                        genetic divergence. Remarkable genetic differentiation in
Tibihika et al. BMC Evolutionary Biology      (2020) 20:16                                                                                Page 12 of 20

 Fig. 7 Bayesian clustering for genetic assignments of O. niloticus populations. a represents all populations, b all indigenous populations, and c all
 Ugandan populations including indigenous, non-indigenous and farms. Ks with a superscript symbol (¶) indicates the optimal K values based on
 STRUCTURE HARVESTER analyses

Sango Bay was noticed only when compared with the                             admixture is usually reported to have negative conse-
remaining subpopulations within the lake, but also with                       quences [37, 50]. Introgression can contribute to out-
the other East African populations. In this case, during                      breeding depression either by the introduction of
the boom of the O. niloticus population in Lake Victoria                      maladaptive alleles or through the dilution of alleles im-
[3–5, 45], a larger portion of the native species’ genetic                    portant for local adaptation [51]. In more drastic scenar-
materials may have been introduced into O. niloticus                          ios, hybridization can result in genomic incompatibilities
gene-pool. This is just a hypothesis since, in this study,                    contributing to a fast reduction of population fitness
we cannot directly test for hybridization because we did                      [51]. Alternatively, the hybrids may potentially exhibit
not include samples of O. niloticus congenerics. How-                         more fitness and subsequently extirpate the parental
ever, hybridization involving O. niloticus and other tila-                    lines [46]. The observed genetic structure of O. niloticus
piines has been reported to be relatively frequent and it                     populations in Lake Victoria was unexpected and has
needs to be considered [9, 33, 46, 47].                                       not been reported before, which calls for further investi-
  If admixture/hybridization shaped the gene-pool of                          gations for taxonomic recognition.
Lake Victoria, it may have adaptive consequences and                             Evidence for the second process of admixture was only
compromise the sustainability of O. niloticus. Although                       found in Lake Albert. In the structure analysis, this
hybridization may lead to heterosis/hybrid vigor [48, 49],                    population showed admixture with Lake Kyoga. We also
Tibihika et al. BMC Evolutionary Biology     (2020) 20:16                                                                             Page 13 of 20

 Fig. 8 Bayesian inference of recent migratory rates for the 13 East African O. niloticus populations. Oval light blue and rectangular light-blue
 shapes indicate natural and farm populations, respectively. The arrows contain percentage values showing the direction and magnitude of gene
 flow. Darker and thick arrows represent stronger gene flow, while thin, dotted arrows indicate weaker gene flow. Native and non-native
 populations are indicated by the letters, “N” and “NN”, respectively. This analysis is based on BayesAss program and for GenAlex program, see the
 Additional file 1: Table S3

found significant migrations from Lake Kyoga to Lake                        boosted the capture fisheries in the Lake Victoria basin
Albert. These results indicated that admixture with re-                     (Lakes Victoria and Kyoga) following introductions, the
spect to translocations not only contributes to non-                        species was subsequently overexploited between the
native populations but also to native ones. The sequence                    1970s and 80s [53, 54]. This was reflected in the dra-
of gene flow from Lake Kyoga to Albert is not clear as                      matic decline of the stock sizes and increased fecundity,
none of the previous reports have indicated this. How-                      which are clear indicators of overfishing [54]. The low
ever, it is likely that aquaculture activities might be con-                diversity in River Nile could be linked to low gene-flow
tributing to the observed gene flow between Lakes                           connectivity with other water bodies due to hydro-
Kyoga and Albert.                                                           electric power dams that have been constructed along
                                                                            the river (the upper Nile of the Ugandan side), which in-
Anthropogenic activities-consequences of overfishing                        creases the effect of genetic drift. However, this needs to
Some water bodies, especially Lake Kyoga and River Nile                     be assessed in further analyses, especially when add-
showed low genetic variability and evidence of bottle-                      itional samples are collected in sections of the lower Nile
neck with respect to G-W estimations. Given the recent                      (below Murchison falls), where apparently there are no
stocking of these water bodies, this pattern may be ex-                     dams.
plained by the founder effects. Nevertheless other an-
thropogenic activities need to be considered as well.                       Implications for management and outlook
High loss of genetic diversity among populations, par-                      Overall, we found evidence that anthropogenic activities
ticularly, in fishes has been attributed to over-                           affected the gene-pool of the East African O. niloticus.
exploitation [52]. This might be the case for the L.                        The main consequence might have been admixture and
Kyoga population. For example, although O. niloticus                        potentially hybridization between different stocks and
Tibihika et al. BMC Evolutionary Biology (2020) 20:16 Page 14 of 20
Fig. 9 Genetic diversity and differentiation indices. a number of alleles, b allelic richness, c fixation index (Fst) and d expected heterozygosity
species respectively. In the long term, this may have by anthropogenic activities. This study also contributed to
negative effects on population fitness due to outbreeding the knowledge of O. niloticus phylogeography in East Af-
depression and genetic swamping. Thus, management rica. In this case, we found several new genetic groups
measures should inhibit any form of unauthorized such as the populations from Lake Tana, Victoria and the
spread of fish in the aquatic ecosystems. The Western or two natural catchments in Uganda. Some of these may re-
Albertine Rift Valley lakes (Edward-George) may be ideal quire further taxonomic exploration. Additionally, we
broodstock sources for subsequent breeding programs show that gene-flow among the East African O. niloticus
and aquaculture, as these systems seem not to be populations was not entirely from native to non-native en-
admixed. To avoid an influx of feral populations, a vironments, but also from non-native to native environ-
proper environmental impact assessment should be pri- ments likely through aquaculture and restocking
oritized before implementation. Genetic diversity might programs. Moreover, this study shows the importance of
also have been affected by overfishing and the construc- molecular markers, in particular, the use of SSR-GBS in
tion of hydropower dams, which should also be taken cataloging populations. Further studies should include O.
into consideration in future management options. niloticus samples from other regions such as the lower
Nile (below Murchison Falls), Lake Kivu (Rwanda), Tan-
Conclusions ganyika and Baringo as well as the congenerics for a more
Our results were congruent with the hypothesis that an- comprehensive picture.
thropogenic activities affected the genetic structure of O.
niloticus populations in East Africa. The genetic variation Methods
of some populations, especially from Lake Victoria, corre- Sampling/study areas
sponded with possible hybridization of O. niloticus with We collected O. niloticus specimens from three water
native congeneric species, which may have been mediated body types: a) those where O. niloticus is native, b) whereTibihika et al. BMC Evolutionary Biology (2020) 20:16 Page 15 of 20 Fig. 10 Estimations of population bottleneck derived from Garza-Williamson Index (G-W) (a) and measure of genetic diversity based on private alleles (b) introduced, and c) from fish farms (Fig. 1), following our Kayumbu) as well as in lower altitude lakes (Lake Victoria earlier sampling design [43]. Most samples were collected and Kyoga) [43]. The three sampled fish farms include; Rwi- by local fishermen using gill nets set overnight. At Lake tabingi (located near River Nile and Lake Kyoga), Bagena Turkana, a seine net was utilized. From Ethiopia and Bur- and Sindi from South-western Uganda. The rest of the pop- kina Faso, four and one native populations were sampled, ulations are regarded as native (Fig. 1; Table 1). respectively. Considering the large extent of Lake Victoria and multiple O. niloticus introductions into the world’s lar- Genotyping gest tropical freshwater body, we sampled five locations to Genomic DNA extraction was conducted using magnetic assess possible genetic heterogeneity within the system (Fig. beads based on the MagSi-DNA Vegetal kit (MagnaMedics, 1). Similarly, in other relatively large lakes like Lake Edward, Geleen, Netherlands) and a magnetic separator, SL- Kyoga, and Albert, we sampled two locations each for sub- MagSep96 (Steinbrenner, Germany) [27, 30]. We used sequent subpopulation analyses (Table 1). A total of 664 microsatellite markers [27], to which we added 15 extra samples were collected from 18 water bodies during several primers (Table 2, see also Additional file 1: Table S3). The field excursions in 2016. From every single fish, a muscle SSR primers were designed and tested following our earlier tissue sample (approx. 30 mg) was extracted from the dor- work [27], using the same shotgun sequencing data present sal region, preserved in absolute ethanol contained in 2 ml in the sequence read archive database (SRA) under the ref- Eppendorf tubes and later stored in a freezer until genotyp- erence number SRX3398501. Screened primers were then ing at the Institute for Integrative Nature Conservation grouped into three multiplexes and used to prepare ampli- Research-University of Natural Resources and Applied Life con SSR-GBS libraries using the same approach and specifi- Sciences Vienna (BOKU), Austria. Sampling was conducted cations of [27]. The PCR products were then pooled and in collaboration with respective authorities per region and sent for paired-end 300 bp sequencing in Illumina MiSeq, therefore no special permission was required. In all cases, at the Genomics Service Unit in Ludwig Maximillian Uni- the fish were already dead when obtained from the fisher- versität, München, Germany. The raw sequence data were men, therefore no special treatment for the animals was ad- deposited in the GenBank, sequence read archive database ministered in the process. As contamination of the (SRA) under the project PRJNA550300 with the accession specimens was not likely during sampling with gill nets, numbers, SRR9587388 to SRR9587270. Sequences gener- great care and attention were provided for during seining on ated by Illumina, were subsequently quality checked and Lake Turkana. The non-native and farm populations were controlled, which were later used for alleles calling as de- only sampled in Uganda. Here, we refer to the non-native scribed in [27, 30] using the scripts from the SSR-GBS populations like those found in the high-altitude satellite pipeline (https://github.com/mcurto/SSR-GBS-pipeline). lakes of south-western Uganda (Lakes Mulehe and The resulting codominant matrix and information for
Tibihika et al. BMC Evolutionary Biology      (2020) 20:16                                                                              Page 16 of 20

 Fig. 11 Genetic diversity of Lake Victoria within the population. a number of alleles, b allelic richness c expected heterozygosity and d
 private alleles

which sequences correspond to each allele can be found in                    [58], using the program, SplitsTree4 version, 4.14.8
the Additional file 2 (see the file named “Second_additional                 [59]. We also constructed UPGMA dendrograms for
fileAllelesList & matrix_”).For subsequent analyses, all loci                making inferences on the hierarchical clustering using
and samples with missing genotypes ≥50% were excluded,                       Nei’s genetic distance as implemented in Populations-
leaving a total number of 40 markers (Additional file 1: Ta-                 1.2.32 [60]. Support values were estimated with 1000
bles S1, S3). Other studies have indicated that many SSR                     bootstrap replicates based on loci resampling.
loci are not necessary in order to detect population struc-                  Neighbor-Net tree and the UPGMA dendrogram were
ture [55, 56], so we did not see the need of developing add-                 conducted with the inclusion of subpopulations, when
itional markers to the 40 already in use.                                    applicable to evaluate possible substructure within the
                                                                             populations. Genetic structure was further investi-
Genetic structure                                                            gated using the program, STRUCTURE Version 2.3.4
Genetic structure was first assessed by calculating the gen-                 [61]. STRUCTURE clusters individuals into hypothet-
etic distance between individuals and then visualized                        ical populations through optimization of Hardy-
through Principal Coordinate Analysis (PCoA), all con-                       Weinberg equilibrium [62]. STRUCTURE was run
ducted in GenAlex Version 6.5 [57]. Genetic similarity be-                   from K = 1–35 for 10,000 Markov chain Monte Carlo
tween populations was evaluated by plotting a                                (MCMC) generations after a burn-in length of 10,000
Neighbor-Net tree based on Nei’s genetic distance                            generations [63], whereby each run was iterated 20
Tibihika et al. BMC Evolutionary Biology (2020) 20:16 Page 17 of 20
Fig. 12 Mantel tests for correlations between genetic distance (Fst) and Euclidean geographical distance (GGD in Km) for O. niloticus populations. a
represents isolation by distance (IBD) between all populations, b all populations without Burkina Faso, c East African, and d only Ugandan populations
times. The program’s default settings for the admix- recent migratory rates were only estimated for the East
ture model and allele frequencies correlated were im- African populations, since the corresponding water bod-
plemented. Detection of optimal K was done with ies are the most affected by anthropogenic activities such
STRUCTURE HARVESTER [64] using the delta K as fish translocations. Pairwise recent migration rates
(ΔK) statistic, which is the second-order rate of were estimated using BayesAss Version 3.0 [67]. Here,
change (InP(D)) across successive K values [63, 65]. the program was run for 200, 000,000 iterations, discard-
In this context, STRUCTURE HARVESTER uses ΔK ing the first 100,000,000 generations and sampling every
to identify the highest value and henceforth the best 1000th generation [68]. Only results with a 95% confi-
K. Results from multiple replicates were summarized dence interval of a fraction of migrants per population
using the online pipeline Clumpak program [66] avail- above 0.01 were considered significant. Recent migration
able at http://clumpak.tau.ac.il/. Similar analyses were rates were used because most of the fish translocations
performed for Lake Victoria within populations. in the region, seemingly were recent. Additionally, we
estimated the number of migrants (Nm) per generation
Migration rates and number of migrants per generation between population pairs, to validate the recent migra-
(nm) tion rates using GenAlex program. Consequently, we
Recent migratory rates and the number of migrants per present both, the percentage of migrants estimated in
generation were determined as proxy estimates of gene BayesAss and the number of migrants between popula-
flow among the O. niloticus populations. However, tion pairs against the fixation index (Fst) values.Tibihika et al. BMC Evolutionary Biology (2020) 20:16 Page 18 of 20
Genetic diversity, differentiation, and isolation by DNA; Na: Number of alleles; PCoA: Principal Coordinates Analysis;
distance (IBD) PIC: Polymorphic Information Content; RAPD: Randomly Amplified Polymorphic
DNA; RFLP: Restriction FragmentLlength Polymorphism; SRA: Sequence Read
Genetic diversity and differentiation indices between O. Archive; SSR-GBS: Simple Sequence Repeat- Genotyping By Sequencing;
niloticus populations throughout East Africa and beyond SSRs: Simple Sequence Repeats; UPGMA: Unweighted Pair Group Method with
were examined using the following indices: expected het- Arithmetic Mean
erozygosity (He), observed heterozygosity (Ho), number of
Acknowledgments
alleles (Na), allelic richness (Ar), fixation index (Fst), pri- We are indebted to Kachwekano Zonal Agricultural Research and
vate alleles, and Garza-Williamson index (G-W). Na, Fst, Development Institute, National Agricultural Research Organization, Uganda
G-W and He per population were analyzed using the pro- for their great support during field activities. We are grateful to the local
governments, in particular, the respective field Fisheries Officers from East
gram Arlequin Version 3.5 [69]. Ho, He, Na and PIC per Africa and the Ethiopian Fishery and Aquatic Life Research Centre, for their
locus were determined through Cervus version 3.0.7 [70]. assistance and advice during field excursions. Special thanks to Ms. Howot
Ar was analyzed using the rarefaction algorithm imple- Teshome and Dr. Mano Komandan who transported our Ethiopian and
Burkina Faso samples respectively to Vienna, Austria.
mented in the Hp-rare program [71]. G-W was used to
explore the possibility of bottlenecks amongst the popula- Authors’ contributions
tions. If G-W values are closer to zero, it implies that the PDT, MC, and HM developed the research concept and performed
populations went through a bottleneck, but when the experimental design, laboratory work, bioinformatics, and data analysis with
contributions of EA, CM, and HW. PDT, EA, HW, PA, and CM conducted
values are close to one, the populations are in a stable fieldwork. HM provided laboratory space/analytical tools. PDT and MC led
phase [72]. To test whether the genetic diversity and dif- the writing process with substantial contributions of the other authors. All
ferentiation of O. niloticus populations conform to isola- co-authors read and approved the final version of the manuscript.
tion by distance (IBD), we plotted genetic distance (Fst)
Funding
against the geographical distance (GGD in kilometers) This work was funded by the Austrian Partnership Program in Higher
and conducted correlation analyses using Mantel test (999 Education and Research for Development (APPEAR) through the STRECAFISH
permutations) implemented in GenAlex Version 6.5 [57]. project, a program of the Austrian Development Cooperation (ADC) and
implemented by the Austrian Agency for International Cooperation in
Education and Research (OeAD-GmbH).
Supplementary information
Supplementary information accompanies this paper at https://doi.org/10. Availability of data and materials
1186/s12862-020-1583-0. Raw sequence data were submitted to the sequence read archive (SRA)
database and can be accessed under the reference number PRJNA550300.
Additional file 1: Table S1. Final List of 40 SSR primers utilized in PCR
reactions. Table S2. Variation of the final set of 40 SSR loci. Loci Ti1–Ti35 Ethics approval and consent to participate
were taken from Tibihika et al. [28] while loci Ti39–Ti61 were developed Field excursions were conducted together with respective authorities per region
in the current study. Table S3. List of the linkage group and location/ and therefore no special permission was required. Throughout the sampling
position for each of the primer pairs used. These primers were BLAST regimes, fish were always dead when obtained from the local fishermen, thus no
against the genome assembly GCF_001858045.2 available in GenBank. special treatment for the animals was administered in the process.
The field reference refers to the accession number of the matching
Linkage group. Figure S1. Genetic structure based on PCoA within the Consent for publication
East African Western Rift Valley lakes, Albert (a) and Edward (b) Not applicable.
metapopulations. Figure S2. STRUCTURE HARVESTER analyses for
depicting the optimal K values, which is derived from STRUCTURE results.
a represents the best K for all populations (K = 10), b best K for all native Competing interests
populations (K = 7), c best K for East African native populations (K = 2), d The authors declare that they have no competing interests.
best K for only Ugandan native populations (K = 2), e best K for all
Ugandan populations including farms (K = 4) and f best K for Lake Author details
1
Victoria within populations (K = 2). Figure S3. Bayesian clustering for Institute for Integrative Nature Conservation Research, University of Natural
genetic assignments of O. niloticus populations. a represents East African Resources and Life Sciences Vienna (BOKU), Gregor Mendel Straße 33, 1180
native, b Only Uganda native populations and c Lake Victoria Wien, Austria. 2National Agricultural Research Organization, Kachwekano
subpopulations. K values with a superscript symbol (¶) indicate the Zonal Agricultural Research and Development Institute, P.O. Box 421, Kabale,
optimal K value based on STRUCTURE HARVESTER analyses. Table S3. Uganda. 3Institute for Hydrobiology and Aquatic Ecosystems Management,
Matrix for the number of migrants per generation between population University of Natural Resources and Life Sciences Vienna (BOKU), Gregor
pairs as evidenced by Fst values. Bold values (> 10) indicate the vital Mendel Straße 33/DG, 1180 Wien, Austria. 4National Fishery and Aquatic Life
number of migrants explained by Fst values: Note the variations in Research Centre, P.O. Box 64, Addis Ababa, Sebeta, Ethiopia. 5Department of
boldness which explains the level of important migrations between Zoology, Entomology and Fisheries Sciences-Makerere University Kampala, P.
population pairs. Figure S4. Within-population genetic diversity of Albert, O. Box, 7062 Kampala, Uganda.
Edward, Kyoga, and Victoria populations. Vic = Victoria, Na = mean num-
ber of alleles, No. = number, Pa = mean number of private alleles and Received: 3 July 2019 Accepted: 16 January 2020
He = mean expected heterozygosity.
Additional file 2. Allele list.
References
1. Agnèse J-F, Adépo-Gourène B, Abban EK, Fermon Y. Genetic differentiation
Abbreviations among natural populations of the Nile tilapia Oreochromis niloticus
Ar: Allelic richness; G-W: Garza-Williamson index; GenAlex: Genetic Analysis in (Teleostei, Cichlidae). Heredity. 1997;79(1):88–96.
excel; He: expected heterozygosity; Ho: observed heterozygosity; IBD: Isolation 2. Trewavas E. Tilapiine fishes of the genera Sarotherodon, Oreochromis and
By Distance; MCMC: Markov chain Monte Carlo; mtDNA: mitochondrial Danakilia. London: British Museum (Natural History); 1983.You can also read