LNG Winter 2020/2021 - a unique set of circumstances - Oxford Institute for Energy Studies
←
→
Page content transcription
If your browser does not render page correctly, please read the page content below

April 2021

                                  LNG Winter 2020/2021 –
                              FC Heading
                           a unique             Heading
                                    set of circumstances
                            or a predictable  inevitability?
                                         FC Subheading Subheading

    The rapid rise in Asian LNG prices which saw Platts JKM prompt month delivery cargoes hit a high of
    $32.50/MMBtu on the 13 January 2021, 1 a 476 per cent increase on the January 2020 average price,
    will be long remembered in this still nascent commodity market. Demand for LNG for power generation
    and heating reached new highs across East Asia, (China, Japan, South Korea and Taiwan), as severe,
    cold weather swept the region. With some buyers scrambling to source LNG, the rise in price was
    accompanied by a scramble to charter vessels which could load promptly in the US Gulf Coast, thereby
    driving up freight rates to all-time highs. Spark Commodities assessed Atlantic LNG freight rates at a
    high of $322,250/day on 8 January 2021 compared to $93,250/day in the same week of the previous
    year2 (see Figure 1). As the frenzied media coverage and comparison to the stratospheric price rise of
    Bitcoin3 now subsides, it remains to address the varied drivers behind such a move and whether or not
    the circumstances could return to push LNG to ever greater highs.
    This Energy Insight will briefly review the key drivers behind the meteoric rise in Asian spot prices, but
    will focus specifially on the impact on the LNG freight market and the factors that drove freight rates to
    rise to such high levels.

    1
      https://www.spglobal.com/platts/en/our-methodology/price-assessments/lng/jkm-japan-korea-marker-gas-price-assessments
    2
      https://app.sparkcommodities.com/freight/dashboard
    3
      https://www.bloomberg.com/news/articles/2021-01-13/traders-win-in-lng-s-bitcoin-beating-rally-driven-by-winter-
    cold?sref=o7Vx5e7E

 SHORT PAPER:
Energy Insight 88                                                                                           Author
                                                                                 Alex Booth, Head of Research, Kpler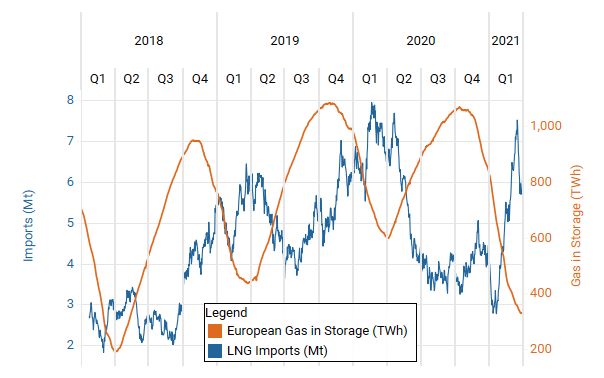
Introduction
Whilst the sudden onset of very cold weather in East Asia clearly took some local buyers by surprise,
despite advance warnings heading into the season, there are various supply and logistical factors that
came together to create, in effect, the perfect storm. The only saving grace is that this situation did not
happen a few weeks later when much of the US Gulf Coast (USGC), home to the burgeoning US LNG
industry, experienced its own period of extreme cold weather which shut down gas production and LNG
export operations. It is nigh on impossible to comprehend what could have happened to LNG prices
had this situation occurred.
Figure 1: Week average Platts JKM LNG vs Spark 30s freight rate
           35                                                                                                            350

           30                                                                                                            300

           25                                                                                                            250
$/ MMBtu

           20                                                                                                            200

                                                                                                                               $k/ day
           15                                                                                                            150

           10                                                                                                            100

            5                                                                                                            50

            0                                                                                                            0
            Jul-19       Oct-19            Jan-20           Apr-20           Jul-20            Oct-20           Jan-21
                                                 JKM (lhs)             Spark 30s (rhs)

Source: Platts, Spark Commodities

Increased demand in the region can be seen as the trigger for the rapid rise in LNG prices but is not
the sole or maybe even the primary reason why such high prices came about. Short term production
issues in Australia in December played a contributory part but increased exports from the rest of the
world made up for losses in molecules if not convenience for East Asian supply. The rise of US LNG
exports and maximum flexibility in terms of spot availability placed the particular producer as the go-to
source for prompt spot cargoes. Flexibility within the Qatari system allowed for diversions of cargoes
away from North West Europe but could not address the needs of additonal spot requirements. The
downside to such a situation for East Asia is that the route between the USGC and the region is beset
with logistical issues. Either shippers have to contend with limits on Panama Canal transits, the most
direct, shortest and cheapest option despite canal fees, or they have to send vessels the long way
round, either via the Capes (Cape Horn or the Cape of Good Hope) or the Suez Canal. Having
experienced a period of increased waiting times for laden vessels to transit southbound in October and
November, the market rapidly shifted to supply more cargoes from the US using alternative routes. At
the same time, they increased vessel speeds and diverted cargoes from European destinations to ship
as much volume into East Asia as possible, hitting new absolute and seasonal highs in the process for
December through to February. The increase in supply from a longer haul origin had the inevitable
effect of increasing the ton-days for discharges into the region which highlights one of the key problems
for the area. Any time incremental volumes are needed at short notice they have to be sourced from
the furthest distance and most logistically constrained origin.

     The contents of this paper are the author’s sole responsibility. They do not necessarily represent the views                        2
                           of the Oxford Institute for Energy Studies or any of its Members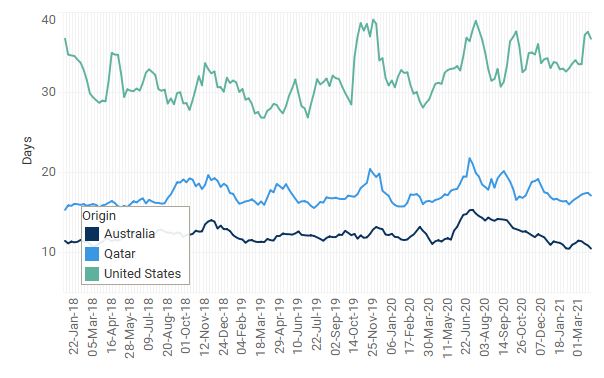
Freight rates on a dollar per day basis grabbed the headlines but, as seen in Figure 2, when converted
into dollars per MMBtu and set against the price differential between JKM delivered in Asia and Henry
Hub natural gas prices in the US, it is clear to see how the incentive to connect the dots and make
cargoes work East was staggering. As long as the demand for LNG continued, the freight rate could
rise further, and still allow for a profitable shipment. However, once short-term demand dissipated, it
took just four days for JKM prices to drop from $32.49/MMBtu to $9.63/MMBtu, with an equally rapid
fall in freight rates. It should be noted this fall in JKM price encompasses an element of seasonal decline
as delivery moved from February to March. However, the decline seen in 2021 was still extreme. In the
previous four years, the single day price decline between assessments for February and March delivery
was an average of 10.9 per cent or $0.89/MMBtu compared against a drop of 64.3 per cent or
$17.36/MMBtu seen in 2021. Whilst the differential had narrowed, the incentive was still present to ship
LNG, at a far less frantic speed, and by that point there were already a significant number of vessels
on route, moving gas into what would soon swing into an oversupplied market.
Figure 2: Week average JKM-US NG differential vs. Spark 30s freight rate
           30

           25

           20
$/ MMBtu

           15

           10

            5

            0

           -5
            Jul-19         Oct-19             Jan-20      Apr-20        Jul-20                         Oct-20       Jan-21
                                                   JKM-HH        Spark 30s

Source: Platts, Nymex, Sark Commodities

The LNG market demonstrated an incredible degree of flexibility to ship record quantities into East Asia
in as short a time frame as possible, however there are limits as to just how much the process can be
continually optimized. If buyers are unable to improve their demand forecasts and keep a steady
‘pipeline’ of LNG cargoes coming for resupply, they will have to address a more fundamental issue of
lack of gas storage in the region. Europe, another significant LNG demand hub, was able to effectively
sit out the extreme price action and draw down its storage reserves, as well as rely on pipeline gas from
regional players. LNG imports into Europe declined into January from already depressed levels
compared to 2019 but rebounded through the balance of the quarter as cold weather hit the region and
gas was needed to stem further draws from storage. Current gas storage levels in Europe are down to
those last seen in early 2018 and will require significant injections through the summer to prepare for
next winter. Gas storage capacity in East Asia is a far smaller percentage of annual demand compared
to that found in Europe, ultimately pushing the system to tolerance levels that are stretched at best and
insufficent at worst, as demonstrated by recent events.

     The contents of this paper are the author’s sole responsibility. They do not necessarily represent the views            3
                           of the Oxford Institute for Energy Studies or any of its Members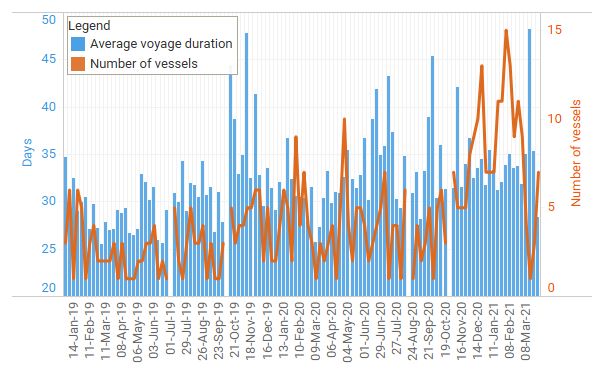
Winter demand and the changing LNG landscape
Weather conditions and reduced pre-winter imports created the demand
environment leading to a surge in prompt cargoes
Medium range weather forecasting plays a vital role in the seasonal planning of LNG buying programs.
The inevitable increase in demand for heating, either by direct burning of gas or through electricity
generation, during the colder winter months is a core element behind the seasonal flows of LNG around
the world. Figure 3 highlights both the growing trend in imports and the seasonal peak in imports,
typically beginning in November and fading in February.
Figure 3: East Asia LNG imports by destination country

Source: Kpler

Chinese LNG imports continued to push ahead in 2020. Arrivals finished the year at 71mt, marking a
gain of 6.3mt against a year earlier levels. An increase in imports through year end due to the cold
weather in December was also a key driver. As seen in Figure 4, the start to winter in the region was
relatively mild with heating degree days (HDD) data through November lower than the previous two-
year average for both Beijing and Seoul.4 By late December, this pattern had reversed with cumulative
HDDs back on par with the seasonal average. The severe cold snap hit Seoul through the new year
with Beijing following shortly after, taking cumulative HDDs significantly higher than in the previous two
years (see appendix for further details on Chinese power demand).
For Japan and South Korea, the winter of 2020/21 was no different with preliminary forecasts pointing
to colder than average temperatures through the season. 5 Despite these forecasts, imports through Q4
into South Korea and particularly Japan were down compared to seasonal patterns. In fact, Japanese
imports in the fourth quarter were only marginally higher than those of 2019 when a mild winter was
predicted,6 and significantly lower than for the five years prior to that, down 1.85mt or 8.4 per cent,

4
  https://www.degreedays.net/
5
  https://mkweather.com/winter-2020-2021-forecast-for-asia/
https://www.accuweather.com/en/winter-weather/accuweather-2020-2021-asia-winter-forecast/832759
6
  https://www.accuweather.com/en/weather-news/accuweathers-2019-2020-asia-winter-forecast/601993

    The contents of this paper are the author’s sole responsibility. They do not necessarily represent the views   4
                          of the Oxford Institute for Energy Studies or any of its Members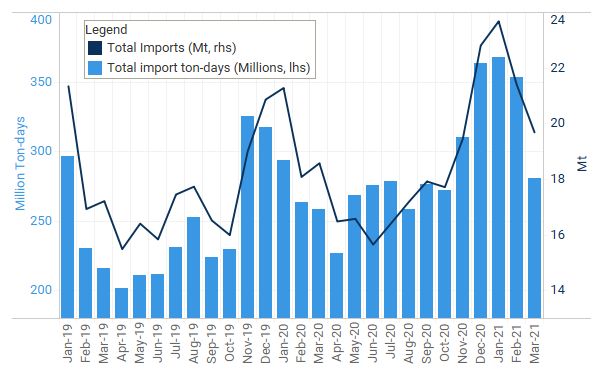
compared to the 2014-2018 average.7 Imports into South Korea in the fourth quarter were at the upper
end of the range for the previous six years, although imports through the second half of the year were
in the middle of the range. Figure 5 shows how the high inventories and oversupply issue through the
second quarter rapidly turned to an issue of dwindling inventories by the end of December. 8 That said,
the situation was less marked in Tokyo but by the end of January the city was also experiencing colder
than average temperatures. Problems in Japan were exacerbated for power generation companies as
maintenance had closed all but one nuclear reactor through November and into mid-December.9
Figure 4: Weekly heating degree day cumulative difference for winter 2020/21 vs previous two-
years average
           100

            80

            60

            40
    Days

            20

             0

           -20

           -40

           -60
                                                     02-Nov

                                                              09-Nov

                                                                       16-Nov

                                                                                23-Nov

                                                                                         30-Nov

                                                                                                                                        04-Jan

                                                                                                                                                 11-Jan

                                                                                                                                                          18-Jan

                                                                                                                                                                   25-Jan

                                                                                                                                                                              01-Feb

                                                                                                                                                                                       08-Feb

                                                                                                                                                                                                15-Feb
                                                                                                  07-Dec

                                                                                                           14-Dec

                                                                                                                    21-Dec

                                                                                                                               28-Dec
                 05-Oct

                          12-Oct

                                   19-Oct

                                            26-Oct

                                                                       Beijing                    Seoul                      Tokyo

Source: Kpler analysis of Degreedays.net data

Figure 5: South Korean natural gas inventories
           5.0

           4.5

           4.0

           3.5

           3.0
     Mt

           2.5

           2.0

           1.5

           1.0

           0.5
                 Jan        Feb              Mar   Apr                     May             Jun    Jul                    Aug              Sep    Oct                        Nov          Dec
                           2014               2015                        2016               2017                       2018                 2019                           2020

Source: KESIS

7
  All LNG flows and freight related data used throughout this report is sourced from Kpler unless specifically referenced
8
  http://www.kesis.net/sub/subChartEng.jsp?report_id=7010101&reportType=0
9
  http://www.asahi.com/ajw/articles/13900336

    The contents of this paper are the author’s sole responsibility. They do not necessarily represent the views                                                                                     5
                          of the Oxford Institute for Energy Studies or any of its Members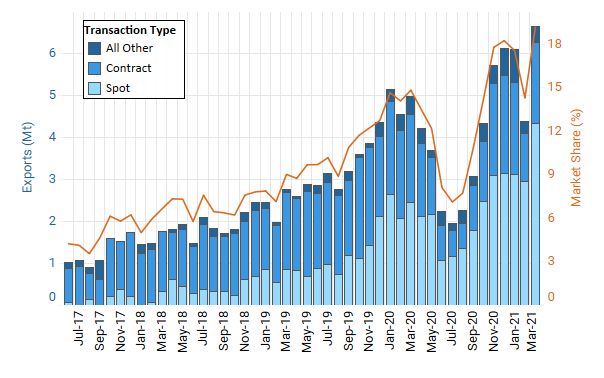
How European dynamics led to the region being a key swing player
The dynamics of the European gas market is an important element of global LNG trade. In the past,
record piped gas supply has kept LNG away from Europe. 10 Between 2013 and 2016, European LNG
imports only increased by 7 per cent from 39.8mt to 42.6mt, about 50 per cent lower than Japanese
LNG imports. While declining indigenous gas production opened the way for increased gas imports, it
would be expected that Russia would maintain market share and that total demand growth in Europe
would not absorb excess global LNG supply.
However, the situation changed with the first US LNG wave coming onstream and Russia fast-tracking
the development of Yamal LNG. Europe’s imports of LNG more than doubled between 2016 and 2019,
reaching 89.6mt in that year and remaining remarkably stable in 2020 at 89.3mt despite the coronavirus
outbreak strongly hitting the continent’s gas demand through the first three quarters of the year. 11
Europe has indeed become the swing balancing market for LNG as demonstrated by weak imports
seen in the winter of 2020-2021 when prices in Asia skyrocketed and Atlantic Basin freight rates
reached $322k per day (compared to a high of $158k per day in 2019): 12 imports between November
and February only reached 23.6mt, down 37 per cent year on year (y/y) compared to the year before
and 14 per cent compared to the winter of 2018.
Europe benefits from two main factors that place it as the world’s key balancing market for LNG: large
storage capacity and excess re-gas capacity. While last winter’s extreme price moves in Asia
highlighted the lack of sufficient natural gas storage capacity in Northeast Asia, Europe benefited from
an extensive infrastructure, particularly in storage. Despite the multiple lockdowns across the continent
last year, Europe’s LNG imports remained strong in the summer, only down 10 per cent y/y. Between
June and September, Europe imported 23.2mt of LNG compared to 25.9mt in 2019. As demonstrated
in Figure 6, European players were able to take advantage of depressed LNG prices and weak market
structure and refill storage caverns ahead of winter demand. As a result, storage jumped from 56 per
cent in early April to 96 per cent towards the end of September.13 As the number of cargo cancellations
from the US surpassed 100 in July and August 2020, the flow of additional excess supply was cut and
further refills into European storage halted.
Figure 6: European LNG imports against natural gas storage

Source: Kpler, AGSI+

10
   https://ec.europa.eu/eurostat/web/energy/data/database
11
   https://ec.europa.eu/eurostat/databrowser/view/NRG_CB_GASM__custom_679067/default/line?lang=en
12
   https://app.sparkcommodities.com/freight/dashboard
13
   AGSI+ (gie.eu)

     The contents of this paper are the author’s sole responsibility. They do not necessarily represent the views   6
                           of the Oxford Institute for Energy Studies or any of its Members
LNG production and the onshore supply environment
Overview of growth trend in major exporters
The US has become a major natural gas exporter with an increasing liquefaction capacity reaching
71mt in 2021. During the period 2015-2020, natural gas output in the US grew by more than 26.5 per
cent14 with nearly half of this production coming from Texas and Pennsylvania (43.9% in 2019). US
LNG exports in 2020 reached a record of 48.6mt across the year, up from 37.67mt in 2019 and only
0.5mt in 2015 (see Figure 7). Annual exports rose despite COVID-19, as winter demand and export
capacity growth outweighed the cargo cancellations in Q2 and Q3. Monthly exports hit an 18-months
low of 1.97mt in July, but Just five months later, exports set a new all-time high of 6.12mt in December,
a level close to that of Qatar and Australia. Exports in March 2021 have since surpassed even that
record at 6.64mt over the month.
Australia has been the second driver of growth in LNG exports over the last five years, moving from
30.64mt in 2015 to 79.39mt in 2020. Australia’s LNG has however not been as stable from month to
month as others, as highlighted last December when output fell 7.2 per cent lower y/y on the back of
outages at key installations. This happened on several projects simultaneously: Gorgon, Wheatstone,
Ichthys and Prelude which could hit further LNG exports in 2021 and 2022 and coincided with the
increase in weather related LNG demand in China.
Qatar’s LNG exports have been much more stable, and the country retained its position as the world’s
largest LNG exporter in 2020 by exporting 79.6mt throughout, but at much higher prices for international
buyers because of long-term contracts. Nearly 67 per cent of Qatar’s exports are heading towards Asia.
In the past five years, Qatar’s LNG exports have varied by less than two per cent from a record high of
81.27mt in 2015 to a record low last year. Finally, Russia, thanks to Yamal shipments, pushed exports
to a record 31.3mt in 2020 with a small increase compared to 2019, but up from 11.5mt when compared
to 2017.
Figure 7: Major producer annual LNG exports by origin country
Source: Kpler
14
https://www.eia.gov/dnav/ng/ng_prod_sum_a_EPG0_FGW_mmcf_m.htm
The contents of this paper are the author’s sole responsibility. They do not necessarily represent the views 7
of the Oxford Institute for Energy Studies or any of its MembersGrowth of spot contracts vs term contracts
The LNG trade has been gradually shifting towards a greater share of the spot market 15 such that in
2020 34.5 per cent of LNG was traded on a known spot basis. 16 This compares to 23.8 per cent in 2019
and after global LNG export growth was just one per cent year on year. This has been partly driven by
increased volumes of US LNG. The United States therefore has become a key supplier of spot LNG
cargoes, a development many years in the making (see Figure 8), contributing to the unprecedented
surge in LNG freight costs at the end of 2020 and early-2021. US producers have rapidly ascended the
ranks of the world’s top short-term LNG suppliers. Only a few cargoes were sold on a spot or short-
term basis from the US in 2017; 17 however, by 2019, US producers sold some 23.8mt on those
contractual terms.18
Figure 8: United States monthly LNG exports by transaction type and total market share
Source: Kpler
The late 2020 surge in Asian demand for LNG inevitably pulled volumes from US producers with
capacity to meet spot demand. In fact, exports from the United States to Asia-Pacific hit successive
monthly records each month between November 2020 and January 2021. Yet this Asian pull on US
spot capacity from the US Gulf Coast (Sabine Pass, Freeport, Cameron, and Corpus Christi) and East
Coast (Cove Point) quickly ran into a route bottleneck at the Panama Canal, where US LNG exports
transiting the canal hit a record high of 2.04mt in November 2020.
15
Hartley, P. (2013). ‘The Future of Long-Term LNG Contracts’. Baker Institute for Public Policy, Rice University
http://bakerinstitute.org/research/future-long-term-lng-contracts/
16
Kpler’s tracking of contracts. Spot deals are those for which there are no existing contracts or details in the Kpler database to
explain a trade. This could include existing Sale and Purchase Agreements; flexible, portfolio and group deals or tenders.
17
https://giignl.org/sites/default/files/PUBLIC_AREA/Publications/giignl_2016_annual_report.pdf
18
https://giignl.org/sites/default/files/PUBLIC_AREA/Publications/giignl_-_2020_annual_report_-_04082020.pdf
The contents of this paper are the author’s sole responsibility. They do not necessarily represent the views 8
of the Oxford Institute for Energy Studies or any of its MembersFreight and freight-based supply constraints
Rapid rise of US exports has led to potential for bottlenecks in the Panama Canal
As US exports have grown, they have had to search for additional outlets. These tend to lie
predominantly in Asia given the rate of economic growth in the region, and more recently, the transition
to cleaner burning fuels. In addition to changes within domestic markets, South Korea, Japan and
China, three of the largest consumers of US-sourced gas, have limited resources of their own, so the
US has become the most logical incremental supplier to the region.
East Asian economies continue to dominate US exports
South Korea imported 6.1mt of US-sourced LNG during 2020, eight per cent more than in 2019, while
Japan took 5.0mt, up 29 per cent on 2019. China also saw a radical increase in 2020 and imported
3.3mt, having imported only 0.3mt from the US in 2019.
Geography dictates that route options from the US to East Asia are either short but constrained
(transiting the Panama Canal) or longer (navigating Cape Horn or the Cape of Good Hope, or the Suez
Canal for vessels that are diverted). Considerations of daily freight costs and extended journeys are
weighed up against Panama Canal dues (which can reach $457,500 for laden LNG carriers and
$408,000 for ballast vessels 19 ), but growing usage of the canal can lead to congestion, causing
inefficiency and increased delays, and resulting in increased costs.
For a vessel steaming at 17 knots, the Panama Canal route enables the journey from Texas LNG in
the western Gulf of Mexico to Sodegaura in Tokyo Bay, Japan, to be completed in around 24 days,
compared to around 38 days if the vessel is routed via the Cape of Good Hope. A routing via Cape
Horn takes around 42 days. A voyage via the Suez Canal takes approximately 37 days, but canal dues
mean that this route is less commonly used as it does not save a significant amount of time vs the Cape
of Good Hope (and hence money on daily vessel hire rates), while still incurring additional costs. It is
often used, however, for vessels that were initially heading to Europe, but changes destination because
of a change in market economics. The primary route for US cargoes heading East is still very much via
the Panama Canal - of East Asia’s imports from the US during 2020, 77.2 per cent were transported
via the Panama Canal compared to just 2.6 per cent that transited through the Suez Canal.
Despite the rapid increase in freight rates, the price differential between JKM and Henry Hub natural
gas in the US through the winter ensured that whatever route was taken, it would still be a highly
profitable move. A baseline voyage through the canal with no delays and charter rates of $100,000/day
would result in freight costs to ship a cargo of LNG from the USGC to Japan in the region of
$2.05/MMBtu. Without any change to route or duration but an increase of freight rates to $320,000/day
would increase costs to $5.01/MMBtu. Any further deviation from this, be it through delays of eight days
waiting for transit through the Panama Canal or taking a longer route would see costs increase by 14-
30 per cent. Even with these subsequent increases, at $6.50/MMBtu to go via Cape Horn, the incentive
to ship gas from the US to Japan was still strong.
Vessels quickly diverted to take advantage of price spike
As Asian LNG prices suddenly rose in the fourth quarter of the year, vessels heading to Europe were
diverted to Asia to take advantage of the higher prices utilising the Suez Canal. Such flexibility being
enabled because of the high levels of stored natural gas available in Europe. In December 2020, 0.36mt
of a total of 0.8mt (45%) transited the Suez Canal on route to South Korea. As spot demand continued
and prices increased further into January amid cold weather and supply interruptions, this quantity rose
to 56 per cent. The diversions were not unique to South Korea and its accelerated demand.
19
https://www.waypointports.com/panama-canal-additional-information/panama-canal-estimated-transit-expenses-lng-carrier/
The contents of this paper are the author’s sole responsibility. They do not necessarily represent the views 9
of the Oxford Institute for Energy Studies or any of its MembersFigure 9: Freight calculations for United States Gulf Coast to Japan LNG cargo routes
Sabine Pass, US to Sodegaura, Japan
Vessel Sk Resolute
Speed 17 kn
Loaded quantity 4,170,717 mmbtu
Positioning and reposition locations, f uel consumption and costs held constant across all options
Panama Canal, Panama Canal, Panama Canal, 8
Via Suez Canal Via Cape of GH
No Delays No Delays days wait to transit
Route option
Distance 9,228 nm 9,228 nm 9,228 nm 14,687 nm 17,163 nm
Duration 23 days 14 hours 23 days 14 hours 31 days 14 hours 36 days 23 hours 42 days 1 hour
Charter rate 100,000 $/ day 320,000 $/ day 320,000 $/ day 320,000 $/ day 320,000 $/ day
Freight cost
Time charter 0.64 1.99 2.61 3.07 3.38
Ports 0.07 0.07 0.07 0.07 0.07
Canals 0.11 0.11 0.11 0.1 0
Bunkers 0.34 0.34 0.44 0.51 0.55
Additional* 0.91 2.5 2.5 2.5 2.5
Total ($/ mmbtu) 2.05 5.01 5.73 6.26 6.5
*Additional includes positioning, repositioning and cooldown costs
Source: Kpler
Japan also saw a significant increase in cargoes transiting through the Suez Canal during December
and January. In October, 0.07mt of LNG made its way through the Middle East while 0.4mt transited
the Panama Canal. In addition, 0.15mt travelled around the Cape of Good Hope aboard the Marvel Kite
(177,000 m3), which loaded on 1 January 2021 at Cameron liquefaction plant in Louisiana, and
eventually discharged in Osaka, Japan on 10 February, and the Flex Ranger (174,000 m3), which
loaded on 13 January at Corpus Christi, Texas, and discharged in Nihonku, Japan on 24 February.
Both vessels were routed via the Cape of Good Hope to avoid mounting delays in the Panama Canal.
Later in January, as it became apparent that queues were easing, the Marvel Eagle reversed course
near the Bahamas to head towards the Panama Canal rather than transit via the Suez Canal as
originally planned.
Below is a list of known tracked diversions on the water, they do not represent the cargoes for which
the destination had already been altered before departure.
Vessel Origin Load Date Original Diversion New
Destination Date Destination
Elisa Larus United States 11-Oct-20 France 20-Oct-20 Japan
Duhail Qatar 06-Nov-20 Europe 09-Nov-20 China
Gaslog Greece Trinidad and 23-Nov-20 Mediterranean 25-Nov-20 Panama
Tobago
LNG Port-Harcourt Nigeria 29-Dec-20 Kuwait 29-Dec-20 China
Ii
Arctic Voyager United States 05-Jan-21 Lithuania 12-Jan-21 South
Korea
La Mancha Knutsen United States 13-Feb-21 United 27-Feb-21 Japan
Kingdom
Bw Magnolia United States 13-Feb-21 Greece 17-Feb-21 Panama
The La Mancha Knutsen is an interesting example of the multiple changes carried out by shippers over
the course of a single voyage. Having initially signalled for a United Kingdom discharge, the destination
The contents of this paper are the author’s sole responsibility. They do not necessarily represent the views 10
of the Oxford Institute for Energy Studies or any of its Memberswas soon changed to Panama after loading, indicating a diversion away from Europe to the East via
the Panama Canal. Within days the destination was changed again, indicating Algeciras and ultimately
the Suez Canal as the chosen route East.
Additional usage leads to Panama Canal congestion and new mitigation measures
As the volume of gas heading from the US to Asia grew over the fourth quarter of the year, usage of
the Panama Canal peaked in November as 2.04mt of LNG transited the canal during the month. By 25
November, the number of laden vessels queuing to transit had reached a high of nine compared to a
2019 average of 1.4 (see Figure 10). By that point, the average wait time over a seven-day moving
window was running at 3.7 days compared to the 2019 average of 1.9 days. Average wait times were
to increase further, hitting a high of 5.1 days on 8 December. This is not the record high tracked for wait
times, with the moving average having hit 5.8 days on the 22 October of the same year (see Figure 11).
Figure 10: Panama Canal laden vessel waiting count (7-day moving average)
9
8
7
6
Number of vessels
5
4
3
2
1
0
Jan-17 Jul-17 Jan-18 Jul-18 Jan-19 Jul-19 Jan-20 Jul-20 Jan-21
Source: Kpler
Figure 11: Panama Canal laden vessel average waiting time (7-day moving average)
7
6
5
4
Days
3
2
1
0
Jan-17 Jul-17 Jan-18 Jul-18 Jan-19 Jul-19 Jan-20 Jul-20 Jan-21
Source: Kpler
The contents of this paper are the author’s sole responsibility. They do not necessarily represent the views 11
of the Oxford Institute for Energy Studies or any of its MembersBy the time that the Platts JKM price had risen to a high of $32.50/MMBtu on 13 January 2021, the
queue of vessels waiting to transit the canal during the month had dissipated, with just two vessels
waiting for an average of 2.8 days. Wait times did subsequently increase again later in the month, hitting
5.9 days on the 30 January. Throughout the whole winter season, some vessels experienced wait times
of up to two weeks for a transit slot. Transit slots are allocated to specific vessels, which can exacerbate
the waiting time for those that are late to join the queue and do not have an allocated slot. This group
includes vessels that have had a late change of instructions, after initially being destined elsewhere, as
highlighted above.
Figure 12 highlights how the distribution of laden LNG vessel wait times for Panama Canal transit from
October 2020 to January 2021 displays a significant increase in longer waiting periods compared to the
previous three winters. Over the last four years, the number of vessels held waiting for a Panama Canal
transit has increased steadily, as expected with increased production in the US and growing demand
for LNG in Asia. The winter of 2017/2018 (October to January for comparison) saw 50 cargoes waiting
at some point throughout the season, increasing to 65 in 2018/2019 and 85 in 2019/2020. Last year
saw a slight increase to 87 cargoes having to wait across the four-month period. During the winters of
2017 and 2018, only 17 per cent of all cargoes had to wait longer than four days. By the following winter,
the number had risen to 34 per cent waiting more than four days to transit the canal, and from October
2020 to January 2021, the number reached 42 per cent. In the previous three winters, just one vessel
was held waiting for a period of ten days or more compared to six last winter.
Figure 12: Distribution of laden LNG vessel PC wait times between Oct-Jan (days)
30
25
20
Number of vessels
15
10
5
0
1-2 2-3 3-4 4-5 5-6 6-7 7-8 8-9 9-10 10-11 11-12 12-13 13-14 14-15
2017/ 2018 2018/ 2019 2019/ 2020 2020/ 2021
Source: Kpler
In total during January, 58 LNG vessels (38 laden) transited through the Neopanamax locks (the
expansion in capacity in June 2016 allowed for vessels up to 120,000 DWT or 366m length compared
to 52,500 DWT or 294m length), with a combined deadweight of 6.74 million Panama Canal tons. The
canal has an allocation capacity of one LNG carrier per day in each direction, but in response to the
surge in January traffic, the Panama Canal Authority (PCA) doubled the allocation. This action helped
to reduce the waiting time by up to 50 per cent.
The contents of this paper are the author’s sole responsibility. They do not necessarily represent the views 12
of the Oxford Institute for Energy Studies or any of its MembersThe PCA also modified the allocation mechanism to allow the re-allocation by auction of any slot for a
Neopanamax vessel that becomes available within 96 hours of transit, thereby increasing the flexibility
of canal usage for those without reserved slots. 20
In Q4 2019, a significant number of cargoes was scheduled to be transported from the US Gulf of
Mexico to Asia. On that occasion, congestion through the Panama Canal led to a doubling of single
voyage times of up to 48 days. Whilst the number of cargoes transported between the US and Asia in
Q4 2020 and Q1 2021 was even higher than the year before, voyage times did not increase dramatically
(see Figure 14). Some of this is due to the actions of the PCA to reduce delays and increase efficiency,
but as highlighted previously, some is also due to the re-routing of cargoes via the Suez Canal or the
Cape of Good Hope, in order to avoid adding too many vessels to the Panama Canal queue. In January
2021 alone, 27 exports from the US bound for East Asia transited the Suez Canal, compared with a
total of eight cargoes in the prior seven years. US exports to East Asia plummeted in February, dropping
from a total of 48 in January to just 11 (see Figure 13).
Of the six laden vessels that had a Panama Canal waiting time of ten days or longer over last winter,
four of them were delayed at the canal having arrived between late November and mid-December. By
that point, with signals already received in the market about longer potential waiting times if transit slots
have not been booked, and after a record number of cargoes had already moved through the canal
from November’s exports, the push to ship LNG through the canal decreased and alternative route
options were selected. The market was essentially self-policing so as not to overload the canal further
through January. The average number of days waiting to transit the canal southbound in January 2021
was 3.9 days and there were just two vessels held up for nine days. This would have been far higher if
more vessels had not already opted for alternative routes.
Figure 13: United States monthly LNG exports to East Asia by route
Source: Kpler
20
https://www.hellenicshippingnews.com/panama-canal-lng-vessel-bottleneck-could-last-until-march/
The contents of this paper are the author’s sole responsibility. They do not necessarily represent the views 13
of the Oxford Institute for Energy Studies or any of its MembersUS Gulf Coast to Asia voyage times less affected than expected
Despite the increased distance that comes from avoiding the Panama Canal and using alternative
routes, average voyage times from the US Gulf Coast to Tokyo Bay were less affected than may have
been expected. December average vessel speed was 13.8 knots, regardless of route taken. In January,
it was 16.3 knots as vessels were instructed to increase speed because of the supply shortages in
Japan. Average speeds include any waiting time to transit the Panama or Suez Canals.
Via the Panama Canal, this acceleration would reduce the voyage time by 4 days and 9 hours to 25
days and 6 hours (excluding any delays before transiting the canal). Travelling via the Suez Canal,
however, the voyage is cut by 6 days and 20 hours from 45 days and 14 hours to 38 days and 18 hours.
For charterers, it appears that an increase of 9 days and 3 hours (slow Panama versus faster Suez
routes) was preferable to up to two weeks of delays at the Panama Canal.
Figure 14: Weekly average voyage duration for East Asian imports from the United States and
number of cargoes (based on week of import)
Source: Kpler
The main beneficiaries of these mitigating actions were the charterers of ships. As seen in Figure 15,
Spark 30 Atlantic assessments show that freight rates rose to over $320,000/day in January 21 as traders
rushed to arrange vessels to satisfy the dramatically higher demand in North Asia. They had been
$100,000 per day just two months earlier, before the winter cold snap arrived, the consequences of low
inventories in North Asia had become apparent and gas and electricity prices surged. The incentive for
rapid voyages and minimal delays was clear. The difference between freight rates in the Atlantic and
Pacific Basins tends to be minimal with historical variation within +/-$20,000/day. This price spread blew
out in January as the immediate demand for vessels was focussed primarily in the Atlantic with the
need to source vessels promptly to load cargoes from the US Gulf Coast (see Figure 16). On 8 January
2021 the price differential spiked at $100,750/day before returning to normal levels by early February.
21
https://app.sparkcommodities.com/freight/dashboard
The contents of this paper are the author’s sole responsibility. They do not necessarily represent the views 14
of the Oxford Institute for Energy Studies or any of its MembersFigure 15: Spark 30 spot and forward curve LNG freight rate
350
300
250
200
$k/ day
150
100
50
0
Jul-19 Oct-19 Jan-20 Apr-20 Jul-20 Oct-20 Jan-21 Apr-21 Jul-21 Oct-21 Jan-22
Source: Spark Commodities
Figure 16: Spark30 (Atlantic Basin) – Spark25 (Pacific Basin)
120
100
80
60
$k/ day
40
20
0
-20
-40
Jul-19 Oct-19 Jan-20 Apr-20 Jul-20 Oct-20 Jan-21 Apr-21 Jul-21 Oct-21 Jan-22
Source: Spark Commodities
The contents of this paper are the author’s sole responsibility. They do not necessarily represent the views 15
of the Oxford Institute for Energy Studies or any of its MembersDevelopment of northern sea route for Russian exports
In addition to sourcing more cargoes from the United States, as East Asia’s appetite for cargoes has
grown, Asian LNG buyers have sourced more LNG from Russia’s northern outpost at Yamal. This
largely seasonal flow would see exports start in April and decline into the winter, as more cargoes are
pulled into the European market and the preferable, but seasonally limited, Northern Sea Route (NSR)
is closed. These additional flows from Yamal are low relative to the increase in flows from the US to
East Asia but still provide flexibility for Asian buyers and an outlet for Russia when European demand
is waning. As demonstrated in Figure 17, 2020 saw a change with not only more cargoes heading East
during the summer months on lacklustre European demand, but then continuing into the winter.
Russia was among the few suppliers that was able to take advantage of high spot prices and redirect
cargoes into Asia, drawing away from Russia’s traditional determination to retain market share in
Europe. Yamal shipments to Asia normally favour the Suez Canal route during colder winter months as
transits along the NSR remain extremely rare at this time of the year as ice covers the Arctic Ocean.
Nevertheless, four cargoes have taken the NSR between November and January with a further four
making the voyage in October. The passage of the Christophe de Margerie in January marked the first
occasion for an LNG vessel and was carried out without an additional icebreaker. 22 The Nikolay
Yevgenov followed one day later with an LNG cargo bound for South Korea. After discharging in China,
the Christophe de Margerie turned around and headed straight back to Yamal, where it arrived on 19
February, promptly reloaded and set sail for Zeebrugge. The Nikolay Yevgenov elected to take the
warmer, but significantly longer, route via the Suez Canal and is expected to load in Yamal in mid-
March. Opting for the more challenging NSR return leg enables a reload after just 24 days compared
to the nearly twice as long 47 days offered by routing through the Suez Canal. No vessels attempted
the NSR for February exports – clearly the incentive to ship to East Asia had by then passed.
Figure 17: Yamal monthly LNG exports to East Asia by route
Source: Kpler
22
https://www.offshore-energy.biz/christophe-de-margerie-completes-late-eastbound-nsr-passage/
The contents of this paper are the author’s sole responsibility. They do not necessarily represent the views 16
of the Oxford Institute for Energy Studies or any of its MembersLNG fleet positioning going into winter
The interaction between Middle Eastern loadings and the rise in East Asian winter demand
drives several notable capacity patterns
The typical fleet distribution for LNG vessels undergoes several seasonal cycles. The first involves the
movement of volumes into East Asia beginning in mid-summer (June) steadily trending higher through
the end-of-year before peaking in January. In the eight month period June to January of 2018/2019 and
2019/2020, total LNG exports towards East Asia increased by an average of nearly 4mt. Given much
of this volume was sourced from the Middle East, ballast vessel availability in that region increased
through the late-spring and summer months, holding at an average of 25 vessels per day between April
and July, up from a low of just 15 vessels per day through the December/January period. Inversely, the
number of ballast vessels in the north Pacific peaked at or just above 105 vessels per day between the
months of December and March.
The normal seasonal ramp-up in departures towards East Asia was more extreme in the 2020/2021
period, given an unusually cold winter and a wide-open JKM price arbitrage. In the eight months ending
January 2021, LNG departures increased by some 9.8mt, far surpassing the 4mt average gain realized
over the previous two seasonal periods. It is important to note that much of this gain came late in the
seasonal cycle (Q4) after initial underestimations of winter demand through Q3. This ultimately caused
a record spike in ballast vessels in the north Pacific, which pushed to an average count of 120 vessels
per day as of February 2021. This spike in demand was met by volumes from two primary regions –
the Middle East and the United States.
The Mideast Gulf tends to act as a position to lay up ballast vessel capacity through the summer months
when global demand is weakest, with shippers anticipating the increase in winter demand soon to come.
As shown in Figure 18, in August 2020, average ballast Mideast Gulf vessel capacity initially pushed to
a record high 32 vessels per day on exceptionally weak demand levels, a result of COVID-19. This
quickly reversed in early Q4 as East Asian demand rapidly pushed higher. By September, vessel
availability in the region was trending back into line with normal seasonal levels.
The United States has now become the other key player. Between July 2020 and January 2021,
loadings towards East Asia increased by some 2.25mt, surpassing the average gain realized through
2018/2019 and 2019/2020 by 1.72mt. This had an obvious effect on ballast capacity within the Gulf of
Mexico. The average daily count of ballast vessels held at just over 13 in September 2020, an all-time
high and up by some 2 vessels against the norm for September realized in the previous two years.
Elevated capacity levels tended to hold through to the end of 2020, a result of many vessel arrivals that
had initially loaded out of the Middle East and discharged in East Asia. The United States was well
placed to handle the widening JKM price arbitrage given a robust market for spot cargoes out of the
USGC.
Figure 18: Regional LNG vessel ballast capacity
7
6
5
MIllion m3
4
3
2
1
0
Jan-18 Jul-18 Jan-19 Jul-19 Jan-20 Jul-20 Jan-21
Mideast Gulf Gulf of Mexico
Source: Kpler
The contents of this paper are the author’s sole responsibility. They do not necessarily represent the views 17
of the Oxford Institute for Energy Studies or any of its MembersEuropean demand follows a similar seasonal pattern to that of East Asia with exports out
of Russia, Qatar and the United States driving ballast capacity positioning
The European variation in loading patterns plays a significant role in determining ballast vessel capacity,
especially in the Mediterranean (Med). Through 2018/2019, ballast vessels within the Med region
averaged 19 per day through July, with subsequent spikes in January and February of the next year
(18 vessels per day on average). This pattern was magnified in February/March 2020 given record
Russian shipment levels with average ballast vessel capacity spiking to nearly 21 per day. The Med
tends to serve as a point for vessels to lay up early in the year when European demand tends to be the
strongest.
The United States and Qatar have also come to dominate European gas markets, albeit in different
ways. Qatar is largely a supplier that ships volume to Europe later in the seasonal demand cycle. Over
the past two years, Qatari departures peaked in April, with exports averaging 2.71mt. The state has
also shown a willingness to boost exports through Q3, the seasonal weak point for Europe. As
mentioned earlier, Mideast Gulf ballast vessel capacity tends to be highest in the April to July period.
Part of this is likely being driven by demand out of Europe.
The United States tends to ship volumes towards Europe at the seasonal high point. In 2020, departures
towards the continent finished at a record high 3.04mt in February, up slightly against a strong January
finish (2.88mt). As mentioned earlier, late-2020 was a strong period for US LNG loadings given a robust
spot market. Many vessels that had originally laid up in the Mideast Gulf, discharged in East Asia and
headed for the United States Gulf Coast.
Vessel utilization developments in response to the surge in demand
Fleet utilization as an indicator to market activity
When looking to determine the impact of the surge in demand through the last winter on the LNG fleet,
utilization split by vessel status (ballast vs. laden) is a useful metric to judge the situation. In this instance
it is possible to see elevated floating storage levels in the summer pushing up the percentage of fleet
laden during the summer, followed by the decrease of vessel activity moving into the autumn as exports
from the United States decrease on the back of reduced global demand. Vessel activity was well below
that of the previous two years through Q4 2020, setting up the need for a significant increase in laden
vessels in January 2021 (see Figure 19).
As global demand for LNG waned in Q2 2020, floating storage built up through May hit a high of 2.17mt
on the 23 June, 0.31mt higher than the previously recorded high on 23 October 2019. At the peak, the
majority of floating storage vessels were to be found in Eastern Asia. The week of the 8 June saw
1.09mt from a total of 1.96mt located in that region. Floating storage persisted at elevated levels through
to November at an average of 0.58mt across the month. The week of the 30 November saw this tonnage
completely clear as the rush to source cargoes began to develop. In a sign of the speed at which the
demand surge both came and went, by the 14 January there was a return to between one and two
cargoes acting as floating storage at first in East and South East Asia, followed by the Mediterranean.
Figure 19: Laden LNG vessel fleet utilization
46
44
42
40
%
38
36
34
32
30
J an Feb Mar Apr May J un J ul Aug Sep Oct Nov Dec
2017 2018 2019 2020 2021
Source: Kpler
The contents of this paper are the author’s sole responsibility. They do not necessarily represent the views 18
of the Oxford Institute for Energy Studies or any of its MembersAverage vessel speeds and voyage distances
Average vessel speeds increase globally
As highlighted previously with regards to the voyage duration for vessels heading from the USGC to
East Asia, vessel behaviours changed significantly through January in order to meet the immediate
demand requirements. On a worldwide basis, across multiple routes, the LNG fleet saw an increase in
average vessel speeds through December and January, far above that which is typical for the time of
year. As shown in Figure 20, the increase in speed between November and December 2020 was 8.8
per cent compared to an average of 3.7 per cent in the previous four years. Vessel speeds in January
were 2.3 per cent higher year on year, despite January 2020 representing the previous high for the
month. This coming after the summer of 2020 represented the most prolonged period of low vessel
speeds in the last five years on the back of dwindling demand.
Vessels heading from the USGC to East Asia averaged 16 knots in January 2021. Whilst not setting
any records (the highest average speed recorded on the route fell in January 2019), it is worth bearing
in mind that any waiting time spent at the Panama Canal is included in these calculations. There was
no such increased congestion during January 2019. The implication being that for vessels travelling via
the canal, the speed when transiting the Pacific Ocean was far higher this year.
Movements from Australia to East Asia also saw a significant increase in vessel speeds. From a low of
13.3 knots in August, average speeds hit a new high of 15.2 knots in January before returning to a more
seasonal 14.6 knots in February.
Figure 20: LNG fleet average vessel speeds
14.5
14.0
13.5
knots
13.0
12.5
12.0
Jan Feb Mar Apr May Jun Jul Aug Sep Oct Nov Dec
2016 2017 2018 2019 2020 2021
Source: Kpler
Average voyage distances increase on diversions and choice of route
With speeds increasing and average journey times between the US and East Asia remaining relatively
stable, the balancing item in the equation is increased voyage distance. Global average voyage
distances increased considerably in December and January, up 12 per cent and 17.2 per cent year on
year respectively. As discussed in the section covering the issues caused by Panama Canal
The contents of this paper are the author’s sole responsibility. They do not necessarily represent the views 19
of the Oxford Institute for Energy Studies or any of its Memberscongestion, the move to alternative routes pushed shippers into longer and/or more convoluted paths.
When factoring in reversals in direction mid-Atlantic or a continuation of a voyage through the Suez
Canal and on to Asia, average voyage distances hit 3,252 nautical miles (nm). The metric of average
voyage distance demonstrates minimal seasonality over the last five years, unsurprising given the
relatively limited point to point connections within the market. As such the massive increase seen in
December 2020 and January 2021 is all the more stark (see Figure 21). It demonstrates the flexibility
and high level of optimization needed to respond to the immediate supply shortage in the East.
Figure 21: Month average LNG all laden voyage distance
3,300
3,200
3,100
Nautical miles
3,000
2,900
2,800
2,700
2,600
2,500
Jan-16 Jan-17 Jan-18 Jan-19 Jan-20 Jan-21
Source: Kpler
Ton-miles increase as the combination of all metrics
The steady growth of the global LNG market dictates that ton-miles, a metric used to help gauge the
demand in the shipping market where more tons or longer distance travelled results in more vessels
needed or vessels engaged for longer duration, must increase largely in line with demand, as seen in
Figure 22. Growth in global ton-miles on a rolling 12-month basis has ranged between 8.3-16.8 per cent
in the last four years, peaking in October 2018. On a simple year on year comparison basis, 2020 is
the only year where there has been a decline in ton-miles with an average decline of 0.8 per cent year
on year between July and November. Demand in December 2020 returned to growth territory, up 8.1
per cent on the year with additional gains in January 2021, up 15.6 per cent year on year.
Ton-miles for imports to China actually peaked in December. Whilst imports increased slightly in
January compared to December (8.46mt compared to 8.39mt), the country sourced more cargoes from
shorter haul locations such as Malaysia or Papua New Guinea or medium haul from Qatar over the
United States. Japan and South Korea both experienced peaks in ton-miles for their imports in January,
as in a reverse picture to that for China, the increase of flows imported from the United States had an
outsized impact. The global total ton-miles for February have corrected back down to more typical
annual growth, even if at subdued levels (+3.2 per cent year on year).
The contents of this paper are the author’s sole responsibility. They do not necessarily represent the views 20
of the Oxford Institute for Energy Studies or any of its MembersFigure 22: Monthly total LNG all laden voyage ton-miles
200
180
160
Ton-miles (bn)
140
120
100
80
Jan-16 Jan-17 Jan-18 Jan-19 Jan-20 Jan-21
Source: Kpler
LNG fleet growth vs. supply and demand growth
It could be argued that the question of whether or not growth in fleet capacity can keep up with increased
LNG supply/demand is a moot point. Global imports through the winter of 2019/2020 were higher than
those experienced the following year with no such spike in freight rates or LNG prices. Spark 30 (Atlantic
Basin) freight rates peaked at $158,000/day in October 2019 compared to a peak of $322,500/day in
January 2021.23 Between those two periods, available vessel capacity had increased by 9.2 per cent,
clearly pointing to the fact that overall vessel capacity was not an issue in the recent price spike. The
same conclusion can be drawn at a macro level when looking at total fleet laden utilization on a
percentage basis as highlighted previously. Figure 23 shows the development of available vessel
capacity against global LNG exports over time.
Over the last four years, December’s year on year growth in available fleet capacity has averaged 8 per
cent. This compares to an average growth in annual exports over the same period of 8.1 per cent, or
annual growth in LNG demand of 9 per cent according to OIES figures. 24 Growth in available vessel
capacity is projected to reach 11 per cent by December 2021, compared to annual growth of just 1.8
per cent in LNG demand according to the OIES. As such it is not likely that global vessel availability will
be the cause of any price spikes next winter – although that does not rule out any regional supply and
demand issues leading to logistical problems.
Average voyage durations decrease in response to price incentives
When combining the impact of increased voyage distances and vessel speeds it is possible to see just
how the market was able to respond to the unprecedented surge in demand in East Asia. Despite record
imports in January 2021 (up 11 per cent on the previous high of January 2019 if discounting the
subsequently beaten record of December 2020), and the sourcing of increased tonnage from
23
https://www.sparkcommodities.com/
24
OIES LNG demand forecasts
The contents of this paper are the author’s sole responsibility. They do not necessarily represent the views 21
of the Oxford Institute for Energy Studies or any of its Memberssignificantly longer haul origins, there was a decrease in the combined average duration of cargo
voyages through January.
Figure 23: Total LNG vessel capacity vs global LNG exports
110
100
90
MIllion m3
80
70
60
50
40
Jan-17 Jul-17 Jan-18 Jul-18 Jan-19 Jul-19 Jan-20 Jul-20 Jan-21 Jul-21
Available Vessel Capacity Global Exports
Source: Kpler
As discussed previously, through a combination of route changes, diversions and speed increases,
cargoes arriving from the United States were able to avoid the serious delays and extended durations
seen in Q4 2019 at the time of the last spike in Panama Canal congestion. As shown in Fugure 24,
vessels moving from Australia and Qatar also shortened voyage times by increasing their speed in
order to best capture the limited duration market incentive to sell additional cargoes into the region. As
the pressure (and price incentive) to ship cargoes into the region has eased, so voyage durations have
increased again.
Figure 24: East Asia LNG imports average laden voyage duration from major producers by
arrival week (4-week moving average)
Source: Kpler
The overall increase in average voyage duration does highlight that the region needs to adjust to longer
voyage durations on average, as an ever-greater share of cargoes (in particular, additional spot
purchases) will be sourced from the United States.
The contents of this paper are the author’s sole responsibility. They do not necessarily represent the views 22
of the Oxford Institute for Energy Studies or any of its MembersIt should be highlighted that the driver behind increased voyage durations through summer 2020 was
the elevated and persistent level of floating storage and slow steaming brought about by the absolute
drop in LNG demand due to the pandemic. Voyage duration is calculated as the simple difference
between the departure time from the load port and arrival time at the discharge port.
Ton-days give the best all round picture of how the market responded to the
situation
The use of ton-days, a simple multiple of single voyage duration and the tons carried, is a further
powerful metric to demonstrate the problems faced with sourcing a large quantity of LNG at relatively
short notice for the East Asian market. It is possible to encapsulate all the factors surrounding canal
delays and route selection in this single measure of total ton-days for imports into East Asia.
Despite significant growth in imports to East Asia over the years, the growth in the total ton-days for
deliveries into East Asia has shown even greater gains (see Figure 25). Total ton-days for December
imports were 363.2 million, up 14 per cent y/y, a moderate increase in growth compared to that for
absolute tons. Total ton-days for January saw year-on-year growth of 24 per cent and 33 per cent for
February, considerably larger percentage growth than seen for the tons imported.
This disparity between year-on-year growth in tons versus ton-days demonstrates how much of an
impact the marginal cargoes from the US are having on imports into East Asia. Incremental supply from
short and mid-haul origins such as Australia and Qatar are limited (even more so from Australia given
recent outages), meaning that long-haul origin cargoes provide the marginal supply, as shown in Figure
27. Given the inherent increase in duration for these voyages, even using the most optimal Panama
Canal route without increased delays for canal transits, the risks of not receiving a cargo ‘in time’ are
greater.
Figure 25: East Asian LNG imports in tons and ton-days
Source: Kpler
Figure 26 demonstrates how growth in imports in tons has lagged that for growth in imports in ton-days,
indexed against imports in January 2016. By January 2021, imports measured in ton-days had
increased by 103.6 per cent compared to January 2016, compared to an increase of just 57.8 per cent
for imports in tons.
The contents of this paper are the author’s sole responsibility. They do not necessarily represent the views 23
of the Oxford Institute for Energy Studies or any of its MembersYou can also read