Ministry of Business, Innovation and Employment - Hydro generation stack update for large-scale plant - MBIE
←
→
Page content transcription
If your browser does not render page correctly, please read the page content below

Ministry of Business,
       Innovation and Employment
       Hydro generation stack update for
       large-scale plant

Version 1.3: Final
24 September 2020
Roaring40s Wind Power Ltd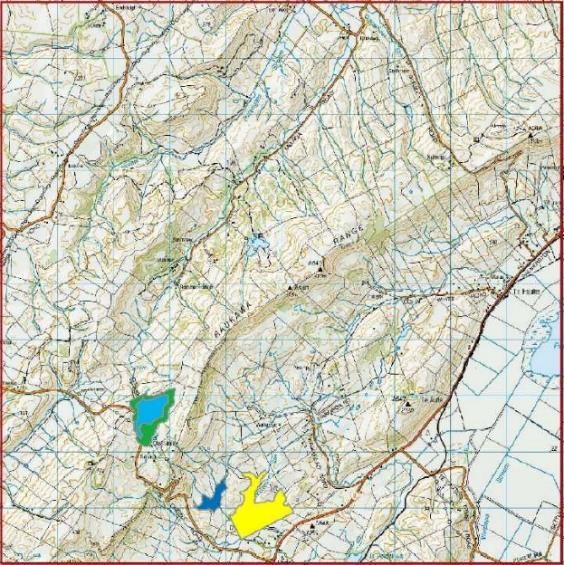
Hydro generation stack update for large-scale plant

Document Control
 Revision No.   Date                  Revision Details           Authors
 1.0            24 July 2020          Draft for review           SH/GM
 1.1            10 August 2020        Updated draft for review   SH/GM
 1.2            16 September 2020     Final draft for review     SH/GM
 1.3            24 September 2020     Final                      SH/GM

                                                                 Page|2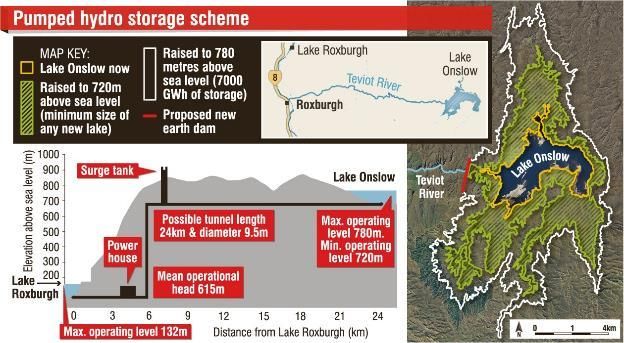
Hydro generation stack update for large-scale plant

Table of Contents
1.     Introduction ........................................................................................................................................... 4
2.     Objective................................................................................................................................................ 5
3.     Methodology ......................................................................................................................................... 6
     3.1.     Existing grid connected hydro plant update ................................................................................. 6
       3.1.1.         Context .................................................................................................................................. 6
       3.1.2.         Methodology ......................................................................................................................... 6
     3.2.     Potential new large-scale hydro plant........................................................................................... 7
       3.2.1.         Context .................................................................................................................................. 7
       3.2.2.         Methodology ......................................................................................................................... 7
     3.3.     Pumped Hydroelectric Energy Storage (PHES) .............................................................................. 8
       3.3.1.         Context .................................................................................................................................. 8
       3.3.2.         Methodology ....................................................................................................................... 10
4.     Results ................................................................................................................................................. 10
     4.1.     Existing grid connected hydro plant update ............................................................................... 10
       4.1.1.         Consent expiry and reconsenting ........................................................................................ 12
       4.1.2.         Operations and maintenance costs ..................................................................................... 13
     4.2.     Potential new large-scale hydro plant......................................................................................... 14
       4.2.1.         Update on the potential hydro plant being investigated in 2012 ....................................... 14
       4.2.2.         Consentability ...................................................................................................................... 15
     4.3.     Other potential large-scale hydro plant ...................................................................................... 16
     4.4.     PHES opportunities in New Zealand ............................................................................................ 17
       4.4.1.         Lake Onslow PHES scheme .................................................................................................. 17
       4.4.2.         Other PHES schemes ........................................................................................................... 19
       4.4.3.         Summary.............................................................................................................................. 23
5.     About the authors ............................................................................................................................... 25
6.     References ........................................................................................................................................... 26

                                                                                                                                                        Page|3
Hydro generation stack update for large-scale plant
1. Introduction
The Ministry of Business, Innovation and Employment (MBIE), with support from Transpower, has
engaged Roaring40s Wind Power Ltd (R40s) to provide an updated assessment of the existing and
potential large scale hydro electricity generation in New Zealand. This is necessary to ensure that the
information on generation plant in the ‘generation stack’ database is current and accurate so that any
modelling based upon it is robust and delivers reliable results. The generation stack is used to assist with
understanding and determining what electricity generation capacity is required to be built and when, in
order to meet forecast electricity demand. It is a key input to modelling performed by MBIE, Transpower,
and the wider electricity industry1.
The future of the New Zealand (NZ) electricity system has been the focus of a number of studies in
recent years with reports undertaken by Transpower2, the Interim Climate Change Committee (ICCC)3,
MBIE4 and the Productivity Commission5 being the most noteworthy. These reports address the growth
of NZ’s electricity market (out to 2035 in the ICCC report and to 2050 in the other reports) and what this
means in regards to NZ’s electricity demand - and mix of technologies - as it moves towards a 100%
renewable generation goal and a low carbon economy.
Transpower’s most recent modelling work undertaken for their March 2020 report Whakamana i te
Mauri Hiko assessed a range of different electricity demand forecast scenarios. These forecast scenarios
suggest an increase from New Zealand’s current electricity demand of ~40 TWh/annum to between 56
and 80 TWh/annum by 2050. This range aligns with the modeling work undertaken by the other parties.
Figure 1 shows actual demand between 1998 to 2018 and various modelled scenarios by MBIE and
Transpower between 2018 to 2050. Also plotted is an extrapolation from the 2018 actual demand to the
upper estimate of the ICCC forecast – which was modelled as being 57 TWh/annum by year 2035.
During the course of writing this report, Rio Tinto announced their intent to close the Tiwai Aluminium
smelter (NZAS) in August 20216. This will mean a reduction of 5 TWh/annum, or 13%, of NZ’s electricity
demand. Transpower’s ‘Tiwai Exit’ scenario, modelled for the Whakamana i te Mauri Hiko report and
included on Figure 1, can thus be considered the most plausible of the future demand scenarios –
assuming the smelter does close, but with a ‘staged exit’7 over a five-year period between 2020 – 2025.
This scenario shows:
• a decrease in electricity demand between 2020 and 2025,
• a recovery in electricity demand back to 2020 levels by 2029,
• significant growth (at the same rate as the Transpower Accelerated Electrification scenario) over
the subsequent 20 years to give a total demand of approximately 65 TWh/annum by year 2050.
1
https://www.mbie.govt.nz/building-and-energy/energy-and-natural-resources/energy-statistics-and-
modelling/energy-publications-and-technical-papers/nz-generation-data-updates/
2
Transpower (2018). Te Mauri Hiko – Energy Futures (White Paper), which has since been superseded by the
March 2020 report Whakamana i te Mauri Hiko.
3
ICCC (2019). Accelerated electrification: Evidence, analysis and recommendations, Interim Climate Change
Committee.
4
New Zealand Government [MBIE] (2018). Electricity Price Review Hikohiko Te Uira. First Report for Discussion.
5
New Zealand Productivity Commission (2018). Low-emissions economy – Final Report.
6
https://www.nzas.co.nz/files/3413_2020070981142-1594239102.pdf.
7
A ‘staged exit’ being one that would see a reduction in the smelter operations (and electricity consumption) over
a period of years, as opposed to the total ‘hard exit’ in August 2021.
Page|4Hydro generation stack update for large-scale plant
80
Actual (1998 - 2018)
75
MBIE Global
70 MBIE Disruptive
ICCC Accelerated Electrification
65 Transpower Business as Usual
Transpower Accelerated Electricfication
60
Transpower Mobilise to Decarbonise
TWh
55 Transpower Tiwai Exit (staged)
50
45
40
35
30
2016
2042
1998
2000
2002
2004
2006
2008
2010
2012
2014
2018
2020
2022
2024
2026
2028
2030
2032
2034
2036
2038
2040
2044
2046
2048
2050
Year
Figure 1. NZ Electricity Demand Forecasts
2. Objective
There are three objectives in relation to the assessment of existing and potential large-scale (or grid
connected) hydro electricity generation projects – the first is to review the comprehensive Parsons
Brinckerhoff (PB) report 2011 NZ Generation Data Update8 completed in early 2012, and update, as
required, any information that may have changed in regards to the parameters describing the large-scale
hydro plant. In particular, two new parameters are required in relation to each hydro plant;
• Consent expiry - which should refer to the year in which the consent to use water for the purposes
of electricity generation expires, and;
• Reconsent likelihood - which is to be a qualitative assessment indicated as either “High”,
“Medium” or “Low”.
In addition to the above information, a review and update of the variable and fixed operating and
maintenance (O&M) costs is also required. This is to be provided as a single value given for each of these
costs applicable to all plants (as it was provided in the PB report).
The second objective is to review the list of potential new large-scale projects described in the PB report
– and add any others that are considered to be missing from the PB list. The following information is
required for each project:
• The river that the project is on
• The intended peak capacity (MW)
• Estimated annual generation (GWh)
8
Parsons Brinckerhoff (2012). 2011 NZ Generation Data Update. A report for the Ministry of Economic
Development.
Page|5Hydro generation stack update for large-scale plant
The third objective is to provide a general assessment of the likelihood or viability of Pumped
Hydroelectric Energy Storage (PHES) – or more colloquially, ‘pumped hydro’. This is to be a general
assessment based on existing information on potential locations in New Zealand and not involve detailed
modelling or appraisal of expected characteristics and associated costs.
3. Methodology
The following provides some context to the objective of the work before describing the methodology
undertaken to achieve the objectives.
3.1. Existing grid connected hydro plant update
3.1.1. Context
Large-scale hydro generation in New Zealand is the backbone for electricity generation in New Zealand –
as it has been for the past 100 years. Hitting a peak of 84% in 1980, the percentage of New Zealand's
electricity provided by hydro generation has been between 50% and 60% for the last decade9. There is
approximately 5,474 MW10 of installed capacity of hydro generation in New Zealand, of which 5,312 MW
(97%) is connected to Transpower’s high voltage transmission grid.
There have not been any changes in the number of large-scale hydro plant in New Zealand for almost 30
years since the Clyde power station was completed, and certainly no changes in the number of grid
connected plant since the PB (2012) study. In contrast to other forms of renewable generation such as
wind and solar, the technology associated with hydro generation has changed little over time, meaning
that the opportunities to enhance existing plant to provide significant increases in output or to develop
sites that were previously considered uneconomical, are fewer. As such, it is appropriate and sensible
that the methodology as directed by MBIE for this study is confined to being just an update on specific
information in the PB (2012) report, as opposed to a standalone new assessment, which would
essentially just be a repeat of the previous report.
3.1.2. Methodology
The work associated with the objective of reviewing and updating the information for existing grid
connected hydro plant concerned the following process:
• A spreadsheet supplied by MBIE, based on the hydro plant previously identified in the 2012 PB
report, was checked and expanded to include a number of relevant parameters, including those
new parameters required as part of this study.
• Owners of each of the listed hydro plant were identified and contact was made by email
requesting the information required.
• Once received, the information was checked, and any parameters not provided were sought
through internet searches.
• In regard to the reconsent likelihood, discussions were had with relevant staff within the owners
of the plant responsible for consent related matters in order to inform an assessment as “High”,
“Medium” or “Low” and additional context was also obtained in regards to any new restrictions
or constraints that may be imposed by consent authorities in conditions of consent that may
impact the operation of hydro plant.
9
https://www.mbie.govt.nz/building-and-energy/energy-and-natural-resources/energy-statistics-and-
modelling/energy-statistics/electricity-statistics/
10
Based on information obtained during the course of this study. Note that the 4.8 MW Matiri scheme (Pioneer
Generation) is currently under construction and will increase the total to 5,479 MW when completed (late 2020)
Page|6Hydro generation stack update for large-scale plant
3.2. Potential new large-scale hydro plant
3.2.1. Context
The scope of work associated with the objective of identifying potential new large-scale hydro projects
was also to review and update information contained in the PB (2012) report. Once again, there is logic
in this – in the past decade since the PB (2012) report was written, there has been a sustained period of
low electricity demand growth meaning that few developers have begun investigations into new sites,
especially in regard to hydro generation.
Furthermore, over the same period, there has been more and more competition for water, especially
from the dairy and horticulture industries, and more attention on the health and protection of river
catchments and ecosystems. In addition, there has been a significant improvement in the economic
viability of generation from wind and solar. All of this has combined to make new hydro generation
more difficult to consent, and less attractive, in a commercial sense - compared to other forms of
generation.
However, that is not to suggest that there aren’t new hydro opportunities that could be developed in the
future. Given the aspirations for New Zealand to achieve 100% renewable electricity (in a normal
hydrological year) and the anticipated increase in electricity demand over the next few decades to meet
the electrification of the country’s energy needs11, large-scale hydro generation cannot be ruled out as a
potential source of meeting a portion of the future demand growth.
As such, we have elaborated on the list of potential schemes previously described in the PB (2012) report
and added a number of additional potential opportunities identified in other reports12 and based on our
own experience of undertaking such investigations.
3.2.2. Methodology
Theoretically there is a vast amount of large-scale hydro potential in New Zealand. However, realistic
options are much fewer due to factors such as:
• Remoteness and construction practicality
• Environmental constraints
• Recreational use constraints
• Transmission constraints
• Distance from the grid
• Other user competition for the water (e.g. irrigation)
Applying these factors when assessing a potential hydro resource often involves a significant degree of
subjectivity. The actual feasibility of developing a site cannot usually be determined without investment
in studies addressing the above factors to determine if there are any fatal flaws with a proposal.
As for the exercise to update information on existing large hydro plant, information on the status of
investigations for those projects listed in the PB (2012) report was obtained through making direct
contact with the owners of the potential options. We have then added to this list with additional
potential sites that are described in other reports and based on our own experience. It is noted that
situations change over time and a possible scheme considered unlikely to be developed now could at
some point become viable. Conversely, the opposite also applies where a resource identified now could
be precluded by a subsequent change in the situation pertaining to it.
11
In order to meet the goal of zero carbon emissions by 2050 as legislated by the Climate Change Response (Zero
Carbon) Amendment Bill
12
The report ‘Waters of National Importance – Identification of Hydroelectric Resources’ by East Harbour
Management Services (2004) is a significant source of information
Page|7Hydro generation stack update for large-scale plant
3.3. Pumped Hydroelectric Energy Storage (PHES)
3.3.1. Context
PHES is a proven and effective way of storing energy to generate electricity at some future time.
Although there are no PHES schemes currently in New Zealand, they are not uncommon elsewhere, with
approximately 165 GW of installed PHES schemes worldwide13 - this being approximately 16 times NZ’s
total installed generation capacity (of ~ 10.2 GW14).
PHES plants can have an array of different design and sizes but all work on the same principle - by having
the ability to pump water from one water storage reservoir at lower elevation into a second water
storage reservoir at higher elevation and then allowing that same water to flow in the opposite direction
to generate power. This can be done using the same pipe/tunnel and pump in reverse (so it acts as a
turbine) to generate power. Some PHES have the advantage of capturing natural inflows to the upper
water storage reservoirs thereby augmenting the opportunity to generate power.
Existing PHES schemes vary greatly in size. Bath County in USA is the largest scheme in the world with a
capacity of 3GW, whereas El Hierro in the Canaries has a capacity of 11MW15. As for any hydro plant, the
capacity of PHES depends on the flow and the head/fall (elevation difference). The head of existing PHES
schemes varies from 70m (Kiev Pumped Storage Plant, in Ukraine) to 1265m (Edolo, Italy)16. The
distance between reservoirs is important, impacting not only the operational efficiency but also the cost
of construction. A reasonable parameter for assessing the potential of a PHES scheme is the head to
length (distance) ratio. As a rule of thumb this ratio should be greater than 0.117 - i.e. 100m head over
1000m distance to ensure hydraulic efficiency losses do not adversely impact on project economics.
All PHES can be classified as either "closed loop" or "open loop". A closed loop system is one in which
both water storage sites are independent of any free-flowing water source. Open loop systems have one
or both water storage sites associated with a free-flowing water source i.e. river, natural lake or hydro
power reservoir. Open loop systems are the more common – certainly in regions where water is
plentiful and/or where hydro power is well established. This isn’t surprising, as for any generation plant
one of the key objectives is to devise the most economically attractive scheme for the purpose for which
it is required and in consideration of environmental impacts. Often the most effective way of achieving
this is by minimising the construction cost. Having one, or both, water storage sites already existing is
thus a significant advantage.
Unsurprisingly, many of the attributes that are desirable for hydro generation are also desirable for
PHES, such as large head, large volume reservoirs, short pipes/tunnels, in close proximity to existing
transmission lines of adequate spare capacity, good access and good geological/geographical conditions
– all of which give rise to attractive project economics. In addition, minimum conflicts with cultural,
environmental, social, heritage, archaeological, and land management aspects are desirable.
The intent (and thus design) of PHES schemes is to have enough storage to mitigate undesirable market
conditions caused by electricity supply and demand imbalance. In some cases, the market issue being
addressed is short duration diurnal variations – traditionally due to high demand and high prices during
the day and low demand and low prices during the night. For these repetitive cycles, the purpose of
PHES is to pump water up into the upper water storage reservoir at night when prices and demand is low
13
Hunt, J.D., Byers, E., Wada, Y. et al. Global resource potential of seasonal pumped hydropower storage for energy
and water storage. Nat Commun 11, 947 (2020).
14
ICCC (2019)
15
McQueen (2019a)
16
McQueen (2019)
17
Rogeau, A. et al (2017)
Page|8Hydro generation stack update for large-scale plant
and then generate with the same water during the day when prices and demand is high. More recently
PHES has been getting attention in Australia to address a diurnal market issue – but one that concerns
very low (and sometimes negative) prices during the day and high prices at night– caused by increasing
penetration of solar generation in some areas, in particular Queensland18. Regardless of the reason why
diurnal variations in the electricity market exist, the requirement for PHES in these situations will only be
for relatively short durations of generation – sometimes as few as 6-18 hours.
New Zealand is different from many other countries in that it generally doesn’t have a significant
variation in electricity prices on a diurnal basis – or any other time period. This is partly due to the
country’s generation mix, where we have a low proportion of inflexible thermal base load generation
and a high proportion of flexible hydro power. Without a regularly repeating variation in electricity
prices, the frequency of low-cost pumping periods are fewer and this makes the economics of PHES
challenging. This is further exacerbated for an open loop PHES if one of the reservoirs is an operational
hydro lake. Unless the water being pumped up to the PHES reservoir would otherwise have spilled, the
removal of water from an existing hydro reservoir is a temporary loss of generation potential from that
plant, and any hydro plant downstream – until it is returned to the reservoir.
However, there is a widely accepted view that there will be a decarbonisation of New Zealand’s energy
system over the next few decades. This is something that has been well documented in a number of
recent reports undertaken by Transpower, ICCC, NZ Productivity Commission, MBIE (as described in
Section 1). The removal of carbon from our energy system is also something that is set as aspirational
targets by government (i.e. “90% renewable electricity by 2025”, “100% renewable by 2035”) and is
something that has more recently been required by legislation via the Climate Change Response (Zero
Carbon) Amendment Act. This has been mandated partly in response to New Zealand ratifying the ‘Paris
Agreement’ in 2016 (which is a commitment to reducing greenhouse gas emissions to 30% below 2005
levels by 2030) but also goes further, requiring New Zealand to “reduce net emissions of all greenhouse
gases (except biogenic methane) to zero by 2050”19.
This decarbonisation will likely result in a greater penetration of renewable generation (especially wind
and solar) – and less thermal base load (gas and coal fired) generation. This will introduce more
intermittency to the generation system which will likely increase the amount of price fluctuations in the
electricity market. It will also make fast response storage systems, such as PHES, more attractive.
PHES could also help mitigate the ‘dry year’ risk, where ‘dry years’ refer to periods of weeks to months of
constrained hydro availability. This is a phenomenon that New Zealand faces due to its high penetration
of hydro generation which has relatively low storage capacity. During extended periods of low inflows,
hydro storage can become depleted, and without the appropriate ‘back-up’ generation source, the New
Zealand electricity system can be at risk of brown-outs, causing significant disruption to businesses and
an accompanying adverse economic impact.
The coal/gas fired Huntly power station, being more flexible in its operations, is generally viewed as the
plant that is required to provide the dry year risk cover. With the move towards a carbon-free energy
future as required by the Climate Change Response (Zero Carbon) Amendment Act, the dry year risk
cover will ideally need to be met by another source – and one that is renewable. Given that PHES is a
storage system that uses water, this may not seem a likely candidate for mitigating dry year risk unless
the water storage site(s) are of sufficient size – which would need to be enough to provide the necessary
generation cover in the dry years. The maximum size of the dry year risk has been calculated as being
approximately 3,000 GWh of electricity20.
18
https://www.afr.com/companies/energy/the-winners-from-negative-electricity-prices-20190905-p52o7r
19
https://www.mfe.govt.nz/climate-change/zero-carbon-amendment-act
20
ICCC (2018)
Page|9Hydro generation stack update for large-scale plant
In summary, the investigation of energy storage schemes including PHES is likely to gain more attention
in New Zealand over the coming years/decades. The attractiveness of PHES schemes will depend on
their location, economics, storage potential, the benefits they bring to the electricity market (i.e. in
suppressing price spikes and in enabling more optimal operation of existing plant), and the ability to
mitigate dry year risk.
3.3.2. Methodology
As described in Section 2, the objective is to summarise existing studies on PHES opportunities in New
Zealand and provide our view. As such, our methodology has been a combination of literature search
and discussions with subject matter experts.
4. Results
4.1. Existing grid connected hydro plant update
Table 1 describes the key attributes of the grid connected hydro plant. It is important to note that the
nameplate generation capacity is not always reflected in the actual generation capacity. This can be due
to operational constraints such as those imposed by consent conditions (e.g. Manapouri), old equipment
with increased losses, or limitations on operation imposed by sub-optimal design which are manifested
by de-rated equipment and/or inefficiencies (e.g. Aratiatia, Ohau B and Ohau C). The figures expressed
in Table 1 show the actual generation capacities.
It is also important to note that refurbishments undertaken by the owners can increase power station
output through the installation of new equipment or reconditioning of old equipment leading to a
reduction in losses and improved efficiencies. For example, there have been a number of refurbishments
undertaken on the Waikato hydro chain over the past decade, which has delivered an increase of 36MW
- with more refurbishments scheduled to occur over the next few years21, 22, 23.
There has been an increase of 118 MW in the total capacity of grid connected hydro plant since the PB
(2012) report. This increase is all due to enhancements/refurbishments of the plant that existed in 2012
– i.e. no new grid connected hydro plant have been constructed within this period. The increase is due
partly to the Waikato hydro chain refurbishments described previously, but mainly due to improvements
at Manapouri power station, which now has a capacity 70 MW greater than that described in the PB
(2012) report.
A number of changes to Manapouri station have occurred over the past two decades to improve capacity
– a second tailrace tunnel was excavated between 1998 and 2002 to alleviate excessive friction losses in
the single original tailrace. This was followed by a major mid-life refurbishment of the seven generating
units which took place between 2002 - 2007. In 2010 changes to the resource consent conditions
relating to the volume of discharge permitted into Doubtful Sound were approved. This enabled
Meridian to generate up to the current 800 MW - which is still 50MW less than the installed (nameplate)
capacity (850 MW). It is likely the figure in the PB (2012) report was the MW limit prior to the change of
conditions relating to the discharge into Doubtful Sound.
The remainder of the difference is due to minor changes in output for various stations plus the previous
omission of the Lower Mangapapa station (5.6 MW) – being part of the ‘Kaimai’ scheme in Bay of Plenty.
21
https://www.andritz.com/hydro-en/hydronews/updates-hydronews/karapiro-new-zealand-news
22
https://www.nzherald.co.nz/business/news/article.cfm?c_id=3&objectid=12196316
23
https://www.andritz.com/hydro-en/hydronews/hydro-news-29/hy-hn29-42-new-zealand-aratiatia/aratiatia-
news
Page|10Hydro generation stack update for large-scale plant
Table 1 Grid Connected Hydro Plant – Key Attributes
Owner Existing plant Rated Largest GIP Regional Authority River/Scheme Year Consent
capacity Unit (MW) Substation Commissioned Expiry
(MW)
Waikato Hydro Regional Capacity
Mercury Aratiatia 78 31 WRK Waikato Waikato 1964 2041
Mercury Ohakuri 106 28 WKM Waikato Waikato 1961 2041
Mercury Atiamuri 74 21 WKM Waikato Waikato 1957 2041
Mercury Whakamaru 124 31 WKM Waikato Waikato 1956 2041
Mercury Maraetai I 176 36 WKM Waikato Waikato 1952 2041
Mercury Maraetai II 176 36 WKM Waikato Waikato 1970 2041
Mercury Waipapa 54 18 WKM Waikato Waikato 1961 2041
Mercury Arapuni 192 24 ARI Waikato Waikato 1929 2041
Mercury Karapiro 96 32 KPO Waikato Waikato 1947 2041
TOTAL 1076
Bay of Plenty Hydro Regional Capacity
Trustpower Lloyd Mandeno (Kaimai) 16 8 TGA Bay of Plenty Wairoa River 1972 2026
Trustpower Lower Mangapapa (Kaimai) 5.6 3 TGA Bay of Plenty Wairoa River 1979 2026
Trustpower Kaimai 5 (Kaimai) 0.3 0.3 TGA Bay of Plenty Wairoa River 1994 2026
Trustpower Ruahihi (Kaimai) 20 10 TGA Bay of Plenty Wairoa River 1981 2026
Trustpower Matahina 80 40 MAT Bay of Plenty Rangataiki 1967 2048
Trustpower Wheao 24 12 ROT Bay of Plenty Wheao 1982 2026
Trustpower Flaxy 2 2 ROT Bay of Plenty Flaxy 1982 2026
Southern Generation Aniwhenua 25 12.5 MAT Bay of Plenty Rangitaiki 1982 2026
TOTAL 173
Hawke's Bay Hydro Regional Capacity
Genesis Energy Tuai 60 20 TUI Hawkes Bay Waikaremoana 1929 2032
Genesis Energy Piripaua 42 21 TUI Hawkes Bay Waikaremoana 1943 2032
Genesis Energy Kaitawa 36 18 TUI Hawkes Bay Waikaremoana 1948 2032
TOTAL 138
Taranaki Hydro Regional Capacity
Trustpower Patea 32 10 HWA Taranaki Patea 1984 2040
TOTAL 32
Bunnythorpe Hydro Regional Capacity
Genesis Energy Tokaanu 240 60 TKU Waikato Tongariro 1973 2039
Genesis Energy Rangipo 120 60 RPO Waikato Tongariro 1983 2039
TOTAL 360
Wellington Hydro Regional Capacity
King Country Energy Mangahao (inc mini)* 39 26 MHO Horizons Mangahao 1924 2027
TOTAL 39
Nelson/Marlborough Hydro Regional Capacity
Trustpower Cobb 32 10 STK Tasman Cobb 1944 2038
TOTAL 32
Christchurch Hydro Regional Capacity
Trustpower Coleridge 39 13 COL ECan Rakaia 1914 2031
Trustpower Highbank 25 25 ASB ECan Rakaia 1945 2040
Trustpower Montalto 1.8 1.8 ASB ECan Rakaia 1958 2040
TOTAL 65.8
Waitaki Hydro Regional Capacity
Meridian Energy Aviemore 220 55 AVI ECan Waitaki 1968 2025
Meridian Energy Benmore 540 90 BEN ECan Waitaki 1966 2025
Meridian Energy Ohau A 264 66 OHA ECan Waitaki 1979 2025
Meridian Energy Ohau B 212 55.5 OHB ECan Waitaki 1980 2025
Meridian Energy Ohau C 212 55.5 OHC ECan Waitaki 1985 2025
Meridian Energy Waitaki 105 15 WTK ECan Waitaki 1936 2025
Genesis Energy Tekapo A 30 30 TKA ECan Waitaki 1951 2025
Genesis Energy Tekapo B 160 80 TKB ECan Waitaki 1977 2025
TOTAL 1743
Clutha Hydro Regional Capacity
Contact Energy Clyde 432 108 CYD Otago Clutha 1992 2042
Contact Energy Roxburgh 320 40 ROX Otago Clutha 1956 2042
TOTAL 752
Waipori Hydro Regional Capacity
Trustpower Deep Stream 5 2.5 HWB Otago Deep Stream 2008 2038
Trustpower Waipori 1A 10 10 BWK/HWB Otago Waipori 1983 2038
Trustpower Waipori 2A 58 20 BWK/HWB Otago Waipori 1967 2038
Trustpower Waipori 3 7.6 7.6 BWK Otago Waipori 1952 2038
Trustpower Waipori 4 8 8 BWK Otago Waipori 1954 2038
TOTAL 88.6
Paerau Hydro Regional Capacity
Trustpower Paerau 10 5 NSY Otago Taieri 1984 2034
Trustpower Patearoa 2.3 2.3 NSY Otago Taieri 1984 2034
TOTAL 12.3
Fiordland Hydro Regional Capacity
Meridian Energy Manapouri 800 121.5 MAN Environment Southland 1971 2031
TOTAL 800
TOTAL (NZ) 5312
* Notionally embedded (physically connected to Transpower's grid, but treated as embedded)
Page|11Hydro generation stack update for large-scale plant
4.1.1. Consent expiry and reconsenting
The year of consent expiry is listed for each of the grid connected hydro plant in Table 1and shown
graphically, as capacity (MW) in Figure 2. As can be seen, there are a number of prominent years – 2025
(Waitaki River chain), 2031 (Manapouri), 2041 (Waikato River chain) and 2042 (Clutha River i.e. Clyde
and Roxburgh).
2000
1800
1600
1400
1200
MW
1000
800
600
400
200
0
2020
2021
2022
2023
2024
2025
2026
2027
2028
2029
2030
2031
2032
2033
2034
2035
2036
2037
2038
2039
2040
2041
2042
2043
2044
2045
2046
2047
2048
2049
2050
Year
Figure 2 Hydro Capacity Consent Expiry
Discussions with hydro plant owners on the reconsenting implications and likelihood exhibit a common
theme. The general feeling is that obtaining new consents (to take water for the purpose of hydro-
generation) is considered highly likely. This is not surprising given the public good that electricity brings.
However, it is also apparent that there is a general feeling that for some schemes, particularly those that
are in regions where competition for water is high or where streams have been dewatered to a
significant degree through hydropower diversions, there is likely to be some degree of restriction on the
ability to take as much water in the future.
This may not necessarily affect the peak generation (i.e. the MW capacity), but it may reduce the ability
to generate as often through the provision of greater environmental flows in rivers downstream of hydro
dams and/or for the benefit of other users (i.e. for irrigation and recreation). There may also be
restrictions imposed on the ability to change flows rapidly (‘ramping rates’) – and also to provide more
water downstream of hydro power stations for environmental or recreation reasons. This will impact
the flexibility in hydro operation. All of these matters will have an adverse impact on the amount of
electricity generated on an annual basis.
In contrast to this, there is also the argument that the anticipated increase in electricity demand over the
next few decades is a reason that generators could use to support their applications for consent to
retain, or even increase, their access to water.
Thus there are two parts to the reconsenting aspect - it is highly likely new consents to take water for
existing hydro generation will be granted, but there are likely to be varying degrees of impact imposed
by new conditions of consent on the operation of the hydro plant. The magnitude of this impact will
depend on the number and type of stakeholders for a given scheme/region. There may also be
circumstances where more favourable conditions of consent are sought and granted - which would result
in an increase in generation potential for a particular plant. However, in our view, the impact of
reconsenting is likely to cause an overall decrease in the amount of electricity that can be generated.
Page|12Hydro generation stack update for large-scale plant
4.1.2. Operations and maintenance costs
As noted in the PB (2012) report, Operations and Maintenance (O&M) costs are the ongoing costs
associated with the running of generating plant which exclude any capital costs but may include
financing costs.
Typically, O&M costs are split into fixed and variable. Fixed costs, which are not dependent on the
number of hours of operation of the power plant, are typically expressed on a $/MW/year basis and, for
hydro generation plants, typically include:
• Operation supervision and engineering
• Maintenance supervision and engineering
• Surveillance and maintenance of structures
• Maintenance of reservoirs, dams, and waterways
• Maintenance of electric plant
• Maintenance of miscellaneous hydraulic plant
• Insurances and property taxes
• Grid connection charges
Variable O&M costs are those that do depend on the number of hours of operation of the power plant
and are typically expressed on a $/MWh basis. For hydro generation plant, these costs typically include:
• Increased operation supervision and engineering
• Hydraulic expenses
• Electric expenses
• Miscellaneous hydraulic power expenses
• Transmission charges
Information on the fixed and variable costs was requested from the hydro plant owners as part of this
study. Some parties were reluctant to share the information due it being deemed commercially sensitive.
However, the information that was received was useful and has provided data to help inform typical
O&M costs for hydro plant.
In their 2012 report, PB similarly encountered difficulties in obtaining O&M data from hydro plant
owners and so used a study from the United States, which provided typical O&M costs for North
American hydro, to estimate the total (i.e. Fixed plus Variable) O&M costs for New Zealand hydro plant
as being NZ$873/MW/month ($10,476/MW/year). They then used a split of 61%:39% for Fixed:Variable
(which was referenced to a World Bank Group study), and applied this ratio to the above overall figure to
give a fixed cost of NZ$532.50/MW/month (NZ$6,390/MW/year) and a variable cost of
NZ$340.50/MW/month (NZ$4,086/MW/year). The estimated variable O&M cost was then converted to
$0.86/MWh, based on an estimate of the average number of hours of operation per year for the New
Zealand hydro plant fleet.
In a different study, “Financing Renewable Energy in the European Energy Market”, by Ecofys et al (in
January 2011), O&M costs of European hydro plant were reported as being US$45,000/MW/year for
large-scale hydro plant and $52,000/MW/year for small scale hydro plant. Using an exchange rate of
0.77 (USD:NZD), being the average exchange rate for January 2011, and then adjusting for inflation to
today, this gives a present day cost of NZ$65,500/MW/year.
The feedback R40s received from hydro plant owners as part of this study noted that although
technically speaking there is a variable cost associated with O&M of hydro plant, this is so insignificant it
can essentially be considered zero. This is because plant operation is ultimately dependent on water
availability and unless this changed significantly, the O&M costs faced would essentially all be Fixed. The
only exception to this is for the charges associated with the high voltage direct current (HVDC) inter-
island link, which are currently apportioned to South Island generation at approximately $8/MWh and
which should be treated as Variable costs. As such, it does not appear appropriate to split the overall
Page|13Hydro generation stack update for large-scale plant
O&M costs in the manner proposed in the World Bank Group study, and which was adopted by PB in
their 2012 report.
Table 2 compares the costs as reported by PB (2012) and Ecofys et al (2011) with a range for the O&M
costs obtained directly from New Zealand hydro plant owners as part of this study. The figures from the
PB and Ecofys reports have been inflated to 2020 (Q2) figures to enable appropriate comparison. It is
also noted, below the table, what the O&M costs would be if the PB figures were combined and treated
entirely as Fixed.
Table 2 Operations and Maintenance costs
PB (2012) Ecofys et al (2011) R40s – 2020
Inflated to 2020 (Q2) Inflated to 2020 (Q2)
Fixed ($/MW/year) $7,083* $65,500 $30,000 – 65,000
Variable ($/MWh) $0.95 $0 (North Island)
$8 (South Island)
*$11,600 if all costs treated as Fixed
As can be seen in Table 2, even the low end of the R40s range of O&M costs for New Zealand hydro plant
obtained during this study is significantly greater than that proposed by PB in 2012, even after adjusting
for inflation and after combining their Fixed and Variable figures to give a total cost of
$11,600/MW/year. The Ecofys et al (2011) fixed figure of $65,500/MW/year, based on European hydro
plant, is at the upper end of R40s range, which is based on real data obtained from operators of New
Zealand plant.
It is also apparent, in the information received from hydro plant owners as part of this study, that there
is a wide range of O&M costs for hydro plant in New Zealand. In general terms, the larger the hydro
plant (in terms of capacity) the lower the O&M costs will be (on a per MW basis). It is well understood
that small scale hydro have much higher O&M costs (on a per MW and per MWh basis) than large-scale
plant due to the improved ‘economies of scale’ associated with large-scale plant.
In summary, we recommend the following approach be adopted in regard to O&M costs for hydro plant
in New Zealand;
• Fixed: $30,000 - 65,000/MW/year (for plant greater than 30MW)
• Variable: $8/MWh (for South Island plant only) – subject to any changes in the cost allocation for
the HVDC.
The Fixed range could be applied as a sliding scale – lower O&M costs should be applied for very large
plant and higher costs applied to smaller plant. It can also be expected that the O&M costs for hydro
plant below 30MW will be significantly greater that the range described above – figures received suggest
a doubling of this range would not be inappropriate.
4.2. Potential new large-scale hydro plant
As discussed in section 3.2, we have undertaken an assessment of potential new large-scale hydro plant
consisting of two parts. The first is an update of those projects either recently consented, or in the
resource consent process, as described in the PB (2012) report. The second part is a list of those projects
that we believe could be investigated and developed at some future date.
4.2.1. Update on the potential hydro plant being investigated in 2012
Table 3 provides an update on the status of the potential new large-scale hydro plant that were
described in the PB (2012) report.
Page|14Hydro generation stack update for large-scale plant
Table 3 Update of potential new large-scale hydro plant described in PB (2012) report
Plant Rated Substation Technology1 Largest Estimated
capacity generator generation Consented Consent Still being Consentability
(MW) (MW) Owner (GWh/year) (Y/N) Expiry Investigated? (out of 10)
4
Wairau 72 BLN HydRR 12 Trustpower 380 Yes 2021 Yes 10
Lake Pukaki (Gate 18) 35 TWZ HydPK 35 Meridian Energy 120 Yes 2021 Yes 10
North Bank 260 WTK HydPK 130 Meridian Energy Lapsed 2016 No 7
2 3
Rakaia 3 ASB HydRR 0.5 BCI Yes 2044 Operational 10
Arnold Valley 46 DOB HydPK 23 Trustpower Yes 20214 No 10
Mokihinui 100 IGH HydRR 33 Meridian Energy No N/A No 2
Stockton Mine 35 WMG HydRR 17 Hydro Developments Ltd
Repaced by the Ngakawau project described below
Stockton Plateau 50 WMG HydRR 25 Hydro Developments Ltd
Ngakawau 24 WMG HydRR 24 Hydro Developments Ltd 140 Yes 2026 Yes 10
Hawea Gates 17 CML HydPK 9 Contact Energy 70 Lapsed 2017 Not actively 9
Notes:
1
HydRR is run-of-river hydro, and HydPK is peaking hydro.
2
Consent allows for a 16MW development, but only likey to be developed to a maximum of 3MW over the next 10 years (0.5MW developed to date).
3
Barrhill Chertsey Irrigation Ltd - consent previously owned by the Ashburton Community Water Trust.
4
Consent expiry is in reference to the land use consent (for construction). The consent to take water expires in 2046.
As can be seen in Table 3, all of the projects were granted resource consent approval – except Meridian’s
Mokihinui project on the West Coast24. The consents associated with two projects, North Bank and
Hawea Gates, have now lapsed. Meridian Energy have indicated they are no longer investigating the
North Bank project. Contact Energy have indicated they are not actively investigating the Hawea Gates
option, but would not rule it out for potential future consideration. The consents for Wairau and Arnold
Valley (Trustpower) and Lake Pukaki (Meridian) all lapse in 2021. Trustpower have indicated they are no
longer pursuing the Arnold Valley scheme (which is not to be confused with the much smaller and
operational 3MW Arnold River scheme).
The Rakaia scheme is operational - to a degree. The original concept consented by the Ashburton
Community Water Trust was for a total generation of 16MW. The consent (to take water) is now being
utilised by Barrhill Chertsey Irrigation Ltd (BCI) for an irrigation scheme, which has a very modest 0.5 MW
mini hydro generation aspect associated with it. BCI have indicated that the hydro generation may be
increased “over the next decade” but the total generation is unlikely to exceed 3 MW.
The two schemes associated with the Stockton Mine/Plateau (which were granted consent in 2010) have
since been superseded by a single new proposal which is called the Ngakawau scheme and which
successfully obtained a six year extension to the original lapsing date. The new lapsing date (for
construction) is 2026.
4.2.2. Consentability
The consentability rating is simply an assessment made by R40 as to the likelihood of consenting. For
existing consents that have not yet lapsed, a rating of 10 has been given - on the basis that if an
extension to these consents is sought, the likelihood of it being approved is considered very high. For
those projects where consents have lapsed, we have based our judgement on the fact that if consent
was sought again, the rational for the consent has already been debated and accepted, and thus the
likelihood of obtaining consent is reasonably good (noting that the likelihood of consent for North Bank
may not be as straightforward as it is for Hawea). The very low rating for Mokihinui reflects the strong
opposition to the proposal previously, which continued after Meridian withdrew the proposal from the
consenting process, culminating in a large proportion of the Mokihinui River catchment being added to
the Kahurangi National Park in March 201925.
24
The Mokihinui project did receive resource consent approval, but this decision was appealed to the Environment
Court and ultimately Meridian ceased interest in the project before the Environment Court hearing
25
https://www.doc.govt.nz/news/media-releases/2019/mokihinui-river-catchment-land-to-be-added-to-
kahurangi-national-park/
Page|15Hydro generation stack update for large-scale plant
4.3. Other potential large-scale hydro plant
Information on other potential large-scale hydro plant is based on a combination of previous reports -
especially the comprehensive East Harbour Management Service (2004) report – as well as our own
experience of previously investigating such opportunities for the Electricity Corporation of New Zealand
(ECNZ) and others.
For the purposes of this report, we have limited consideration to a minimum size of 50 MW capacity.
There are a number of other possible schemes smaller than this capacity – these will be captured in a
separate study - investigating the potential of new embedded hydro generation projects.
As discussed in section 3.2.2, there are many reasons for excluding consideration of a hydro resource,
but this report has involved only the following filters:
• No rivers within a National Park or Forest Park. However, some rivers with headwaters within
these areas or with reaches that pass through these areas have been considered.
• No rivers covered by a National Water Conservation Order (NWCO) have been included, but
some rivers have parts that are not within the NWCO which may be included
• Some rivers have possible schemes that are mutually exclusive, or if they involve diversion to
another catchment, will impact on any possible scheme on that river. To avoid ‘double-ups’ the
authors have attempted to include the most viable option in these cases which will result in
some rivers being excluded from the list.
• Schemes that involve taking water from a river that is part of an existing assets’ generation flow
have not been considered.
All of the rivers included in this report as having large-scale hydro potential have been the subject of
investigation to some degree in the past, with some having reached resource consent application stage,
and others having actually gained resource consent. Development in these cases has not proceeded for a
number of reasons, ranging from being unable to gain access to critical land, to not achieving a business
case.
Table 4 lists the additional potential plant we believe is worthy of inclusion for potential future
development (in addition to those on Table 3 that are either still being actively investigated or not). As
for those potential projects listed in Table 3, a ‘consentability’ assessment has been made. This is
influenced by the history of the previous investigations (and opposition). It is acknowledged that some
parties may have a different view on the consentability of a particular project.
Given the significant proportion of existing hydro generation in the South Island, we note that any new
hydro generation would be more attractive if it were located in the North Island. However, as can be
seen, the majority of the potential hydro projects are in the South Island, with only Mohaka, Motu and
Whangaehu located in the North Island – and Motu having a very low likelihood of being consented. It is
also acknowledged that the recent decision by Rio Tinto to close the Tiwai Aluminium smelter (effective
August 202126) makes additional new generation (of any type) in the South Island less attractive and as
such, the South Island projects listed in Table 4 would best be considered as long-term prospects to
assist with New Zealand’s objective of being carbon zero by 2050 – or to meet future demand growth
beyond that.
26
At the time of writing, discussions were being had on the possibility of a staged exit over a period of years instead
of a ‘hard exit’ in August 2021.
Page|16Hydro generation stack update for large-scale plant
Table 4 Other potential large-scale hydro plant
Name Rated capacity Substation Technology 1 Largest generator Consentability
(MW) (MW) Location (out of 10)
Clutha A 350 TMH-A HydPK 150 Tuapeka 6
Clutha B 100 ROX HydRR 25 Dumbarton Rock 6
Clutha C 80 HWB HydRR 20 Barnego 6
Clutha D 80 CML HydRR 40 Luggate 6
Clutha E 110 CML HydRR 50 Queensberry 6
Grey River 250 DOB HydPK 125 Stillwater large dam 7
Haast-Landsborough 60 DOB HydRR 30 Landsborough River 2
Hawea River 80 CML HydRR 35 Below Hawea dam 6
Mohaka River 70 RDF HydRR 35 Mohaka River, near Te Hoe 6
Motu River 80 EDG HydRR 40 Lower Motu River 2
Taramakau-Taipo 80 DOB HydRR 40 Diversion to Arnold catchment 6
Waiau River (Canterbury) 65 WPR HydRR 32.5 Mouse Point 5
Waiau River (Southland) A 80 INV HydRR 40 Upper Waiau (between Tekapo and Manapouri) 2
Waiau River (Southland) B 60 INV HydRR 30 Lower Waiau (d/s of Monowai) 4
Waimakariri River 50 HOR HydRR 25 Lower Gorge 5
Waimakariri River B 84 HOR HydRR 42 Waimakariri Gorge 5
Whangaehu River 50 TNG HydRR 25 Various locations 7
Notes
1
HydRR is run-of-river hydro, and HydPK is peaking hydro
4.4. PHES opportunities in New Zealand
There is very little literature on the investigation of potential PHES schemes in New Zealand, with the
exception being in relation to the “Onslow Scheme”. This Central Otago scheme has been the focus of a
number of research papers, newspaper articles, and even a PhD thesis. Section 4.4.1 summarises the
key features of the Onslow Scheme, while Section 4.4.2 summarises information on other schemes.
4.4.1. Lake Onslow PHES scheme
The most discussed PHES scheme in NZ is the Lake Onslow scheme located in Central Otago. This
scheme was first described by University of Waikato Associate Professor Earl Bardsley in 200527, and was
specifically proposed as a means of mitigating New Zealand’s ‘dry year’ risk. A number of variations in
size have been considered for this scheme – with the largest being the Onslow-Manorburn – which, with
a storage of 12,000 GWh28, would be extremely large even by international standards. The Onslow-
Manorburn scheme would have almost three times the storage of all of NZ’s existing hydro storage
(~4,500 GWh)29. It involves damming the Teviot River and increasing the storage potential of the existing
Lake Onslow (including flooding the Manorburn depression). Natural inflows would be augmented by
pumping water from the nearby Clutha River (at Lake Roxburgh) up a 24km tunnel, climbing over 600m
in vertical elevation in the process (see Figure 3). Generation capacity would be up to 1,300 MW.
The Onslow scheme has also been the subject of a PhD thesis undertaken by Mohammed Majeed
(supervised by Bardsley), submitted in 201930. Majeed’s thesis modelled simulations using flow records
for the Clutha and Waitaki rivers to assess the performance of a PHES at Lake Onslow having an
operating range of 720 – 780 metres above sea level (masl) and a capacity of 4,000 – 11,000 GWh.
Figure 3 shows a schematic diagram of the scheme as modelled by Majeed (and which was adapted for
the Otago Daily Times newspaper on 19 September 2019).
27
Bardsley, W.E. 2005.
28
Storage capacity ranges between 5,000 – 12,000 GWh depending on design. The maximum storage of 12,000
GWh would include flooding the Manorburn depression.
29
https://www.transpower.co.nz/system-operator/security-supply/hydro-information
30
Majeed, M.K. (2019).
Page|17Hydro generation stack update for large-scale plant
Figure 3. Lake Onslow PHES (Image reproduced from Otago Daily Times, 19 September 2019)
The results of Majeed’s analysis and modelling supported the work previously undertaken by Bardsley
and made the following key observations in regard to the benefits the scheme would bring;
• More efficient operation of all South Island hydro power stations with less spill.
• ‘Dry year’ risk cover
• Reduced need for sending power from the North to South Island during times of low South Island
hydro inflows, reducing carbon dioxide emissions from North Island fossil fuel thermal stations.
• The new (up to) 1,300 MW capacity could be used for frequency keeping and also buffer the
short-time variability of wind power, enabling wind power expansion without risking grid
instability. The additional installed capacity could also provide peaking capacity generally,
including offsetting plant outages.
• There will be some degree of flood peak reduction in the lower Waitaki River, as a consequence
of reduced spill magnitudes from lakes Tekapo and Pukaki. At the same time, more stable lake
levels should result in reduced lake shore erosion.
• The large increment of energy storage capacity may have the effect of stabilising electricity price
fluctuations in the wholesale market, reducing the need to take out hedging contracts.
Majeed’s thesis also considered the merits of pumped storage between Lakes Hawea and Wanaka – a
scheme originally identified by Bardsley31 - albeit to a much lesser analytical extent than that undertaken
for the Onslow Scheme (it was an Appendix to his research and was provided “for completeness”). This
is addressed in the Section 4.3.2.
A recent commentary (9 March 2020) 32 on the Onslow scheme was written by Bardsley in response to
the following question posed in MBIE’s discussion document on “Accelerating renewable energy and
energy efficiency” - “What is the best way to meet resource adequacy needs as we transition away from
fossil-fuelled electricity generation and towards a system dominated by renewables?”. In the
commentary, Bardsley describes the merits of the Onslow scheme, this version having a storage capacity
of 5,000 GWh (to match that assessed and described in the ICCC 2019 report) and an installed capacity of
31
https://www.waikato.ac.nz/news-opinion/media/2012/the-possibility-of-a-power-station-between-lakes-
wanaka-and-hawea
32
https://medium.com/land-buildings-identity-and-values/pumped-hydro-update-ec4538cbdb87
Page|18You can also read