The Role of Agriculture in Ensuring Food Security in Developing Countries: Considerations in the Context of the Problem of Sustainable Food ...
←
→
Page content transcription
If your browser does not render page correctly, please read the page content below
sustainability

Article
The Role of Agriculture in Ensuring Food Security in
Developing Countries: Considerations in the Context
of the Problem of Sustainable Food Production
Karolina Pawlak *          and Małgorzata Kołodziejczak
 Department of Economics and Economic Policy in Agribusiness, Faculty of Economics and Social Sciences,
 Poznan University of Life Sciences, Wojska Polskiego 28, 60-637 Poznan, Poland;
 malgorzata.kolodziejczak@up.poznan.pl
 * Correspondence: karolina.pawlak@up.poznan.pl

 Received: 30 May 2020; Accepted: 5 July 2020; Published: 7 July 2020

 Abstract: Ensuring food security has become an issue of key importance to countries with different
 degrees of economic development, while the agricultural sector plays a strategic role in improving
 food availability. The aim of this paper is to identify relationships between the undernourishment
 scale and selected characteristics describing the agricultural sector within identified clusters of
 developing countries. Typological groups of countries were separated using Ward’s method. It results
 from the analyses that the greatest problems with maintaining food security are observed in the
 developing countries with a high share of agriculture in their Gross Domestic Product (GDP),
 adverse conditions hindering agricultural production and deficient infrastructure. Based on research
 results desirable and tailored strategies for food security improvement in individual clusters were
 developed. Promoting investments in agricultural infrastructure and extension services along with
 adopting measures aimed at increasing the households’ purchasing power, especially those in rural
 areas, appear to be key drivers for improving both food availability and food access. The paper
 focuses not only on identifying the reasons of undernourishment, but also contributes to recognition
 of the most effective ways to solve the hunger problem under a country’s unique conditions. It offers
 a comprehensive perspective for the policy formulation in various areas world-wide, which may be
 of interest to scholars and policy makers.

 Keywords: food security; arable land; capital stock; food production; population growth; agri-food
 trade; developing countries

1. Introduction
     Despite various measures taken to alleviate the world hunger problem, food insecurity and
undernutrition remain serious problems in many countries [1]. Although achieving food security
is desirable irrespective of the political system and socioeconomic conditions [2], it is an extremely
high priority in the developing regions of the world, where population growth coupled with the
increased intensity of such environmental events as floods, droughts, extreme variability in temperature
or rainfall often pose a threat to food security [3]. Furthermore, due to greater food demand and
reduced crop productivity, higher food prices along with income inequalities may negatively affect
food access and availability for poor households. It should be noted here that poverty, war and
conflict, natural disasters and climate change, as well as population growth are considered to be the
main causes of hunger and malnutrition [4–7]. According to the most recent Food and Agriculture
Organization of the United Nations (FAO) data, around 13% of the population living in developing
countries are suffering from undernourishment [8], while Porkka et al. [9] indicated that feeding the

Sustainability 2020, 12, 5488; doi:10.3390/su12135488                     www.mdpi.com/journal/sustainability
Sustainability 2020, 12, 5488 2 of 20
world’s population is a challenge that is likely to become even more serious in the future. The global
population exceeded 7.6 billion people in 2018 [10] and is predicted to reach 9.2 billion by 2050 [11],
with a projected increased food demand of 59%–102% [12,13]. In view of the above it seems necessary
to increase agricultural production by about 60%–70% to provide food for the global population in
2050 [11]. According to Foley et al. [14] and Tilman et al. [15], food production needs to as much as
double by 2050 to meet the increasing demand.
The agricultural sector plays a strategic role in improving the availability of food and achieving
food security [16–19]. However, while there is general agreement on the increased global demand
for food to be expected in the coming decades, there is uncertainty surrounding global agriculture’s
capacity to service this demand through an expansion in the food supply [20]. Better food provision
ensured by increasing the productivity of agriculture and expanding the range of agricultural land
use seems to be a possible method to eradicate hunger [21,22]. However, in the case of low-income
developing countries the existing technology and knowledge will not enable them to produce all
the food needed in 2020 and beyond [23]. It shows the need to expand investments in agricultural
research and extension systems both in and for developing countries to increase the productivity of
agricultural production per unit of land and per agricultural worker. For Sub-Saharan Africa, it was
discussed by Otsuka [17]. Based on these studies [17,23], it can be clearly implied that it is necessary to
focus on investments that will push African agriculture toward higher productivity without severe
environmental degradation. Technology transfer from developed to developing countries should
be facilitated to support these processes, to eliminate technology gaps and to overcome knowledge
barriers [15].
Bearing in mind that agriculture has a much greater impact on reducing poverty and improving
food security than the other sectors of the economy [24,25], and considering differences in the potential
for agricultural production across countries, the aim of this paper is to identify relationships between
the undernourishment scale and selected characteristics describing the agricultural sector within
identified clusters of developing countries.
Attempts have already been made to recognize groups of countries categorized according to
measures of food security. It is shown that different research issues resulting in different sets of measures
used in the classification can lead to different typologies and hence different conclusions. For example,
Diaz-Bonilla et al. [26] and Diaz-Bonilla and Thomas [27] focused mainly on food availability issues,
utilizing consumption, production and trade measures. They stressed that trade policies influence world
food availability, as well as food production and food imports at the national level. The indicators used
in the study include those describing food availability, access and utilization, i.e., food production per
capita, the ratio of total exports to food imports, calorie intake per capita, protein intake per capita and
non-agricultural population, while the authors address the key question: what types of countries can
use trade and what types of countries can use domestic production to secure food supply? They identify
groups of countries with similarities in their food security profiles covering the results of agricultural
activity and consumption levels rather than agricultural-based reasons for food insecurity. A similar
result-oriented approach was also employed by Baer-Nawrocka and Sadowski [28], who identified
the current status of food security in different countries around the world considering jointly both
the physical and economic availability of food. Reasons for food insecurity related to the agricultural
sector were more specifically considered by Yu et al. [29] or Yu and You [30]. Referring to the study by
Diaz-Bonilla et al. [26], apart from variables representing food consumption, production, trade and
distribution they included in their factor analysis also the agricultural potential. This dimension of
food security was represented by three specific variables, including the length of the growing period,
variation in the length of the growing period and soil quality. It may be noticed here that a limitation
of those studies stems from the fact that the agricultural potential covers only one production factor,
i.e., natural resources. Neither agricultural labor nor capital were taken into account, which makes the
analyses less comprehensive. A more specific approach was adopted by Zhang et al. [31], who provided
a typology of African countries based on 56 variables in the following data sets: development outcome,Sustainability 2020, 12, 5488 3 of 20
geography, macroeconomic environment, level of security, governance, natural disasters, social and
physical infrastructure, agricultural potential, cultural homogeneity, human disease and other factors.
In terms of the agricultural potential, they considered not only land and water related variables,
but also the share of arable area under irrigation, while the degree of food insecurity was represented
by the percentage of children under five years old, who are undernourished. The prevalence of
undernourishment among the adult population was not investigated. More food security indicators
and more determinants of food and nutrition security were incorporated by Pieters et al. [32]. However,
the agricultural potential and performance are restricted to the length of the growing period, soil quality,
precipitation, value added per worker in agriculture, import share of agriculture and food production
per capita. Despite the limitations of the above-mentioned studies, some valuable conclusions can
be drawn. The results suggest that developing countries are extremely heterogeneous in terms of
different aspects of food security, hence different policy interventions are needed by different types of
food-insecure countries to improve their nutrition status. Our study attempts to meet this challenge.
The paper focuses on the spatial diversity of undernourishment in the most affected developing
countries. We identify groups of countries with similarities in their food security profiles based
on the prevalence of undernourishment as a measure of food insecurity and select characteristics
describing the agricultural sector that refer to the role of agriculture and the agri-food trade in
the national economy or are responsible for the production potential. In this way we examine the
linkage between food security, agricultural performance and the potential represented by all basic
production factors (land, labor and capital). However, our intention is to contribute not only to the
discussion on the reasons for undernourishment, but also to the recognition and better understanding
of the most effective ways to solve the hunger problem under a country’s unique conditions. Hence,
based on research results some desirable and tailored strategies for food security improvement in
individual clusters are recommended, while the paper offers a comprehensive perspective for the
policy formulation world-wide, which may be of interest to scholars and policy makers. Bearing in
mind the most common causes of undernourishment, the potential for food production in countries
suffering from undernourishment, as well as the depletion of natural resources and the need to
ensure sustainable development, this paper attempts to open a new perspective on opportunities to
improve the nutrition situation in the world, while it also provides directions for relevant international
policies. What was also noted, was the importance of stimulating socio-economic development
processes to overcome barriers that prevent the eradication of hunger (or at least the alleviation of
undernourishment). Provided considerations are embedded in a research framework based on the
controversies surrounding the Malthusian theory and its implications for the world hunger problem.
2. Selected Aspects of the World Hunger Problem: Around the Malthusian Theory and a
Challenge to Feed the World Sustainably
In his classification of needs by urgency and intensity, Maslow [33] stated that the need to
alleviate hunger and thirst is among the basic needs and is essential for human life. In An Essay on the
Principle of Population, As It Affects the Future Improvement of Society, published in 1798, Malthus claimed
that the population size grows geometrically, beyond control, while the production of food grows
only arithmetically [34]. According to Malthus, if the population grows while the supply of natural
resources (especially land) remains constant, productivity in agriculture tends to decline. This results in
a situation in which agricultural production is unable to keep up with the growing population, while the
reduction in supply is followed by famine. Though fitting the realities of the industrial revolution,
the Malthusian theory was quickly met with strong criticism. The primary failure of the Malthusian
approach was to miss technological progress enabling food production growth without the need to
acquire new land resources. This issue was addressed by Boserup, who found that food production,
thanks to innovations and technological progress, was growing faster than the population size (this
pattern is referred to as the Boserupian model), thus preventing the Malthusian catastrophe [35].Sustainability 2020, 12, 5488 4 of 20
The Malthusian population theory, formulated at the end of the 18th century, has been
demonstrated to be largely wrong (see [36,37]; etc.) Furthermore, from the 18th century onwards,
food supply has almost always increased faster than the population growth [38]. Nevertheless,
the undernourished population is still more than 800 million [39]. Therefore, a question arises
concerning the underlying causes. According to Poleman [40], food production has been growing
much faster than the world’s population, but only in developed countries. This was not the case
in developing countries. While the food production volume has also increased in these countries,
the growth rate was close to the population growth in most cases. Moreover, it has fluctuated
increasingly. Poleman [40] sees the main causes of undernourishment in insufficient incomes.
Numerous studies assessing the relationship between income and food consumption reveal the
existence of a positive relationship [41–43]. Increasing the households’ purchasing power in poorly
developed countries as a way to eliminate poverty and improve food security was emphasized by
several researchers, including Sen [44]. Engel’s law laid the foundations for this discussion when
establishing that households’ demand for food increases less than proportionally in relation to the
increase in income. Therefore, income distribution changes are of key importance when predicting food
demand growth. Faster income growth among poorer countries and households should be followed by
a more rapid growth in food demand in the short and medium term, due to the fact that as the income
of poorer households grows, larger shares of their budget are available for food consumption [41].
Published in 2010, the sixth report on the world nutrition situation by the United Nations System
Standing Committee on Nutrition (UNSCN) points to the key role of agriculture in ensuring food and
nutrition security [45]. Since the worldwide food production capacity is no longer the main limitation,
the problem of exhausting resources and sustainable food production appears. Some scientists observed
that intensive and industrialized food production practices, which have been developed to satisfy
the global food demand [46], have been increasingly damaging the environment [47] and may bring
ecological catastrophe on a local or even global scale. Rockström et al. [48] noted the existence of
some bio-physical thresholds in the global ecosystem which, when exceeded, may have disastrous
consequences for humankind. Due to environmental pollution and the reduced ecological stability
of the biosphere, hundreds of millions of people living in extreme poverty will not have a realistic
chance of alleviating hunger and addressing other vital needs. According to Geist and Lambin [49]
and Foley et al. [14,50], agriculture is the largest contributor to tropical deforestation and is responsible
for up to 35% of global greenhouse gas emissions, with demonstrated negative impacts on air and
water quality, biodiversity, carbon sequestration and infectious disease transmission. On the other
hand, it is shown that a more productive and resource-efficient agriculture can increase the availability
of food and contribute to world food security, while at the same time preserving natural resources
and biodiversity [51–57]. McDonald [58] also followed this finding and stressed that it is a universal
observation, especially in developing and the least developed countries, indicating that hunger is
widespread with many food production systems being unsustainable. There are several indications
that a new orientation for agricultural development must be sought [59–63]. The new trajectory of
agricultural development should take into account the postulates of sustainable development in all
countries, with special regard afforded to the developing ones. Obviously, some transitional stages,
such as replacing human labor with mechanical power (mechanization of agriculture), cannot be
completely omitted. However, it should be noted that at such an early stage of development of
agricultural production (e.g. in some African countries), some environmental restrictions may emerge.
Otherwise, in the future these countries would incur significant costs of today’s production growth,
especially when it comes to areas threatened by soil degradation and water scarcity.
When observing a progressive deterioration in the global nutrition situation, a challenge to feed
the growing world’s population becomes more and more important, while the role of efficient and
sustainable agriculture in this process seems to be a priority (for more see e.g. [64]). Therefore, in this
study selected characteristics of the agricultural sector in developing countries were analyzed as
determinants of their food security status.Sustainability 2020, 12, 5488 5 of 20
3. Materials and Methods
The study is based on data from the Statistics Division of the Food and Agriculture Organization
of the United Nations (FAO) [65]. The analysis covered 100 developing countries most affected by
undernourishment, for which the most recent and comprehensive FAO data from 2016–2018 were
available. The comparative analysis method was employed to perform the research. Typological groups
of countries were separated based on within-group variability using Ward’s agglomerative hierarchical
clustering method. According to Wysocki [66], Ward’s linkage method is by around 40% more effective
than the next best hierarchical method, i.e., the furthest neighbor method. Ward’s method allows for
the merging of objects into subsequent clusters based on the value of the similarity function. This leads
to the minimization of the sum of squared deviations of any two clusters that may be created at each
stage, as per the following formula:
X → → 2 X → → 2 X → → 2 nA nB → → 2
∆ ( A, B ) = || x i − mA∪B || − | x i − mA | − | x i − mB | = |mA − mB | (1)
nA + nB
i∈A∪B i∈A i∈B
→
where: m j is the center of cluster j, nj is the number of points in it and ∆ is called the merging cost of
combining clusters A and B [67]. For a broader description of the clustering procedure with the use of
the presented formula, see Ward [68].
The greater the similarity between the points, the sooner they will be merged with one another [69].
Clusters are arranged hierarchically so that the clusters of a lower rank are a part of clusters of a higher
rank, in accordance with the hierarchy of similarity between the points [70]. Importantly, unlike the
clustering methods proposed earlier by Cox [71] and Fisher [72], Ward’s method takes into account
the similarity with regard to multiple variables (instead of a single variable). The Euclidean distance,
which is one of the most common distances used in respect to objects with measurable features [73],
was used for clustering purposes. Following the standardization of variables, bearing in mind that
the clustering process is primarily determined by mutually uncorrelated features [74], the calculated
that indicators were assessed in terms of correlation coefficients. A correlation matrix was created and
indicators with a strong or nearly functional correlation (correlation coefficient higher than 0.75) were
excluded from the analysis [75]. Values of calculated Pearson’s linear correlation coefficients between
all the characteristics were at most 0.52.
Based on substantive criteria and following the literature review [31,32,76–83], a set of indicators
describing the agricultural sector, while also considered as causes of food insecurity, was selected
for the study. All those indicators either refer to the role of agriculture and agri-food trade in the
national economy (share of agriculture in GDP, share of agricultural population in the total population,
agri-food trade balance per capita) or are responsible for the production potential (arable land per
capita, percentage of arable land equipped for irrigation, number of tractors per 1000 ha of arable
land, value of net capital stock per 1 ha of arable land). Bearing in mind the Malthusian theory [34],
a gap between the food production growth rate and the population growth rate was also included
into the analysis. The prevalence of undernourishment as a measure of hunger and severity of food
insecurity [84] was taken into account in the classification process as well. Selection of the indicators
for the study was limited by formal criteria. The above-mentioned indicators were those, for which
comprehensive and internationally comparable data were available. Due to excessive correlation,
two characteristics were removed from further analysis. These were the share of agricultural population
in the total population and the number of tractors per 1000 ha of arable land. In the next step, a series
of attempts was made to check the robustness of the results to the inclusion or exclusion of various
indicators. Finally, the typology of countries was developed based on the following characteristics:
• prevalence of undernourishment (%);
• arable land area per capita (ha);
• share of agriculture in GDP (%);Sustainability 2020, 12, 5488 6 of 20
• percentage of arable land equipped for irrigation (%);
• agri-food trade balance per capita (USD);
• value of net capital stock per 1 ha of arable land (USD)—net capital stock represents the sum of
the written-down values of all the fixed assets still in use, which can also be calculated as the
difference between gross capital stock and consumption of fixed capital [85];
• the gap between the food production growth rate and the population growth rate (percentage
points)—the indicator refers to the difference between the food production growth rate and the
population growth rate. To obtain the food production growth rate, the aggregate volume of
agricultural production in the years 2015–2017 was divided by the aggregate for the base period
2004–2006 (a 3-year average was used in order to eliminate the impact of random factors such as
climatic conditions; in line with the FAO approach [86] the aggregate volume was compiled by
multiplying gross production in physical terms by output farm gate prices for a given year and
country). The population growth rate was calculated by dividing the average population in the
periods 2016–2018 and 2004–2006.
It should be noted here that the set of indicators suggested in the research is a simple, but relatively
rarely made attempt to integrate five main approaches to the analysis of food security [76]. In line with
the oldest and the most influential food availability approach, which is also known as the Malthusian
approach, the balance or imbalance between population and food production growth is included
into the analysis. The income-based approach brings into the analysis such variables related to
economic growth as Gross Domestic Product (GDP) and income. The basic needs approach refers to
the availability approach and the ability to adequately satisfy food consumption needs for a healthy life
at all times. That is why the linkage is considered between the prevalence of undernourishment as a
measure of food insecurity and both agricultural potential and performance. The entitlement approach
developed by Sen [87] is represented by indicators related to agricultural farms’ endowments and
foreign trade entitlement. The analysis and results discussion is also compatible with the Sustainable
Livelihoods (SL) approach.
A hierarchical procedure was employed to group the countries. The agglomerative technique
characterized by the development of a tree-like structure was used. It means that at the beginning
of the clustering process each country covered by the analysis is a singleton. Countries which
are most similar to each other in terms of designated characteristics are progressively grouped
into new, increasingly larger clusters. The ultimate goal is to obtain a single cluster covering all
analyzed countries [75]. The number of clusters was based on the requirement that the number of
separated subsets cannot be excessively high and the subsets themselves need to be properly separated
and internally consistent [88]. The characteristic features of each cluster, i.e., the key reasons for
undernourishment in countries belonging to a specific cluster, were separated with the use of the
measure of differences between the mean values of continuous metric features [66]:
xck − xk
zck(d) = (c = 1, . . . , C; k = 1 . . . , K) (2)
sk ( w )
In the formula above, xck is the mean value of feature k in cluster c; xk is the general average
value of feature k in a population of n objects; sk(w) is the average within-cluster variability of feature k,
calculated as follows:
C
12
1 X
sk(w) = (Nc − 1)·s2ck (3)
N−C
c=1
with meaning the within-cluster variance in cluster c (c = 1, . . . , C) calculated for feature k. It was
s2ck
assumed that if zck(d) ∈ (−2; 2), there is an average intensity of feature k in cluster c; the feature does
E
not stand out and is not characteristic. If zck(d) ∈ (−3; −2 or zck(d) ∈ 2; 3), there is, respectively, a low
or high intensity of feature k in cluster c; the feature stands out (positively or negatively) and is aSustainability 2020, 12, 5488 7 of 20
E
characteristic feature. In turn, if zck(d) ∈ (−∞; −3 or zck(d) ∈ 3; ∞), there is, respectively, a very low or
very high intensity of feature k in cluster c; the feature stands out (positively or negatively) and is a
highly characteristic feature [66].
4. Results and Discussion
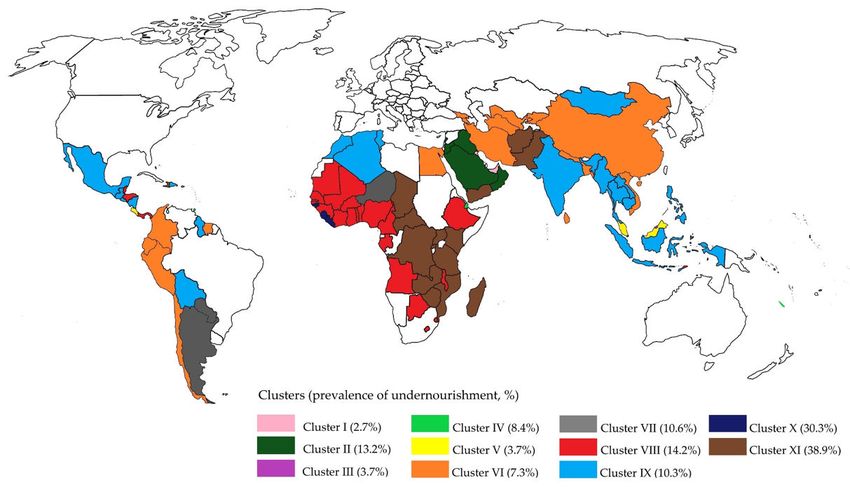
Ward’s method allowed us to separate eleven internally homogeneous clusters of developing
countries differing in terms of their population nutrition levels (Figure 1). The mean values of
characteristics in specific clusters are shown in Table 1. The measure of differences between mean
values, used to identify the characteristic features of specific clusters, is shown in Table 2. Table 3
presents the characteristics of identified clusters of the analyzed countries, while in Table 4 the
recommendations on strategies for food security improvement in the identified clusters are included.Sustainability 2020, 12, 5488 8 of 20
Figure 1. Typology of selected developing countries according to the undernourishment scale and selected characteristics describing the agricultural sector. Source:
the authors’ calculations based on [10,39,85,86,89–91].Sustainability 2020, 12, 5488 9 of 20
Table 1. Within-cluster mean values of the undernourishment scale and selected characteristics describing the agricultural sector in the set of developing countries.
Cluster
Feature Average
I II III IV V VI VII VIII IX X XI
Prevalence of undernourishment (%) 2.7 13.2 3.7 8.4 3.7 7.3 10.6 14.2 10.3 30.3 38.9 13.0
Arable land per capita (ha) 0.003 0.057 0.010 0.024 0.038 0.103 0.792 0.183 0.182 0.155 0.178 0.157
Share of agriculture in GDP (%) 0.6 3.0 1.9 1.6 6.1 11.6 18.2 15.7 11.7 63.2 21.7 14.1
Percentage of arable land equipped for
100.0 76.3 30.0 53.6 47.4 79.6 3.2 4.9 22.8 3.6 14.7 39.6
irrigation (%)
Agri-food trade balance per capita (USD) −1159.3 −371.3 −1092.9 −747.3 399.0 −19.2 431.8 −55.7 −15.3 −5.8 −24.5 −241.9
Value of net capital stock per 1 ha of
76,530.4 8480.2 60,019.0 11,771.3 56,726.0 5352.2 859.9 1772.6 4472.7 794.3 3146.3 20,902.3
arable land (USD)
Gap between the food production
growth rate and the population growth −158.2 −121.3 −20.6 −56.6 −49.6 −39.2 −50.2 −73.4 −36.5 −67.2 −75.4 −68.0
rate (percentage points)
Source: the authors’ calculations based on [10,39,85,86,89–91].
Table 2. Values of measure of differences between means of characteristics describing the agricultural sector and the undernourishment scale in the set of selected
developing countries and clusters (Ward’s method).
Cluster
Feature
I II III IV V VI VII VIII IX X XI
Prevalence of undernourishment (%) −2.30 0.04 −2.08 −1.03 −2.09 −1.27 −0.54 0.25 −0.60 3.84 5.77
Arable land per capita (ha) −2.88 −1.87 −2.75 −2.48 −2.22 −1.02 11.90 0.49 0.47 −0.03 0.39
Share of agriculture in GDP (%) −2.93 −2.41 −2.65 −2.71 −1.75 −0.56 0.89 0.34 −0.52 10.64 1.65
Percentage of arable land equipped for irrigation (%) 4.96 3.01 −0.79 1.15 0.63 3.29 −3.00 −2.86 −1.38 −2.96 −2.05
Agri-food trade balance per capita (USD) −7.88 −1.11 −7.31 −4.34 5.51 1.91 5.79 1.60 1.95 2.03 1.87
Value of net capital stock per 1 ha of arable land (USD) 9.73 −2.17 6.84 −1.60 6.27 −2.72 −3.51 −3.35 −2.87 −3.52 −3.11
Gap between the food production growth rate and the
−8.05 −4.76 4.23 1.02 1.64 2.58 1.59 −0.48 2.81 0.07 −0.66
population growth rate (percentage points)
Note: grey cells refer to the features that stand out (positively or negatively) and are characteristic to cluster c; white cells refer to the features that do not stand out and are not characteristic
to cluster c. Source: the authors’ calculations based on Table 1.Sustainability 2020, 12, 5488 10 of 20
Table 3. Description of clusters of developing countries according to the undernourishment scale and selected characteristics describing the agricultural sector.
Cluster
Feature
I II III IV V VI VII VIII IX X XI
Number of countries 2 5 2 5 2 18 3 25 20 3 15
Prevalence of undernourishment (%) - - ++ ++
Arable land per capita (ha) - - - - ++
Share of agriculture in GDP (%) - - - - ++
Percentage of arable land equipped for irrigation (%) ++ ++ ++ -- - - -
Agri-food trade balance per capita (USD) -- -- -- ++ ++ +
Value of net capital stock per 1 ha of arable land (USD) ++ - ++ ++ - -- -- - -- --
Gap between the food production growth rate and the
-- -- ++ + +
population growth rate (percentage points)
Note: grey cells refer to the features that stand out (positively or negatively) and are characteristic to cluster c; empty cells refer to the features that are not characteristic to cluster c; ++ refer
to very high intensity of feature k in cluster c; + refers to high intensity of feature k in cluster c; - refers to low intensity of feature k in cluster c; - - refer to very low intensity of feature k in
cluster c. Source: the authors’ elaboration based on Figure 1 and Table 2.Sustainability 2020, 12, 5488 11 of 20
Table 4. Recommendations on strategies for food security improvement in identified clusters.
Improvement Strategies
Cluster Countries
1 2 3 4 5 6 7 8 9 10 11
I United Arab Emirates, Kuwait X X X X X
II Oman, Saudi Arabia, Lebanon, Jordan, Iraq X X X X X
III French Polynesia, Brunei Darussalam X X X X X
IV New Caledonia, Trinidad and Tobago, Mauritius, Djibouti, Barbados X X X X X
V Malaysia, Costa Rica X X X X
Turkmenistan, Kyrgyzstan, Iran, Suriname, Georgia, Sao Tome and
VI Principe, Egypt, Ecuador, Chile, Uzbekistan, Nepal, Colombia, X X X X X
Sri Lanka, China, Peru, Vietnam, Bangladesh, Armenia
VII Niger, Paraguay, Argentina X X X
Mauritania, Gambia, Nigeria, Malawi, Ethiopia, Mali, Togo,
Burkina Faso, Senegal, Guinea, Cameroon, Benin, Ghana, Fiji, Belize,
VIII X X X
Gabon, Lesotho, Panama, Cabo Verde, Honduras, Eswatini,
Cote d’Ivoire, Botswana, Timor-Leste, Angola
Lao People’s Democratic Republic, Myanmar, Cambodia, Guyana,
Thailand, Nicaragua, Bolivia, Indonesia, India, Philippines, Guatemala,
IX X X X X
Jamaica, Dominican Republic, Mongolia, El Salvador, Dominica,
Mexico, Tunisia, Morocco, Algeria
X Liberia, Sierra Leone, Guinea-Bissau X X X
Haiti, Zimbabwe, Zambia, Congo, Central African Republic, Uganda,
XI Madagascar, United Republic of Tanzania, Mozambique, Rwanda, X X X X
Kenya, Chad, Yemen, Pakistan, Afghanistan
Strategies: 1—trade policy aimed at enhancing trade openness; 2—boosting food production through innovative technologies; 3—maximizing agricultural land use; 4—adaptation and
adoption of farming techniques; 5—investment in agricultural infrastructure; 6—improvement in irrigation infrastructure; 7—investment in agricultural research to improve crop yields;
8—offering services for agriculture; 9—improvement in extension services and training programs for farmers; 10—technical and administrative support for farmers; 11—policies aimed at
increasing the households’ purchasing power. Source: the authors’ elaboration, [92–103].Sustainability 2020, 12, 5488 12 of 20
Cluster I—countries with the lowest prevalence of undernourishment in the investigated
population of countries—was composed of the United Arab Emirates and Kuwait. Compared to the
other countries they were distinguished by the lowest share of agriculture in GDP and a very low
food production growth rate, which failed to offset the population growth. The volume of agricultural
production obtained from the very small area of land suitable for cultivation, despite being fully
equipped with irrigation infrastructure and a very high value of net capital stock, was insufficient in
relation to existing needs. A significant role in the reduction of undernourishment in those countries
was played by food imports. Deficit in the agri-food trade per capita was the highest in that group
and amounted to almost USD 1160, i.e., it was almost five-fold higher than the mean for the whole
investigated population of countries. The positive and statistically significant effect of trade openness on
the level of food security was shown, e.g., by Brooks and Matthews [81] and Dithmer and Abdulai [104].
In relation to the importance of agri-food trade to ensure food security it may also be stated that over 34
countries worldwide (77%) suffer from calorie deficit [105], while almost 14 of global food production is
subject to international trade. Fader et al. [106] indicated that 16% of the global population consume
food provided by international exchange, with the greatest dependency on imports found in countries
of North Africa, the Andean countries and the Arab countries.
A more serious problem with ensuring food security than that in cluster I was recorded in the
second cluster. It comprises oil exporters, with a marginal role of agriculture in their GDP; countries,
in which on average every eighth inhabitant faced undernourishment. At very low, although to a
considerable extent irrigated, arable land resources and a relatively low net capital stock per 1 ha arable
land, the nutrition status in that cluster was also determined by the potential to obtained imported
food products. A considerable role of trade to modify the nutrition status of the local population was
also observed in clusters III and IV. They comprised countries which financed imports of food products
to eliminate the deficits mainly through exploitation and the processing of crude oil and natural gas
(Brunei Darussalam, Trinidad and Tobago), tourism (French Polynesia, New Caledonia, Mauritius,
Barbados) or transport services and transit fees (Djibuti). Based on the above results, it may be stated
that a crucial role in ensuring food security in countries covered by clusters I-IV is played by trade
policies aimed at enhancing trade openness (Table 4). In the Arab countries (clusters I and II) they
should have been supplemented by the adoption of innovative technologies to boost food production,
delivering services for agriculture, as well as technical, administrative and training support for farmers.
In countries classified in clusters III and IV, apart for the liberal trade policy, a milestone to improve
the food security status might be to maximize agricultural land use and to develop both farming
technologies and investments in agricultural infrastructure.
An approximately 3.5-fold lower prevalence of undernourishment than the average in the
developing countries, at a simultaneously high surplus in agri-food trade per capita, was recorded in
cluster V. In Malesia and Costa Rica, apart from tourism, an important branch of the national economy
is agriculture. Malesia is one of the main world exporters of palm oil, while Costa Rica specializes
in the export of pineapples, bananas, coffee and sugar [91]. In these countries, technology transfer
and productivity enhancement through implementation of high-yielding varieties and increasing the
cropping intensity seem to be important in improving food availability (Table 4). The adaptation and
delivery of efficient services, as well as the promotion of training and extension services, might also be
desirable to increase agricultural productivity and consequently reduce the undernourishment scale.
Cluster VI comprises 18 countries, in which the prevalence of undernourishment was
approximately 2-fold lower than the average in the developing countries (7.3% vs 13.0%). A factor
supporting fight against hunger, at a relatively low arable land area per capita, was connected with the
scale of irrigation in arable land. It may be observed that the lack of agricultural land and insufficient
water resources are the most frequently mentioned causes for a lack of food security indicated in
literature on the subject [83], while Gohar, Amer and Ward [82] considered relationships between
water availability and irrigation infrastructure and food security. Attaining food security in the
cluster including some of the most populous countries in the world (China, Egypt, Bangladesh andSustainability 2020, 12, 5488 13 of 20
Vietnam), was in turn hindered by the relatively low net capital stock per 1 ha arable land. As a
consequence, the food production growth rate was lower than the population growth rate. A lack
of capital stock and investments may be considered as the factor that hampered reaching a higher
agricultural performance. It can be noted here that the importance of irrigation infrastructure and
the availability of technical production assets to food security in developing countries was indicated
by Dec et al. [107]. The impact of new techniques and technologies on farm productivity was also
discussed by Schultz [108], Hayami [109], Hayami and Ruttan [110], as well as Stellmacher and
Kelboro [111]. In view of the above, all the possible strategies related to the investment in infrastructure
and agricultural research, as well as the improvement in extension services and training programs for
farmers, seem to be highly recommended to boost agricultural production, while domestic production
might be supported by food imports under preferential trade agreements (Table 4). Considering income
inequalities in the countries included in this cluster the government policies aimed at increasing
the households’ purchasing power would also be of key importance to address the food security
challenge efficiently.
Cluster VII included three countries obtaining a considerable surplus in agri-food trade per capita,
in which the highest resources of arable land per capita in the analyzed population of the developing
countries compensated for capital and infrastructure deficits, which manifested, e.g., in the very low
percentage of arable land equipped for irrigation. The very low value of net capital stock per 1 ha
arable land and a lack of irrigation infrastructure also constituted a barrier to the growth of productivity
in agriculture in countries of Africa, Asia and Latin America, classified to clusters VIII and IX.
A very high (over 30%) prevalence of undernourishment was recorded in the countries comprising
cluster X. The observed very high share of the agricultural sector in GDP may be considered as
equivalent to the very low level of income for the population working in agriculture, which on the
one hand indicates a lack of resources for investment in farms, while on the other hand—a lack of
purchasing power of consumers. The strictly agricultural character of the national economies in those
countries compounded problems with providing adequate nutrition to the population. The very low
level of capital resources, including a lack of irrigation systems, influenced the level and growth rate
in agricultural production, which was insufficient in relation to the population needs, resulting in
necessary food imports and a deficit in agri-food trade. It should be stressed here that policy actions
aimed at enhancing agricultural productivity, including the development of relevant infrastructure,
will not solve the hunger problem without eliminating poverty and increasing the consumers’ economic
access to food. It strongly refers to the agricultural countries gathered in cluster X, but it is also true for
clusters VII-IX and XI (Table 4).
The highest prevalence of undernourishment in the analyzed population of countries was found
in cluster XI. It consisted of 15 countries (eleven African countries, three countries from Asia and
Haiti), in which, similarly as in clusters VIII and IX, despite the relatively large arable land area per
capita, the lack of capital and infrastructure led to food shortages suffered by almost 40% of their
inhabitants. Results obtained in the present study confirmed that investment is one of the key drivers
for the improvement of efficiency in agriculture and food production. These findings have policy
implications for strengthening food security through an increase in efficiency. It has already been
emphasized by Ogundari [112], who suggested the need for programs and policies that will boost
agricultural efficiency levels through the improvement of extension services, as well as the introduction
of robust training programs for farmers on the usage of modern technologies, etc. This issue has also
been discussed by Prus [113–115].
5. Conclusions
The world experiences highly uneven patterns of socio-economic development, which on one
hand are manifested in large surpluses and, on the other, by permanent food shortages contributing
to hunger and undernourishment. Maintaining food security is a problem that most severely affects
developing countries with low per capita GDP levels, which usually also suffer from unfavorableSustainability 2020, 12, 5488 14 of 20
agricultural conditions and infrastructure deficiencies. Based on the cluster analysis, two main reasons
for food insecurity may be identified. In some regions, the reason is the physical and/or economic
unavailability of food (clusters composed of Sub-Saharan Africa and South-Eastern Asia). Other ones,
in turn, experience social inequalities in nutrition (countries affected by this problem include oil
producers with various economic development levels, located in different continents, such as Iraq,
Angola, Nigeria or Ecuador).
It results from these analyses that problems with maintaining food security are found with
the greatest intensity in developing countries with a high share of agriculture in their GDP,
adverse conditions hindering agricultural production and deficient infrastructure. However, a small
arable area per capita does not necessarily mean high rates of undernourishment. This is because the
limited resources of agricultural land may be compensated for by increased productivity and imported
food to cover the deficiency. Therefore, somewhat in spite of the Malthusian theory, the irrigation of
arable land, the agricultural trade balance and the deployment of technical production assets proves to
be more important in determining the nutrition situation than arable area per capita. Increasing the
agricultural productivity through the adaptation and adoption of farming technologies, as well as the
improvement in extension services and training programs for farmers and implementing an open
trade policy which, while not detrimental to the interests of domestic producers and consumers,
allows countries to raise funds for financing the import of food that compensates for the short domestic
supply. These are the measures that could result in solving the nutrition problem in oil- or natural
gas-producing countries and small island tourist economies (clusters I-IV). Promoting environmentally
friendly technologies, expanding investments in agricultural research and extension systems and
enhancing farmers’ education accompanied by technology transfer from developed countries should
be seen as crucial components of policies implemented to improve food security in countries facing the
challenge of agricultural productivity enhancement, including the most populous ones in the world
(clusters V-VI). Investments in agricultural infrastructure along with eliminating income inequalities
by adopting measures aimed at increasing the households’ purchasing power, especially those in rural
areas, are key drivers for improving food access in countries all over the world, with special regard to
Africa, Asia and Latin America (clusters VI-XI).
Note that poorly developed countries may lack incentives that trigger growth and agricultural
performance, both on the supply and the demand side. With this in mind, and considering Nurkse’s
model of the vicious circle of poverty [116] and the scarcity of capital, it should be emphasized
that alleviating the global hunger problem requires the involvement of the international community,
which should provide development assistance oriented at the reasons (rather than just on the effects)
for food insecurity. Food aid that supports the development of production and enhancing market
infrastructure can play a positive role in enhancing food security. However, food aid is not the only,
or in many cases the most efficient, means of addressing food insecurity. In this context, it becomes
necessary for developing countries to establish and implement socio-economic growth strategies
focused on ensuring conditions for development resulting in increasing the efficiency of national
economies, as well as improving the quality of human life. It is necessary to take into account the
environmental, social and economic specificity of each country, as well as its political and institutional
conditions. Only sustainable development and, subsequently, economic growth is the way to ensure
food security at regional, national and individual household levels.
This paper addressed three issues: the linkage between food security, agricultural potential and
agricultural performance, spatial diversity of agriculture-oriented reasons for undernourishment,
as well as the recognition and better understanding of the most effective interventions to solve
the hunger problem under a country’s unique conditions. In this way it was possible to offer a
comprehensive perspective for the policy formulation world-wide, which may be of interest to scholars
and policy makers. However, the study has its limitations. The primary aim of the typology was to
investigate spatial diversity in food security and its sectoral causes. Hence, the study is primarily a
static one and generally it does not take into account the variation of these variables over time andSustainability 2020, 12, 5488 15 of 20
the source of this variation. It may be important to include indicators of time trends to gain insight
into changes in the food security status and evaluate the effectiveness of interventions implemented.
Examining the impacts of macroeconomic, institutional and external shocks over time would require
additional research. These shocks that affect agricultural activity and disrupt agricultural production
include, e.g., price fluctuations, trade policies, political instability, weather conditions, natural disasters
and epidemic threats. Variables responsible for the population’s purchasing power and shaping the
economic access to food should also be considered. Including into the analysis both macro- and
mesoeconomic determinants would have offered many more comprehensive foundations to establish
multidimensional growth strategies aimed at improving food security. It can also be mentioned that
this paper, similarly to the majority of existing studies, is related to food availability and food access
rather than the health and nutrition dimension of food security. In the further step of the research,
it may be valuable to incorporate into the grouping some criteria related to consumption patterns and
food utilization.
Author Contributions: Conceptualization, K.P. and M.K.; methodology, K.P.; formal analysis, K.P. and M.K.;
investigation, K.P. and M.K.; resources, K.P. and M.K.; writing—original draft preparation, K.P. and M.K.;
writing—review and editing, K.P.; visualization, M.K.; supervision, K.P.; project administration, K.P.; funding
acquisition, K.P. and M.K. All authors have read and agreed to the published version of the manuscript.
Funding: This research was funded by the Faculty of Economics and Social Sciences, Poznań University of
Life Sciences.
Conflicts of Interest: The authors declare no conflict of interest.
References
1. Sibhatu, K.T.; Qaim, M. Rural food security, subsistence agriculture, and seasonality. PLoS ONE 2017,
12, e0186406. [CrossRef] [PubMed]
2. Jerzak, M.A.; Śmiglak-Krajewska, M. Globalization of the Market for Vegetable Protein Feed and Its Impact
on Sustainable Agricultural Development and Food Security in EU Countries Illustrated by the Example of
Poland. Sustainability 2020, 12, 888. [CrossRef]
3. Ahmed, U.I.; Ying, L.; Bashir, M.K.; Abid, M.; Zulfigar, F. Status and determinants of small farming
households’ food security and role of market access in enhancing food security in rural Pakistan. PLoS ONE
2017, 12, e0185466. [CrossRef] [PubMed]
4. Prosekov, A.Y.; Ivanova, S.A. Food security: The challenge of the present. Geoforum 2018, 91, 73–77. [CrossRef]
5. The Top 10 Causes of World Hunger. 27 May 2019. Available online: https://www.concernusa.org/story/top-
causes-world-hunger/ (accessed on 20 June 2020).
6. Causes and Effects of Food Insecurity Environmental Sciences Essay. 5 December 2016.
Available online: https://www.ukessays.com/essays/environmental-sciences/causes-and-effects-of-food-
insecurity-environmental-sciences-essay.php (accessed on 20 June 2020).
7. Smith, L.C.; El Obeid, A.E.; Jensen, H.H. The Geography and Causes of Food Insecurity in Developing
Countries. Agric. Econ. 2000, 22, 199–215. [CrossRef]
8. Our World in Data. Available online: https://ourworldindata.org/hunger-and-undernourishment#what-
share-of-people-are-undernourished (accessed on 22 May 2020).
9. Porkka, M.; Kummu, M.; Siebert, S.; Varis, O. From Food Insufficiency towards Trade Dependency:
A Historical Analysis of Global Food Availability. PLoS ONE 2013, 8, e82714. [CrossRef] [PubMed]
10. Food and Agriculture Organization of the United Nations Statistical Database. Annual Population.
Available online: http://www.fao.org/faostat/en/#data/OA (accessed on 22 May 2020).
11. Silva, G. Feeding the World in 2050 and Beyond–Part 1: Productivity Challenges. Michigan State University
Extension–3 December 2018. Available online: https://www.canr.msu.edu/news/feeding-the-world-in-2050-
and-beyond-part-1 (accessed on 20 June 2020).
12. Elferink, M.; Schierhorn, F. Global Demand for Food Is Rising. Can We Meet It? Harvard Business
Review-7 April 2016. Available online: https://hbr.org/2016/04/global-demand-for-food-is-rising-can-we-
meet-it (accessed on 20 June 2020).Sustainability 2020, 12, 5488 16 of 20
13. Fukase, E.; Martin, W.J. Economic Growth, Convergence, and World Food Demand and Supply; Policy Research
Working Paper 8257; World Bank Group, Development Research Group Agriculture and Rural Development
Team: Washington, DC, USA, 2017.
14. Foley, J.A.; Ramankutty, N.; Brauman, K.A.; Cassidy, E.S.; Gerber, J.S.; Johnston, M.; Mueller, N.D.;
O’Connell, C.; Ray, D.K.; West, P.C.; et al. Solutions for a Cultivated Planet. Nature 2011, 478, 337–342.
[CrossRef]
15. Tilman, D.; Balzer, C.; Hill, J.; Befort, B.L. Global food demand and the sustainable intensification of
agriculture. Proc. Natl. Acad. Sci. USA 2011, 108, 20260–20264. [CrossRef]
16. Smutka, L.; Steininger, M.; Miffek, O. World agricultural production and consumption. Agris on-line Papers
Econ. Inform. 2009, 1, 3–12.
17. Otsuka, K. Food insecurity, income inequality, and the changing comparative advantage in world agriculture.
Agric. Econ. 2013, 44, 7–18. [CrossRef]
18. Smutka, L.; Steininger, M.; Maitah, M.; Škubna, O. The Czech Agrarian Foreign Trade—Ten Years after the
EU Accession. In Agrarian Perspectives XXIV: Proceedings of the 24th International Scientific Conference,
Czech University of Life Sciences Prague, Faculty of Economics and Management, Prague, Czech Republic,
16–18 September 2015; Smutka, L., Řezbová, H., Eds.; CAB Direct: Glasgow, UK, 2015; pp. 385–392.
19. Wegren, S.K.; Elvestad, C. Russia’s food self-sufficiency and food security: An assessment. Post Communist
Econ. 2018, 30, 565–587. [CrossRef]
20. Cook, D.C.; Fraser, R.W.; Paini, D.R.; Warden, A.C.; Lonsdale, W.M.; De Barro, P.J. Biosecurity and Yield
Improvement Technologies Are Strategic Complements in the Fight against Food Insecurity. PLoS ONE 2011,
6, e26084. [CrossRef] [PubMed]
21. Stocking, M.A. Tropical Soils and Food Security: The Next 50 Years. Science 2003, 302, 1356–1359. [CrossRef]
[PubMed]
22. Smyth, S.J.; Phillips, P.W.B.; Kerr, W.A. Food security and the evaluation of risk. Glob. Food Secur. 2015, 4,
16–23. [CrossRef]
23. Pinstrup-Andersen, P.; Pandya-Lorch, R. Food security and sustainable use of natural resources: A 2020 Vision.
Ecol. Econ. 1998, 26, 1–10. [CrossRef]
24. Irz, X.; Lin, L.; Thirtle, C.; Wiggins, S. Agricultural Productivity Growth and Poverty Alleviation. Dev.
Policy Rev. 2001, 19, 449–466. [CrossRef]
25. Majid, N. Reaching Millennium Goals: How Well Does Agricultural Productivity Growth Reduce Poverty?
Employment Strategy Paper No. 12; International Labour Organization: Geneva, Switzerland, 2004.
26. Diaz-Bonilla, E.; Thomas, M.; Robinson, S.; Cattaneo, A. Food Security and Trade Negotiations in the World Trade
Organization: A Cluster Analysis of Country Groups; TMD Discussion Paper No. 59; Trade and Macroeconomic
Division, International Food Policy Research Institute: Washington, DC, USA, 2000.
27. Diaz-Bonilla, E.; Thomas, M. Why Some Are More Equal Than Others? Country Typologies of Food Security;
Background Paper Prepared for The State of Agricultural Commodity Markets 2015-16; FAO: Rome, Italy, 2015.
28. Baer-Nawrocka, A.; Sadowski, A. Food Security and Food Self-Sufficiency Around the World: A Typology of
Countries. PLoS ONE 2019, 14, e0213448. [CrossRef]
29. Yu, B.; You, L.; Fan, S. Toward a Typology of Food Security in Developing Countries. In IFPRI Discussion
Paper 00945. Development Strategy and Governance Division; International Food Policy Research Institute:
Washington, DC, USA, 2010.
30. Yu, B.; You, L. A Typology of Food Security in Developing Countries. China Agric. Econ. Rev. 2013, 5, 118–153.
[CrossRef]
31. Zhang, X.; Johnson, M.; Resnick, D.; Robinson, S. Cross-Country Typologies and Development Strategies
to End Hunger in Africa. In DSGD Discussion Paper No. 8. Development Strategy and Governance Division;
International Food Policy Research Institute: Washington, DC, USA, 2004.
32. Pieters, H.; Gerber, N.; Mekonnen, D. Country Typology on The Basis of FNS. In A Typology of Countries
Based on FNS Outcomes and Their Agricultural, Economic, Political, Innovation and Infrastructure National Profiles;
FOODSECURE Technical Paper No. 2; LEI Wageningen UR: Wageningen, The Netherlands, 2014.
33. Maslow, A. Motivation and Personality, 3rd ed.; Addison-Wesley: New York, NY, USA, 1954.
34. Malthus, T.R. An Essay on the Principle of Population, as It Affects the Future Improvement of Society; Printed for J.
Johnson: London, UK, 1798.
35. Boserup, E. Population and Technology; Basil Blackwell: Oxford, UK, 1981.You can also read