Thünen Working Paper 150 - Economic and Environmental Consequences of the ECJ Genome Editing Judgement in Agriculture
←
→
Page content transcription
If your browser does not render page correctly, please read the page content below
Economic and Environmental Consequences of the
ECJ Genome Editing Judgement in Agriculture

Alexander Gocht, Nicola Consmüller, Ferike Thom, Harald Grethe

Thünen Working Paper 150
Dr. Alexander Gocht
Thünen Institute for Farm Economics
Johann Heinrich von Thünen Institute
Bundesforschungsinstitut für Ländliche Räume, Wald und Fischerei
Bundesallee 63
D-38116 Braunschweig

Dr. Nicola Consmüller
Federal Office for Consumer Protection and Food Safety (BVL)
Mauerstr. 39 - 42
D-10117 Berlin

Prof. Dr. Harald Grethe and Ferike Thom
Humboldt-Universität zu Berlin
Lebenswissenschaftliche Fakultät
Albrecht Daniel Thaer-Institut für Agrar- und Gartenbauwissenschaften
International Agricultural Trade and Development
Unter den Linden 6
D-10099 Berlin

Thünen Working Paper 150

Braunschweig/Germany, Juli 2020
Abstract                                                                                          I

Abstract
Genome edited crops are on the verge of being placed on the market and their agricultural and
food products will thus be internationally traded soon. National regulation, however, diverges
regarding the classification of genome edited crops. Major countries such as the US and Brazil do
not specifically regulate genome edited crops, while in the European Union they fall under GMO
legislation, according to the European Court of Justice (ECJ). As it is in some cases impossible to
analytically distinguish products from genome edited plants compared to non-genome edited
plants, EU importers may fear the risk of violating EU legislation. They may choose to not import
anymore agricultural and food products based on crops, for which genome edited varieties are
available. As a consequence, crop products, for which the EU is currently a net importer, would
become more expensive in the EU and production would intensify. Furthermore, strong substitu-
tion among products covered and not covered by genome editing would occur in consumption,
production and trade. We analyse the effects of such a cease of EU imports for cereals and soy on
the EU agricultural sector with the comparative static agricultural sector equilibrium model CA-
PRI. Our results indicate that effects on agricultural and food prices as well as farm income are
strong, and the intensification of EU agriculture may result in negative net environmental effects
in the EU as well as increases in global greenhouse gas emissions. This suggests that the trade
effects should be taken into account when developing domestic regulation for genome edited
crops.

Zahlreiche genom-editierte Kulturpflanzen stehen kurz vor ihrer Marktreife und werden daher
bald ihren Weg in den internationalen Agrarhandel finden. Gegenwärtig gibt es jedoch große Un-
terschiede in der rechtlichen Einstufung dieser Produkte. Während beispielsweise in den USA und
Brasilien genom-editierte Pflanzen keiner speziellen Regulierung unterliegen, werden sie in der
EU nach dem EuGH-Urteil als gentechnisch veränderte Organismen angesehen und fallen daher
unter die GVO-Regulierung. Da eine entsprechende analytische Unterscheidung von genom-
editierten und konventionell gezüchteten Pflanzen unter Umständen nicht möglich ist, laufen
Importeure Gefahr, nicht zugelassene Produkte in die EU einzuführen. Dies könnte dazu führen,
dass die Einfuhr von bestimmten landwirtschaftlichen Produkten aus Ländern zum Erliegen
kommt, in denen genom-editierte Pflanzen angebaut werden. Dies hätte einen Preisanstieg für
diejenigen Produkte, für welche die EU Nettoimporteur ist, zur Folge. Auch würde der Anbau in
der EU selbst intensiviert werden. Zudem käme es bei Produktion, Verbrauch und Handel zu Sub-
stitutionseffekten zwischen genom-editierten und konventionell gezüchteten Produkten. Mittels
des komparativ-statischen Gleichgewichtsmodells CAPRI analysieren wir die Auswirkungen eins
derartigen Aussetzens der EU-Agrarimporte auf den europäischen Agrarsektor am Beispiel von
Soja und Getreide. Unsere Ergebnisse zeigen starke Auswirkungen auf die Preise für landwirt-
schaftliche Produkte und Lebensmittel sowie auf das Betriebseinkommen. Die Intensivierung der
europäischen Agrarproduktion kann darüber hinaus zu negativen Umwelteffekten führen und
einem globalen Anstieg der Treibhausgasemissionen. Dies legt den Schluss nahe, dass auch Han-
delseffekte bei der Ausgestaltung nationaler Regelungen im Umgang mit genom-editierten Pflan-
zen Berücksichtigung finden sollten.
II                                                                                Keywords

JEL: F13, C6, C63, F47
Keywords: genome editing, CRISPR/Cas, asynchrony regulatory, trade distortion, economic
modelling, partial equilibrium model CAPRI, agricultural economic and environmental impact
assessment
Schlüsselwörter: Genom-Editierung, CRISPR/Cas, Asynchrone Regulierung, Handelsverzerrung,
ökonomische Modellierung, partielles Gleichgewichtsmodell CAPRI, agrarökonomische und
ökologische Folgenabschätzung
Content                                                 III

Content

Abstract                                                 I

List of figures                                         V

List of tables                                          V

1   Introduction                                        1

2   The Economic Impact Model                           5

3   Scenarios                                           7

4   Results and Discussion                              9
    4.1     Economic Analysis                           9
    4.2     Land Use Change and Environmental Effects   15

5   Conclusions                                         21

Annex                                                   29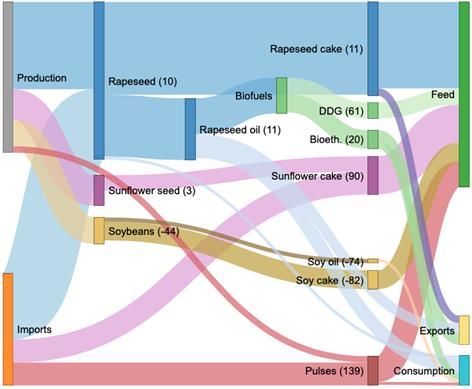
Lists                                                                                          V

List of figures
Figure 4.1:       Elements of the market balance for cereals, sugar and meat markets
                  for the EU in the baseline and a cease of import scenario in tonnes         10
Figure 4.2:       Elements of the market balance for oil and cake markets for the EU in
                  the baseline and a cease of import scenario in tonnes                       11
Figure 4.3:       Price developments in different geographical regions                        14
Figure 4.4:       Global land use change in 1,000 ha                                          16
Figure 4.5:       Land use change by cropping type in percentage change to the baseline       17
Figure 4.6:       Changes in nitrate application and surplus, absolute changes in kg per ha   18
Figure 4.7:       Greenhouse gas emissions in millions of tonnes of CO2-equivalents           19

List of tables
Table 4.1:        Absolute and percentage changes in elements of the market balance
                  for the EU to the baseline for cereals, sugar and meat markets              10
Table 4.2:        Absolute and percentage changes in elements of the market balance
                  for the EU to the baseline for oil and cake markets                         12
Table 4.3:        Fodder ratio changes due to the cease of imports compared to the
                  baseline                                                                    13
Table 4.4:        Absolute and percentage changes of increased EU imports by origins          15
Table 4.5:        Sources and remains of nitrate used in the EU agriculture                   18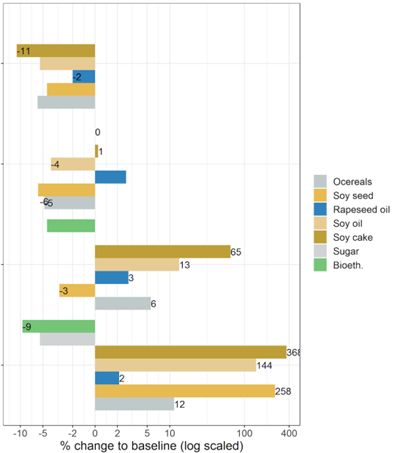
Chapter 1      Introduction                                                                                             1

1 Introduction

New plant breeding techniques have been developed recently allowing for the targeted modifica-
tion of DNA sequences in a site directed manner. These techniques can be subsumed under the
term genome editing and comprise a set of different molecular approaches (Modrzejewski et al.
2018)1. Among them, CRISPR/Cas9 is the most discussed genome editing system and has received
significant attention (Friedrichs et al., 2019a). Compared to conventional breeding methods as
well as other genome editing approaches, CRIPR/Cas holds the advantage of being low in cost
and easy to apply (Friedrichs et al., 2019b). According to Ricroch (2019), genome editing can help
to achieve several breeding goals. First, genome editing can reduce the time needed to breed a
new crop variety from now 7 to 25 years to 2 to 3 years. Thus, resistance to pests, diseases and
chemical weed control can be achieved faster. Another target is plant resistance to abiotic stress,
such as drought, cold, salinity, and water and nitrogen deficiencies. As a consequence, genome
editing has the potential to support decreasing food waste and enhancing nutritional traits. Most
applications of genome editing entering the market in the near future selectively mutate or modi-
fy one or more base pairs without adding foreign DNA to the genome (SDN-1) (Lusser and Davies,
2013). SDN-1-induced spontaneous repair of DNA can lead to mutations causing gene silencing,
gene knockout or changes in gene activity (Friedrichs et al. 2019b). Market-oriented research has
taken place in 99 different applications with 28 different plant species. Most applications have
been carried out in rice2, followed by tomato, maize, potato, wheat, soybean and rapeseed (Mo-
drzejewski et al. 2019). The table in the annex gives an overview of the relevant crops close to
being placed on the market and their characteristics (Kohl et al., 2018; Modrzejewski et al., 2019).
As indicated, most of the traits are SDN-1 based.

For some time, it had been unclear, how genome edited crops would be regulated in the EU. On
July 25th, 2018, the ECJ concluded that “organisms obtained by mutagenesis are GMO” (ECJ,
2018) and thus fall within the scope of Directive 2001/18/EC, including all legal obligations which
arise from this directive. Unlike in most other countries with strict regulations, SDN-1 thus falls
within the scope of the GMO regulatory framework. Food and feed that either consist of, contain
or have been produced from GMOs must seek approval for placement on the market in the EU
according to Regulation (EC) No. 1829/2003. A detailed description of the approval procedure
can be found in Hartung and Schiemann (2014). According to Article 5 (3, i) of Regulation
1829/2003, “methods for detection, sampling […] and identification of the transformation event
and, where applicable, for the detection and identification of the transformation event in the
food and/or in foods produced from it, must also be provided with the application”. The same
requirements apply to feed according to Article 17 (3i). Grohmann et al. (2019) point out that
there has to be a distinction between the detection of a specific sequence alteration in the ge-

1
    Side directed nucleases (SDN), including Meganucleases (MN), Zinc-Finger Nucleases (ZFN), Transcription Activator-like
    Effector Nucleases (TALENs) and Clustered Regularly Interspaced Short Palindromic Repeats/ CRISPR associated protein
    (CRISPR/ Cas), including SDN-1, SDN-2 and SDN-3; 2: Oligonucleotide-directed mutagenesis (ODM); 3: base editing (BE).
2
    Rice is an important crop but also a model plant.
2 Chapter 1 Introduction nome, and the identification of its origin, i.e., it must be clear whether it originates from sponta- neous (naturally occurring), untargeted (induced by irradiation or mutagenic chemicals) or tar- geted mutagenesis (genome editing). While the detection of a certain sequence mediated by ge- nome editing might be possible if the specific sequence is known, the identification of its origin might be impossible if no further information is given. Especially for commodities that normally consist of a mixture of different varieties and origins and processed food or feed, identification of origin poses a significant challenge. Regulation (EC) No. 1830/2003 demands traceability and la- belling of genetically modified food and feed. Traceability should facilitate both the withdrawal of products with unforeseen adverse effects on human and animal health and the environment and enable environmental monitoring. In addition, it is essential to ensure accurate labelling and con- sumers’ freedom of choice. All products consisting of or containing GMOs must be labelled ac- cordingly. Admixtures of approved GMOs must also be labelled if these traces are adventitious or technically unavoidable and exceed the threshold of 0.9%. Other countries hold different views on the regulation of genome edited products. For some, the definition of a LMO (“living modified organism”) from the Cartagena Protocol on Biosafety (Art. 3, g) draws the line between GMO and non-GMO. Since SDN-1 does not introduce new genetic ma- terial into the existing genome, organisms produced by SDN-1 are not considered to fall under the definition of the protocol and thus are commonly regarded as similar to those organisms produced by conventional breeding techniques (Tsuda et al., 2019). Countries such as Argentina, Australia, Brazil, the USA and Japan have already excluded SDN 1-produced organisms from GMO regulation (Eckerstorfer, 2019; Tsuda et al., 2019, Bömeke et al., 2018). Legislative alignment would also help trade partners in international commodity trade (Braidotti, 2019). With the launch of genome edited varieties, farmers will adopt and spread this technology, particularly in non-regulated markets. This increases the probability of unapproved GMOs entering European markets. According to the zero-tolerance policy in the EU, these products must be withdrawn from the market (Roiz, 2014). Given the experience in the past with rejected shipments of GMOs, we can presume that traders will stop shipping products into the EU for which they cannot be sure that genome editing was not used in breeding. The international agricultural bulk commodi- ty trade is dominated by four companies: Archer Daniel Midland (ADM), Bunge, Cargill, and Louis Dreyfus, accounting for about 73% of the global grain trade in 2003 (Murphy et al., 2012). In the past, trade disruptions due to regulatory asynchronicity have been reported in the case of GMOs. Kalaitzandonakes et al. (2014) define regulatory asynchronicity when a traded GMO is approved in one country but not in another country. In the case of policies of zero tolerance an importing country will reject shipments. According to Phillipson and Smyth (2016), the Syngenta-developed maize variety Agrisure VipteraTM (MIR162) was approved in the US in 2010 and commercially planted in 2011. Canada, Japan, Australia, Brazil, Mexico, New Zealand, South Korea, Russia and Taiwan approved imports of this maize. China planned to approve it but did not before 2014. Due to the presence of the MIR162 trait in US shipments, China started to reject maize imports due to its zero-tolerance policy. As a result, US exports to China dropped by 85%. In the context of this disruption in international trade, several lawsuits have been documented. Due to the lack of ap- proval for MIR162 in China and the country’s zero tolerance policy for unapproved GMOs, the
Chapter 1   Introduction                                                                           3

trading company Bunge refused any MIR162 maize at their facilities until approval would be giv-
en. In August 2011, the breeding company, Syngenta, sued Bunge for damage due to profit losses
and harm of reputation. Shortly before the approval was given in 2014, Syngenta and Bunge
agreed to dismiss the litigation without paying any fees or costs to each other (Polansek, 2017).
In 2014, Cargill filed a lawsuit against Syngenta for having marketed GM maize in the US, which
was not yet approved for market sale in China. Shipments from Cargill were stopped at the Chi-
nese border. A total of 1.4 Mio tonnes of maize were affected and damage costs amounted up to
$90 Mio (Pearson, 2014). Again, in 2014, the major US exporter of livestock feed products, Trans
Coastal Supply, sued Syngenta for its loss of more than $41 Mio because of the lack of approval
of MIR162 in China (Polansek, 2014; NZZ, 2014). In 2015, Syngenta sued Cargill and ADM over
losses that US farmers were said to have suffered from rejections of boatloads of MIR162 to Chi-
na (Reuters, 2015). This long-lasting dispute over MIR162 shows that regulatory asynchronicity
can pose a severe hurdle to international trade and may cause considerable economic damage to
breeders, farmers and traders along the value chain. An economic assessment of the MIR162
case carried out by the US-American National Grain and Feed Association (NGFA) found economic
losses from $1 billion up to $2.6 billion for the US value chain (Fisher, 2014). We argue that this
problem is aggravated by the introduction of genome edited crops. International trade will then
not only be confronted with the already existing regulatory asynchronicity but also with regulato-
ry divergence due to different legal interpretations of the GMO definition.

For the specific case of non-detection and non-identification of origin, genome edited crops can
be classified as credence goods (Consmüller et al., 2019) and might thus require a functioning
identity preservation system (Eriksson et al., 2019) to enable international commodity trade. For
instance, identity preserved production and marketing (IPMM) is frequently applied in the grain
and oilseed industry in order to facilitate the production and delivery of a certain quality along
the entire value chain (Smyth and Phillips, 2002). This concept could be transferred to the com-
modity trade of genome edited crops. However, as Maaß et al. (2019) have already pointed out,
identity preservation causes additional costs which can only be recovered through higher market
prices for specific value-added products. In general commodity trade, where different batches
from different sources are usually mixed along the production chain, this concept is deemed un-
likely to work economically.

With special focus to international trade, Eckerstorfer et al. (2019) discuss the option to establish
an international public registry in order to accommodate divergent national policies on genome
edited crops. This database should cover all biotech products which are placed on the market,
including those applications which are not exempted from regulation in some but not in all coun-
tries. Every country would thus be enabled to spot respective products, if prescribed by national
legislation. However, it is not clear how countries should be encouraged to voluntarily give in-
formation on products, which are not regulated within their national boundaries. Beyond that,
even if a database could tackle the challenge of detection, identification issues might remain un-
solved.
4                                                                                          Chapter 1      Introduction

Given this background, the aim of this article is to analyse the economic and environmental con-
sequences of a cease of imports into the EU for agricultural products, where genome edited vari-
eties are close to market introduction. Based on the current research of Kohl et al., 2018 and
Modrzejewski et al., 2019 (Table 5 Annex), an import cease might become relevant soon for soy
products and cereals3 , including maize. In 2017, the EU imported 85% to 95% of its domestic use
of soy products4, 23% of cereals (FAOSTAT, 2019), either for feed use or for human consumption.
That would have strong market effects. In particular, the large share of soy imports for pig and
poultry fattening and, to a lesser extent, for other animals will result in strong substitution pro-
cesses in feed component demand. We simulate the effects of such a cease of imports with the
comparative static agricultural sector equilibrium model CAPRI, which explicitly accounts for feed
input and output relations but also the interaction of biofuels with feed stock markets, substitu-
tion in human demand and bilateral trade flows. In Section 2, we first introduce the economic
model used to analyse the economic consequences, and Section 3 discusses the implementation
of the scenario. In Section 4, we present and discuss economic and environmental results and the
article concludes with Section 5.

3
    Cereals is the aggregate group encompassing soft wheat, durum wheat, rye and meslin, barley, oats, maize and other
    cereals.
4
    Depending on how the different products are weighted against each other.
Chapter 2 The Economic Impact Model 5 2 The Economic Impact Model We apply a comparative static partial equilibrium model for the agricultural sector, CAPRI, devel- oped for performing policy and market impact assessments from global to regional level. The core of the model is based on the linkage of a European-focused supply module and a global par- tial equilibrium market module (Britz and Witzke, 2012). The supply module covers a detailed representation of production activities for the EU, Norway, the Western Balkans and Turkey. This module represents all agricultural production activities, related output generation, and input use at the regional level (NUTS2). Each model optimizes the aggregated farm income under re- strictions that are related to land balances, including a land supply curve, nutrient balances and nutrient requirements of animals, and, if applicable, quotas and set-aside obligations. The deci- sion variables include crop acreages, total land use, herd sizes, fertilizer application rates and feed mixes. The mathematical programming model defines how many kg of certain feed catego- ries (cereals, rich protein, rich energy, feed based on dairy products, other feed) or single feed stuffs (fodder maize, grass, fodder from arable land, straw, milk for feeding) are used per animal depending on its prices. The model accounts hereby for the nutrient requirements of animals, based on requirement functions from the literature. Total feed use might be produced regionally (grass, fodder root crops, silage maize, other fodder from arable land) or bought from the market at fixed prices. These prices, however, change with each iteration of the market module. The al- location response depends primarily on nonlinear terms in the objective function that are either econometrically estimated (Jansson and Heckelei, 2011) or derived from exogenous supply elas- ticities. The model includes a behavioural market representation for biofuels and biofuel feed stocks (Becker et al., 2013). Biofuel markets (ethanol and biodiesel) are endogenous. Biofuel sup- ply and feedstock demand react to biofuel and feedstock prices, and at the same time, biofuel demand and bilateral trade flows react flexibly to biofuel and fossil fuel prices. The biofuel mod- ule extends the core CAPRI system (particularly its capability to analyses market effects at a very detailed spatial and agricultural product level) with a detailed representation of global biofuel markets, covering 1st and 2nd generation production technologies, biofuel by-products, bilateral biofuel trade and a link to global fuel markets, which are important in this study as biofuel feed- stock is impacted strongly by a cease of imports of soy and cereals. The global partial equilibrium market module is a spatial, non-stochastic, global multi-commodity model for approximately 50 primary and processed agricultural products, and it covers approximately 80 countries or country blocks. It is defined by a system of behavioural equations that represent agricultural supply, hu- man and feed consumption, multilateral trade relations, feed energy and land as inputs, along with the processing industry, all of which are divided into commodity and geographical units. On the demand side, the Armington approach (Armington, 1969) assumes that products are differen- tiated by origin, thereby allowing simulation of bilateral trade flows and related bilateral and multilateral trade instruments, including tariff-rate quotas. This submodule delivers the output prices used in the supply module, allows for market analyses at the global, EU and national scales, and includes a welfare analysis for the agricultural sector. The supply curve of the market model representing the EU is adjusted, during each iteration, to the aggregated supply of the NUTS2 regional programming models. This is repeated until an equilibrium is found.
Chapter 3 Scenarios 7
3 Scenarios
We develop two scenarios for the year 2030: A baseline, and a cease of imports for all countries
outside the EU. The baseline may be interpreted as a projection in time covering the most likely
future development of the agricultural sector under the status-quo policies and including all fu-
ture changes already foreseen in the current legislation. The baseline accounts for trends in
population growth, inflation, GDP growth, technological progress such as yield growth and in-
creasing feed and fertilizer efficiency. The purpose of the baseline is to serve as a comparison
point for counterfactual analysis, in our case the cease of import scenario. The cease of imports
scenario uses all specifications of the baseline, and in addition is technically implemented by pro-
hibitive tariffs for all cereal products, maize, soybeans, soy cakes and soy oil by increasing the
import price by a factor of eight5, so that the price of imported commodities becomes prohibi-
tively high. Missing other reliable information, we consider that the UK is still part of the free
trade area of the EU. Alternatively, to our formulation of a complete cease of imports, we could
have allowed further imports from regions with regulations similar to the EU. Simulation tests
which such a scenario specification revealed that a cease of imports solely for countries such as
the US, Brazil and China triggers EU import flow shifts to origins such as Russia and Africa, which
would then have a strong incentive to import from non-regulated origins and in turn export their
domestic production to the EU. Such a trade shift would not reduce the risk for trading compa-
nies, as the imports from Russia and Africa will be contaminated with genome edited varieties in
the medium term, due to the low standards of seed replication schemes and the natural spread
of certain crops. Consequently, we applied the scenario for all countries independently of the
regulatory status of genome editing.
5
We tested different import price increases to reduce the import of cereals and soybeans, oils and cake. The factor eight
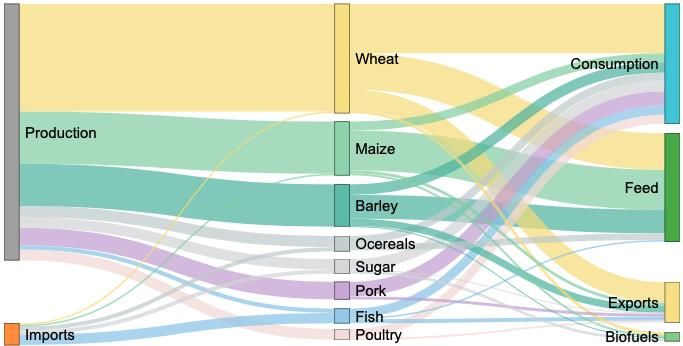
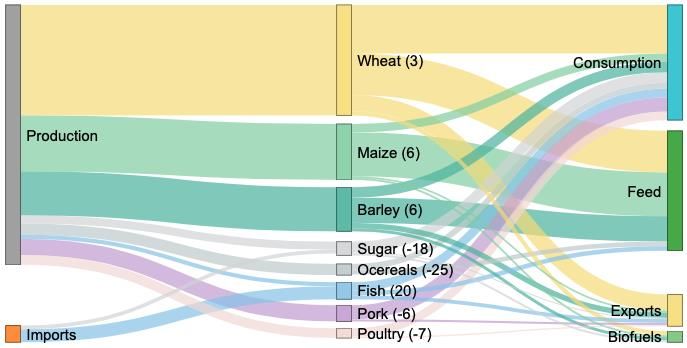
reduces these imports by almost 99%.Chapter 4 Results and Discussion 9 4 Results and Discussion This section describes and discusses the effects of scenario compared to the baseline in the year 2030. In the first subsection we look at economic results. We first analyse EU market balances, finding substantially reduced imports and exports and increased domestic production for the products covered by the scenario. Second, we look at EU market prices and find that the scarcity of cereals and soy in the EU caused results in substantially increasing prices. Third, we analyse the substitution processes in feed rations, and we look at changes in the origin of trade flows. Fifth, we look at total welfare effects showing that consumers must pay a high price for a cease of im- ports while farmer benefit in the EU. In the second subsection (4.2), we look at land use change and environmental effects. We show that mainly permanent and temporal grassland is converted into arable land in the EU as a consequence of a cease of imports and discuss land use changes in other regions of the world. In addition, we discuss land use changes by crop and fodder type in the EU at regional level and the increase of nitrogen surplus and greenhouse gases at regional level for the EU. We conclude the environmental section by showing the effect of the scenario on total global greenhouse gas emissions by the agricultural sector. 4.1 Economic Analysis Figure 4.1 presents the main results of the scenario. The flow charts in Figure 4.1 and Figure 4.2 de-scribes the EU. On the left the baseline and on the right the scenario (and in brackets of the scenario the percentage change to the baseline) are presented. The flow chart reads as follows: The EU production and the imports into the EU are depicted at the left and its usage (feed, hu- man consumption (including processing) and exports) at the right-hand side. We present two product groups: “cereals, sugar & meat markets” and “oil and cake markets” to ensure readabil- ity. Each colour represents a sub-group of products. For a better representation, small values are neglected. Processing and human consumption were aggregated for all raw products in the flow charts. Absolute changes by category are presented in the corresponding Table 4.1 and Table 4.2, which present EU production and use for human consumption, feed and biofuels. Note that the values do not account for the EU intra trade. Table 4.1 and Table 4.2 report changes to the base- line in 1.000 tonnes and ordered by net production, as well as in % changes. Positive values indi- cate increases, negative values decrease compared to the baseline. In Figure 4.1, imports for ce- reals disappear in the scenario due to the cease of imports in the scenario. However, total market volume increases for wheat by 3% and for maize and barley by +6%. Additionally, EU production increases and overcompensates the decline in imports. The market volume of other cereals de- clines by 25%, due to the previously high share of imports not allowed anymore. Production (-23%) and imports (-6%) of sugar decline (total market volume -18%), driven by a declining use as bioethanol feedstock. Human consumption remains unchanged.
10 Chapter 4 Results and Discussion
Figure 4.1: Elements of the market balance for cereals, sugar and meat markets for the
EU in the baseline and a cease of import scenario in tonnes
Baseline Cease of imports
Source: authors
As shown in Table 4.1 production in the EU increases for raw products subject to a cease of im-
ports as well as close substitutes: These are wheat (5%), soybean (435%), followed by grain maize
(95%) and barley (6%), rapeseed (2%), pulses (35%), other cereals (2%) and sunflower (3%) trig-
gered by increasing domestic prices. In addition, poultry (-7%) and pork meet (-6%) production
declines, given higher prices for feed concentrates. Together, exports are reduced in the EU for
all products, except sugar. 8.4 million tonnes of wheat (+16%) additionally enters the feed stock
for animals. Also, fish meal is imported and used to substitute protein from soy. The reduction of
human consumption for pork and poultry meat is small (-1%). In the baseline 17% of the net pro-
duction of both poultry and pork meat is exported. In the import cease scenario, most of the pro-
duction decline is met by a decline in exports, so that human consumption decreases by only 1%.
Table 4.1: Absolute and percentage changes in elements of the market balance for the EU
to the baseline for cereals, sugar and meat markets
Market
Production Human con. Processing Biofuels Feed use Imports Exports
volume*
1,000 t 1,000 t 1,000 t 1,000 t 1,000 t 1,000 t 1,000 t
abs % abs % abs % abs % abs % abs % abs % %
Wheat 7,029 5 685 1 -502 -11 1,769 41 8,407 16 -2,273 -100 -5,603 -19 3
Maize 6,783 9 231 3 -730 -13 -151 -5 6,840 12 -2,224 -100 -1,630 -39 6
Barley 3,770 6 84 1 -2 2,968 208 2,855 8 -295 -100 -2,431 -24 6
Other cereals 378 2 49 9 -2.725 -25 194 51 -2,529 -27 -5,794 -100 -404 -47 -25
Poultry meat -1,038 -7 -168 -1 -19 53 99 -817 -31 -7
Pork meat -1,482 -6 -285 -1 -27 -22 37 75 -1,133 -27 -6
Sugar -3,439 -23 30 10 2 -1,088 -27 15 7 -358 -6 319 23 -18
Fish -151 -1 -26 -12 4,384 194 4,133 28 -75 -1 20
* Imports + Production
Source: authors
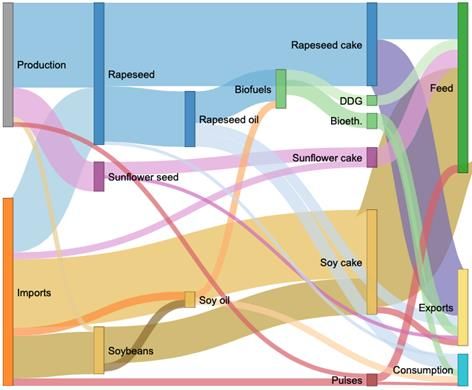
Figure 4.2 shows the market balance for oil and cake markets in the EU under the baseline and
the cease of import scenario. Soybean production in the EU increases by 436% to substitute the
imported soybeans and soy cake. Imports of soy cake and soybeans disappear. Contrary, importsChapter 4 Results and Discussion 11
of rapeseed (21%), sunflower cake (234%) and pulses (204%) increase in order to fill the protein
gap. As a consequence of missing soybean imports, processing to cake (-82%) and oil (-74%) de-
clines in the EU. The dropped imports of soy cake for feed use (-82%), as depicted in the baseline
in Figure 4.2, is substituted by increased rapeseed and sunflower cake, both being mainly import-
ed, either as rapeseed processed in the EU to cake or directly as sunflower cake.
Figure 4.2: Elements of the market balance for oil and cake markets for the EU in the
baseline and a cease of import scenario in tonnes
Baseline Cease of imports
Source: authors
Table 4.2 depicts the detailed market balance for oil and cake markets. The missing soy imports
also caused a reduction in human consumption, processing and feed use. Human consumption of
soy oil decreases strongly (-42%) and is substituted by sunflower seed oil (+9%), palm oil (+7%),
rapeseed oil (+4%). The reduction in the availability of soy as a protein-rich feed results in in-
creasing costs of production and hence higher market prices and hence a declining consumption
of milk, cheese and beef (see Table 4.1). These declines are relatively small (-4%, -1% and -1%,
respectively), as consumer prices for these products increase only modestly.12 Chapter 4 Results and Discussion
Table 4.2: Absolute and percentage changes in elements of the market balance for the EU
to the baseline for oil and cake markets
Market
Production Human con. Processing Biofuels Feed use Imports Exports volume*
1,000 t 1,000 t 1, 000 t 1,000 t 1,000 t 1,000 t 1,000 t
abs % abs % abs % abs % abs % abs % abs % %
Soybeans 7,007 436 9 5 -6,182 -42 -170 -56 -13,667 -100 -317 -87 -44
Soy oil -1,321 -49 -696 -42 -454 -100 -2,229 -99 -95 -20 -2,633 -100 -481 -100 -74
Soy cake -5,861 -49 1 1 -440 -100 -25,638 -81 -22,318 -100 -2,101 -100 -82
Rapeseed 636 2 -43 -4 4,533 10 -53 -10 3,758 21 -42 -13 10
Rapeseed oil 1,910 11 132 4 57 6 1,225 12 581 367 9 40 -77 -2 11
Rapeseed cake 2,867 11 -1 -5 -107 -85 16,106 135 258 176 -12,873 -84 11
Sunflower seed 252 3 -4 -1 1,175 16 -42 -8 502 275 -375 -32 3
Sunflower oil 545 15 249 8 139 18 157 31 244 412 235 27 -8 -6 18
Sunflower cake 664 15 -1 -4 6,336 106 5,250 234 -422 -83 90
Pulses 531 35 -56 -6 -14 -86 5,715 220 4,990 204 -124 -36 139
Palm oil 72 7 -18 -0,3 546 22 600 6 6
Bio diesel -280 -2 -160 -1 305 28 -34 -19 0.1
Bioethanol 1,019 13 182 4 -31 -31 563 18 20
DDG 2,000 61 2,014 62 -14 -68 61
*Imports + Production
Source: authors
We find a strong interaction between animal feed and biofuel feedstock demand. Protein for
fodder becomes short due to missing imports of soy. Among the substitutes are Dried Distillers
Grains (DDG), which are high in protein and are a by-product of bioethanol production from ce-
reals. The price of DDG increases as a consequence of this rise in demand and leads therefore to
an increase in the use of cereals bioethanol production. The production of DDG increases by 61%
to 2 million tonnes. Sugar as a feed stock is substituted by grains as it does not produce DDGs as
by product and the reduced demand results in a declining production by 23% in the EU. Bioetha-
nol production in the EU increases by 13%. At the same time, imports of bioethanol fall (-31%)
and exports increase (18%). Sugar exports increase at the same time as prices in the EU (-5%) are
reduced more than in the rest of the world (Table 1). Bio-diesel production declines by 2% due to
the decline in soy oil imports, mainly substituted by rapeseed oil feedstock (+12%), sunflower oil
(+31%) and palm oil (+22%).
The impact on the fodder ratios is shown in Table 4.3. For ruminants, rich protein fodder (includ-
ing soy cake and or maize silage) is substituted by protein from grass silage and fodder from ara-
ble land (non-permanent grass). As the protein content of grass is higher than that of maize si-
lage, maize silage is reduced. DDG and other protein cakes substitute for the category “feed rich
protein”, containing a high share of soy.Chapter 4 Results and Discussion 13
Table 4.3: Fodder ratio changes due to the cease of imports compared to the baseline
Ruminants Granivorous
for dairy other Cows male adult male adult Sheep & Pig fattening Poultry
production cattle high cattle low Goat fattening
kg dry matter/head kg dry
matter/
million
heads
Feed cereals baseline 753 95 985 204 11 223 5,427
% to baseline 6 -1 -3 0 -14 4 1
Feed rich protein baseline 652 165 245 210 20 75 1765
% to baseline -20 -38 -31 -20 -7 -3 0
Feed rich energy baseline 36 31 25 10 0 14 33
% to baseline -7 -17 -3 -4 -6 -4 -8
Feed from milk product baseline 9 3 3 2 0 2 131
% to baseline 3 4 2 3 2 3 2
Feed other (like DDG) baseline 65 22 24 16 15 4 304
% to baseline 4 13 5 6 3 7 6
Gras baseline 7881 11478 4587 3361 117
% to baseline 14 4 23 15 17
Fodder maize baseline 3449 1486 4153 1439 18
% to baseline -29 -26 -11 -22 -32
Fodder grass from arable land baseline 3402 2055 270 184 10
% to baseline 25 22 100 93 60
Source: authors
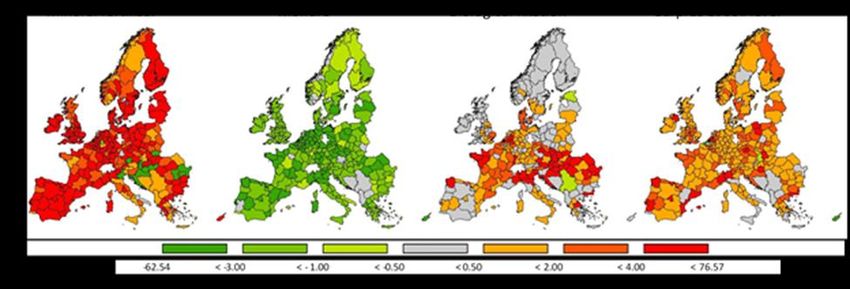
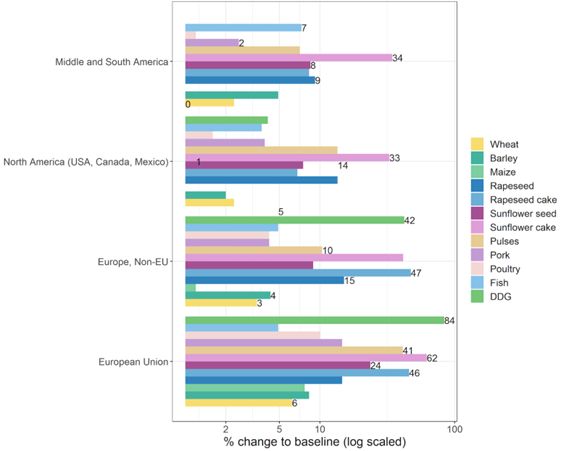
Under the scenario, most producer prices increase. We present price changes of more than one
percent in Figure 4.3. The left-hand chart shows products, where prices increase in all regions of
the world, including the EU, due to reduced exports (wheat and barley from the EU) and in-
creased EU imports (rapeseed, sunflower seed, pulses, beef, pork and poultry) caused by the sub-
stitution of soy product. This applies mainly to wheat and barley (2 to 8%), sunflower cake (33 to
62%), sunflower seeds (6 to 24%), rapeseed (9 to 15%) and pulses (7 to 41%). Meat becomes also
more expensive. Poultry meat prices increase (1 to 10%) as well as pork meat prices (4 to 15%) in
all regions. The same holds for fish and for DDG.14 Chapter 4 Results and Discussion
Figure 4.3: Price developments in different geographical regions
Source: authors
The graph on the right shows products for which prices are falling in at least one geographical
region. The price of other cereals increases in the EU as a result of a cease of imports. At the
same time, exports of other cereals from the EU to non-EU markets decline and consequently,
prices in non-EU Europe increase (6%). South, Middle and North America, which exported other
cereals to the EU in the baseline realize price declines (-5 to -6%).
Strong price increases (258%) are observed for soy in the EU (+258% for seed, +144% for oil and
+368% for cake). This creates an incentive to increase soy production in the EU. For Middle and
South America, which exported soy in the baseline to the EU, declining prices are the conse-
quence (-11% for cake, -5% for oil and -4% for soybeans). For soy oil and cake, prices drop also in
other regions, including North America, being among the EU’s main trading partners in soy prod-
ucts in the baseline scenario.6 In the EU, the sugar price (-5%) and the bioethanol price (-9%) de-
cline. This is a consequence of the high feed demand for DDG - as protein concentrate - and the
by-production of bioethanol. Higher bioethanol production leads, in turn, to declining prices and
also to a substitution of biodiesel to fulfil the bio-fuel mandates of the EU. For the other prod-
ucts, prices increase as EU demand increases for substitutes to the products covered by scenario.
In general, we find imports of non-soy oilseeds and protein crops, which are not covered by the
scenario, increasing as they substitute for the former soy imports (Table 4.4). In addition, we find
imports of animal products increasing, as their domestic production in the EU is getting less com-
petitive.
6
North America: Soybeans: -6%. Middle and South America: Soybeans: -4%, soy oil: -5%, soy cakes: -11%.Chapter 4 Results and Discussion 15
Table 4.4: Absolute and percentage changes of increased EU imports by origins
from North
America
from (USA, from Middle from Australia
Commodities from Europe, from Middle from Canada, and South and New
the market model non-EU East Africa Mexico) America from Asia Zealand total
1,000 t % 1,000 t % 1,000 t % 1,000 t % 1,000 t % 1,000 t % 1,000 t % 1,000 t %
abs abs abs abs abs abs abs abs
Sunflower seed 301 270 44 258 45 275 92 272 23 502 505 21
Rapeseed 497 8 0 66 1 63 2,850 32 34 49 210 115 178 7 3,770 2,071
Sunflower seed 2,277 161 11 1,141 48 472 41 309 2,737 336 168 2,099 3 1,787 5,285 235
cake
Rapeseed cake 214 150 0 13 46 2,023 260 177
Pulses 719 301 22 180 196 468 2,765 176 436 111 824 426 84 374 5,046 876
Fish 312 23 8 56 148 50 130 29 1,868 30 1,691 26 17 30 4,174 24
Source: authors
The larger the absolute quantities imported from a region into the EU, the larger the absolute
reduction of imports from this region in the simulation. This is true for all the crops in Table 4.3
except for rapeseed. The increase in imports of sunflower cake mainly stems from Middle and
South America and non-EU Europe, while the increase in imports of rapeseed is mainly due to an
increase of the imports from North America. The increases in pulses come from North America,
Asia and non-EU Europe.
The welfare analysis comprises changes in consumer and producer surplus as well as budgetary
effects. Consumer welfare is measured based on the money metric concept, linked to the indirect
utility function. On the producer side, gross value added (GVA) plus premiums is used as the main
indicator for the renumeration of labour, capital and land in agriculture, irrespective of the own-
ership of these factors. Primary losses of about 27 billion € are experienced by consumers be-
cause of higher price levels. In addition, higher subsidies required in the agricultural sector of
about 0.05 billion € due to increased land use. This is more than compensated by increasing tariff
revenues of 0.48 billion €. Although imports are reduced for genome editing crops, tariff reve-
nues for rapeseed and sunflower seed as well as fish and fish products increase. Finally, the farm-
ing sector benefits from higher prices and about 28 billion € are available for the payment to
land, labour and capital in agriculture.
4.2 Land Use Change and Environmental Effects
Figure 4.4 looks at the balance of global land use change. It can be observed that due to higher
agricultural product prices the marginal return to land increases and provides an incentive for
increasing agricultural use. In the EU, 4 million hectares are converted to annual and permanent
cropping. This land was formerly used in the category “forest and other land uses” (1.6 million
hectares), as well as in the categories “fodder produced on cropland and fallow” and “permanent
pasture and meadows”. The same change in land use pattern can be observed in other regions,
though to a lower extent, except for Middle and South America. Here the reduction of exports of16 Chapter 4 Results and Discussion
soy products releases land, while the increased demand for beef increases the share of grassland.
In addition, forest and other land is recovered.
Figure 4.4: Global land use change in 1,000 ha
Source: authors
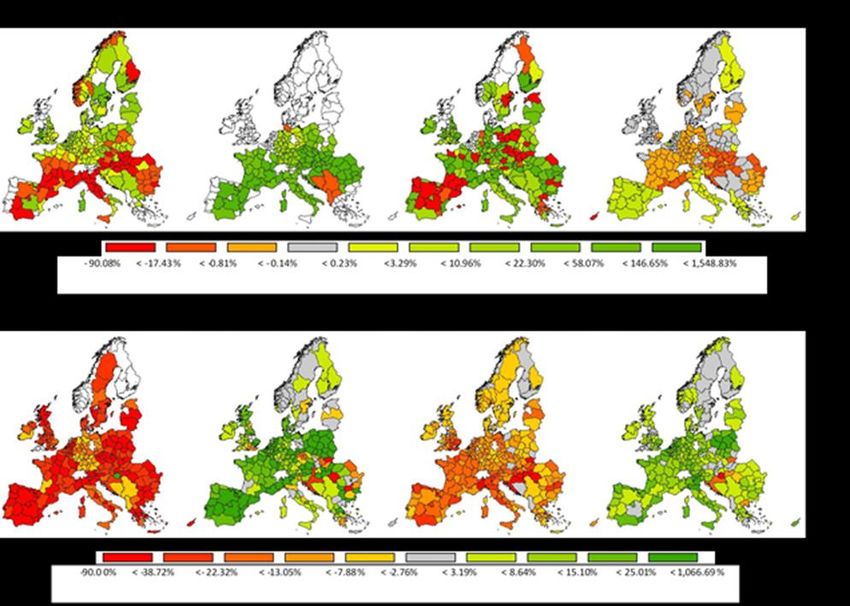
The distribution of land use changes across EU regions is depicted in the maps of Figure 4.5. The
map shows the percentage change for the respective cropping type by NUTS2 region. The pro-
duction of maize and sugar (included in other crops) declines due to substitution towards protein
rich crops. The decline of extensively managed grassland and the increase of more intensively
used grassland is interesting. This affects environmental goods like the provision of biodiversity in
agricultural systems or nutrient emissions. The increase in crop and food prices makes it profita-
ble to produce more intensively, e.g. with a higher use of inputs like fertilizer or change from ex-
tensive grazing on otherwise fallow land to artificial pastures. The change in intensity can also be
observed for cereals, where the yields increase by 5%, for oilseeds (>0%7) and for other arable
groups (+1%, of which: pulses +22%). An intensification in production can be seen in both the
Eastern and the Western parts of the EU. Vegetable and permanent crops mainly increase in olive
7
of which: rapeseed +1%, sunflower seed +6%, soy -7%.Chapter 4 Results and Discussion 17 production areas in Greece, Spain and Italy. The soy production increase particularly in Romania, Croatia, Hungary, Slovak Republic and Italy included in the crop group other arable crops. Figure 4.5: Land use change by cropping type in percentage change to the baseline Source: authors Olive oil is also a substitute for soy oil, which increase accordingly (see vegetable and permanent crops). Fodder maize is reduced and replaced by more protein rich fodder from grassland or fod- der from arable land. Animal herd numbers decrease in the EU, particularly for fattening of pigs, poultry and beef. Increased product prices result in a higher production intensity. Particularly, the use of mineral fertilizer is increased (+10% in sum, +9% per ha), while the use of manure decreas- es (-6% both in sum and per ha). Due to the increased production of legumes, the biological fixa- tion of nitrogen increases by 42% resp. 41% (see Table 4.5). The increase in fertilization with crop residues by 7% resp. 6% can be explained by an increased overall production in the EU. It is nota- ble that the nutrient surplus for nitrogen at soil level increases by 5% both in total and per ha. The regional distribution is given in Figure 4.6. This may have direct implications for the quality of ground and surface waters as well as implications for biodiversity and GHG emissions.
18                                                                                                Chapter 4           Results and Discussion

Table 4.5:                Sources and remains of nitrate used in the EU agriculture

                                                              total (in 1,000 t)                                  Per ha (in kg)
                                             value in                                            value in
                                             baseline           abs. change        perc change   baseline         abs. change      perc change
               Mineral fertilizer                 11,252               1,074              10%               63                5            9%
               Manure                              9,112                -503              -6%               51               -3           -6%
     source    Crop residues                       9,801                 650               7%               55                3            6%
               Biological fixation                 1,614                 683              42%                9                4           41%
               Atmospheric deposition              2,116                   15              1%               12                0            0%
               Absorption by crops                22,936               1,591               7%               128               8            6%
               Gaseous loss                        3,173                  -62             -2%               18               -1           -3%
     remains   Run off mineral                          456                43              9%                3                0            8%
               Run off manure                           447               -26             -6%                2                0           -7%
               Surplus at soil level               6,754                 367               5%               38                2            5%

Source: authors

Figure 4.6:                    Changes in nitrate application and surplus, absolute changes in kg per ha

Source: authors

Greenhouse gas (GHG) emissions increase in the EU agricultural sector and in most other regions
as well. In the EU this is driven by the increased and more intensive production of cereals and oil
seeds, while the production of meat and other animal products decreases. Meat that has been
formerly produced in the EU is still consumed there but now comes from imports. Also, less meat
is exported from the EU (-25%).

Hence meat production and the associated GHG emissions increase in other regions, foremost
Africa, the Americas and Asia. This accumulates to a global net increase in GHG emissions of the
Chapter 4 Results and Discussion 19
equivalent of 30 Mio tonnes CO2 8. This is an increase by 0.5% at the global level and equals 6% of
the baseline GHG emissions of EU agriculture. We see that a cease of imports of genome edited
crops leads to the relocation of production to the disadvantage in terms of carbon efficiency.
Figure 4.7: Greenhouse gas emissions in millions of tonnes of CO2-equivalents
Source: authors
While the production of one ton of soybeans is currently much more carbon efficient in South
America than in the EU, the scenario results in decreasing production in the former and increas-
ing production in the latter. The opposite is true for livestock and other animal products: Golub et
al. (2012) list the carbon emission in the production of beef, pork and dairy to be among the low-
est in the EU when compared internationally. Production in sub-Saharan Africa or Brazil is linked
to significantly higher emissions. Hence, a substitution of domestic EU-production by imports
from these regions will increase the overall average emissions per ton of product.
This study is to our knowledge the first comprehensive analysis on potential consequences of
genome editing regulation in the EU. A comparison to other studies can be done for certain as-
pects. For example, the dependencies of the EU on soybean imports are addressed by Hörtenhu-
ber et al. (2011), Weightman et al. (2011) and Sasu-Boakye (2014). They conclude that the utiliza-
tion of protein-rich feedstuffs locally produced show clear advantages in terms of emissions. We
broaden the analysis and show that higher prices resulting from reduced imports induce addi-
tional mineral fertilizer and land use changes, which in turn lead to increasing net GHG emissions.
8
This number differs from Figure 7 as it includes some products that are not depicted in the Figure.20 Chapter 4 Results and Discussion The effects of a cease of soybean imports from selected origins due to asynchronous approvals of GM crops are analysed by Henseler et al. (2013). The effects on agricultural markets in that anal- ysis are less profound as substantial substitution results from imports from non-GMO origins, an effect not allowed in our analysis. The effects on global land use changes were also discussed in several other studies (e.g. Muller et al., 2017). The substitution possibilities of soybean meal and cereals in European livestock diets with bioethanol coproduct are well acknowledged (Weight- man et al., 2011). With our analysis we economically quantify the degree of substitution which could take place and the relevance of the EU biofuels sector in the adjustment to a cease of im- ports. Not yet found in the literature is the loss of grassland, in regions where it is still possible, and the intensification of grassland due to higher agricultural prices. This has implications for biodiversity as extensively managed grassland declines as well as on other environmental dimen- sions (Weisser, 2017).
Chapter 5   Conclusions                                                                              21

5 Conclusions

Genome edited crops are on the verge of being placed on the market and will thus be traded as
agricultural products and embedded in processed foods on the world market. The EU classifies
genome edited crops as genetically modified. Other major exporters like the US and Brazil do not
regulate genome editing. As any shipment can be contaminated with genome edited goods, we
argue that this provokes high economic risk to traders and that they will avoid importing to regu-
lated markets like the EU. We acknowledge that small modifications are difficult to detect, but
assume that approaches exist, e.g. documentation of specific trade flows from non-regulated
markets to the EU carried out for example by NGOs opposing GMO, proving that certain ship-
ments are contaminated. Therefore, a de facto complete cease of imports may result. We analyse
the effect of a cease of EU imports for cereals and soy products with the comparative static par-
tial equilibrium model CAPRI.

This section draws conclusions regarding first, the impact of a cease of imports for cereals and
soy products on the EU agricultural sector, second, the potential and limitations of our analysis,
and finally the implications for the regulation of genome editing.

Considering the effects of the scenario, we find that to replace protein and oil originally imported
via soy for feed (for pig, poultry fattening and ruminants) and for oil (for bio-diesel production),
the markets adjust by i) increasing EU production of pulses and soy, ii) increasing imports of sub-
stitutes, iii) substituting feed protein by increasing the intensity of EU grassland use and iv) a shift
from biodiesel to bioethanol, as DDGs is a rich protein by-product. This triggers a conversion of
grassland and an utilisation of non-agricultural land to crop land. Crop land is then used to in-
crease the feed stock for bio-ethanol production, mainly cereals. The very strong price reactions
reflect the strong dependence of the EU on soy product imports. As further consequences, in-
creasing beef and sheep meat imports compensate for the reduction of poultry and pork meet
production in the EU and palm oil imports increase to serve as a feedstock for EU biodiesel. EU
exports are reduced for products which i) are not imported anymore (or for which soy or cereals
is an input) and ii) which substitute soy products, e.g. rapeseed and sunflower seed. Particularly
the strong increase in demand for rapeseed and sunflower seed invokes land use changes to-
wards more crop land in other countries, except for Brazil where crop land is converted back to
grassland induced by higher beef prices.

Particularly the intensification of agriculture (higher use of fertilizer) and the additional land use
for agriculture result in higher nutrient surpluses in the EU per hectare as well as in total, alt-
hough white meat production in the EU declines and hence the production of manure. Global
greenhouse gas emissions increase, as protein productivity in the EU and animal productivity out-
side the EU is comparatively low and hence the new distribution of production is less efficient not
only in terms of production cost, but also regarding GHG emissions. Overall the effects on mar-
kets as well as GHG emissions are large, and net effects are negative and agricultural prices in-
crease in many regions of the world.
22                                                                             Chapter 5    Conclusions

When analysing the economic and environmental impacts of the scenario, we need to
acknowledge the limitations of our analysis. We did not consider genome edited animal products,
other crops than cereals or soybeans or any further processed goods, all of which having the po-
tential to contribute to even stronger effects than depicted in our analysis. Missing reliable in-
formation on specific properties of genome edited plants, we could not account for any produc-
tivity effect in non-regulated markets, e.g. resulting from pest resistance, higher yields or higher
quality. Such effects would increase the competitiveness outside and increase relative production
costs inside the EU. With respect to the model approach: As the market module uses the Arming-
ton approach and the supply model uses positive mathematical programming the so-called “small
share problem” arises on the market and the supply side of the simulation. If the share of imports
or supply is small in the baseline, the import or the supply will stay relatively small, even if major
price changes occur. It is therefore possible that we overestimated the price effect. The problem
of small shares and approaches to overcome this shortcoming are discussed for example in Kui-
per and van Tongeren (2006). Furthermore, it should be mentioned that the income effect in this
study are probably unequally distributed in the farming population, particular between cash crop
and animal intensive farms. A quantification would require models operating at farm group scale
such as proposed by Gocht et al. (2013).

To wrap up, countries are divided world-wide in their policies on genome edited crops, especially
with regards to SDN-1, where no foreign DNA is introduced into the genome. Some main export-
ing countries of agricultural commodities do not regulate SDN-1, while others like the EU, do.
Since at the moment, the link between a mutation and a certain breeding technique cannot be
established, uncertainties for traders as well as regulatory agencies will arise. Currently, there is
no way to combine the imports of crops or crop products for which genome edited varieties exist
with the implementation of the verdict of the ECJ because compliance with GMO legislation can
simply not be enforced due to identification problems. Accidental imports are likely to occur and
will undermine the legislation in place (Wasmer, 2019). One could argue, that if no method for
identification exists imports will flow into the EU without being recognized. We anticipate, how-
ever, that interested stakeholders will find a way to prove that genome edited crops enter the EU
illegally. This will prevent traders from shipping from non-regulated markets. This has implica-
tions for the regulation of genome edited crops in the future. The EU Council, being beware of
the potential economic consequences of current EU regulation, requested the Commission to
submit an investigation until April 2021 in the light of the Court's judgment and, if necessary, to
make a proposal for a new regulation. With this study we contribute to the assessment and point
to the resulting market implications, the potential effects on GHG emissions and environmental
aspects as well as the effects on land use in South America and income increases in the agricul-
tural sector world-wide. Given the current initiative of the EU Council, we doubt that the EU’s
timeline for finding a solution is sufficient to prevent a scenario as outlined in this paper. The
scenario shows that as a result of asynchronous and divergent national legislations on genome
edited crops, especially with regards to SDN-1, significant changes in the EU agricultural sector
are likely to occur. Against the background of a) the challenge of non-identification, b) significant
environmental as well as economic effects and supposed that the genome-edited products are
Chapter 5   Conclusions                                                                       23

safe it seems worthwhile to reconsider the current European regulatory framework. Recently,
different options to either amend, supplement or replace Directive 2001/18/EC have been dis-
cussed (Wasmer, 2019). Generally spoken, any reform of the EU legislation on GMO should aim
at being consistent with scientific principles, striving towards international coherence and also
allow for agricultural innovation, such as genome editing (Eriksson et al., 2020).
Literature                                                                                                25

Literature
Andreyeva, T., Long, M. W., Brownell, K. D. (2010) The impact of food prices on consumption: a systematic
            review of research on the price elasticity of demand for food. American journal of public
            health, 100(2), 216–222. doi:10.2105/AJPH.2008.151415
Becker, A., Blanco, M. Shrestha, S, Adenäuer, M. (2013) Methodology to assess EU Biofuel Poli-cies: The
             CAPRI Approach,
             https://publications.jrc.ec.europa.eu/repository/bitstream/JRC80037/jrc80037_capri_biofuel
             s_report.pdf, last accessed on 31 January, 2020.
Braidotti,   G. (2019) Partial lifting of GMO restrictions for newest gene technology,
             https://groundcover.grdc.com.au/story/6099720/amendments-to-gmo-regulations-provide-
             clarification-for-industry/, last accessed on 24 April, 2020.
Britz, W., Witzke, P. (2012) CAPRI model documentation 2008: Version 2, https://www.capri-
             model.org/docs/capri_documentation.pdf, last accessed on 11 February, 2020.
Bömeke, O., Karmann, J., Matthies, A. (2018) Detaillierte Übersicht zum regulatorischen Status der neuen
            molekularbiologischen Techniken (NMT) in ausgewählten Drittstaaten.
Consmüller, N., Bartsch, D., Vaasen, A. (2019) Are genome edited products credence goods? Implications
            for regulation and governance. Poster presented at the ISBR symposium, Tarragona.
Court of Justice of the European Union (ECJ) (2018) Press Release No 111/18.
Eckerstorfer, M. F., Engelhard, M., Heissenberger, A., Simon, S.,Teichmann, H. (2019) Plants developed by
             new genetic modification techniques – comparison of existing regulatory frameworks in the
             EU and non-EU countries. Frontiers in Bioengineering and Biotechnology 7: 26.
Eriksson, D., Custers, R., Edvardsson Björnberg, K., Hansson, S.O., Purnhagen, K., Qaim, M., Ro-meis, J.,
             Schiemann, J., Schleissing, S., Tosun, J., Visser, R.G.F. (2020): Options to Reform the European
             Union Legislation on GMOs: Scope and Definitions. Trends in Biotechnology, 38 (3), 231-234.
Eriksson, D., Kershen, D., Nepomuceno, A., Pogson, B.J., Prieto, H., Purnhagen, K., Smyth, S., Wesseler, J.,
              Whelan, A. (2019) A comparison of the EU regulatory approach to directed mutagenesis with
              that of other jurisdictions, consequences for international trade and potential steps forward.
              New Phytologist 222: 1673-1684.
European Parliament (EP), European Council (EC) (2001) Directive 2001/18/EC of the European Parliament
           and of the Council of 12 March 2001 on the de-liberate release into the environ-ment of ge-
           netically modified organisms and repealing Council Directive 90/220/EEC - Commission Decla-
           ration.
European Parliament (EP), European Council (EC) (2003) Regulation (EC) No 1829/2003 of the European
           Parliament and of the Council of 22 September 2003 on genetically modified food and feed.
European Parliament (EP), European Council (EC) (2003) Regulation (EC) No 1830/2003 of the European
           Parliament and of the Council of 22 September 2003 concerning the traceability and labelling
           of genetically modified organisms and the traceability of food and feed products produced
           from genetically modified organisms and amending Directive 2001/18/EC.
FAOSTAT (2019) Crops and livestock products, download http://www.fao.org/faostat/en/#data/TP
          http://www.fao.org/faostat/en/#data/QCm, last accessed on April 23, 2020.
Fisher, M. (2014) Lack of approval for import of U.S. agricultural products containing Agrisure VipteraTM
             MIR 162: a case study on economic impacts in marketing year 2013/14. National Grain and
             Feed Association, Washington D.C.
You can also read