WP/21/239 Border Carbon Adjustments: Rationale, Design and Impact - by Michael Keen, Ian Parry, and James Roaf
←
→
Page content transcription
If your browser does not render page correctly, please read the page content below
WP/21/239

Border Carbon Adjustments: Rationale, Design and Impact

 by Michael Keen, Ian Parry, and James Roaf
© 2021 International Monetary Fund WP/21/239

 IMF Working Paper

 Fiscal Affairs Department

 Border Carbon Adjustments: Rationale, Design and Impact

 Prepared by Michael Keen, Ian Parry, and James Roaf *

 Authorized for distribution by James Roaf

 September 2021

 IMF Working Papers describe research in progress by the author(s) and are published to elicit
 comments and to encourage debate. The views expressed in IMF Working Papers are those of the
 author(s) and do not necessarily represent the views of the IMF, its Executive Board, or IMF
 management.

 Abstract

This paper assesses the rationale, design, and impacts of border carbon adjustments (BCAs). Large
disparities in carbon pricing between countries raise concerns about competitiveness and emissions
leakage. BCAs are potentially the most effective domestic instrument for addressing these
challenges—but design details are critical. For example, limiting coverage of the BCA to energy-
intensive, trade-exposed industries facilitates administration, and initially benchmarking BCAs on
domestic emissions intensities would ease the transition for trading partners with emission-
intensive production. It is also important to consider how to apply BCAs across countries with

*
 Keen, Tokyo College, University of Tokyo, Institute for Fiscal Studies and Center for Business Taxation;
mickjkeen@gmail.com. Parry, Fiscal Affairs Department International Monetary Fund, iparry@imf.org. Roaf, Fiscal Affairs
Department, International Monetary Fund; jroaf@imf.org. We are grateful to Simon Black, Vitor Gaspar, Ben Jones,
Victor Mylonas, Kurt Van Dender, Jonas Teusch, Philippe Wingender and other colleagues for very helpful comments
and suggestions and to Danielle Minnett for excellent research assistance.
different approaches to emissions mitigation. BCAs alone do not solve the free-rider problem in
carbon pricing, but might be a step to an effective international carbon price floor.

JEL Classification Numbers: Q31; Q35; Q38; Q48; H23.

Keywords: border carbon adjustment; climate mitigation; carbon pricing; competitiveness, emissions
leakage; allowance allocation, design issues, World Trade Organization rules.

 3
1. Introduction

As countries consider more aggressive climate mitigation policies, the question of whether some
form of ‘border carbon adjustment’ (BCA) is appropriate has become central to the wider
climate debate. The EU’s recent announcement of a BCA proposal in July 2021 1 , as well as BCA
proposals in the United States2, have heightened interest in this instrument, not least as countries are
revising their climate strategies in the run up to COP26 in November 2021.3 Underlying this interest is
a concern that more ambitious unilateral actions—higher domestic carbon pricing, in particular—will
be discouraged by cross-border effects. The interest in BCA is as a possible way to limit the harm that
can arise from lack of uniformity in and coordination of national policies. Put differently, carbon pricing,
as is well-known, faces a fundamental free-rider problem, since each country has an incentive to leave
it to others to address the common climate challenge: BCAs may be a way to help address this difficulty.

A ‘BCA’ here is taken to be a charge on the carbon content of imported products intended to
ensure treatment equivalent to domestic carbon pricing, potentially combined with rebates for
the carbon content of exports. Two features of this approach should be noted. First, and most
straightforwardly, the term ‘charge’ reflects that the BCA could be implemented either as an explicit
tax, or as a requirement for importers to purchase allowances from a domestic emissions trading
system (ETS) or separate allowance pool. Second, the remission of tax on exports is treated as an
optional feature—and indeed many proposals do not allow for such rebating. Without such an
adjustment, however, a BCA is different from a ‘border adjustment’ in the sense that the term is used,
for example, in relation to the VAT: there it is used to indicate that imports are effectively brought into
domestic taxation, and exports taken out, so placing the tax on a ‘destination’ basis. This points to a
potential tension in that the Paris Agreement, in contrast, assigns to countries responsibility for the
emissions generated within their borders – an ‘origin’ basis.4

Policymakers are considering BCAs for three main reasons:

1
 The proposed BCA would become operational in 2026 following a transition period. See
https://ec.europa.eu/info/sites/default/files/carbon_border_adjustment_mechanism_0.pdf.

2
 See https://joebiden.com/climate-plan. Recent legislative proposals for carbon taxes in the United States have also
contained BCAs (see www.carbontax.org/bills).

3
 See for example www.aljazeera.com/economy/2021/2/5/bb-uk-pm-to-push-allies-to-agree-on-carbon-border-taxes-
report. Only one BCA has been implemented to date, and at the sub-national level—it applies to the embodied carbon
in imported electricity under California’s ETS (see Bushnell and others 2014, Pauer 2018).

4
 A third feature is that this definition excludes equalization with respect to domestic abatement measures other than
carbon pricing: the treatment of non-price measures is discussed in Section 2.A

 4

To help preserve the competitiveness of domestic industries in the presence of domestic carbon pricing, particularly for energy-intensive, trade-exposed (EITE) industries—this improves economic efficiency in the sense of preventing distortions in the relative prices of domestic and foreign goods (i.e., clean and polluting industries at home and abroad are treated alike)5 and can aid the political acceptability of carbon pricing; To reduce the risk of emissions leakage, that is, partially offsetting emissions increases in foreign countries induced by domestic mitigation policy—this objective signals a concern not only with national welfare but with global welfare more generally;6 and At an international level, some have stressed that BCAs may strengthen incentives for carbon pricing and mitigation action in other countries—there is a direct fiscal incentive to the extent that non-BCA countries effectively forgo revenue on their exports collected by the importing BCA country, and indirectly BCAs might help to strengthen the international credibility of carbon pricing schemes. While related, these objectives are distinct: it will be seen, for instance, that leakage may be significant even if the competitiveness effects of domestic carbon pricing—in the sense of a decline in domestic production—are small, and vice versa. Policymakers considering BCAs will need to address two broad sets of issues: How BCAs might be best designed (e.g., through choice of sectoral coverage, measurement of embodied carbon in traded goods, treatment of exports, accounting for mitigation actions in foreign countries); and Whether BCAs are preferable to other instruments (e.g., free ETS allowance allocations to EITE industries) for addressing their underlying objectives. In making these choices, policymakers will also need to consider the preservation of domestic mitigation incentives, the impact on revenue, moderating administrative and compliance costs, and limiting risks of challenges under World Trade Organization (WTO) rules or of trade retaliation. It will be important for policymakers to consider the likely reception of a BCA by their international partners. Just as it is natural for the country implementing carbon pricing to be concerned about competitiveness and carbon leakage, so it is also natural for trading partners to be 5 This is of course just one aspect of efficiency: the impact on the aggregate level and cross-country distribution of emissions is another. 6 Adopting an explicitly global standard of efficiency, a form of BCA can indeed be shown to be required when carbon prices are not appropriately set in all countries. See Keen and Kotsogiannis (2014). 5
concerned that BCAs might camouflage protectionist measures. The impacts of carbon pricing and the
BCA should be considered jointly: rather than being seen as creating a competitive advantage for the
country imposing it, a BCA may be better thought of as mitigating a competitive disadvantage that its
carbon pricing would otherwise create for itself by raising costs on domestic producers. Further, to the
extent that countries with carbon pricing are already using measures such as free emissions permit
allocations in pursuit of their objectives, a BCA would simply replace one mechanism with another.
These considerations may alleviate trading partners’ concerns about the BCA—so long as it is designed
appropriately and does not over-compensate for the cost increases caused to the domestic industry
by carbon pricing.

This paper seeks to provide practical guidance for policymakers, both conceptual and
quantitative. Conceptually, we focus throughout on the analysis of BCAs from a national rather than
a collective perspective. Key empirical issues to which the analysis points include leakage rates, burdens
of BCAs on trading partners, emissions shares of traded products, embodied carbon in imports and
exports for different countries, and the impacts of BCAs on industrial costs.7

The paper is organized as follows. Sections 2, 3, and 4 focus on potential rationales for BCAs, design
issues, and instrument choice issues respectively. Section 5 provides brief concluding remarks.
Although the focus is on the tax policy aspects of BCAs, this cannot meaningfully be addressed without
recognizing the legal context, a brief account of which is given in Annex 5.

 2. Rationales for BCAs

We consider in turn the three possible rationales for some form of BCA set out above.

Competitiveness

Carbon pricing can affect the competitiveness of emissions-intensive domestic industries, by
increasing their costs relative to foreign competitors. Around 30 carbon pricing schemes had been
implemented by 2021 at the national and EU levels, with prices and coverage varying widely (and many
not applying to the industrial sector)—see Figure 1. Implicit carbon prices in mitigation pledges for
2030 also vary widely.8 While some price dispersion may well be acceptable—for example, reflecting
the principle under the Paris Agreement that countries have “common but differentiated
responsibilities” according to their level of development—it may be difficult for countries to implement

7
 The analysis complements other recent discussions, for example, Chen and others (2020), Cosbey and others (2019),
Flannery and others (2018), Lowe (2021), Morris (2018), OECD (2020).

8
 IMF (2019a, b).

 6
aggressive near-term pledges without mechanisms for limiting perceived declines in their international
competitiveness.

 Figure 1. Selected Carbon Pricing Schemes, 2021
 Bubble size shows value of pricing initiative:
 160
 = 0.1% of GDP
 Sweden
 Carbon tax
 140
 ETS
 Carbon tax and ETS
 120
 Liechtenstein Color shows share of global GHGs:
 Finland Switzerland 1%
 100
 Carbon price ($US/tCO2e)

 80 UK
 EU
 Norway

 60
 France Ireland Iceland
 Korea
 Portugal New Zealand Canada
 40 Denmark
 Spain
 Latvia Chile South Africa
 20 Argentina
 Estonia
 Mexico
 Slovenia
 0
 China Ukraine
 Poland Colombia Kazakhstan Singapore
 Japan
 -20
 0 10 20 30 40 50 60 70 80 90
 Coverage of nationwide greenhouse gases (%)
Sources: WBG
 Sources: (2021);
 WBG EMBER
 (2021); (2012);(2012);
 EMBER ClimateClimate
 Watch (2021);
 Watch IMF staff calculations.
 (2021); IMF staff calculations.
 Notes: Carbon prices are from April 01, 2021 from WBG (2021). EU ETS price is from July 19,2021 from EMBER.
 GHGs are from 2018. EU includes Norway, Iceland, Liechtenstein. Values less than 0.005 percent of GDP are of
 equal size for illustrative purposes. The value of the UK's ETS is an estimation for 2021 based on a £50/tCO 2e
 price. China's value estimate and price is based on the opening pricing of $7.40/tCO 2e. Finland's transport fuels
 are priced at $73/tCO2e. Ireland's F-gases are priced at $20/tCO2e . Norway has a reduced rate on natural gas for
 EU ETS installations of $4/tCO2e. Norway and Mexico prices represent carbon price upper bounds. Lower bounds
 are $3.9/tCO2e and $0.37/tCO2e respectively. Switzerland's price is a weighted average between carbon price and
 ETS by emissions covered.

While competitiveness concerns apply in principle to all traded items, the policy focus has been
on EITE industries. This is because their costs are most heavily increased by carbon pricing (since their
production is energy intensive) and there is a reasonable presumption that demand for these products
may shift significantly from domestic to foreign suppliers under carbon pricing. Moreover, EITE
industries are typically 80 percent or more of manufacturing emissions—though manufacturing is
usually around 10-30 percent of nationwide emissions (Figure 2). EITE industries may also have
particular political sensitivities, given that employment effects of carbon pricing may be larger and
more visible than for other sectors.

 7
Figure 2. Nationwide CO2 Shares for Domestic EITE and
 Manufacturing Industry, 2015
Primary examples of EITE industries
 Australia
include iron, steel, aluminum, Canada
refined petroleum products, China
 EU-27
pharmaceuticals, plastics, glass,
 France
ceramics, cement, textiles, and Germany
wood products. Many of these India
industries produce raw materials for Japan
 Korea
sale to firms further down the value EITE Non-EITE
 Russia
chain producing final consumer UK
goods. In the EU ETS, for example, US

industries are classified as EITE if the 0 10 20 30 40 50
ETS increases their production costs at Nationwide emissions share, percent
 Source: OECD (2021); UNFCCC (2021).
least 5 percent and their trade share
 Note: EITE includes metals, chemicals, wood/paper, and textiles.
with non-EU countries (imports plus Nationwide emissions exclude land use and land use change.
exports relative to production) is Figure 3. EITE Value Added as a Share of GDP, 2015
above 10 percent; these industries are China
currently eligible for free allowance Thailand
 Viet Nam
allocations determined by their
 Malaysia
historical production and by industry Argentina
emission rate benchmarks for Indonesia
 Japan
relatively clean firms. 9 In principle,
 Mexico
electricity should count as an EITE Turkey
industry under the EU criteria (as it is EU (27)
 India
in California) but it is excluded as
 Peru
production costs are largely passed Russia
forward in higher consumer prices Colombia

(see below) despite some trade Brazil
 South Africa
exposure. Agriculture is another Saudi Arabia
potential EITE industry, but (proxy) Canada
pricing schemes have not yet been United States
 Kazakhstan
applied to most greenhouse gas
 United Kingdom
emissions from this sector. EITE
 0 10 20 30
industries typically account for around Percent of GDP
10-20 percent of GDP (Figure 3). Metals Chemicals Other Manufacturing Textiles Other EITE
 Sources: OECD TiVA Database; IMF staff calculations.

9
 Sectors are also deemed EITE (i.e., at significant risk of carbon leakage)) if production cost increases or their trade
share exceed 30 percent (see https://ec.europa.eu/clima/policies/ets/allowances/leakage_en). The industries defined as
an EITE will vary across countries with differences in classification criteria, energy intensity, and trade exposure (Cosbey
and others (2012).

 8
The anatomy of the competitiveness Figure 4. Impact of Carbon Pricing on Firm Cost
issue is shown in Figure 4. Carbon unit
pricing drives a wedge between pre- and cost Post- carbon price cost curve, C(E) + P∙E

post-tax production cost curves. In the Y
 UC1
absence of carbon pricing, the curve C(E)
 Transfer payment,
 Cost Original
shows unit costs as a function of T = P∙E1
 increase cost curve, C(E)
emissions per unit E (both direct and X
 UC0
indirect—see below). The firm chooses Efficiency cost, C
to produce at the minimum cost, at point
 Carbon price schedule, P∙E
X, with emissions of E0. Introducing a Emissions
carbon price of P per unit of CO2 raises reduction

the cost curve to C(E) + P∙E. The firm now E1 E0
optimizes at point Y. Emissions per unit Emissions per unit of production, E
fall from E0 to E1, and unit production Source: IMF staff.

costs rise from UC0 to UC1.

The increase in unit production costs has three main components. Figure 5 shows the same
information as Figure 4, but (on the vertical axis) on a per-unit of emissions basis (rather than per unit
of output). The first cost component, C, is the efficiency or social cost of the induced changes in
production methods (e.g., the cost of switching to cleaner technologies and fuels), indicated by the
relevant area under the marginal abatement cost schedule. Next is the transfer payment to the
government (or to allowance
sellers), T, equal to the carbon price Figure
 Figure5.4.Marginal Abatementcosts
 Marginal abatement Costs
 unit
times the remaining emissions per cost/
unit of output—this is a private CO2
rather than social cost (C and T
correspond to the vertical distances
marked in Figure 3). Viewed from
 Marginal abatement cost
the perspective of a particular firm, carbon
this transfer cost can be divided price
further into payments made on: (i)
 Y Efficiency cost, C
the firm’s direct emissions (P∙Edir); P
and (ii) indirect emissions Transfer payment, T = P∙E1
 P∙Edir P∙Eind
embodied in the firm’s inputs, in X
practice likely to be chiefly emissions remaining E1 emissions cut E0
electricity (P∙Eind). 11 At moderate Emissions per unit of production, E
abatement levels, the efficiency Source: IMF staff.

11
 Direct and indirect emissions are sometimes referred to as scope 1 and scope 2 emissions respectively.

 9
cost is small relative to the transfer payment, with the relative size of the efficiency cost rising with the
extent of abatement.

Unit production cost increases from carbon pricing by itself would vary significantly across
countries and EITE industries. For illustration (see Figure 6), a carbon price of $50 per ton in 2030 is
estimated to increase unit costs for
basic metals by around 25-30 Figure 6. Input Price Changes for $50/tCO2 Carbon Tax,
 in percent, 2030
percent in India, 12-15 percent in
China, and less than 10 percent in
the EU and US, while cost increases China
for textiles, machinery, and
fabricated metals are less than 10
percent in each case (Figure 6). EU27

Empirical studies, however, have
generally failed to identify large
 India
production effects of carbon pricing,
albeit at generally low levels of
carbon pricing and often in the United
 States
presence of compensating
instruments such as free 0 10 20 30
 Percent
allowances. And while there has
 12
 Iron & Steel Textiles Machinery
been a general sense that EITE cost Non-Ferrous Metals Fabricated Metals
increases are difficult to pass forward Source:
 Source:IMF
 IMF staff
 staff calculations.
 calculations.
in higher prices to downstream firms Note: EU27 uses a weighted average on sectoral output.

or consumers, solid empirical evidence on this has been difficult to pin down.13

A BCA could level the playing field, in terms of carbon charges, between sellers from different
jurisdictions competing in the same market. A BCA charging the carbon content of imports (direct
and indirect) at a rate equal to the difference between domestic and any foreign carbon prices, and
symmetrically for exports, would fully adjust for differences in carbon prices. For imports from a
jurisdiction without carbon pricing or other mitigation policies, such a charge means the foreign
producer faces the same transfer payment component (T in the diagrams above) as a domestic
producer with the same emissions intensity. Similarly, including export rebates in the BCA will put the
domestic producer on level terms with foreign producers in the external market. The competitiveness

12
 For example, Dechezleprêtre and Sato (2017), Venmans and others (2020).

13
 Most studies suggest pass through rates for EITE industries of between about zero and 50 percent (Neuhoff and Ritz
2019) in contrast to the power sector where carbon pricing in the EU has been largely passed forward in higher
consumer prices (e.g., Bushnell and others 2013, Sijm and others 2006).

 10
impacts of the BCA will depend on key design features however, most notably the measurement of
embodied carbon (see Section 3).

Some form of border adjustment by countries using regulations or other non-price mitigation
policies could also be warranted. Non-price policies differ fundamentally from price-based policies
in that they do not impose on firms the rectangle of tax-transfer shown in Figure 4. However, both
price and non-price policies increase production costs by the triangle C : the efficiency cost being
forced in the case of non-price policies by a notional shadow price of carbon. So nonprice policies
generally impose markedly lower private costs on firms than carbon pricing (at equivalent shadow
prices). Nonetheless, these costs could still be significant enough to cause competitiveness and
leakage concerns, especially at higher levels of domestic abatement. Conceptually they would
therefore merit some type of charge on imports from jurisdictions with little or no mitigation in place.

However, in such circumstances a BCA that charges the domestic shadow price on embodied
emissions in imports would generally not be the appropriate response. This is because the
domestic firm is expressly not paying a price on its own embodied emissions: instead, the cost to the
domestic firm arises only from the reduction in emissions. It would also be problematic from a legal
point of view to impose charges on imports that are not being paid by domestic firms. The objective
of restoring competitiveness would seem best met by charging imports some estimate of the efficiency
cost faced by domestic firms.14 This though faces two practical constraints: the efficiency costs are
unobserved, unlike actual carbon pricing transfer costs; and this approach would not fit within WTO
rules, so would depend on interpretation under the “environmental exception”. Further, it is very hard
to see how compensation for efficiency costs could be effected for exports without falling foul of WTO
rules on subsidies.

The issue is explored further in Annex 1, examining the cases in which either the import country (as
above) or the exporting country uses regulations or other non-price policies. One key implication of
the difference discussed above between actual and shadow carbon pricing is that a country using
carbon pricing that adopts a BCA could well choose to apply it to imports from a country achieving
equivalent emissions reductions through regulations.

B. Leakage

Unilateral carbon pricing creates the risk that reductions in domestic emissions will to some
degree be offset by additional emissions from increased production abroad—a risk that BCAs
can reduce. Such leakage can arise from the international migration of production, or an expansion

14
 An alternative, beyond the scope of border adjustment, would be to apply the same regulatory standards to imports
as faced by domestic firms, which would amount to banning high-emissions imports altogether, which raises its own
legal and trade policy issues.

 11
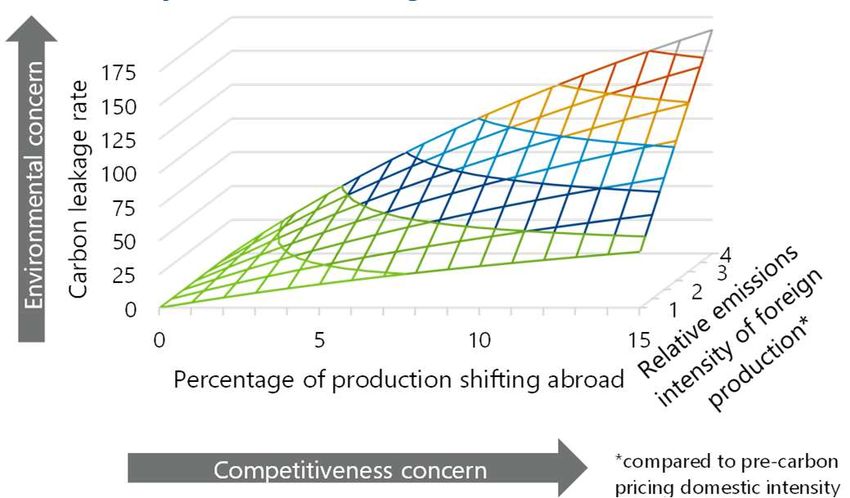
of existing production abroad, following a deterioration in the relative competitiveness and/or
profitability of operating in countries imposing carbon pricing—offsetting charges on imports and (see
below) remitting tax on exports can mitigate these risks. This type of leakage is most relevant for EITE
industries—in contrast, for example, CO2 emissions from domestic transportation and buildings are
largely immobile.15

At the industry level, the potential leakage rate (i.e., the increase in foreign emissions relative
to the reduction in domestic emissions) is not always related to the scale of competitiveness
impacts. The reduction in domestic industry emissions induced by carbon pricing can be decomposed
into three effects: a reduction in the emissions intensity of domestic production (as firms adopt cleaner
technologies and fuels); a reduction in domestic production due to lower domestic demand; and a
reduction in domestic production due to migration of production away from domestic to foreign firms.
Only the last channel causes leakage. Leakage generally goes hand-in-hand with competitiveness
concerns but—depending on the Figure 7. Determinants of Leakage Rates
relative foreign emissions intensity—it is for EITE under domestic emissions intensity reduction of 25
possible to have relatively high leakage percent, assuming no demand effect

rates with small shifts of production. For
example, as shown in Figure 7 (holding
domestic demand constant for
simplicity), if carbon pricing incentivizes
a 25 percent reductionin domestic
industry emissions intensity, and 5
percent of production to shift abroad,
then the leakage rate for the industry
will be 35 and 70 percent respectively if
the emissions intensity of foreign Source: IMF staff calculations.
production is 200, and 400 percent of
that for domestic production16—see further discussion in Annex 2.17

Empirical evidence on national level leakage rates is mixed, though they can be significant and
tend to be larger for small open economies. Most of the empirical literature finds modest or no

15
 International aviation and maritime are internationally mobile sectors but responsibility for mitigating their emissions
lies with the United Nations bodies overseeing these industries.

16
 The approximation for the leakage rate set out in Annex 2 (with D̂ set at zero) of e*/e . Ŷ / (Ŷ + ê), gives 33 and 67
percent for e*/e equal to 2 and 4 respectively.

17
 Note that the leakage calculations in Figure 6 are symmetric in exports and imports: they are the same whether the
domestic country is a net importer or net exporter of the product initially, or whether the leakage occurs through an
increase of imports or a reduction in exports.

 12
evidence of leakage, though in part this Figure 8. Estimated National Level Leakage Rates
may reflect the limited scope of carbon Australia
 Brazil
mitigation policies adopted so far and
 Canada
methodological limitations (see Annex 3). China
One recent study suggests higher EU
 France
leakage rates—while the absolute figures Germany
should be treated with caution, the study India
also provides insight on the pattern of Ireland
 Italy
leakage across countries. On average in Japan
this study (Figure 8) carbon leakage Korea
 Mexico
amounts to 25 percent, with rates varying Norway
from 20 to almost 50 percent in individual Russia
European countries, but less than 15 Turkey
 UK
percent in China, the EU14+UK US
aggregate, India, and Japan, and 7
 0 10 20 30 40
percent in the US. Overall, leakage rates Leakage rate, percent
are larger for small open economies, such Source: Misch and Wingender (2021).
 Note: Estimates for EU countries include leakage from them to
as most individual EU countries—though
 other EU countries and non-EU countries.
that does not mean that leakage is
inherently less of a concern for larger countries, since the absolute level of emissions at stake is larger.

Leakage might also result from increased fossil fuel demand in foreign countries in response to
downward pressure on international fuel prices from countries taking mitigation action. This
form of leakage would be zero for unilateral mitigation for a small country that is a price taker in
international fuel markets but could be significant for a group of larger countries.18 However, as this
form of leakage depends on the reduction in aggregate consumption of fossil fuels in mitigating
countries, it is essentially unaffected by both the form of mitigation instrument (carbon pricing or other)
and any accompanying measures (BCA or other).

National limits on emissions under the Paris Agreement may address leakage, to the extent that
they bite. Under the Paris framework, countries are responsible for production emissions (i.e.,
emissions released within their own borders). Potential emissions leakage in foreign countries (due to
increasing production or fuel demand) might therefore be neutralized by stronger mitigation policies
if those foreign countries honor a binding target on nationwide emissions. In practice however,
pledges for the Paris Accord are voluntary, may not be fully achieved, and they do not always take the
form of nationwide emissions caps.19

18 See, for example, Fischer and Fox (2012), Kuik and Marjan Hofkes (2010).

19
 For example, China and India have set emissions to GDP targets for 2030 which would accommodate some increase
in nationwide emissions if leakage increases their GDP.

 13
C. Promoting Carbon Pricing in Other Countries

Inherent in any BCA is a fiscal incentive for trading partners to impose some carbon pricing—
but the incentive appears modest given the small shares of emissions in trade flows. By raising
carbon pricing on its exports to the level in the BCA-imposing country (thereby eliminating liabilities
under the BCA) a foreign country would transfer tax revenue from the BCA country to itself. This
incentive will be stronger the greater are: (i) the BCA charge; and (ii) the share of CO2 emissions
embodied in foreign countries’ exports to BCA-imposing countries. For illustration, carbon embodied
in EITE exports from China and India to the EU and US are only about 3 percent of China and India’s
domestic carbon emissions—the formal incidence on China and India of a $50 BCA imposed by the EU
and US would be only 0.1-0.15 percent of the former’s GDP (all statistics from this paragraph are from
Figure 9a and b). Moreover, the effective incidence—the burden that remains with Chinese and Indian
producers—is likely to be much lower than this because much of the import charge is likely passed
forward to domestic consumers in the EU and US in the form of higher product prices. All this implies
only a modest incentive for these countries to scale up carbon pricing throughout the wider economy
in response to EU and US BCAs. The incentive would be slightly stronger if a broader range of countries
were to impose BCAs—embodied carbon in EITE exports to all trading partners from China and India
is 10 and 8 percent of their domestic carbon emissions respectively, and the formal incidence would
be approximately 0.45 and 0.3 percent of GDP for China and India respectively. In contrast, embodied
carbon in the EU-27 and US EITE industry exports to the world is only 5 and 2 percent of domestic
emissions, and the formal incidence of a BCA imposed by the rest of the world on them is less than
0.05 percent of their GDP.

 Figure 9. Emissions Shares in Trade Flows and Burdens of BCA on Trading Partners
 a. Fraction of Domestic Carbon b. Formal Burden on Foreign Country
 Emissions Embodied in EITE Exports to from $50 per ton BCA Imposed by
 Trading Partners, 2015 Trading Partners, 2025

 China China

 India India

 EU-27 EU-27

 EU-27 US EU-27 US
 US US
 Canada and UK rest of world Canada and UK rest of world

 0 2 4 6 8 10 12 0.0 0.1 0.2 0.3 0.4 0.5
 Embodied carbon in EITE exports as percent of Formal burden of BCA borne by foreign
 domestic CO2 emissions country , % of foreign country GDP
 Source: OECD (2021). Source: OECD (2021); IMF staff calculations.

BCAs may, however, also promote pricing in other countries in less tangible ways. For example,
as countries reinforce carbon pricing with BCAs, they send a clear message that carbon pricing is the
centerpiece of their mitigation strategy, which may influence other countries deciding how much to

 14
rely on carbon pricing in their own mitigation strategies. In addition, even if BCAs are initially
introduced unilaterally, countries may subsequently coordinate to create border free trading zones
with a common external charge, which may ultimately lead to more formal and comprehensive
arrangements for coordinating over carbon pricing.

A BCA in combination with other incentives could promote participation in an international
carbon price floor (ICPF) arrangement among large emitting countries. The purpose of an ICPF
would be to facilitate a scaling up of global carbon pricing (or equivalent measures) through
coordinated action to address free-rider and competitiveness obstacles that hamper countries when
they act unilaterally. 20 It would be far more effective in scaling up global mitigation than, and
potentially even avoid the need for, BCAs, given BCAs price only carbon embodied in trade flows rather
than all emissions (see Annex 4). BCAs might be applied by ICPF participants to non-participants,
though this could complicate discussions over designing the ICPF, due to the need to agree on terms
for the BCAs as well as for the ICPF itself.

 3. Design Issues for BCAs

Designing a BCA is challenging, as there are multiple objectives and design features to consider.
Beyond the three focused on above, other objectives include preserving domestic mitigation incentives,
raising revenue, and limiting both administrative/compliance burdens and risks of WTO challenges.
Legal risks are difficult to gauge ex ante, not least because trade rules were written before the recent
attention to BCAs—they are discussed in Annex 5. In essence, WTO rules permit countries to adopt
harmonizing measures (e.g., BCAs) for indirect taxes and a key uncertainty is whether carbon pricing
counts as an indirect tax (likely more difficult for an ETS than a carbon tax). There is also uncertainty
about whether a charge varying by the exporting country’s carbon intensity would violate the Most
Favored Nation (MFN) principle which precludes differentiation based on the country-of-origin of the
imports. If a BCA does not meet these rules, it might nonetheless qualify as an exception under Article
XX if it is viewed as addressing environmental issues (i.e., emissions leakage), though demanding legal
tests must be met in this case. Table 1 summarizes the implications of design features for meeting
multiple objectives; the discussion below elaborates on the main points. 21

The discussion below does not distinguish between BCAs in the form of an import tax versus an
allowance purchase requirement, as the latter can be designed to mimic the former, though
price uncertainty may be greater. A simple requirement to acquire allowances from a domestic ETS
to cover embodied carbon for imported products (without changing the total allowances available in

20
 See Parry and others (2021).

21
 See also OECD (2020).

 15
Table 1. Design Choices for BCAs and How they Affect Multiple Objectives
 Design Feature
 Measuring embodied carbon
 Sectoral coverage:
 Recognize Lowering import
 EITE industries vs. Rebates for Exemptions for
 foreign firms charges for
 broader (all Domestic vs. country- domestic Revenue use least developed
 Metric with lower carbon pricing
 manufacturing, specific benchmarks exporters countries
 embodied abroad
 services, etc.)
 carbon
 Country-specific
 Protecting Either approach preserves relative Preserves Appropriate for
 competitiveness of provides same domestic/foregin Little relevance competitveness Little relevance preserving level Little relevance
 EITE industries protection prices despite carbon of exports playing field
 pricing
 Broader coverage
 addresses leakage for Country-specific
 Can help reduce
 Limiting leakage more products but addresses leakage Little relevance Reduces leakage Little relevance Little relevance
 leakage
 the benefits may be more efficiently
 modest

 Promoting Broader coverage Country-specific Promotes pricing
 Gives incentive on
 mitigation and increases the base of provides stronger but direct
 foreign firm to Little relevance Little relevance Little relevance
 carbon pricing in charges on imports incentives on foreign incentives may be
 reduce emissions
 other countries from trading partners producers and govts. modest

 Mitigation Preserves
 incentives for Either approach Either approach incentives if
 Little relevance Little relevance Little relevance Little relevance
 domestic EITE preserves incentives preserves incentives designed
 industries appropriately

 Broader coverage Country-specific raises
 increases revenue more revenue if
 Revenue Small reduction Forgoes some
 from import charges trading partners have Loses revenue Not applicable Reduces revenue
 implications in revenue revenue
 (and revenue losses higher embodied
 from export rebates) carbon
 Complex for broader
 coverage (more Administration for Small if third Additional Adds to burden,
 Administrative
 products, difficulties country-specific is parties provide burden but Not applicable limited by EITE Modest reduction
 burden
 in measuring more complex verification modest focus
 embodied carbon)
 Using revenues May increase
 Rebuttability
 Risk of legal Leakage rationale Domestic might help May be for green legal risks if not
 provison should
 challenge under more questionable by reducing tariff and challenged as a transtion or intl. applied equally Possible
 help with WTO
 WTO for broader BCA showing like treatment subsidy finance may and equivalently
 compatibility
 reduce legal risks across countries
 Domestic initially to Yes
 Consider
 Preliminary EITE ease transition; (or mutual BCAs
 Yes Yes environmental Yes
 recommendation (at least initially) later aim for each with export
 uses
 country- specific rebates)

 Source: IMF staff.

the ETS) may be undesirable as it would put upward pressure on, and increase uncertainty about,
allowance prices—embodied carbon in EITE imports to the EU in 2015, for example, was equivalent to
about 15 percent of the allowable ETS cap.22 One approach would be to require importers to purchase
allowances from a separate pool where the allowance price is aligned with the domestic ETS price—

22
 Calculated from EEA (2021) and Wiebe and Yamano (2016).

 16
this scheme would be operationally equivalent to an import tax. Administration is a little more complex
under an allowance purchase requirement than under a tax as customs officials may need to
collaborate with environment ministries monitoring the ETS or a separate allowance pool.

What sectoral coverage (EITE industries or broader)?

Limiting the BCA to EITE industries, at least initially, may make sense on competitiveness,
targeted leakage, administrative, and legal grounds. Competitiveness and leakage concerns are
less severe for sectors like non-EITE manufacturing and services with low carbon intensity. The narrow
focus also limits administrative burdens—products would need to be classified as EITE and non-EITE,
but this should be straightforward given clearly specified criteria. Determining embodied carbon (with
input-output tables and emissions factor data) is also relatively straightforward for the raw materials
that many EITE industries produce. This narrow focus may also limit legal risks because the motivation
based on leakage is more transparent and credible for EITE products than for products with low
embodied carbon.

A broader BCA would more comprehensively address competitiveness and leakage and provide
stronger incentives for carbon pricing elsewhere—but its near-term administrative practicality
is questionable. Extending the BCA coverage to include charges on imported non-EITE manufacturing,
services, mining, and perhaps electricity, combined with corresponding export rebates, would address
competitiveness and leakage issues for a broader range of sectors, though these benefits may be small
where carbon intensities are low. Incentives to shift “carbon imports” further down the production
chain would be avoided, and charges collected from trading partner imports would also be larger. The
biggest question about broad BCAs, however, is their practicality. Besides the additional administrative
and compliance burdens of collecting charges on a much broader range of sectors, there are also
considerable challenges to measuring embodied carbon, for example for services, and high value
manufacturing products.24

How to measure embodied carbon?

Country-specific benchmarks for embodied carbon in particular products would most directly
address the objectives of BCAs. Using emissions-intensity data specific to the foreign exporting
country addresses the three main rationales for BCAs: it preserves the relative costs of equivalent
domestic and foreign products despite carbon pricing; trading partners for whom leakage risks are
greater (due to higher embodied carbon) are accordingly subject to higher charges; and foreign
governments with higher emissions intensities have stronger incentives to implement carbon pricing
to avoid the BCA. This differentiation is important given the dispersion in embodied carbon within

24
 See for example Marcu and others (2020), OECD (2021), Prag (2020) and Wiebe and Yamano (2016).

 17
product groups across countries— Figure 10. Embodied Carbon by Product and
accounting for both direct and indirect Sector, 2015
emissions is also important (Figure 10). US

Using domestic emissions-intensity UK

benchmarks would be less effective in
achieving BCA objectives but may be Russia

appropriate over some transition to limit indirect
administrative complexities and formal India

burdens on trading partners. Use of direct
 Germany
domestic benchmarks would provide little or
no incentive for foreign exporters to reduce China
emissions and would imply (if the
benchmark is updated) that, as domestic Canada

industries incur abatement costs in response
 0 500 1000 1500 2000 2500 3000
to carbon pricing, this would in turn lead to CO2 metric tons per million $USD of output
lower charges on competing imports even Wood Textiles Chem./Pharm. Basic Metals
 Source. IMF (2021b).
 Source: IMF staff calculations based on OECD Input-Output
though their emissions may not have
 Tables.
changed. Administration is simpler for
domestic benchmarks however as it avoids the need to calculate a different set of charges for each
country. Emerging market economies (EMEs) would also face much lower formal burdens if the US or
EU imposed a BCA based on domestic rather than country-specific benchmarks (Figure 11). WTO
concerns may also be eased given uncertainties about whether charges can vary across countries with
carbon intensity. A pragmatic approach may be to use domestic embodied carbon initially (most
obviously the industry average rather than that of the cleanest firms) while the BCA is being established,
with a view to transitioning to country-specific BCAs over time.25

If charges vary by country, a further issue is whether to use industry-, or firm- (even plant-) level
measures of embodied carbon. In principle, it would be more precise to use to use firm-level
measures given the heterogeneity of production methods within many EITE industries 26 and this
approach might be least likely to raise WTO concerns. It would greatly add to administrative complexity,

25 Other possibilities include: (i) using a global average emission benchmarks, which could be a middle ground between
the two extremes of domestic and foreign benchmarking; and (ii) using foreign emissions intensities, but varying the
carbon price in the BCA according to development status (to respect “common but differentiated responsibilities” as
per the ICPF proposal, see Parry and others, 2021). However, both may raise their own legal issues.

26
 For example, in steel production there are a variety of traditional (e.g., using coal combustion) and emerging (e.g.,
using coal gasification) technologies with very different emissions intensities (e.g., van Ruijven and others 2016).

 18
however, and consistent data on embodied carbon by firm, product, and country would need to be
developed and approved. For now, using industry-level data may be the more practical approach.

 Figure 11. Potential Revenues from Border Carbon Adjustments on Energy-Intensive,
 Trade-Exposed Imports with $50 Carbon Price, 2015
 USA EU27

 China China

 Canada Russia

 Mexico United States

 EU27 South Africa

 Japan India

 Korea UK

 India Country Turkey Country
 Russia Benchmark Japan Benchmark

 Taiwan Domestic Korea
 Domestic
 Benchmark Benchmark
 South Africa Brazil

 0 2 4 6 8 10 12 14 0 2 4 6
 Revenues raised ($USD, billions) Revenues raised ($USD, billions)

 Source: IMF staff estimates using Organisation for Economic Co-operation and Development (2020).

A ‘rebuttability’ provision allowing individual firms to claim rebates on the basis that their embodied
carbon is lower than this average (subject to third-party verification or risk of audit), should improve
WTO compatibility (Annex 5). There could be a risk of gaming, however, if the BCA induces firms to
switch production from their cleaner plants for export to the BCA-imposing jurisdiction while
redirecting products from their dirtier plants to other countries.

Rebates for domestic exporters?

Rebates for domestic carbon pricing on embodied carbon in domestic exports27 are in principle
warranted on competitiveness, and potentially on environmental, grounds. Rebates offset the
increase in cost of domestic exports relative to foreign products caused by domestic carbon pricing—
this preserves the competitiveness of the average exporter and limits leakage (as discussed in Section
2 and Annex 2, leakage is symmetric across imports and exports). Indeed, preserving export
competitiveness may reduce global emissions if the emissions-intensity of production is lower at home

27
 Analogous, in economic effect, to the zero-rating of exports under the VAT.

 19
than abroad. Rebates would vary strongly
 Figure 12. Embodied Carbon in EITE Imports and
across countries—for example, embodied Exports, 2015
carbon in EITE exports is 10 percent of
 China
domestic emissions in China and 8
percent in India, though only 2 percent for India

the US (Figure 12). Rebates should be EU-27
based on firms’ overall production, or
 Exports Imports
industry-wide benchmarks, to avoid US
incentives for using more emissions-
 0 2 4 6 8 10
intensive production for export. Embodied carbon in EITE imports/exports as
 percent of domestic CO2 emissions
Export rebates reduce BCA revenues in Source: OECD (2021).
themselves, but from a broader
 Figure 13. Revenues from $50 BCA, 2015
perspective are likely to enable higher
carbon pricing and revenue. A $50 per China
ton BCA on imports would have raised
revenues from import charges of around India
0.1-0.2 percent of GDP in China, India, EU-
27, and US in 2015 (Figure 13). Export
 EU-27
rebates would offset 25 and 60 percent of
 with export rebate
the revenues from import charges on EITE
 US without export rebate
products in the US and EU-27
respectively—while in China and India -0.4 -0.3 -0.2 -0.1 0.0 0.1 0.2
revenue losses from export rebates would Revenue gains from BCA, percent of GDP
substantially outweigh revenues from Source: OECD (2021).

import charges (Figure 13). These effects are minor, however, compared to the overall revenue gain
from comprehensive pricing of domestic carbon emissions—indeed carefully designed export rebates
may help pave the way for more ambitious domestic carbon pricing and, hence, revenue.

What use to make of the revenue?

Such revenue as is raised by a BCA might be used in ways that reduce legal risks by increasing
the likelihood of its being considered as an environmental (rather than protectionist) measure.
Legal risk might be reduced if revenues are earmarked for green investment, just transitions, or
international climate finance—though the usual difficulties of ensuring true additionality of earmarked
funds, and of earmarking more generally, will apply.

How to adjust import charges for carbon pricing or other mitigation efforts abroad?

 20
The interaction of a BCA with carbon pricing abroad involves balancing key economic,
environmental, and legal issues. The measures needed to achieve the central objective of equating
the domestic treatment of imports with that of domestic production depend on whether or not the
exporting country rebates whatever tax it charges its own producers. If it does not rebate, then there
is a clear case for reducing the carbon price charged in the BCA by the amount of carbon pricing in
the exporting jurisdiction. If the foreign country does rebate—perhaps as part of its own BCA
arrangement—then all that is needed is to charge the full domestic tax upon import.29 From a wider
political or environmental point of view, it may also seem appropriate to exempt from a BCA exporting
countries that have “done enough” to meet mitigation goals under the Paris Agreement—even if that
means lower carbon pricing than in the domestic economy (or non-price mitigation methods). There
is no single “best” approach here, but some considerations follow.

Lowering the BCA rate for imports from a country with carbon pricing but no rebating on
exports seems appropriate for competitiveness and leakage, as discussed above, but is subject
to data requirements and legal questions. Charges on embodied emissions in EITE products will
largely depend on prices for industry and power sector emissions—pricing for residential and transport
fuels have little relevance for production costs for EITE industries. Up-to-date details on carbon pricing
for the power and industry sectors are widely available31 and historically fuels in these sectors were
largely untaxed, or subject to minimal excises in terms of CO2 equivalent taxes. 32 But adjustments
would be needed if foreign firms are subject to emissions pricing but receive free allocations.
Conventions might also be needed to account for volatility in exchange rates and in overseas emissions
prices. Legally it may be difficult to justify why and how the BCA rate is differentiated across countries.

An alternative approach would be for trading partners both using carbon pricing to each
maintain separate BCAs with export rebating.33 This would follow the model for border adjustment
used for VAT. In economic terms this approach is similar to the case when the BCA-imposing
jurisdiction adjusts the charge for carbon-pricing but is more straightforward legally and
administratively.34 It also accommodates the case where the foreign country imposes a higher carbon

29
 One issue that arises under the former approach is how to deal with the ‘excess credit’ case in which the foreign
carbon tax exceeds the domestic.

31
 For example, many ETSs are limited to these sectors. See WBG (2021).

32
 See IMF (2019b), pp. 91-93, OECD (2019).

33
 This approach is recommended, for example, in Flannery and others (2020).

34 However, one issue is that some industries might be classified as EITE in one country but not in a trading partner.
This could be a problem with separate schemes with export rebates: a good not covered by a BCA would get no rebate
on carbon tax paid when leaving one country but would still be subject to BCA entering the other country, implying
double taxation. This could suggest a need to agree a common list of identified EITE industries across countries.

 21
price than the domestic jurisdiction and depends less on international cooperation. Adjustments or exemptions to a BCA to recognize other countries’ mitigation efforts raise conflicting issues. The Paris Agreement embodies the concept of “common but differentiated responsibilities”, which can imply lower carbon prices are needed for EMEs compared to advanced countries. Or countries might meet their Paris commitments using non-pricing instruments. In either case, exemptions from a BCA could be justified from the perspective of international environmental cooperation, and potentially from a leakage perspective (if Paris commitments are regarded as binding in levels terms on both sides, as per discussion in Section 2.B above). On the other hand, such exemptions would generally not be warranted from a narrow EITE competitiveness perspective, since lower carbon prices, or non-price measures, generally impose lower private costs on foreign exports than on domestic production. And the legal justifications for adjustments or exemptions based on interpretations of trading partners’ price and non-price mitigation policies might be questioned from a WTO perspective of non-discrimination. Exemptions for least development countries? Applying a lower BCA rate for exporters in least developed countries (LDCs) would make LDC exporters more competitive (relative to applying a full BCA to them) with little at stake for BCA- implementing countries, and might be WTO compatible. Excluding LDCs would, in a blunt way, be consistent with the principles of equity and common but differentiated responsibilities, and it may be consistent with the WTO’s Enabling Clause, if the exemption criteria are based on objective development indicators (Annex 5). Country-based exemptions would need to be designed to prevent the trans-shipment of goods from covered countries through exempted countries, requiring rules of origin; while these might well prove burdensome, they may nonetheless be warranted.35 4. BCAs versus Alternative Instruments The strength of any case for BCAs also depends on the potential for addressing the multiple objectives above through other instruments. These other instruments—see Table 2 on what some countries are currently using—might include: Exempting all, or some, of the emissions from EITE industries from carbon pricing (in a downstream pricing program), as in South Africa, or rebating them for carbon prices implicit in fuel and electricity inputs (in an upstream pricing program); 35 Such regimes are in place for most regional trade agreements as part of their rules-of-origin requirements. See www.wto.org/english/tratop_e/roi_e/roi_info_e.htm. 22
Allowing EITE industries to participate in a tradable emissions rate standard (i.e., where firms can fall short of the standard if they buy credits from firms exceeding the standard) in lieu of carbon pricing, as in Canada, which is another way of limiting charges on firms’ remaining emissions after they meet the standard; Granting free allowance allocations related to industry benchmarks and past emissions for relatively clean producers for EITE industries (under an ETS) which are cancelled if firms shut down or move abroad, as in California, the EU, Korea, and New Zealand. While these are effectively lump sum payments with no immediate impact on current direct emissions, they do impact profitability in a way that dulls the incentive to relocate abroad. Table 2. Assistance Measures for EITE Industries in Selected Countries/Regions with Carbon Pricing Country/region with Assistance Measure carbon pricing Canada A tradable emission rate scheme. California Free allowances under the ETS. BCA applies to imported electricity. EU Free allowances under the ETS but planning transition to BCA. Korea Free allowances under the ETS to qualifying EITE industries. Netherlands Levy on emissions above bechmark level (based on relatively clean firms) EITE facilities receive free allowances of 60-90 percent of the industry New Zealand benchmark. South Africa Exemptions for the first 70 percent of emissions from the carbon tax. Source: WBG (2021). Note: Free allowances are typically based on firms' historical production and industry benchmarks for emission rates based on relatively clean producers. This is not an exhaustive list, but other possibilities have approximately equivalent effects to one of the above instruments. For example, feebates 36 or returning the revenues from carbon pricing collected from EITE industries in output-based rebates to those industries, are both broadly equivalent 36 Feebates apply a sliding scale of fees/rebates on products with above/below average emission rates (see IMF 2019a, Annexes 1.4 and 1.5). 23
to the tradable emission rate standard (all three approaches encourage EITE industries to reduce their
emissions per unit of output but, to an approximation, not to reduce their level of output). Table 3
summarizes how different instruments perform against the key metrics of concern to policymakers. 37

 Table 3. The Choice of BCAs versus Other Instruments
 Exemptions for EITE
 Tradable emission Free allowances
 Metric BCAs industry emissions
 rate standard under ETS
 from pricing

 Full exemption is less
 Protecting
 effective (if it does not
 competitiveness of Yes Partially Partially
 apply to indirect
 EITE industries
 emissions)
 Yes (though less Full exemption is less
 effective with effective (if it does not
 Limiting leakage Partially Partially
 domestic industry apply to indirect
 benchmarks) emissions)
 Promoting
 mitigation and
 Modest incentive No incentive No incentive No incentive
 carbon pricing in
 other countries
 Mitigation Full exemption remove
 incentives for incentives for direct Reduces emissions Maintains all
 Yes
 domestic EITE (but not indirect) per unit of output incentives
 industries emissions
 Preserves revenue
 Revenue
 from pricing Forgoes revenue Forgoes revenue Forgoes revenue
 implications
 domestic emissionsa
 Significant if
 Administrative
 coverage beyond Modest Modest Modest
 burden
 EITE products

 Risk of legal Could be challenged
 Depends on design
 challenge under na na as subsidy but has
 features
 WTO not been

 Source: IMF staff.
 Note. aThe BCA itself raises additional revenue (unless forgone revenue from export rebates
 exceeds collections from import charges).

BCAs are potentially more effective than other instruments in addressing competitiveness and
leakage. This is especially the case if the BCA varies across trading partners according to embodied
carbon and includes export rebates (see above). Exemptions for EITE industries from carbon pricing
would be less effective unless they also included compensation for charges on indirect emissions (and
import prices would not vary across countries depending on emissions intensity). Tradable emissions

37
 For further discussion of instrument choice issues see Fischer and others (2015). There may be some transitory overlap
between instruments, for example, if BCAs are introduced before free allowance allocations in a domestic ETS are fully
phased out. In this case, the BCA charge on foreign exports should apply to embodied carbon net of emissions that
would have received free allowances under the domestic ETS.

 24
You can also read