THE NEXT AGE OF AGRICULTURE - John Lohrentz - Tax Policy Charitable Trust
←
→
Page content transcription
If your browser does not render page correctly, please read the page content below
By progressively taxing biological
              methane emissions, we can support
              agricultural R&D to transform how we
              farm.

              John Lohrentz
              Deloitte

   THE NEXT
     AGE OF
AGRICULTURE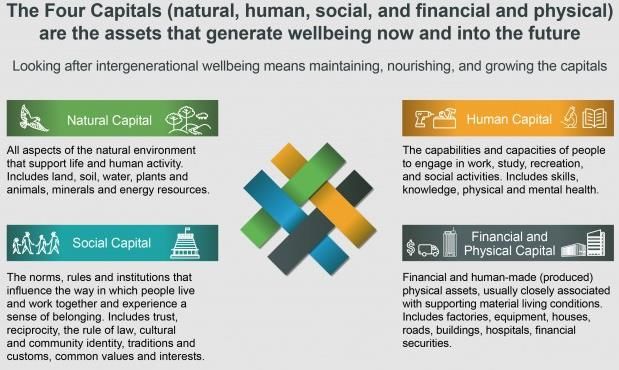
John Lohrentz

            Te toto o te tangata he kai,
        te oranga o te tangata he whenua

      While food provides the blood in our veins,
          our health is drawn from the land

-1-                                         The next age of agriculture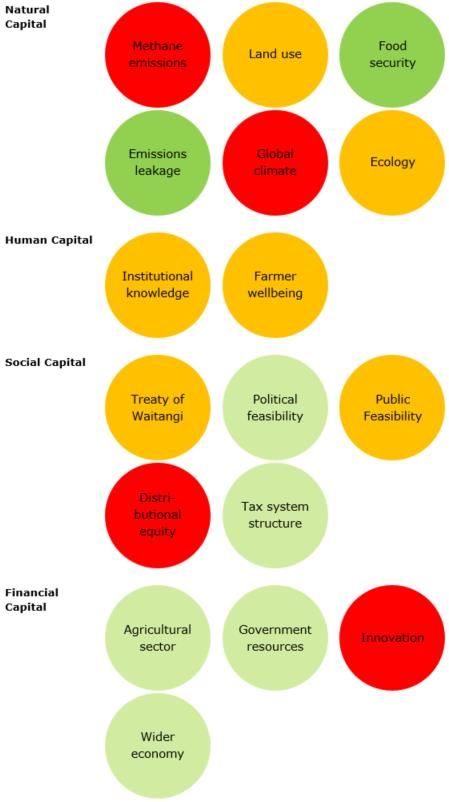
John Lohrentz

Pretext1
Ministry for the Environment proposal
The Ministry for the Environment (“MFE”) has            2017 National Emissions
released a proposal to price livestock
emissions using a farm-level levy/rebate                                                     48 %

scheme (July 2019).2 I was not aware of
MFE’s work when making my original
submission and therefore will respond to it in
this Proposal.

Wider policy environment
Following the Paris Agreement, the Climate
Change Response (Zero Carbon) Amendment
Bill proposes two “National Targets”:3                Agriculture          Transport
1. Reduce gross biological methane emissions          Process heat         Electricity generation
                                                      Other
    by 24-47% below 2017 levels by 2050 (&
    10% below by 2030); and
2. Reduce net emissions of all other greenhouse gases (“GHGs”) to net zero by 2050.

In this Proposal, I assume that if Agriculture meets the National Targets it has made a
fair contribution to NZ’s national emissions reduction journey.

1
  Words: 8,123, excluding Appendices and References.
2
  The proposal is based on a report by the Interim Climate Change Committee
(“ICCC”): Action on Agricultural Emissions (April 2019).
3
  Page 4 of Explanatory Note, Zero Carbon Bill 136-1.

-2-                                                             The next age of agriculture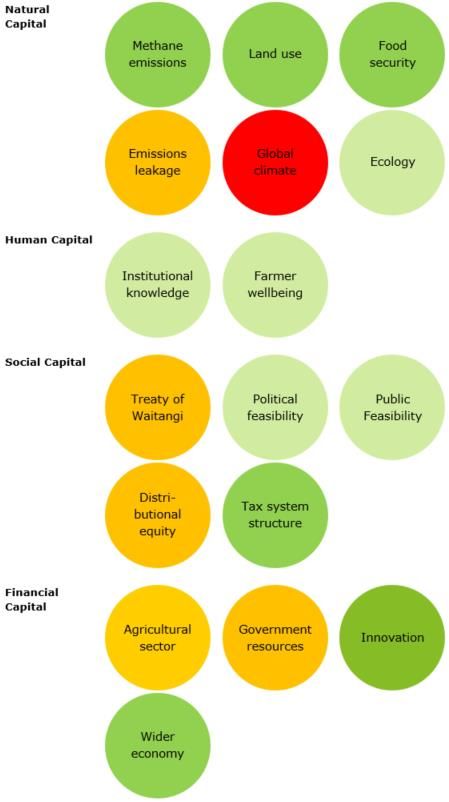
John Lohrentz
The next age of agriculture
NZ’s engine room4
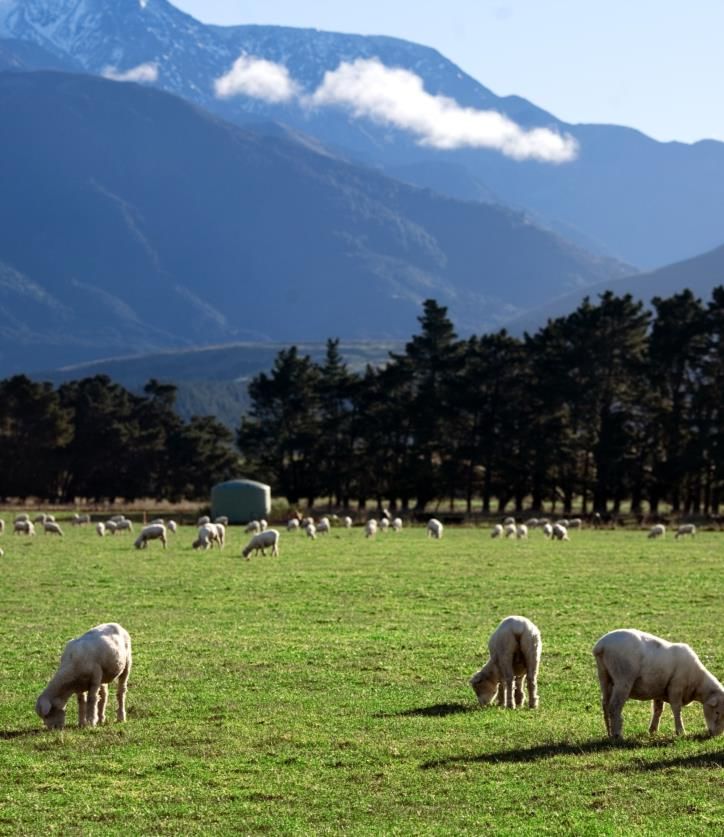
Agriculture5 is humankind’s first and greatest revolution. Early in our development we
mastered the art of systematically (re)producing everything from milk and meat to
wood and wools. NZ Agriculture exports NZ$ 42,682m6 (80% of our international
trade) and employs 15% of the population (creating 11% of GDP).7 Our farmers
efficiently feed an estimated 50 million people.8 And while value and production has
grown over the last 25 years, farmers have also decreased GHG emissions intensity by
20%.9
Agricultural export revenue vs GHG emissions, 2004-2023(f)10
60,000 2.00
1.80
50,000
1.60
1.40
40,000
$NZ million
1.20
30,000 1.00
0.80
20,000
0.60
0.40
10,000
0.20
0 -
2019F
2020F
2021F
2022F
2023F
2004
2005
2006
2007
2008
2009
2010
2011
2012
2013
2014
2015
2016
2017
2018
Other primary sectors Dairy, Meat & Wool CO2e (kt) emissions / $NZ
4
MPI (June 2019) Situation and Outlook for Primary Industries, page 8.
5
Agriculture generally includes dairy, meat and wool, forestry, horticulture, seafood
and Arables; For this Proposal “Agriculture” emissions specifically refers to dairy and
drystock.
6
MPI (June 2019) Situation and Outlook for Primary Industries, page 5.
7
MPI (June 2019) Situation and Outlook for Primary Industries, page 62.
8
StuffNZ article.
9
See Appendix 2; See ICCC (2019) Action on agricultural emissions, [3.3] and [14.1].
10
MPI (June 2019) Situation and Outlook for Primary Industries; MFE (2019) New
Zealand's Greenhouse Gas Inventory 1990–2017, CRF summary data; MFE (2017) New
Zealand’s Seventh National Communication, [5.3.4].
-3- The next age of agriculture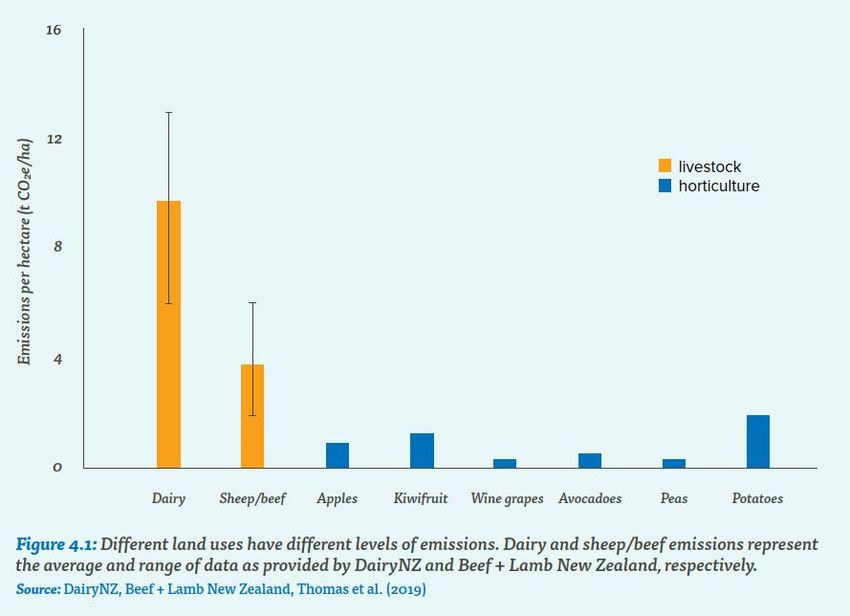
John Lohrentz

Transformational prospects
Consumer expectations are creating new markets for more sustainable products - zero-
harm primary production is a modern differentiator! Danone, the global #1 retailer of
fresh dairy products (2018: €5billion), has recently redesigned its strategic brand
model to focus on preserving natural capital, with a 2030 goal of having a net-zero
emissions supply chain.11 Allied Market Research (US) indicates that the “organic dairy
food and drinks market [is] expected to reach $36 billion by 2022 from $14.5b [2017],
an annual growth rate of 14.25%.”12 And the businesses that voluntarily report to the
Carbon Disclosure Project foresee up to US$ 2.1 trillion of business opportunities from
the emerging sustainable economy.13 For sustainable farming, there is a huge
opportunity ahead.

Yet Fonterra notes that “the way the world is collectively producing food is depleting
natural resources and creating waste faster than our planet can cope with”.14 Our
imminent (and immense) challenge sits at the intersection of population growth (food
security), ecological crisis and climate change (conditions for farming).15 In response
NZ Agriculture is “[shifting] from high-volume to high-value produce”.16

“With New Zealand’s natural environment and some of the world’s most effective
farmers, we’re well positioned to lead change” 17 – a highly efficient, highly sustainable
and highly innovative future for NZ Agriculture lies ahead.

This conviction is the fundamental basis for this Proposal.

11
   https://iar2018.danone.com/danone-in-2018/our-2030-goals-and-innovative-
governance-model/; ICCC (2019) Action on agricultural emissions, [12.2].
12
   StuffNZ (March 2017).
13
   Bloomberg (June 2019).
14
   Fonterra (2018) Sustainability report, page 8.
15
   See Appendix 2.
16
   StuffNZ article.
17
   Fonterra (2018) Sustainability report, page 8.

-4-                                                            The next age of agriculture
John Lohrentz
Why use tax?
Tax is not a silver bullet for every problem. But while other options could reduce
methane emissions, a tax-based policy approach will:
Align better with methane’s characteristics, especially that we need to
maintain emissions above zero to sustain food production; and
(If designed well) work efficiently, fairly and reliably
Methane is unique
Due to the warming effect of methane, good climate change policy must intelligently
involve Agriculture. Tonne for tonne, methane’s climate warming potential is higher
than carbon dioxide (“CO2”) for the first 200 years.18 Yet CO2 can have a more
damaging long-long term effect as its stays in the atmosphere, accumulating for
several hundred years. We need to reduce CO2 emissions to zero by 2050 or soon
after;19 but methane, once reduced to a reasonable level, can be emitted at a constant
rate.20 Linking methane and CO2 under a universal price mechanism (i.e. NZ Emissions
Trading Scheme, “ETS”) will muddy the incentives for farmers so it needs to be treated
differently in policy. What is a reasonable level of methane is a policy decision, an
emissions budget allocation.
Warming potential
18
ICCC (2019) Action on agricultural emissions, [3.2].
19
The Guardian (October 2018).
20
ICCC (2019) Action on agricultural emissions, [3.2].
-5- The next age of agriculture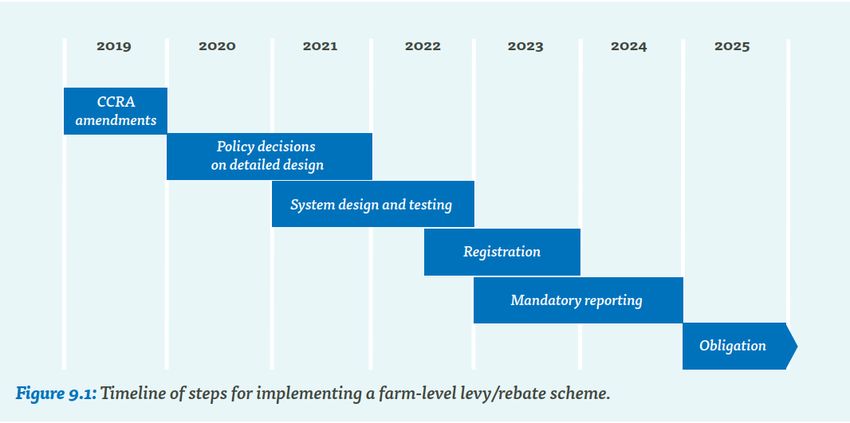
John Lohrentz

Practical reasons
The Productivity Commission, Tax Working Group (“TWG”) and Parliamentary
Commissioner for the Environment (“PCE”) all prefer a price mechanism to address
biological methane. For the TWG, GHGs “meet the criteria of the Group’s framework”
for taxing negative environmental externalities (a wide range of existing abatement
choices).21 The Productivity Commission thinks price mechanisms are generally least-
cost, fair and reliable.22

In reality, the other options are impractical. The main alternative to a tax is bringing
all gases and all sectors into the NZ ETS – one emissions price for all (or maybe dual-
caps). This is problematic because all GHGs and offsetting options are not
substitutable actions;23 so a universal price could compromise strategic reduction
choices in order to get a “net zero accounting triumph” – i.e. we may overinvest in
forestry and not sufficiently reduce GHG emissions in the right places.24

21
   See [37], Tax Working Group Final Report Volume 1.
22
   Productivity Commission Report, See R9.6 and page 110. While they ultimately
preferred dual-capping the NZ ETS, the PC did consider tax.
23
   Parliamentary Commissioner for the Environment Report, page 9.
24
   Parliamentary Commissioner for the Environment Report, page 14.

-6-                                                           The next age of agriculture
John Lohrentz
1. Tax biological methane emissions
The MFE & Interim Climate Change Committee (“ICCC”), collectively “the
government”, recommends:25
Applying a levy-rebate which integrates with the NZ ETS;
Annually setting the levy rate using a single price or dual-price approach.
I propose:
Separating policy for methane and CO2 / other gases;
Progressively taxing biological methane;
Setting and revising the tax rates based on the incentive farmers need to
reach the National Targets.
Point of obligation
The government proposes to price “livestock emissions”26 annually at farm-level from
2025.27
I propose to price biological methane emissions at farm-level from 2025.
Applying a tax at the farm-level means farmers make choices and directly experience
the correlating outcomes.28 This has several benefits:
Autonomy Farmers’ decide what is best for their farm and pocket.29
Least-cost Farmers’ balance investment, tax and compliance costs to decide
on the best response.30
25
ICCC (2019) Action on agricultural emissions, [14.1].
26
This term includes more than methane – my policy focuses on biological methane
only.
27
MFE (2019) Action on agricultural emissions, page 10.
28
ICCC (2019) Action on agricultural emissions, [7.1].
29
ICCC (2019) Action on agricultural emissions, [4.1].
30
ICCC (2019) Action on agricultural emissions, [6.3].
-7- The next age of agriculture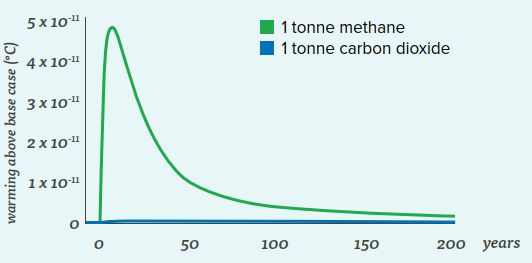
John Lohrentz
Innovation Farmers’ share wins as your neighbours’ performance doesn’t
impact your tax obligation/credit.
Speed Stronger incentive to adopt new technologies and practices
quickly.31 Direct periodic reward for strategic sustainable
behaviours.32
Measurement The unique characteristics of each farm are reflected in the
fairness outcomes.
First-mover Early adopters are rewarded and there is no free-rider problem.
advantage
Unique The tax rates can be set differently for different types of farming
targets and geographies – depending on technical analysis from Treasury.
Participants
The government proposes to apply the levy/rebate to “farmers”
I propose to:
Define “qualifying farmers” as economically significant dairy and drystock
farmers.
Use ‘those required to be registered for GST’ as a proxy for economic
significance.
Allow farmers to group: individuals, consolidated groups, or as a collection of
taxpayers with joint and several liability, as preferred.
31
ICCC (2019) Action on agricultural emissions, [7.1].
32
ICCC (2019) Action on agricultural emissions, [6.3] and [7.1]; MFE (2019) Action on
agricultural emissions, page 8.
-8- The next age of agricultureJohn Lohrentz
Who is a “Qualifying Farmer”
Section YA 1 of the Income Tax Act 2007 does not currently have a sufficient definition
of “farmer”. I define a “qualifying farmer” as: A person carrying on a farming or
agricultural business on land in New Zealand, where the activity involves keeping
ruminant livestock.
“A person” means the definition is agnostic on organisational model.
Participants will be easily identifiable by tax identification number.
Farmers must be “in business”, in NZ.
Intentionally includes multi-functional farms.
This definition should only apply to “economically significant”33 dairy and drystock
farmers (i.e. not micro-farmers, small lifestyle blocks or multi-functional farms with
only a few ruminant livestock) – marginal benefit vs. cost. Exclude:
Person’s not required to register for GST;
Other groups determined but the Commissioner, in the future.
Noting that some multi-functional entities will register for GST for reasons other than
farming of ruminant livestock, and that conditions may change in the future, this
definition is flexible. It is also better than excluding by land size as deer, beef, sheep
and dairy farms can vary greatly in size by make similar revenues.
Grouping
I prefer allowing farmers to intuitively group to meet the tax obligation. The
measurement tool (Overseer) may be more efficiently applied to a group of farms:
Declare groupings in first supplementary return.
Taxpayers must be able to separately identify their emissions profile; and
Groups agree to joint and several liability.
33
KPMG / MPI (2013) Reporting agricultural emissions at farm-level.
-9- The next age of agricultureJohn Lohrentz
Pricing mechanism
The government proposes to:34
Calculate net obligation = (emissions – free allocation) x levy rate.
Give farmers a 95% free allocation for emissions.
Reduce the free allocation over time by a pre-agreed process.
The government is also looking at allowing farmers to net off their emissions at
the farm gate by counting sequestration from forestry that is and is not in the NZ
ETS.35
I propose to:
Set an annual target rate of methane emissions per unit of production (the
“Threshold”)
Base the Threshold on our National Targets, and expected growth rates.
Farmers that are below the Threshold pay no tax. Farmers above the
Threshold have a tax obligation calculated using a system of progressive
rates.
The Threshold decreases annually based on a pre-determined schedule that
is reviewed five-yearly as part of national emissions budget process.
No sunset clause. But a review in 2050 to consider adding a termination
date.
I will use the Dairy industry (2020 – 2030) to illustrate this Proposal (as more data is
available). See Appendix 1 for model notes.
Key issues with the government’s proposal include:
1. A highly effective farmer may still have to pay – the proposal therefore prefers
forestry investment over emissions reductions (as you can only go negative
emissions with forestry).
2. The flat levy rate does not recognise the compounding impact of additional
methane emissions.
34
ICCC (2019) Action on agricultural emissions, [14.4].
35
ICCC (2019) Action on agricultural emissions, [11.4].
- 10 - The next age of agricultureJohn Lohrentz
Design around a target
Carrots are better than sticks. Farmers’ behaviour will more likely change if they’re
rewarded for hitting an annual target, relative to their units of production (fairer across
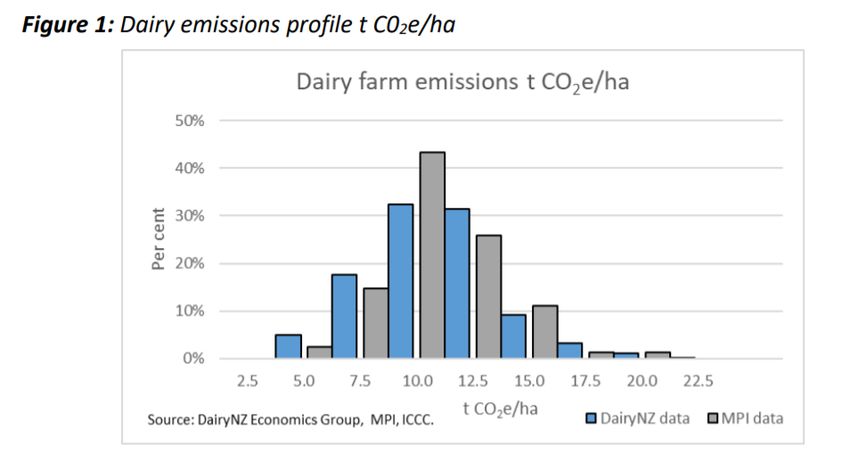
all agricultural groups). Currently, the estimated distribution of methane emissions per
10,000L of milk production is roughly:
50% 2020 Distribution of emissions
45%
40%
35%
Proportion of Dairy emissions (%)
30%
25%
20%
15%
10%
5%
0%
tCO2e / 10,000 litres of milk
2020
Average emissions per 10,000L milk 8.56
Total emissions (tCO2e)36 17,734,435
Production (litres of milk) 20,723,511,090
To reach our National Targets the above distribution needs to shift left, i.e. sufficient
reductions so the average sector emissions decrease from 8.56 tCO2e / 10,000L milk
to 7.36 in 2025, and 6.32 in 2030.
36
“tCO2e”: tonnes of CO2 equivalents (measure of methane).
- 11 - The next age of agricultureJohn Lohrentz
“The Threshold”
I recommend that MFE/IRD set a target rate of emissions per unit of production (for
Dairy and Drystock), starting in 2025 and then annually.
Note that in 2020
26% of farmers are already below the 2025 target;
14% are below the 2030 target.
Target Thresholds vs. 2020 Distribution
50%
2020 Average: 8.56
45%
2025 Target:
40% 7.36
35%
Proportion of Dairy emissions (%)
30%
2030 Target:
25% 6.32
20%
15%
10%
5%
0%
tCO2e / 10,000 litres of milk
Between 2025 and 2050, I recommend that “the Threshold” is lowered based on the
national GHG inventory, growth rates and agricultural responsiveness. Align the rates
every five years when the national emissions budget is set. Alternately, if behaviour
change is expected to be more dynamic, review every three years.
- 12 - The next age of agricultureJohn Lohrentz
Assuming a 50% activation rate in the 2020-2030 period, the emissions distribution
will shift to the left, something like below:
50% 2030 Distribution vs. 2020 Distribution
45%
2030 Target:
40% 6.32
2030 distribution
35%
2020 Distribution
Proportion of Dairy emissions (%)
30%
25%
20%
15%
10%
5%
0%
tCO2e / 10,000 litres of milk
Key Stats 2030
Average emissions per 10,000L milk 6.32
Total emissions (tCO2e) 15,960,991
Production (litres of milk) 25,261,844,381
% of farmers
Below 2030 “the Threshold”: 6.32 32%
0 to 20% above Threshold 17%
21 to 40% above Threshold 19%
41 to 60% above Threshold 13%
+60% above Threshold 19%
Under this scenario, the following outcomes occur:
32% of farmers will get below The Threshold (due a rebate)
The number of farmers will decrease by 7.8% (with herd size increasing by
30%)
- 13 - The next age of agricultureJohn Lohrentz
Progressive tax rate
I recommend progressive rates so that those emitting at a higher level per unit of
production have a higher tax obligation. This reflects the reality that the warming
effect of additional emissions compounds. For the Dairy scenario:
Per tonne of
methane
0 to 20% above Threshold Tax Rate A $10
21 to 40% above Threshold Tax Rate B $20
41 to 60% above Threshold Tax Rate C $25
+60% above Threshold Tax Rate D $30
The tax rates must be set independently of the NZ ETS, using Treasury analysis of
appropriate marginal price. As the carbon price fluctuates due to a number of non-
Agricultural effects, taking this approach creates more certainty on annual
obligations/outcomes. 37
Applying a tax progressively creates a stronger incentive to lowering emissions to the
next category, even if you can’t quite get to the Threshold. Farmers also have
incentive to beat the Threshold, but don’t have to achieve negative emissions for a
rebate. This is important as the level of investment required to move from average
levels of emissions to very sustainable levels of emissions is higher than a very high
polluting farmer moving to the middle of the road. It recognises the work already done
by farmers.
Cost
$NZm
R&D tax credit (60%) $288.5
Farmer’s Cash Credit (40%) $192.3
Tax revenue from biological $480.8
methane emissions tax
Breakdown for dairy:
37
ICCC (2019) Action on agricultural emissions, [8.3].
- 14 - The next age of agricultureJohn Lohrentz
Farmers Tax Total cost / Average cost
Rate rebate ($) to farmer ($)
Tax Rate A 17% 1,859 10.00 (27,773,845) (14,937)
Tax Rate B 19% 2,016 20.00 (60,218,615) (29,875)
Tax Rate C 13% 1,376 25.00 (51,374,389) (37,343)
Tax Rate D 19% 2,028 30.00 (90,857,205) (44,812)
7,278 (230,224,054)
Below the 32% 3,407 90,026,470 26,424
Threshold
10,685
Flexibility
Using this approach there is a high degree of flexibility (eligibility, rates,
progressiveness, differentiation by industry/geography) in how strongly the
government tries to incentivise changes to the behaviours of farmers. With a just
transition being a crucial element of a successful plan, this means that the government
can manage the sector’s outcomes.
Measurement
I propose to:
Measure annual on-farm methane emissions using Overseer
Align sequestration measurement with the protocols used under the NZ ETS
Require processors to report annual units of farm-gate production (e.g.
litres of milk).
I support the TWG’s assessment that efficient and accurate Measurement is the biggest
challenge for designing effective GHG taxes38 - 98% of farmers do not know their
emissions footprint.39 But I argue that Overseer, a government-developed tool, is fit-
for-purpose.
38
See [40] to [42], Tax Working Group Final Report Volume 1.
39
BERG (2018) Report of the Biological Emissions Reference Group, page 5.
- 15 - The next age of agricultureJohn Lohrentz Overseer examines “nutrient use and movement within a farm”.40 It is flexible to different farm-types41 and multi-functional. Many farmers are already using the tool to restore water quality. It also measures many inputs so better reflects the ‘levers’ farmers can pull to change their practices (stock numbers, stock type, dry matter intake per animal, the nitrogen content of the feed, and the use of nitrogen fertiliser).42 Overseer is free to access but you need a nutrient manager to implement it. After being critically examined by industry-body BERG, they have endorsed it as a “suitable” tool for measuring on-farm methane emissions.43 I propose that some further development is done so that by 2025 Overseer can automatically populate emissions information to a farmer’s myIR. Sequestration The ICCC is exploring ways to net-off emissions at the farm-gate.44 I support this approach. In the meantime, I propose that forestry sequestration is counted using the NZ ETS rules. I suggest that this information should be able to be populated into IRD systems for ease of compliance. Production Given the fact there are about 38,300 farmers in NZ and only a limited number of processors, I propose that the information on units of production for each farmer / taxpayer are provided directly to IRD by the processors. This should already be collected by Processors – a minimal additional compliance burden. 40 Agresearch (2015) Technical Description of OVERSEER for Regional Councils. 41 NZAGGRC (2017) On-farm options to reduce agricultural GHG emissions in New Zealand, [2.1.2]. 42 NZAGGRC (2017) On-farm options to reduce agricultural GHG emissions in New Zealand, [2.1.2]. 43 BERG (2018) Report of the Biological Emissions Reference Group, page 6. 44 ICCC (2019) Action on agricultural emissions, [11.4]. - 16 - The next age of agriculture
John Lohrentz
2. Credit sustainable farmers
The government proposes to:45
Recycle all levy revenues back to Agriculture through an Agricultural
Emissions Fund
Fund programmes with a “direct” effect on emissions.
Ensure a fair allocation to Māori land owners, plus representation in the
Fund’s governance.
I propose, from 2025, to annually recycle 40% of the tax revenues directly to
“sustainable” farmers that achieve the annual Threshold, using a refundable tax
credit.
Don’t set up another fund!
A tax neutral government levy will seed NZ$ 47-95m to reduction initiatives, but is
inefficient and involves unnecessary government control of the outcomes.46 The fund
will consume 5% of its value in running costs47 and the approach does not guarantee
that the funds are distributed to science-backed strategic priorities.
Give it back
I propose redistributing 40% of the tax revenue collected to “sustainable” farmers that
achieve the annual Threshold. The funds can be distributed as a refundable tax credit48
which will reduce farmer’s tax bill (and provisional tax next year) or put cash in hand.
By efficiently and predictably allocating resources to “sustainable” farmers, they have
opportunities to implement new practices and make strategic investment decisions.
Allocation mechanism
One important challenge is how to allocate the credits to sustainable farmers. If a
price per tonne of emissions is used then farmers are incentivised to maintain higher
emissions, just below the Threshold.
45
MFE (2019) Action on agricultural emissions, page 7.
46
ICCC (2019) Action on agricultural emissions, [13.1].
47
ICCC (2019) Action on agricultural emissions, [13.2].
48
This can be done simply by modifying s LA 6.
- 17 - The next age of agricultureJohn Lohrentz
I propose a multiplier mechanism for taxpayers/groups:
[(Annual Threshold / 10,000 x farmer’s actual units of production) – Actual total
methane emissions] x credit rate
This approach means that the further below the Threshold a farmer gets, the greater
their rebate. Analysis will be required to appropriately set the credit rate.
Example
Applying my Dairy scenario, here is a simplified example:
2030 Threshold = 6.32 tCO2e / 10,000L milk;
Assume average 2.3m litres of milk produced per farm.
Credit rate = $44.
2030 Number of Actual tCO2e Credit per Total pay-
$NZ Farmers / 10,000L farmer ($) out ($)
Group 1 2,000 5 13,358 26,716,800
Group 2 1,000 3 33,598 33,598,400
Group 3 407 -1 74,078 30,148,658
3,407 90,463,858
- 18 - The next age of agricultureJohn Lohrentz
3. Target Agricultural R&D with a tax credit
Innovation is: Public and private investment in R&D + developing the ecosystem &
pathways that allow efficient commercialisation. My proposal focuses on private R&D
investment.
Innovation brings a have-our-cake-and-eat-it-too perspective, a potential agricultural
“silver bullet”.49 Agricultural innovation may widen the constraints to allow more
growth within our ecological and climate limits. For example BERG estimates that a
methane vaccine could reduce biological methane emissions for an animal by 30%.50
But the industry only has a medium-high confidence that a vaccine will be ready by
2050.
Current approach to private R&D
There are challenges in stimulating private innovation because R&D comes with high
spill-overs.51 While industry structure plays a part (few big companies, small R&D
intensive industries like pharmaceuticals),52 businesses don’t invest because there’s
high risk, high capital requirements, cash flow issues and the rewards are often hard to
capture (with technology making it easy to reverse engineer innovations).53 This
disincentives the behaviours that are good for the economy as a whole (positive
externalities).
The government sees these externalities as a chance for positive intervention.54 Based
on international evidence,55 the government has implemented a 15% R&D tax incentive
as a replacement for the Callaghan Innovation growth grant (and a revival the 2008-09
scheme). The core difference is that Callaghan Innovation picked its winners whereas
the tax credit is available to all that meet eligibility criteria.
49
Productivity Commission Report (2018), page 6.
50
BERG (2018) Report of the Biological Emissions Reference Group, Table 3.
51
Treasury (2018) RIA on R&S tax incentive, page 1: Business R&D is 0.64% of GDP
(OECD average: 1.64%).
52
Treasury (2018) RIA on R&S tax incentive, page 6.
53
Treasury (2018) RIA on R&S tax incentive, page 1.
54
ICCC (2019) Action on agricultural emissions, [12.4].
55
Treasury (2018) RIA on R&S tax incentive, page 2.
- 19 - The next age of agricultureJohn Lohrentz
Agricultural R&D tax credit
Allocating 60% of the tax revenue, from 2020 I propose to:
Modify the R&D tax incentive to provide a 40% refundable credit to
taxpayers with “Targeted Agricultural R&D” expenditure
Empower the Climate Change Commission (“CCC”) to define “Targeted
Agricultural R&D” expenditure, so it targets work to reduce methane
emissions or improve efficiency.
Review the eligible expenditures list every five years.
Targeted Agricultural R&D
We already know some of the solutions we need to fast track for more responsible
agriculture (e.g. a methane vaccine, low-emission feeds). By empowering the CCC to
shortlist eligible expenditures for this scheme, there is increased certainty that the
funds are being strategically allocated and IRD has clear filters for approval and review
processes. It will also allow a degree of industry consultation on focus areas.
Technical changes
The main changes are through the definition of “Eligible research and development
expenditure” in section LY 5 and Schedule 21, Part A:
Insert wording into Part A so that “Targeted Agricultural R&D” is conceptually
included in eligible expenditure.
Define “Targeted Agricultural R&D” in section YA 1
Empower the CCC to recommend the definitional coverage of “Targeted
Agricultural R&D” expenditures to IRD/MBIE, and review periodically (every five
years).
Add a new subsection after section LY 4(2) to provide a separate, additional
calculation process for total eligible R&D expenditure related to Targeted
Agricultural R&D.
The 40% refundable tax credit is subject to existing ordering rules.
Some changes to the existing legislation will be required to ensure no
expenditure is double counted (Part a, Schedule 21 and LY 4), and the new
credit runs parallel to the R&D credit.
- 20 - The next age of agricultureJohn Lohrentz
By inserting a separate, parallel process to calculate a tax credit for Targeted
Agricultural R&D, the major protections designed into the R&D tax incentive remain
intact and beneficial. There is no need to fundamentally change the definition of an
eligible entity or eligible core activity. In this way the risk of abuse is, initially,
comparative to the existing risk of the R&D tax credit.
Costing
The Treasury completed a Regulatory Impact Assessment of the R&D tax incentive
between 2020 and 2022 (3 years). In its present form it is expected to incur the
following costs each year:56
NZ$ 384m in outlays to taxpayers;
NZ$ 6.2m in administration costs; and
NZ$ 37.5m for taxpayer engagement costs (for 1,500-2,000 people).
Based on a sample of two months from the 2017/18 cohort of growth grant recipients,
about one third (32%) were for Agricultural projects. The projected costs for
increasing the tax credit to 40% for
Targeted Agricultural R&D depends on
what proportion of agricultural projects
are in the “targeted” areas. Assuming
half are in the targeted areas, the costs
are as follows:
Between 2020 and 2025, I propose that government increases the R&D tax incentive
budget to cover this cost, noting the significant benefits it could have for farmers and
the economy generally (alternative is to implement from 2025). From 2025, the tax
credit will be paid for by methane tax revenues from Agriculture.
56
Treasury (2018) RIA on R&S tax incentive, page 12-15.
- 21 - The next age of agricultureJohn Lohrentz
4. Administration and Implementation
Administration
I propose that IRD administers this Proposal, with collaboration from MFE and
Ministry for Primary Industries (“MPI”).
IRD has annualised and periodic engagements with every taxpayer. They have a new
digital system and they are the right agency to lead the design and implementation of
a new tax. Partnering with other Agencies for design and administrative support will
ensure a high quality framework.
In terms of system design:
1. New ‘tax base’, new Tax Act
Natural Capital is a new tax ‘base’ therefore establish a new Tax Act for
environmental taxation. Integrate the Act with the principles of the Climate
Change Response Act 2002 and the processes of the Tax Administration Act
1994 (as a basis for collection, review and enforcement).
The new tax should not be income tax therefore it will not affect our DTA/FTA
obligations.
2. Supplementary return form
Create a digital annual “supplementary return form” which is "attached" to a
farmer/group’s tax return.
Pre-populate the form with available information
o Total units of production (from Processors);
o Eligible offsets (MPI via NZ ETS); and
o (with some development) Total farm emissions (Overseer plug-in to IRD).
Automatically calculate tax obligation or tax credits, and this flows through to
the tax return form. This should increase simplicity. For paper-returns, provide
comprehensive guidance for calculations.
Taxpayers will retain the ability to edit and correct their supplementary return.
- 22 - The next age of agricultureJohn Lohrentz
Implementation
The government proposes that:
The farm-level price mechanism be implemented from 2025.
That processors be taxed in the interim.
Proposed timetable57
I support the government’s suggested policy timetable as it gives farmers time to
prepare, change practices and make some investment decisions.
In the 2020-2025 interim, I support a formal government-sector agreement which
hands initiative to sector participants to make reductions, supported by government
funding.58 This would entail the sector developing and deploying integrated farm
management plans prior to 2025.
57
MFE (2019) Action on agricultural emissions, page 13; ICCC (2019) Action on
agricultural emissions, [9.1].
58
MFE (2019) Action on agricultural emissions, page 15-16.
- 23 - The next age of agricultureJohn Lohrentz Impact analysis My analysis looks at medium-term outcomes (10 years) using the Treasury’s Living Standard’s Framework (see Appendix 2). - 24 - The next age of agriculture
John Lohrentz

                            Treaty of Waitangi
Cultural Capital of the Treaty
 Current                                      Proposal impact:
 performance:

In the last few decades NZ has addressed some Māori grievances regarding the land
and her resources through settlements from the Waitangi Tribunal. But our agriculture
and engagement with the land is not, for the most part, consistent with Te Ao (Māori
worldview).

While this Proposal benefits the land long-term, I cannot affirm that it honours the
spirit of the Treaty. My fundamental starting point – practically and philosophically – is
within the euro-centric framework of property rights, markets and individualism. To
grow Treaty social capital would require a starting point that subjects us to the land,
not the reverse. Treating Natural Capital as a tax base might move some way towards
re-orienting our thinking – it is a beginning, however small.

                               Natural Capital
Methane emissions
 Current                                      Proposal impact:
 performance:

Currently methane emissions are unsustainably high largely due to the intensity of our
farming practices (fertilizer + focus on maximising the productive output).

My proposal activates the transformation Agriculture needs to seize new opportunities.
Recognising that the practices and technologies required to achieve a 10% reduction in
methane before 2030 (National Target) already exist, I consider there is the likelihood
of strong positive outcomes.59 This is a risk because tax policy sets a price and intends

59
     BERG (2018) Report of the Biological Emissions Reference Group, page 28.

- 25 -                                                          The next age of agriculture
John Lohrentz
to change quantity of emissions.60 My assumption is that there is good elasticity in the
relationship between the price of methane and total emissions.
With a significant proportion of tax revenues (60%) going towards Targeted
Agricultural R&D, there will also be a far higher likelihood of breakthrough solutions to
make the transition journey of the entire sector easier and more affordable,
compounding the sector wins.
Land use
Current Proposal impact:
performance:
From one big native forest, over the last 200 years we have de-forested and shifted to
pastoral land.61 Our current land use is unsustainable long-term based on soil
degradation and emissions intensity indicators.62 But the government’s response is
also problematic as it over-corrects towards forestry – 2.6m new hectares by 2050,
and 2.8m more by 2075.63 This land-use change is too rapid.
60
Productivity Commission Report, page 114.
61
Parliamentary Commissioner for the Environment Report, page 40.
62
ICCC (2019) Action on agricultural emissions, [4.2].
63
Parliamentary Commissioner for the Environment Report, page 126
- 26 - The next age of agricultureJohn Lohrentz
Under this Proposal land-use change will still occur but at a more manageable rate. By
giving a 5 year transition period from 2020, farmers can take time to evaluate their
revised costs and opportunities, and make new decisions on investing their time and
resources.
Land diversification and increased (native) foresting64 will have strong
medium/long-term effects by increasing our resilience to climate shocks
(different farms affected differently by same event).
Fewer “mono-cultures” also reduces disease risk.
If this Proposal creates financial pressure on farmers they may find it hard to
secure funding to transition (it will be important for the banks to come on the
journey and look at more long-term/sustainable finance options).65
Farmers will need training from industry/government to assist in developing new
farming skills and planning transitions.
Transitions may mean decreases in direct employment in Dairy/drystock, but
could create new jobs in other industries (i.e. horticulture). While employment
changes might improve at a national level, there will be stronger and more
diverse regional impacts – which need to be explored and managed.66
Food security
Current Proposal impact:
performance:
From a New Zealand food security perspective, this Proposal will have no impact. From
a global perspective we profit from, but do not materially contribute to, the issue of
food security.
64
Newsroom (September 2019).
65
RBNZ (May 2019) Financial Stability Report, page 12.
66
MFE (2019) Action on agricultural emissions, page 24. BERG
- 27 - The next age of agricultureJohn Lohrentz
Emissions leakage
Current Proposal impact:
performance:
Emissions leakage occurs when production moves offshore to jurisdictions where
emissions are not regulated and pollution can increase unbounded. The MFE have
assessed that there is not a high level of risk of emissions leakage in the medium term
due to the generous 95% free allocation in the government’s plan.67 This is because
other economies are also adopting “economy-wide” approaches to GHGs – an equal
playing field.
I disagree with this analysis. There is material risk of leakage in the short-medium
term, and I think this Proposal likely increases this risk. My proposal puts a higher cost
on farmers, so the incentive to shift oversees in the medium term is higher, if investors
aren’t patient for the longer-term payoff – international climate policy is spotty.
However, this risk needs to be balanced against the opportunity cost of failing to act
and the risk of substitutable products competing for revenue share (e.g. vegan meat,
nut milks). Moving early to differentiate our agriculture will position the sector
effectively for these trends.
Global climate
Current Proposal impact:
performance:
In reality, we are a small part of the global picture. It is fair to assess that even a
perfect transition to a sustainable Agriculture in NZ will not make a meaningful dent in
global emissions. But agri-tech might.
67
MFE (2019) Action on agricultural emissions, page 21.
- 28 - The next age of agricultureJohn Lohrentz
Ecology (Soil and water quality)
Current Proposal impact:
performance:
Any impacts on soil and water will be an indirect impact from farmers optimising their
land inputs, especially fertilizer, and dealing with run-off.68 We can expect
improvements here as quality water and soil can improve land productivity, and
reduced fertilizer purchasing saves costs – there is a clear business case.69 These
outcomes can be leveraged through integrated farm management plans that deal with
emissions, water and soil together.70
Human Capital
Institutional knowledge
Current Proposal impact:
performance:
Human Capital considers knowledge/skills, physical and mental health.
Currently farmers are not sufficiently prepared with the knowledge, skills and resilience
to deal with future acute environmental shocks. While there might be some short-term
financial stability, people’s livelihoods can erode overnight from significant
weather/disease events – which will impact isolated or low-wealth farmers worst.
Whether this proposal supports farmers’ skills development and resilience depends on
final design – but we can learn from history. When Agriculture rapidly deregulated in
the 1980s, there was a high human cost:71
“There were some suicides and some farmers were forced to draw on social
welfare assistance for a time. Many small rural towns experienced reductions in
population in the mid-1980s as farmers stopped spending and people left in
68
MFE (2019) Action on agricultural emissions, page 25.
69
https://www.ipcc.ch/2019/08/08/land-is-a-critical-resource_srccl/
70
ICCC (2019) Action on agricultural emissions, [14.1].
71
Vangelis Vitalis (2007) Agricultural subsidy reform and its implications for
sustainable development: the New Zealand experience, page 30.
- 29 - The next age of agricultureJohn Lohrentz
search of jobs elsewhere. Public services like schools and small hospitals
contracted in the wake of this rural downsizing”.
We can observe that the policy changes were not supported by enough farmer-
development to ensure a fair and manageable transition in the short term. While there
were many positive long-term outcomes (international competitiveness, sector
growth)72 and only 1% had to sell-out,73 the lack of preparedness made it a hard
decade for many.
For a transition to be just it needs to consider “tools to mitigate unwanted impacts on
regions, industries and lower-income households.”74 It will take further analysis to
fully understand key vulnerable groups/geographies. Therefore I have create flexibility
with several policy settings which can be changed to respond to human costs.
Regardless, skills development will require more fiscal investment in existing farmer
training and extension programmes.75 I support the government to extend these
initiatives as they crucially supplement the outcomes of this Proposal.
Farmer wellbeing
Current Proposal impact:
performance:
The Mental Health Foundation has identified climate change, environmental
sustainability and regulation as risk factors for farmers’ mental health.76 While the
mental health outcomes have complex causes, ensuring design quality and flexibility
should go some way to mitigating any immediate mental-health impacts – especially
by ensuring farmers first report for a few years before the tax obligation takes effect in
2025.
72
Vangelis Vitalis (2007) Agricultural subsidy reform and its implications for
sustainable development: the New Zealand experience, page 29 and 37.
73
Vangelis Vitalis (2007) Agricultural subsidy reform and its implications for
sustainable development: the New Zealand experience, page 30.
74
MFE (2019) Zero Carbon Bill – Regulatory Impact Statement, page 57.
75
ICCC (2019) Action on agricultural emissions, [5.3].
76
Mental Health Foundation (2014), Table 1.
- 30 - The next age of agricultureJohn Lohrentz
Social Capital
Political Feasibility
Current Proposal impact:
performance:
Some may argue that this Proposal has a low level of political feasibility based on the
lobbying strength of industry groups opposed to environmental regulation or new
taxation. For example, Federated Farmers77 recently opposed water quality
regulation78 and prefer a marginal pricing mechanism that only applies to farmers not
reducing emissions by 0.3% annually (i.e. 3% target reduction by 2030). Further:
Taking a big bet on Agricultural R&D is a political risk (as it could fail) and the
government currently does not have a high risk threshold.
Generally the political environment is low trust, so bilateral support is unlikely,
making it more likely to devolve into an election issue (delay is infeasibility).
In contrast, this Proposal is:
Arguably, well-timed, with the government in the middle of executing a strong
environmental action plan: Water quality, Zero Carbon Bill, NZ ETS fixes.
Speaking to a strong silent majority in Agriculture and supporting industries
(based on anecdotal evidence from MFE Officials).
Tax neutral.
Focused on driving R&D and on-farm innovations, not penalising farmers.
Public feasibility
Current Proposal impact:
performance:
While support from Farmers may be mixed, this Proposal is a more feasible long-term
pathway than government’s plan. There should be a reasonable level of support from
other parts of society that are advocating for climate policy, e.g. the Climate Leaders
77
Federated Farmers (July 2019) Farmers committed to reducing greenhouse
emissions.
78
Scoop (September 2019).
- 31 - The next age of agricultureJohn Lohrentz
Coalition (business advocacy on climate change): including Fonterra, Ngai Tahu,
Ravensdown, Synlait and Zespri.79
There could be some push-back (from a ‘special treatment’ perspective) from other
industries that are subject to the carbon price, or from those that think that this
proposal does not go far enough. Public support will continue to grow as we
experience more natural disasters.
While there are times where public sentiment and bilateral consensus are
important to our democratic stability, we do not elect our MPs to send everything
back to a poll or referendum. MPs are entrusted with the duty to govern the
country – to consult and debate – then to identify what good policy looks like and
(collectively) legislate for the common good. Good policy isn’t always popular and
usually involves nuance. Political and public feasibility should ask:
Is this policy for the common good of our (intergenerational)
stakeholders?
Distributional equity
Current Proposal impact:
performance:
Fairness is inherently subjective.80 In this context, ‘good’ policy begs the question: Are
actors experiencing fair outcomes according to the scientific consensus on climate
change? This highlights several distortions:
The Agricultural R&D tax credit will unfairly benefit a few entrepreneurs and
scientists (but it may allocate funding more proportionately to our existential
risks).
The tax credit paid to “sustainable farmers” will benefit about 32% of
economically significant farmers, while the rest will have tax burdens at different
levels. This is intentional an investment in Natural Capital.
79
https://www.climateleaderscoalition.org.nz/who
80
Deloitte (2019) State of the State.
- 32 - The next age of agricultureJohn Lohrentz
The tax only applies to methane, so farmers will not have to pay for their fossil
fuel emissions. Intentional: 92% of agricultural emissions are from ruminant
livestock (CO2 will decrease with methane).
Dairy and drystock farmers will be affected whereas horticulturalists, seafood
and other farmers will not be affected. Intentional.
24,336 of over 38,300 farmers will bear the tax burden. This is 95% of dairy
farms, 49% of beef/lamb farms and 46% of deer farms.81 This is fair as all
economically significant farms qualify.
Structure of the tax system
Current Proposal impact:
performance:
Taxing the transfer of value
Economists mostly believe that the free market’s invisible hand works best to allocate
resources efficiently, provided economic actors are rational. Some have supplemented
that the market can be inefficient where goods/services create externalities, so
sometimes governments intervene to tax negative externalities and subsidise positive
externalities. The Productivity Commissioner, TWG and PCE all draw on this worldview:
That government action is justified in order to ‘correct’ the market in some instances.
The problem with this worldview is that it frames environmental damage as a pay-to-
keep-playing issue, re-affirming the primacy of the growth assumption and failing to
address the underlying business models creating negative externalities.
Going forward it may be more useful to (re)conceptualise interventions in a way that
appraises the value of natural capital – a transaction tax, not an excise tax.
Earth is a closed system
Simplistically, first, there was only Natural Capital (See Appendix 2 for definitions).
81
Beca (2018) Administration costs report: Appendix 2, [1.3.5].
- 33 - The next age of agricultureJohn Lohrentz
DR CR
Natural capital 100 Equity 100
Over time humans and social structures evolved. But as the earth is a closed system
any new ‘Human’ or ‘Social’ Capital draws on Natural Capital (sometimes
imperceptibly).
DR CR
Natural capital 60 Equity 100
Human Capital 20
Social Capital 20
More recently we have developed market capitalism – the accumulation of tangible and
intangible value which enables people to access a greater level of the other Capitals at
will. As the concentration of Financial Capital accelerates, the pressure put on the
other capitals grows.
DR CR
Human Capital 30 Equity 100
Social Capital 10 Natural Capital 20
Financial Capital 60 (liability)
While our economic system has raised many out of poverty, we now need an economic
system that fully realises the value of non-financial capitals, seeing Natural Capital as
the prime source from where we draw all things of value.82 If Natural Capital is
inherently valuable, able to accumulate and depreciate, it makes sense to treat it as a
tax base. Pricing biological methane then becomes a tax on transfers of value between
Natural Capital and Financial Capital. This positively reframes ‘negative externalities’
for the 21st century, equalising the importance of all Capitals and legitimising the use of
economic mechanisms to efficiently allocate between a range of outcomes, not just
economic growth.
82
With reference to Kate Raworth’s Doughnut Economics.
- 34 - The next age of agricultureJohn Lohrentz
Simplicity
Using tax to mediate transfers between Natural and Financial Capital lays the
groundwork for a more comprehensive programme of environmental taxation – a new
Tax Act. But this should not increase complexity for most taxpayers.
For qualifying farmers there will be an increase in the complexity to the extent
supplementary returns can’t be pre-populated or taxpayers need to manually amend
the supplementary return. Long term, this Proposal:
Will not fundamentally alter the certainty or predictability of the tax system –
alignment with the five-yearly national emissions budget process should ensure
transparency and predictability of tax rates and eligibility criteria.
Does not alter the fundamental concepts of residence and source - “Qualifying
farmers” has been defined within the parameters.
Builds on the existing R&D and tax credit regimes – so the outcomes should be
more structurally sound in terms of processes and enforcement.
- 35 - The next age of agricultureJohn Lohrentz
Financial Capital
Agricultural sector impacts
Current Proposal impact:
performance:
Investment costs in reducing emissions
Currently, farmers are not compelled to invest in emissions-reducing technologies or
new practices.
Medium-term, this Proposal will increase famers’ cost and time as they re-evaluate
future pathways and investment decisions. As the interventions do exist,83 this work
could have a disproportionately positive outcome in the medium-term. For example, a
Dutch methane inhibitor will go to market this year for in-shed feeding herds (potential
30% reduction).84 But farmers will need to evaluate the inhibitor’s interaction with
farm systems, consider practice changes (employment, training), and whether the
product’s cost is commensurate with reduced tax obligations. Technology adaption is
timely and sometimes complex. There will likely be an increase upfront investment in
the next five years as farmers prepare to avoid the tax obligation.
These costs could have a high return on investment in the long-term, but this is harder
to accurately assess.
Compliance & Tax liability
Currently farmers do not have any compliance/tax costs from methane emissions; but
regulatory compliance costs are growing (H&S, water quality).
This Proposal better allocates the tax obligation and compliance costs to those causing
the majority of the damage. While the costs are higher, the results are fairer across
the industry. The faster farmers adapt the lower the level of tax obligation applied.
83
NZAGGRC (2017) On-farm options to reduce agricultural GHG emissions in New
Zealand, Figure 1.
84
NZAGGRC (2017) On-farm options to reduce agricultural GHG emissions in New
Zealand, page 18.
- 36 - The next age of agricultureJohn Lohrentz
New tax obligation
This Proposal creates a new tax obligation for farmers. Using Dairy as an example, in
2030 the costs to farmers will be around:
Average farm Average cost
Tax rate A $14,937
Tax rate B $29,875
Tax rate C $37,343
Tax rate D $44,812
Rebate to $26,424
Sustainable farmers
Under this scenario, the total cost borne by the Agriculture industry for the biological
methane tax is:
$NZm
R&D tax credit (60%) $288.5
Farmer’s Cash Credit (40%) $192.3
Tax revenue from biological $480.8
methane emissions tax
This is high, compared to the levy/rebate proposed by the government which will cost
$47-95m.85 The worst affected are those with a very high emissions per unit of
production. By contrast, about a third of farmers will receive a significant net benefit.
Cost of complying
Beca estimates that the government’s plan will cost about $39m annually after
implementation is complete.86 About $30m of this cost will fall on 24,336 farmers
($1,200 or about 6% of the average tax obligation).
After reviewing Beca’s cost analysis of the levy/rebate approach in-depth, I have
identified some cost savings:
85
ICCC (2019) Action on agricultural emissions, [13.1].
86
Beca (2018) Administration costs report: Appendix 2.
- 37 - The next age of agricultureJohn Lohrentz
NZ ETS brokerage and compliance time - $11.4m + $2.5m:87 It costs $500 a
transaction to purchase NZ Units from the NZ ETS. Farmers will not need to pay
brokerage or spend time registering, developing skills and engaging with the NZ
ETS.88
Registration with MPI/MFE: Farmers will not have to spend time registering as
IRD already has taxpayers’ information and works on a self-assessment basis.
This would bring the annual compliance costs down to $16.1m for farmers.
Nutrient managers
While Overseer is provided for free, farmers must hire a nutrient manager in order to
implement the tool. Beca estimates the following costs to measure emissions with a
nutrient manager.89
Hours Cost
Year 1 4 $700
Year 2 3 $525
On-going 2.5 $438
The government should subsidise nutrient managers and consider developing Overseer
for self-assessment.
International competitiveness
Currently NZ agricultural products are strongly competitive overseas – our trading
partners highly value our products.90
On balance, I consider that this Proposal will maintain/increase Agriculture’s
international competitiveness as this transition will differentiate our products as not
contributing to global warming.91
87
Beca (2018) Administration costs report: Appendix 2.
88
ICCC (2019) Action on agricultural emissions, [8.1].
89
Beca (2018) Administration costs report: Appendix 2, Table A4 and A5.
90
MPI (2019) Situation and Outlook for Primary Industries, page 4
91
Credit to Myles Allen for phrasing.
- 38 - The next age of agricultureJohn Lohrentz
However there are other factors to consider:
The cost of goods will rise. Using my Dairy scenario, an average farmer will
experience a 10.3c additional cost per kg of milk solids ($6.25-7.25);92
The extent to which costs are absorbed by the farmer or processor, or passed
on;
International exchange rate movements; and
International developments in agricultural climate policy.
The ICCC considers that Dairy competitiveness will be unaffected, but drystock may
feel some impacts, due to differences in the markets and profit points.93
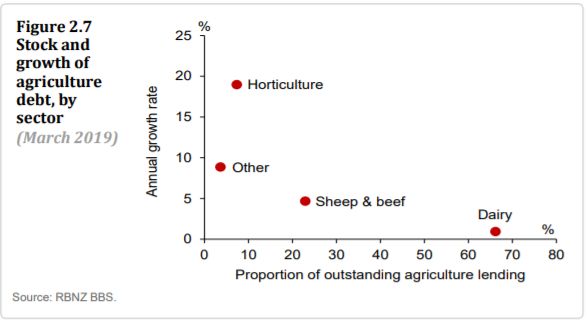
Farmer debt
Farmer debt is a current concern
with 35% of dairy “farms with
more than $35 of debt per/kg
milk solids”.94 The RBNZ is
concerned these highly indebted
farmers are making low profits
with a good price, and will thus
be vulnerable to cost increases
from “longer-term challenges, such as environmental and climate change policies.”95
Going forward, this Proposal is likely to put more pressure on some highly indebted
farmers by increasing costs: “Options for addressing problems at financially stressed
farms appear constrained at the moment, as demand for dairy farm land is low”.96 For
others, the tax credits will allow them to reduce debt.
This discussion may be moot with the prospective of negative interest rates as the OCR
continues to decrease, which may reduce pressure on those in debt.
92
MFE (2019) Action on agricultural emissions, page 26.
93
ICCC (2019) Action on agricultural emissions, Box 10.2.
94
RBNZ (May 2019) Financial Stability Report, page 7.
95
RBNZ (May 2019) Financial Stability Report, page 2.
96
RBNZ (May 2019) Financial Stability Report, page 12.
- 39 - The next age of agricultureYou can also read