Do alternative inventories converge on the spatiotemporal representation of spring ammonia emissions in France?
←
→
Page content transcription
If your browser does not render page correctly, please read the page content below
Atmos. Chem. Phys., 20, 13481–13495, 2020
https://doi.org/10.5194/acp-20-13481-2020
© Author(s) 2020. This work is distributed under
the Creative Commons Attribution 4.0 License.

Do alternative inventories converge on the spatiotemporal
representation of spring ammonia emissions in France?
Audrey Fortems-Cheiney1,a , Gaëlle Dufour1 , Karine Dufossé2,b , Florian Couvidat3 , Jean-Marc Gilliot2 ,
Guillaume Siour1 , Matthias Beekmann1 , Gilles Foret1 , Frederik Meleux3 , Lieven Clarisse4 , Pierre-François Coheur4 ,
Martin Van Damme4 , Cathy Clerbaux4,5 , and Sophie Génermont2
1 Laboratoire  Interuniversitaire des Systèmes Atmosphériques, UMR CNRS 7583, Université Paris Est Créteil et Université
de Paris, Institut Pierre Simon Laplace, Créteil, France
2 Université Paris-Saclay, INRAE, AgroParisTech, UMR ECOSYS,78850 Thiverval-Grignon, France
3 Institut National de l’Environnement Industriel et des Risques, INERIS, 60550 Verneuil en Halatte, France
4 Université libre de Bruxelles, Spectroscopy, Quantum Chemistry and Atmospheric Remote Sensing

(SQUARES), Brussels, Belgium
5 LATMOS/IPSL, Sorbonne Université, UVSQ, CNRS, Paris, France
a now at: Laboratoire des Sciences du Climat et de l’Environnement, LSCE-IPSL (CEA-CNRS-UVSQ),

Université Paris-Saclay, 91191 Gif-sur-Yvette, France
b now at: UniLaSalle – Ecole des Métiers de l’Environnement, Rennes, France

Correspondence: Audrey Fortems-Cheiney (audrey.fortems@lsce.ipsl.fr), Gaëlle Dufour (gaelle.dufour@lisa.u-pec.fr)

Received: 27 March 2020 – Discussion started: 5 May 2020
Revised: 7 September 2020 – Accepted: 26 September 2020 – Published: 12 November 2020

Abstract. Agriculture is the main source of ammonia (NH3 )        TNO-GEN), while soil properties are not accounted for by
in France, an important gaseous precursor of atmospheric          the TNO-GEN methodology. For the other parts of France,
particulate matter (PM). National and global emission inven-      the differences are smaller. The timing of fertilization and
tories are known to have difficulty representing the large spa-   associated ammonia emissions is closely related to the ni-
tial and temporal variability inherent to atmospheric NH3 .       trogen requirements and hence the phenological stage of the
In this study, we compare NH3 emissions in France during          crops, and therefore to the crop year’s specific weather con-
spring 2011 from one reference inventory, the TNO inven-          ditions. Maximum emissions are observed in March for 2011
tory, and two alternative inventories that account in differ-     for some regions for both alternative inventories, while April
ent manners for both the spatial and temporal variabilities       is the period with maximum emissions for the reference in-
of the emissions: (i) the NH3 SAT satellite-derived inventory     ventory regardless of the region or the year. Comparing the
based on IASI NH3 columns and (ii) the CADASTRE-CIT               inventories at finer temporal resolutions, typically at daily
inventory that combines NH3 emissions due to nitrogen fer-        scale, large differences are found. The convergence of al-
tilization calculated with the mechanistic model VOLT’AIR         ternative, independent and complementary methods on the
on the database of the CADASTRE_NH3 framework and                 spatiotemporal representation of the spring NH3 emissions,
other source emissions from the CITEPA. The total spring          particularly over areas where the contribution of mineral fer-
budgets, from March to May 2011, at the national level are        tilizer spreading to the spring budget is strong, encourages
higher when calculated with both alternative inventories than     further developments in both prospective complementary di-
with the reference, the difference being more marked with         rections, as this will help improve national NH3 emission in-
CADASTRE-CIT. NH3 SAT and CADASTRE-CIT invento-                   ventories.
ries both yield to large NH3 spring emissions due to fer-
tilization on soils with high pH in the northeastern part of
France (65 and 135 kt NH3 , respectively, vs. 48 kt NH3 for

Published by Copernicus Publications on behalf of the European Geosciences Union.
13482                          A. Fortems-Cheiney et al.: Spatiotemporal representation of ammonia emissions in France

1   Introduction                                                    is to capture the right timing of fertilizer spreading at the
                                                                    weekly or even at the daily scale in order to reflect the ef-
France is a major crop producer and a major exporter of agri-       fect of environmental and agronomic conditions on ammo-
cultural and food products. In 2014, it produced 2 %, 4 %,          nia emissions. To this end, mechanistic models taking into
5 %, 8 %, 8 % and 14 % of the global production of maize,           account meteorological conditions, soil properties and agri-
sunflower, wheat, barley, rapeseed and sugar beet, respec-          cultural practices have been developed (e.g., for Denmark
tively (Food and Agriculture Organization of the United Na-         (Skjøth et al., 2004), for the UK (Hellsten et al., 2008), and
tions FAO; Schauberger et al., 2018). Through this food cul-        for mineral fertilization in springtime in France, Hamaoui-
tivation and also due to animal husbandry, agriculture is the       Laguel et al., 2014). Limitations for such approaches come
main source of ammonia (NH3 ) in the country. As an impor-          from the fact that detailed agricultural data needed as input
tant gaseous precursor of particulate pollution, harmful to hu-     for such models are not available for most of the European
man life (Lelieveld et al., 2015; WHO, 2016), ammonia plays         countries. Moreover, agricultural practices of a specific coun-
an important role in the regulation of inorganic aerosol con-       try cannot be extrapolated to another country (Skjøth et al.,
centrations (Erisman and Schaap, 2004, Bauer et al., 2016)          2011).
and contributes to N deposition and potential exceedance               As an alternative to direct emission modeling, attempts
of critical loads of ecosystems (Erisman et al., 2007; EEA          have been made to constrain ammonia emissions through in-
European Environment Agency, 2014). In order to limit air           verse approaches, based on ammonium wet deposition data
pollution, also responsible for acidification and eutrophica-       (Paulot et al., 2014) or on satellite-observed atmospheric
tion, the new European National Emission Ceilings Direc-            ammonia distributions, e.g., from the Tropospheric Emis-
tive 2016/2284, replacing the Directive 2001/81/EC, has now         sion Spectrometer (TES) (Zhu et al., 2013; Zhang et al.,
set ambitious national reduction commitments for ammonia.           2018), from the Infrared Atmospheric Sounding Interfer-
Ammonia emissions indeed have to be reduced by 19 % in              ometer (IASI) (Fortems-Cheiney et al., 2016; Van Damme
2030, compared with the 2005 levels (OJEU, 2016).                   et al., 2018; Adams et al., 2019) or from the Cross-track In-
   At the European scale, total NH3 emissions are pro-              frared Sounder (CrIS) (Adams et al., 2019; Dammers et al.,
vided by the European Monitoring and Evaluation Program             2019). In principle, such emission estimates can be available
(EMEP) (Vestreng, 2005) or by the TNO-MACCIII (Kue-                 shortly after observation. The advantage of satellite-derived
nen et al., 2014) inventories that rely on national annual dec-     estimates is also that these can be derived globally, at a high
larations and estimates of emission factors. Emissions are          temporal scale (e.g., daily scale under clear sky). The down-
accounted for without separating fertilization and livestock.       side of these, however, is that they do not provide informa-
These reference inventories are widely used by the scientific       tion on the underlying sources of the emissions (fertilizers
community to study the impact of pollutant emissions on the         vs. husbandry), or for example the date of fertilization, the
chemical composition of the troposphere and on air qual-            type of fertilizers used, the fertilization rates, etc., that could
ity. Nevertheless, uncertainties on the quantification of the       be important for the regulation of NH3 emissions.
NH3 emissions are usually estimated to be between 100 %                In this context, we compare ammonia emissions in France
and 300 % of the annual budgets in the reference invento-           from inventories using the different approaches mentioned
ries (EMEP/EEA, 2016; Kuenen et al., 2014). In addition, the        above: (i) the reference, in the sense that this is the method
temporal and spatial variability may not be well represented        currently used, hereafter called TNO-GEN, is the European
in the reference inventories, as the temporal profiles used do      inventory based on the annual budgets provided by the TNO-
not account for meteorology, soil properties and other local        MACCIII inventory (Kuenen et al., 2014) and on seasonal
conditions. Moreover, fertilizer spreading is of particular in-     profiles from GENEMIS (Ebel et al., 1997); (ii) a first al-
terest, as these are applied during small periods, especially       ternative inventory, hereafter called NH3 SAT, is based on
during a few weeks at the end of winter and early spring.           a top-down approach starting from the IASI-derived NH3
However, the exact timing of fertilizer spreading is difficult      columns; (iii) the other alternative inventory, hereafter called
to predict, as it depends on agricultural practices and me-         CADASTRE-CIT, is based on a bottom-up approach quanti-
teorological conditions, which is not taken into account in         fying NH3 emissions due to nitrogen fertilization combining
the temporal disaggregation of the reference emission in-           spatiotemporal data and calculations performed within the
ventories. Both the inaccurate temporal resolutions and the         CADASTRE_NH3 framework with the mechanistic model
misrepresentation of the spreading emissions largely explain        VOLT’AIR (Ramanantenasoa et al., 2018; Génermont et al.,
the difficulty encountered by models to represent seasonal or       2018) completed with livestock and other source emissions
daily patterns of NH3 concentrations (Menut et al., 2012),          from the French Interprofessional Technical Centre for Stud-
and consequently particulate matter levels (Fortems-Cheiney         ies on Air Pollution (CITEPA). This study aims at assess-
et al., 2016).                                                      ing the potential contribution of better spatial and temporal
   To reduce these uncertainties, a better quantification of        representation of fertilization-related ammonia emissions to
agricultural ammonia emissions and their temporal and spa-          the quality of ammonia emission inventories. The improve-
tial evolution is necessary. In particular, one of the challenges   ment is assessed in terms of total budget, spatial distribu-

Atmos. Chem. Phys., 20, 13481–13495, 2020                                            https://doi.org/10.5194/acp-20-13481-2020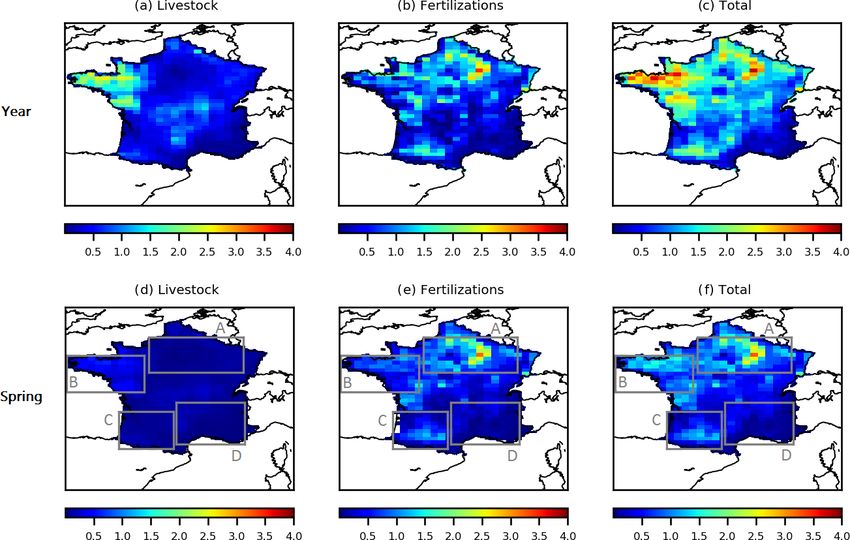
A. Fortems-Cheiney et al.: Spatiotemporal representation of ammonia emissions in France                                        13483

tion and timing of the emissions. The study period, spring           France (Ebel et al., 1997). The emissions remain constant
2011 (from 1 March to 31 May 2011), was chosen follow-               between days in each month and between hours in each day.
ing three criteria. Firstly, because at the time of the study, the
last French agricultural data were available from AGRESTE            2.2     NH3 SAT
(AGRESTE, 2014) for the agricultural year 2010–2011, al-
lowing the application of the CADASTRE_NH3 framework                 As a first alternative, a mass-balance approach, which is a
for the quantification of the spatiotemporal distribution of         common method for the quantification of the surface fluxes
NH3 emissions due to nitrogen fertilization for this crop year       of short-lived species (Palmer et al., 2003; Jaeglé et al., 2004;
(Ramanantenasoa et al., 2018; Génermont et al., 2018). Sec-          Boersma et al., 2008; Lin et al., 2010) was set up. We used
ondly, ammonia emissions are enhanced during spring in ac-           it to deduce NH3 emissions from differences between NH3
cordance with crop requirements (Skjøth et al., 2004; Ra-            total columns observed by the IASI instrument and simulated
manantenasoa et al., 2018; Génermont et al., 2018). Finally,         by the CHIMERE regional chemical transport model (CTM)
unlike autumn and winter months, the NH3 spring levels are           using the TNO-GEN inventory as inputs data.
detectable with a better confidence in the IASI satellite ob-
servations (Viatte et al., 2020), allowing the extension of the      2.2.1   The regional CTM CHIMERE
preliminary work of Fortems-Cheiney et al. (2016) to deduce
NH3 emissions from the IASI satellite instrument.                    CHIMERE simulates concentrations of gaseous and par-
   The three inventories and methods to build them used for          ticulate chemical species (Menut et al., 2013; Mailler
this study are presented in Sect. 2, and the results of the com-     et al., 2017). For this study, we used the CHIMERE ver-
parison are given and discussed in Sect. 3.                          sion 2013a. The horizontal resolution is given as follows:
                                                                     0.5◦ × 0.25◦ over 32◦ N–70◦ N, 17◦ W–40◦ E, including 115
                                                                     (longitude) × 53 (latitude) grid cells. The vertical grid con-
2     Inventories                                                    tains 17 layers from the surface to 200 hPa. This model is
                                                                     driven by the European Centre for Medium-Range Weather
The three inventories TNO-GEN, NH3 SAT and                           Forecasts global meteorological fields (Owens and Hewson,
CADASTRE-CIT compared in this study are described                    2018). Climatological values from the LMDz-INCA global
in Table 1 and in the following sections. It is worth noting         model (Szopa et al., 2008) are used to prescribe concentra-
that only the CADASTRE-CIT inventory provides infor-                 tions at the lateral and top boundaries and the initial atmo-
mation on the respective contribution of fertilization and           spheric composition in the domain. For inorganic species,
livestock emissions. The spatial and temporal resolutions of         aerosol thermodynamic equilibrium is achieved using the
the inventories are also shown in Table 1.                           ISORROPIA model (Nenes et al., 1998).
   The inter-comparison is made at the 0.5◦ (longi-                     As in most of the models in the world, the parameteriza-
tude) × 0.25◦ (latitude) resolution. The outputs of the TNO-         tion of NH3 dry deposition is unidirectional in CHIMERE.
GEN and the CADASTRE-CIT inventories could have con-                 The parameterization of a bidirectional exchange with sur-
sequently been aggregated or disaggregated.                          faces in Wichink Kruit et al. (2012) increased their yearly
                                                                     mean modeled LOTOS-EUROS European ammonia concen-
2.1    TNO-GEN                                                       trations almost everywhere, and particularly over agricultural
                                                                     source areas. However, Zhu et al. (2015), with the Goddard
In this study, TNO-GEN combines the annual budgets pro-              Earth Observing System-Chemistry (GEOS-Chem) global
vided by the TNO-MACCIII inventory and the seasonal pro-             CTM, estimated a decrease in NH3 European concentrations
files to deduce the monthly variability of NH3 emissions.            in April, when the inclusion of a compensation point for veg-
This inventory is based on official annual emission data sub-        etation is included. Further work needs to be done to bet-
mitted by countries to EMEP/CEIP (European Monitoring                ter investigate the sensitivity of NH3 concentrations to the
and Evaluation Programme/Centre on Emission Inventories              deposition. Nevertheless, without such parameterization for
and Projections) for air pollutants. It is the update of the         bi-directional exchange, Azouz et al. (2019) assessed that
TNO-MACCII inventory (Kuenen et al., 2014). It is an inven-          regional models such as CHIMERE usually operating with
tory at 0.125◦ × 0.0625◦ resolution providing annual emis-           large grid cell sizes simulate quite well the average NH3 dry
sions of NH3 from the agricultural sector, without separating        deposition flux over a large domain of simulation.
the contributions from fertilization and livestock. Hereafter,          The evaluation of CHIMERE NH3 and NH+          4 concentra-
we use the TNO-MACIII emissions of the year 2011. The                tions should be done against NH3 (as done in Fortems-
seasonal profile of these emissions is prescribed according to       Cheiney et al., 2016) and NH+    4 measurements. Neverthe-
the typical national factors provided by GENEMIS. This sea-          less, to our knowledge, there is no available NH3 measure-
sonal temporal profile used for the temporalization of emis-         ment over France for the focused period here. There is inter-
sions – the same one applied to the entire country – leads to        pretable NH+ 4 surface measurements at only one site, mak-
a maximum in NH3 emissions systematically in April over              ing the interpretation of the results difficult. NH3 and NH+4

https://doi.org/10.5194/acp-20-13481-2020                                          Atmos. Chem. Phys., 20, 13481–13495, 2020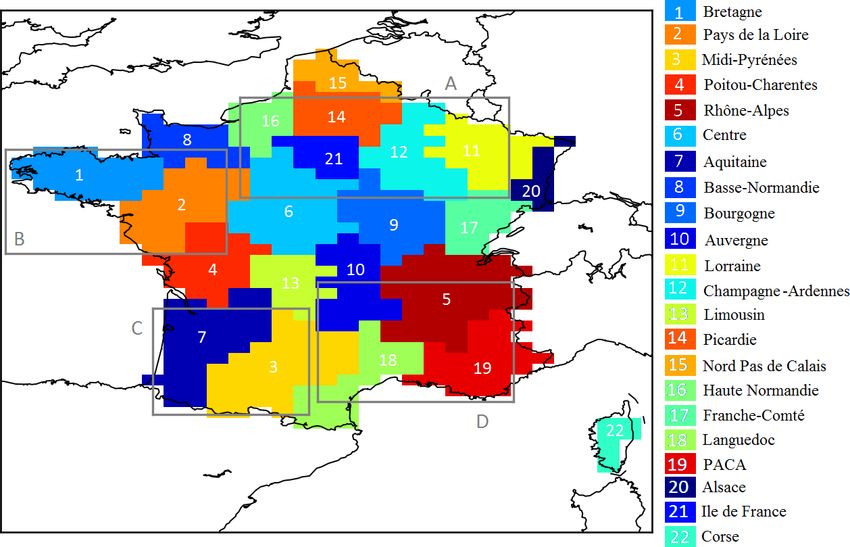
13484 A. Fortems-Cheiney et al.: Spatiotemporal representation of ammonia emissions in France
Table 1. Main characteristics of the different compared inventories before their aggregation and disaggregation for the inter-comparison.
Name Spatial resolution Temporal Fertilization emissions Livestock emissions
(latitude × longitude) resolution
TNO-GEN 0.125◦ × 0.0625◦ Monthly –
NH3 SAT 0.5◦ × 0.25◦ Daily –
CADASTRE-CIT 0.015625◦ × 0.03125◦ Hourly CADASTRE_NH3
Ramanantenasoa et al.
(2018); Génermont et al.
(2018)
0.007825◦ × 0.007825◦ Daily CITEPA national emissions,
temporalized according to
Skøjth et al. (2011)
comparisons during other periods are also scarce. For in- 0.5◦ × 0.25◦ resolution and for the given CHIMERE physical
stance, Tuccella et al. (2019) compared CHIMERE simu- time step of about 5–10 min). As suggested by Van Damme
lated and observed NH+ 4 a the Cabaux supersite and found et al. (2017), we no longer use weighted averages for this pur-
average concentrations for May 2008 of 1.3 µg m3 for both, pose. We performed a sensitivity test by selecting the IASI
with a correlation coefficient of 0.52. For the Paris agglom- pixels for which the retrieval error does not exceed 100 %:
eration between September 2009 and 2010, the modeled re- the results of the temporal and spatial variability of the NH3
gional NH+ 3
4 burden was 1.8 µg m while the modeled one French emissions presented in Sect. 3 did not significantly
3
was 1.6 µg m (Petetin et al., 2016). From June to Septem- change, showing the robustness of the IASI NH3 product (not
ber 2010, 83 % of modeled total NHx was gaseous, while in shown).
the model, it was only 50 %; coherent with this, NH3 was un- The resulting monthly means of IASI NH3 columns from
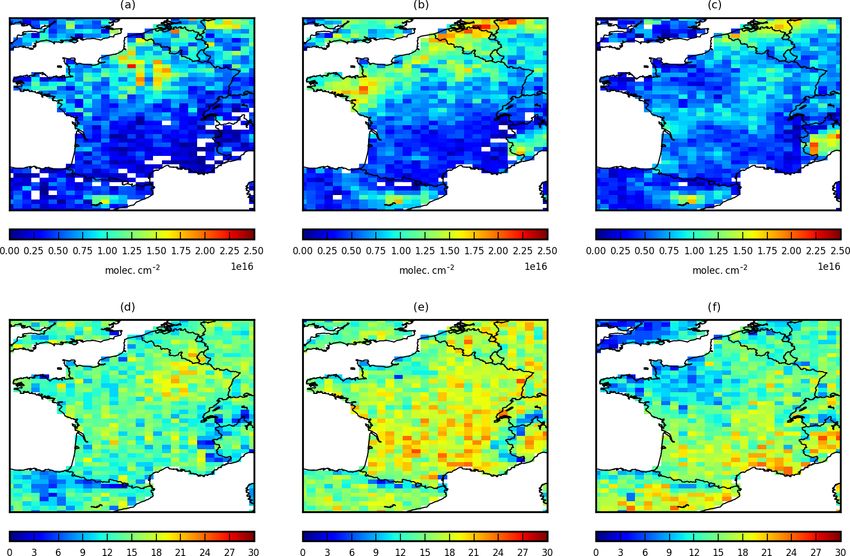
derestimated especially during warmer days. Thus, it is con- March to May 2011 are shown in Fig. 1a–c. The spatiotem-
cluded for one site and season that particulate NH+
4 has a low poral variability – with the highest values over northeastern
to medium impact on NH3 . France in March, and over northwestern France in April –
is confirmed by the IASI 10-year and by the CrIS 5-year
2.2.2 The IASI observations monthly means shown in Viatte et al. (2020). Note that the
potential of IASI to provide information at high temporal
We use data from the IASI-A instrument, flying on a low resolution, up to daily scale, can be hampered by the cloud
Sun-synchronous polar orbit aboard the Metop satellite since coverage as only observations with a cloud coverage lower
October 2006, with Equator crossing times of 09:30 (de- than 10 % are delivered (Van Damme et al., 2017). To eval-
scending mode) and 21:30 (ascending mode) local sidereal uate the impact of this limitation, the number of IASI super-
time (LST) (Clerbaux et al., 2009, Clarisse et al., 2009). The observations used to calculate these monthly means, which
spatial resolution of its observations is about 12 km × 12 km represents the number of days over a month covered by IASI,
at nadir. The algorithm used to retrieve NH3 columns from is shown in Fig. 1d–f. On average, more than half of the
the radiance spectra is described in Van Damme et al. (2017). month is sampled by IASI during spring, except in May in
Several improvements have been introduced since the de- the northwestern part of France. The regions showing large
scription of Van Damme et al. (2014) and the version v1 IASI NH3 values are consequently well sampled.
used in our previous study (Fortems-Cheiney et al., 2016).
In this study, we use the reanalyzed dataset ANNI-NH3- 2.2.3 Deducing NH3 SAT emissions
v2.2R, relying on ERA-Interim meteorological input data
from the European Centre for Medium-Range Weather Fore- Relative differences between simulated columns by the
casts (ECMWF) rather than the operationally provided Eu- CHIMERE regional CTM (described in Sect. 2.2.1, using
metsat IASI Level 2 (L2) data used for the standard near- the TNO-GEN emissions for the year 2011, described in
real-time version (Van Damme et al., 2017). We only con- Sect. 2.1) and observed IASI total columns (described in
sider land measurements from the morning overpass, as IASI Sect. 2.2.2) are applied as a corrective factor to the reference
is more sensitive at this time to the boundary layer, owing to emissions at daily and at grid-cell resolutions over France,
more favorable thermal conditions (Clarisse et al., 2010, Van from February to May 2011. As IASI “super-observations”
Damme et al., 2014). provide one piece of information per day, the diurnal time
The IASI total columns are averaged into “super- profile of reference emissions cannot be improved: we apply
observations” (average of all IASI data within the the same daily correction factor to all hourly NH3 emissions.
Atmos. Chem. Phys., 20, 13481–13495, 2020 https://doi.org/10.5194/acp-20-13481-2020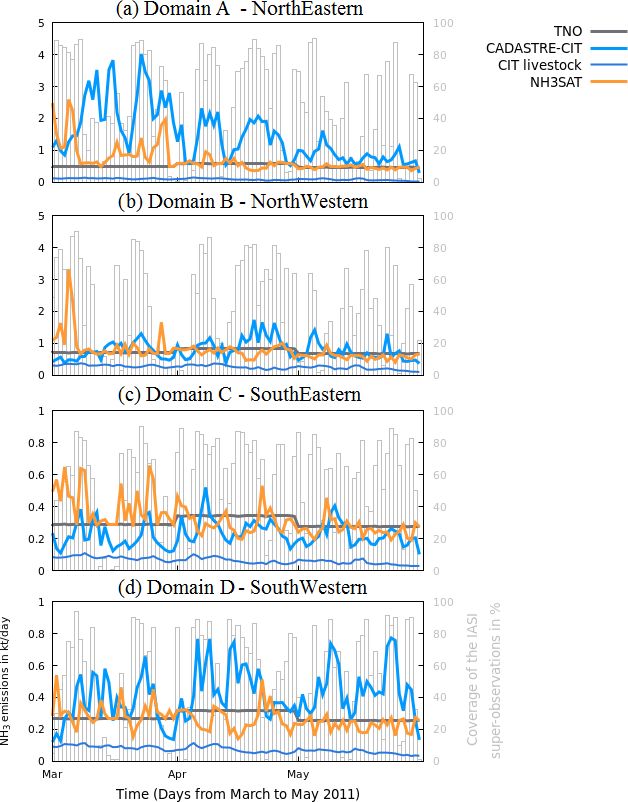
A. Fortems-Cheiney et al.: Spatiotemporal representation of ammonia emissions in France                                         13485

Figure 1. (a–c) Monthly means of IASI “super-observations” for (a) March 2011, (b) April 2011 and (c) May 2011. Units are molecules per
square centimeter (molec. cm−2 ). (d–f) Total number of IASI super-observations per month in (d) March 2011, (e) April 2011 and (f) May
2011.

When IASI is not available (i.e., observations with a cloud           emissions from IASI ANNI-NH3 -v2.2R super-observations.
coverage higher than 10 %), the correction is not applied and         Additional uncertainty comes from the IASI observations.
the emissions remain equal to the TNO-GEN ones. To com-               The IASI minimum detection limit is about 2–3 ppbv (∼ 4–
pare the emissions with the CADASTRE-CIT inventory, and               6.1015 molec. cm−2 ) (Clarisse et al., 2010). The signal-to-
their respective simulations with CHIMERE, the correction             noise ratio therefore presents better performance for regions
is only applied over France here.                                     with high local concentrations (e.g., northern part of France,
   With the mass-balance approach, the transport to neigh-            Fig. 1) than over low local concentration areas (e.g., southern
boring cells is assumed to be negligible following Palmer             parts of France, Fig. 1). There is no evaluation available yet
et al. (2003). This approach has been debated by Turner et al.        for the IASI ANNI-NH3 -v2.2R product used here.
(2012), who found that non-local sources contribute sub-
stantially to columns of short-lived species. Li et al. (2019)        2.3   CADASTRE-CIT
evaluated the ability of both a mass-balance approach and
a variational assimilation to recover known NH3 emissions
at different spatial resolutions. At a 2◦ × 2.5◦ resolution,          As a second alternative, a bottom-up approach was set up
they found that both methods yielded similar values. At a             based on the finest national inventories available for anthro-
0.25◦ × 0.3125◦ , the mass-balance approach led to values             pogenic sources of ammonia. The CADASTRE_NH3 frame-
about 20 % higher compared to the variational ones. With              work provides such an inventory for organic and mineral fer-
our 0.5◦ × 0.25◦ resolution, the use of a mass-balance ap-            tilization practices. This is, however, not the case for the
proach would lead to additional errors of less than about 20 %        other anthropogenic sources. For livestock emissions, with
for the quantification of NH3 emissions. This uncertainty is          the exception of the stage of effluent spreading in the field,
acceptable and much lower than the uncertainty existing in            the less detailed inventory of the CITEPA is used. To meet
the annual and national budgets provided by emission in-              the objectives of better specialization and temporalization,
ventories (EMEP/EEA, 2016). In this context, we choose                specific procedures are applied. These inventories are com-
to perform such a mass-balance approach to deduce NH3                 pleted by the TNO-GEN inventory for the emissions of the
                                                                      other sectors.

https://doi.org/10.5194/acp-20-13481-2020                                            Atmos. Chem. Phys., 20, 13481–13495, 2020
13486 A. Fortems-Cheiney et al.: Spatiotemporal representation of ammonia emissions in France
2.3.1 Fertilization emissions from CADASTRE_NH3 nia emissions per hour, per hectare, per crop type, per SAR.
Emissions can be aggregated at different spatial and tempo-
CADASTRE_NH3 was implemented in order to represent ral scales. At the spatial scale, they are weighted with the
in a realistic way spatiotemporal variability of French NH3 contribution of (i) each N fertilization management applied
emissions due to mineral and organic N fertilization and is to each crop in each SAR and (ii) the area of the crop cul-
fully described in Ramanantenasoa et al. (2018) and in Gén- tivated in the SAR. A procedure allows ammonia emissions
ermont et al. (2018). It has been constructed through the to be produced at the required grid scale for the inventory
combined use of two types of resources: the process-based comparison: it is based on cultivated areas for each crop as
VOLT’AIR model and geo-referenced and temporally ex- the key of desegregation-reaggregation from the SAR to the
plicit databases for soil properties, meteorological conditions 0.015625◦ × 0.03125◦ grid. At the temporal scale, emissions
and N fertilization. are aggregated over daily, weekly or monthly bases for the
VOLT’AIR is a 1D process-based model predicting NH3 sake of comparison with TNO-GEN and NH3 SAT inven-
emissions from N fertilizers on bare soils, from physical, tories. Volatilization taking place over several days, from a
chemical and biological processes (Le Cadre, 2004; Gar- few days to several weeks, one fertilization in one field con-
cia et al., 2012). It incorporates current knowledge on NH3 tributes to ammonia emissions over several days or weeks.
volatilization after application of the main types of organic Weather condition effects on overall ammonia emissions are
manure and mineral N fertilizers in the field. It takes into ac- thus the result of both their effects on fertilization timing
count the major factors known to influence NH3 volatiliza- and their effects on volatilization intensity and dynamics over
tion in the field, i.e., soil properties, weather conditions, cul- 30 d from fertilizer application.
tural practices, and properties of mineral fertilizers and or- As they are not available in the agricultural practice sur-
ganic products. It runs at an hourly time step at the field vey, N fertilizations of vegetables, fruits and vines are not ac-
scale for a period of several weeks, thus covering the entire counted for in CADASTRE_NH3 : their contribution is minor
volatilization duration of fertilization events. for France overall, only accounting for 5 % of the total agri-
Local features are attributed to each simulation unit, the cultural area (AGRESTE, 2010), but is important in particu-
small agricultural regions (SARs): local weather conditions lar regions. As the agricultural practice survey does not pro-
(SAFRAN, Météo-France); the dominant soil type of the vide information over Corsica, this inventory is completed by
SAR from the European Soil Data Center (ESDC), with soil the TNO-GEN inventory over this region.
properties provided by the Harmonized World Soil Database
(HWSD) of the Food and Agriculture Organization (FAO); 2.3.2 Livestock emissions
areas cultivated in the crop year 2010–2011 per crop per
region, derived from the European Land Parcel Identifi- As for the TNO-GEN inventory, French NH3 emissions from
cation System (LPIS, Common Agricultural Policy (CAP) livestock for the CADASTRE-CIT inventory are generated
regulations); and nitrogen fertilization management prac- by using annual national emissions provided by CITEPA for
tices, derived from data of the national AGRESTE survey 2011 (Fig. 3a). Nevertheless, here these emissions have been
of cultural practices for arable crops and grassland (Depart- spatially distributed differently than for the TNO-GEN in-
ment of Statistics and Forecasting of the French Ministry of ventory. This has been done by using the FAO Gridded Live-
Agriculture) (AGRESTE, 2014). All input data required by stock of the World database with a resolution of 30 arcsec.
VOLT’AIR are geographically overlaid and intersected with The temporalization of the emissions has been performed as
a geographical information system to generate input combi- a function of temperature and wind speed with the parame-
nations in each SAR. Each input combination is used as the terizations of Skøjth et al. (2011) for the different subsectors.
input data for a virtual 300 m × 300 m field for a simulation
using VOLT’AIR. Exact times and dates of fertilizations are
required to run VOLT’AIR, but for the sake of robustness, 3 Results and discussion
the statistical analysis of the survey data has been performed
on the basis of 2-week intervals for the date of fertilization. First, we analyze the different contributions of livestock and
Fertilizations are thus randomly distributed within these 2- of fertilization to the spring budget in the CADASTRE-CIT
week intervals in proportion to their respective representa- inventory. Then, the comparison of the two alternative inven-
tion following Ramanantenasoa et al. (2018). Each simula- tories NH3 SAT and CADASTRE-CIT versus the reference
tion of NH3 emissions is run at an hourly time step for a inventory TNO-GEN and their inter-comparison are made at
period of 2 months, starting 1 month before the fertilization different temporal and spatial resolutions. We evaluate the in-
in order to calculate soil water content at the time of appli- ventories at the national scale and at the scale of the different
cation, and ending one month after fertilization, in order to French administrative regions (the administrative division in
cover the whole volatilization event. France on level 2 of the unified NUTS territory classification,
About 160 000 runs with the VOLT’AIR model have been NUTS2, shown in Fig. 2). We also analyze their spatial vari-
performed over the crop year 2010–2011 to produce ammo- ability at the 0.5◦ (longitude) × 0.25◦ (latitude) resolution in
Atmos. Chem. Phys., 20, 13481–13495, 2020 https://doi.org/10.5194/acp-20-13481-2020A. Fortems-Cheiney et al.: Spatiotemporal representation of ammonia emissions in France 13487
Figure 2. Localization and names of the different French regions as taken into account in this study. The regions are listed according
to the TNO-GEN annual budget, in descending order. The grey boxes A–D describe the domains we call the northeastern, northwestern,
southeastern and southwestern parts of France, respectively, in the paper.
order to draw a first picture of the consistency of the inven- (Hamaoui-Laguel et al., 2014; Ramanantenasoa et al., 2018;
tories in terms of the spring NH3 total budget and to identify Génermont et al., 2018) – parameters not taken into account
regions of interest. Finally, we focus on the temporal vari- by the TNO-GEN inventory – seem to be the factors respon-
ability of the identified regions and discuss the agricultural sible for the high emissions in this domain.
practices that can influence the variability but also down to The second domain of interest is the northwestern part
which temporal resolution the comparison of the inventories of France (box B in Fig. 2). Over this domain with high
is relevant. emissions, the NH3 emissions are due in roughly equal parts
to livestock (including animal housing, manure storage and
3.1 Respective contributions of different sources grazing) and to fertilization, with a high use of organic ma-
nure (Ramanantenasoa et al., 2018). Livestock farming in-
deed produces large amounts of livestock manure available
The different contributions of livestock and of fertilization
for application on grassland and on arable crops.
to the annual and to the spring budget in the CADASTRE-
The third domain of interest is the southeastern part of
CIT inventory are shown in Fig. 3. This figure shows that the
France (box C in Fig. 2), showing the smallest spring NH3
contribution of fertilization to the annual French budget can
emissions. Finally, the contribution of fertilization on the
be strong, with emissions occurring mainly during spring.
emissions of the southwestern part of France (box D in
The different contributions of livestock and of fertiliza-
Fig. 2) is strong.
tion to the spring budget in the CADASTRE-CIT inventory
highlight four different domains of interest. We can see that
the contribution of fertilization on the high emissions of the 3.2 French spring NH3 total budget and its main
northeastern part of France (box A in Fig. 2) is strong. For spatial features
example, the contribution of fertilization is about 99 % in the
region Champagne-Ardennes, and about 85 % in the region The spring NH3 total budget is shown in Table 2 at the na-
Picardie (Table 2). These emissions are mainly due to the tional scale and at the French regional scale. The French
use of mineral fertilizer on barley, sugar beet and potato (Ra- spring ammonia budgets, calculated for the period from
manantenasoa et al., 2018; Génermont et al., 2018). In partic- March to May 2011, estimated by the NH3 SAT (264 kt NH3 )
ular, the use of urea or nitrogen solution and the high soil pH and the CADASTRE-CIT (354 kt NH3 ) inventories, are both
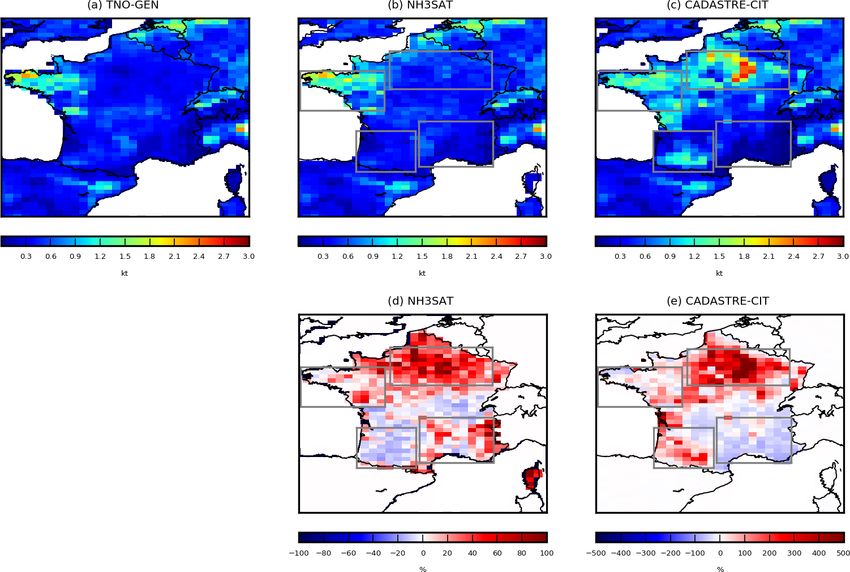
https://doi.org/10.5194/acp-20-13481-2020 Atmos. Chem. Phys., 20, 13481–13495, 202013488 A. Fortems-Cheiney et al.: Spatiotemporal representation of ammonia emissions in France Figure 3. (a–c) Yearly NH3 emissions due to (a) livestock husbandry and manure storage, (b) N fertilization (organic and mineral), and (c) all sources in the CADASTRE-CIT inventory, in kilotons of NH3 (kt NH3 ). (d–f) The same for spring NH3 emissions, from March to May 2011. higher than the TNO-GEN reference one (234 kt NH3 ).The rates; and fertilizer-, crop- and application-specific emis- CADASTRE-CIT inventory estimates higher NH3 spring sion factors. Emissions are higher for both NH3 SAT and emissions, by about 30 %, than NH3 SAT. CADASTRE-CIT inventories compared to TNO-GEN over The relative agreement on national budget between TNO- the Champagne-Ardennes (+337 % and +63 %, respec- GEN and NH3 SAT must be nuanced as total budget values tively, for CADASTRE-CIT and NH3 SAT, Table 2), Picardie from NH3 SAT and TNO-GEN are close, but large differences (+275 %, and +50 %, respectively), Centre (+146 % and in the spatial distribution of the French NH3 emissions be- +15 %, respectively), Haute-Normandie (+71 % and +28 %, tween TNO-GEN and both NH3 SAT and CADASTRE-CIT respectively), Lorraine (+88 %, and +33 %, respectively) can be observed (Fig. 4). and Île de France regions (+200 %, and +33 %, respec- Indeed, over France and for the spring budget, the spa- tively). tial correlation compared to the CADASTRE-CIT inven- The northwestern part of France presents the largest NH3 tory, which should better represent the agricultural practices emissions according to the TNO-GEN inventory (Fig. 4a). and their spatial distribution, is improved when using the The TNO-GEN, NH3 SAT and CADASTRE-CIT inventories NH3 SAT inventory instead of using TNO-GEN (Pearson cor- lead to similar spring budget (68, 73 and 71 kt NH3 , respec- relation coefficient r = 0.78 with NH3 SAT against r = 0.72 tively), over this domain. with TNO-GEN). Over the southeastern part of France, CADASTRE-CIT The northeastern part of France presents the largest is about 23 % lower than NH3 SAT (28 and 37 kt NH3 , re- difference with the TNO-GEN inventory (48 kt NH3 ) for spectively, Table 2). One hypothesis to explain the lower both NH3 SAT and CADASTRE-CIT inventories (65 and NH3 emissions in CADASTRE-CIT is that market garden- 135 kt NH3 , respectively). The high emissions in the ing is important in this area and not taken into account in the northeastern part of France are in agreement with the CADASTRE-CIT inventory (Ramanantenasoa et al., 2018; MASAGE_NH3 inventory (Paulot et al., 2014), the mag- Génermont et al., 2018). Nevertheless, market gardening is nitude of their annual NH3 emissions from mineral fertil- not included, to our knowledge, in the TNO-GEN inventory. izer being calculated by combining an inventory of crop TNO-GEN and NH3 SAT inventories being in quite good acreages; crop- and country-specific fertilizer application agreement in terms of budget (35 and 37 kt NH3 , respectively, Atmos. Chem. Phys., 20, 13481–13495, 2020 https://doi.org/10.5194/acp-20-13481-2020
A. Fortems-Cheiney et al.: Spatiotemporal representation of ammonia emissions in France                                               13489

Table 2. French national and regional budgets of NH3 spring emissions, from March to May 2011, in kilotons of NH3 (kt NH3 ). The relative
differences compared to the TNO-GEN are presented between brackets, in percentage. Regions for which the inventories NH3 SAT and
CADASTRE-CIT propose the same sign of relative differences are marked in bold. The contributions of the fertilization emissions to the
NH3 regional spring budget in the CADASTRE-CIT inventory are shown in percentage.

                                  TNO-GEN             NH3 SAT         CADASTRE-CIT         Contribution of the fertilization to the
                                  (in kt NH3 )        (in kt NH3 )    (in kt NH3 )         spring budget in CADASTRE-CIT
                                                                                           (in percentage)
       Regions in the northeastern part of France (box A in Fig. 2)
       Champagne-                                 8     13 (+63 %)        35 (+337 %)                                           99
       Ardennes
       Centre                                    13     15 (+15 %)        32 (+146 %)                                           81
       Lorraine                                   9     12 (+33 %)         17 (+88 %)                                           80
       Picardie                                   8     12 (+50 %)        30 (+275 %)                                           85
       Haute-Normandie                            7      9 (+28 %)         12 (+71 %)                                           75
       Île de France                              3      4 (+33 %)         9 (+200 %)                                           77
       Regions in the northwestern part of France (box B in Fig. 2)
       Bretagne                                  34          34 (=)          30 (−12 %)                                         61
       Pays de la Loire                          25     28 (+12 %)           29 (+16 %)                                         45
       Regions in the southeastern part of France (box C in Fig. 2)
       Rhône-Alpes                               13      14 (+8 %)            12 (−8 %)                                         37
       Auvergne                                  12          12 (=)           11 (−8 %)                                         41
       Languedoc                                  5      6 (+20 %)            3 (−40 %)                                         53
       PACA                                       5           5 (=)           2 (−60 %)                                         47
       Regions in the southwestern part of France (box D in Fig. 2)
       Midi-Pyrénées                             18          18 (=)          26 (+44 %)                                         60
       Aquitaine                                 12      11 (−8 %)           15 (+25 %)                                         50
       Other regions
       Alsace                                     4      5 (+25 %)           7 (+175 %)                                         87
       Basse-Normandie                           11     15 (+36 %)           15 (+36 %)                                         68
       Bourgogne                                 11     13 (+18 %)           20 (+81 %)                                         55
       Franche-Comté                              6           6 (=)            8 (+33 %)                                        43
       Limousin                                   8           8 (=)            6 (−25 %)                                        21
       Nord-Pas-de-Calais                         8     11 (+38 %)           10 (+25 %)                                         97
       Poitou-Charentes                          14          14 (=)          25 (+79 %)                                         63
       France
                                             234      264 (+13 %)         354 (+51 %)                                           67

Table 2), further work is required to understand these dis-            3.3    Temporal variability of the NH3 emissions at the
crepancies.                                                                   subseasonal scale
   Finally, over the southwestern part of France (box D in
Fig. 2), IASI observations only trigger slight corrections to
the TNO-GEN inventory over this area (29 and 30 kt NH3 , re-
                                                                       Monthly regional budgets have been calculated for the three
spectively), and CADASTRE-CIT is 36 % higher than TNO-
                                                                       inventories. Figure 5 presents the monthly variability of the
GEN and NH3 SAT (Table 2).
                                                                       NH3 emissions from February to May 2011 for the four do-
                                                                       mains of interest presented above. February is only displayed
                                                                       here as a baseline to show the sharp peak of NH3 emissions
                                                                       in March over some domains. The contribution of the emis-
                                                                       sions due to livestock in the CADASTRE-CIT spring budget
                                                                       is also given.

https://doi.org/10.5194/acp-20-13481-2020                                             Atmos. Chem. Phys., 20, 13481–13495, 2020
13490 A. Fortems-Cheiney et al.: Spatiotemporal representation of ammonia emissions in France
Figure 4. French NH3 spring emissions estimated by (a) the TNO-GEN inventory, (b) the NH3 SAT inventory and (c) the CADASTRE-
CIT inventory, in kilotons of NH3 (kt NH3 ). Relative differences of (d) the NH3 SAT, and (e) the CADASTRE-CIT inventories compared
to the TNO-GEN inventory, in percentage, at the pixel resolution, for the period from March to May 2011. Note that the scale is different
between (b) and (c).
The TNO-GEN inventory shows rather similar NH3 emis- biased compared to CADASTRE-CIT) is used as a prior for
sions from March to May for all regions, with a slight the mass balance approach with no correction applied to this
maximum in April (Fig. 5a), imposed by the GENEMIS prior when IASI observations are not available.
monthly profiles used for the temporalization of emissions To go further in the comparison, we analyzed the daily
(Ebel et al., 1997). On the contrary, over the northeastern variability of the NH3 SAT and CADASTRE-CIT inven-
part of France, both NH3 SAT and CADASTRE-CIT inven- tories, with TNO-GEN representing no daily variability
tories show a maximum in March, and a decrease until May (Fig. 6). To interpret the results, some limitations of the in-
by about a factor of 1.5 to 2 (Fig. 5a). This maximum in ventories have to be considered. For NH3 SAT, the correc-
March is also noticed by Tournadre et al. (2020), provid- tions applied to the TNO-GEN emissions are only applied for
ing 9 years of total column observations from ground-based clear-sky conditions when IASI observations are available.
infrared remote sensing over the Paris megacity. We calcu- In the CADASTRE-CIT, fertilization days are randomly se-
lated the monthly contribution of livestock to the NH3 emis- lected within two-week intervals of application extracted
sions based on CADASTRE-CIT, which allows one to sepa- from the farm survey analysis (Ramanantenasoa et al., 2018);
rate this contribution from the fertilization one. As in Fig. 3, thus the actual day of fertilization is unknown. However,
Fig. 5a confirms that NH3 emissions are mainly due to fer- the NH3 volatilization is continuous over several days after
tilization in the northeastern part of France and shows that spreading, reducing the uncertainty introduced by this ran-
the seasonal variation is mainly driven by this contribution. dom selection. Moreover, the random selection is made at
CADASTRE-CIT shows larger values than NH3 SAT, which the field scale (see Sect. 2.3), and then spatially averaging at
might be partly due to a possible low bias in the IASI obser- the CHIMERE resolution should also smooth the random se-
vations (Dammers et al., 2017; Tournadre et al., 2020), com- lection effect. Both effects of weather conditions on fertiliza-
bined with the fact that the TNO-GEN inventory (negatively tion timing, on the one hand, and on volatilization intensity
Atmos. Chem. Phys., 20, 13481–13495, 2020 https://doi.org/10.5194/acp-20-13481-2020A. Fortems-Cheiney et al.: Spatiotemporal representation of ammonia emissions in France 13491
Figure 5. Time series of monthly NH3 emissions estimated
by TNO-GEN (in black), by NH3 SAT (in orange) and by Figure 6. Time series of daily NH3 emissions estimated by TNO-
CADASTRE-CIT (in blue) inventories, from February to May GEN (in black), by NH3 SAT (in orange) and by CADASTRE-CIT
2011, for (a) domain A (northeastern), (b) domain B (northwest- (in blue) inventories, from March to May 2011, for (a) domain A
ern), (c) domain C (southeastern) and (d) domain D (southwestern), (northeastern), (b) domain B (northwestern), (c) domain C (south-
as defined in Fig. 2. The contribution of the emissions due to live- eastern) and (d) domain D (southwestern), as defined in Fig. 2. Note
stock in the CADASTRE-CIT monthly budgets is also given. Units that the scale is different between (a, b) and (c, d). Units are kilotons
are kilotons of NH3 per month (kt NH3 month−1 ). The monthly re- of NH3 per day (kt NH3 d−1 ). The contribution of the emissions due
gional coverage of the IASI super-observations is given in percent- to livestock in the CADASTRE-CIT daily variability is also given.
age (in grey). The daily regional coverage of the IASI super-observations is given
in percentage (in grey).
and dynamics at the time of application and after application, maxima could be explained by the random selection of fertil-
on the other hand, are realistically produced. Hence, the NH3 ization days in CADASTRE-CIT. Over the last 15 d in March
volatilization is continuous over several days after spreading, 2011 and over the first 15 d in April 2011, the maxima of
introducing additional smoothing. emissions estimated by NH3 SAT and CADASTRE-CIT are
The CADASTRE-CIT inventory presents a high day-to- more correlated (e.g., from 7 to 11 April in CADASTRE-
day variability from March to May 2011 (Fig. 6a) with sev- CIT versus from 9 to 11 March in NH3 SAT). Finally,
eral strong maxima of emissions – characteristic of emis- CADASTRE-CIT still shows high emissions in the last 15 d
sions due to fertilizer application and a significant effect of April and in May 2011, particularly related to the use of
of the varying meteorological conditions. Day-to-day vari- fertilizer over corn. Despite a good coverage with IASI ob-
ability is also large for NH3 SAT. However, NH3 SAT and servations, no specific high emissions are derived from IASI
CADASTRE-CIT maxima are not very well correlated. Over for the same periods.
the first 15 d in March 2011, the high emissions occurring Over the northwestern part of France, the CADASTRE-
from 9 to 16 March in CADASTRE-CIT are not reproduced CIT inventory is in agreement with TNO-GEN, with a slight
by the NH3 SAT inventory, potentially because of a lack of maximum in April (Fig. 5b). The NH3 SAT inventory shows
IASI coverage for this period (only about 40 % of the do- a maximum in March, related to the high emissions seen dur-
main – Fig. 6a). NH3 SAT shows an emission maximum 1 ing the first week of March 2011 (Fig. 6b). However, the
week earlier from 1 to 7 March. This time gap in emission monthly differences are much smaller than for the north-
https://doi.org/10.5194/acp-20-13481-2020 Atmos. Chem. Phys., 20, 13481–13495, 202013492 A. Fortems-Cheiney et al.: Spatiotemporal representation of ammonia emissions in France
eastern part of France. Also for this domain, the day-to-day air quality. However, time series delivered by CADASTRE-
variabilities provided by CADASTRE-CIT and NH3 SAT are CIT and NH3 SAT are uncorrelated for all regions considered.
mostly uncorrelated: a strong sharp maximum of emissions This result can be partly explained by the lack of data in
during the first week of March 2011 is seen in NH3 SAT – IASI NH3 column observations under partially cloudy con-
but not reproduced in CADASTRE-CIT (Fig. 6b). The high- ditions, and by the fact that available information on agricul-
est daily emissions in CADASTRE-CIT occur during the two tural practices is resolved at a 2-week scale.
last weeks of April 2011 and are not reproduced by NH3 SAT. Yet, current results of our study have important implica-
Over the southeastern and southwestern parts of France, tions for air quality modeling over Europe. The important
month-to-month variations and emission amounts are much changes in the spatial distribution of NH3 emissions as a
smaller than for the two previous domains (Figs. 5c, 6c function of soil properties are of general concern not only
and 5d, 6d, respectively). In the southeastern part of France, for France, but for all of Europe. Soils are alkaline or neu-
NH3 SAT emissions are slightly larger than TNO-GEN and tral (pH > 6) not only over northeastern France, but also over
CADASTRE-CIT at the beginning of the period (Febru- large parts of Italy, eastern Spain or eastern Germany (Reuter
ary and March, Fig. 5c). The fertilization contribution to et al., 2008). Over these regions, our study suggests poten-
CADASTRE-CIT emissions decreases slightly at the end of tially larger NH3 emissions than with a constant emission
the period. In the southwestern part of France, NH3 SAT and factor treatment, with impacts on fine-particle formation.
TNO-GEN are very similar (Fig. 5d), and CADASTRE-CIT These features should be included in “operational” emission
is slightly larger at the end of spring. This increase is mainly inventories used for air quality modeling.
related to fertilization emissions, the livestock contribution Thus, as a general conclusion, use of observational con-
being stable. Again, daily time series between both NH3 SAT strained or process-oriented emission inventories is clearly
and CADASTRE-CIT inventories are uncorrelated (Fig. 6c of added value for estimating better monthly averages over
and d). French areas with intensive mineral fertilizer use, but capac-
ity for delivering day-to-day variations is not yet proven. This
warrants further studies, including both those that refine hy-
4 Conclusions potheses on days chosen by farmers for fertilizer spread out
as a function of meteorological conditions and those that ac-
In this study, we performed an inter-comparison of two al- quire and use continuous surface NH3 measurements for val-
ternative inventories with the TNO-GEN reference inventory idating satellite- or process-derived NH3 emission variabil-
that quantify the French NH3 emissions during spring 2011. ity.
One of the main conclusions of this study is that over re-
gions with large mineral fertilizer use, like over the north-
eastern part of France, induced NH3 emissions are probably Code and data availability. The CHIMERE code is available here:
considerably underestimated by the TNO-GEN reference in- https://www.lmd.polytechnique.fr/chimere/ (CHIMERE, 2020).
ventory, as both the NH3 SAT (constrained by IASI obser- The IASI ANNI-NH3-v2.2R data are freely available through the
vations) and CADASTRE-CIT (process level oriented) show AERIS database: https://iasi.aeris-data.fr/nh3/ (AERIS, 2018).
much larger values. For instance, over northeastern France,
NH3 SAT and CADASTRE-CIT show, respectively, a factor
Author contributions. All authors have contributed to writing the
1.4 and 2.8 larger spring 2011 emissions than TNO-GEN.
paper (main authors: AFC, GD, SG and MB). AFC has performed
Over the whole of France, NH3 emissions are still more than
the mass-balance approach to deduce NH3 emissions from NH3 to-
50 % larger in CADASTRE-CIT than in TNO-GEN. Aver- tal columns observed by the IASI satellite instrument. KD, JMG
age French NH3 SAT emissions are about 10 % larger than and SG have performed the bottom-up approach providing the
TNO-GEN ones. Over the southern part of France, with more CADASTRE_NH3 inventory for organic and mineral fertilization
diverse agriculture as compared to the crop-intensive one practices. FC has compiled this CADASTRE_NH3 inventory with
in northeastern France, differences between the inventories livestock emissions from the CITEPA. LC, PFC, MVD and CC are
are on the whole lower, and signs between CADASTRE- the principal investigators of the IASI NH3 product. All authors dis-
CIT/TNO-GEN and NH3 SAT/TNO-GEN corrections are of- cussed the results and contributed to the final paper.
ten opposite for different regions.
Month-to-month variations are again much more pro-
nounced over northeastern France and show a maximum Competing interests. The authors declare that they have no conflict
in March for both CADASTRE-CIT and NH3 SAT. Day-to- of interest.
day variations are large in CADASTRE-CIT and NH3 SAT,
roughly a factor of 5 between minimal and maximal val-
Acknowledgements. We acknowledge the TNO team for providing
ues. This shows the interest in evaluating NH3 emissions
NH3 emissions. Lieven Clarisse and Martin Van Damme are re-
at a daily scale because this input is required for chemistry
search associate and postdoctoral researcher, respectively, with the
transport modeling of particulate matter formation and thus
Atmos. Chem. Phys., 20, 13481–13495, 2020 https://doi.org/10.5194/acp-20-13481-2020A. Fortems-Cheiney et al.: Spatiotemporal representation of ammonia emissions in France 13493
Belgian F.R.S-FNRS. The authors are indebted to all those who pro- Bauer, S. E., Tsigaridis, K., and Miller, R.: Significant atmospher-
vided input data for the CADASTRE_NH3 2010–2011 crop year: icaerosol pollution caused by world food cultivation, Geophys.
the Service de la Statistique et de la Prospective (SSP), Department Res. Lett., 43, 5394–5400, 2016.
of Statistics and Forecasting of the French Ministry of Agricul- Boersma, K. F., Jacob, D. J., Bucsela, E. J., Perring, A.
ture, for the French cultural practices survey, supported by a public E., Dirksen, R., van der A, R. J., Yantosca, R. M., Park,
grant overseen by the French National Research Agency (ANR) as R. J., Wenig, M. O., and Bertram, T. H.: Validation of
part of the “Investissements d’avenir” program (reference: ANR- OMI tropospheric NO2 observations during INTEX-B and
10-EQPX-17 – Centre d’Accès Sécurisé aux Données – CASD); application to constrain NOx emissions over the eastern
Météo-France for the data on weather conditions; the Agence de United States and Mexico, Atmos. Environ., 42, 4480–4497,
Service et de Paiement (ASP) and the Observatoire du Développe- https://doi.org/10.1016/j.atmosenv.2008.02.004, 2008.
ment Rural (ODR) service unit for data on the Land Parcel Iden- CHIMERE: CHIMERE code, available at: https://www.lmd.
tification System (LPIS) for France. The authors are also grateful polytechnique.fr/chimere/, last access: April 2020.
to Maharavo Marie Julie Ramanantenasoa for her technical assis- Clarisse, L., Clerbaux, C., Dentener, F., Hurtmans,D., and Coheur,
tance, funded by the Cadastre_NH3 project under agreement num- P.: Global ammonia distribution derived from infrared satellite
ber ADEME 1081C0031. IASI is a joint mission of EUMETSAT observations, Nat. Geosci., 2, 479–483, 2009.
and the Centre National d’Etudes Spatiales (CNES, France). The Clarisse, L., Shephard, M., Dentener, F., Hurtmans, D., Cady-
authors acknowledge the AERIS data infrastructure for providing Pereira, K., Karagulian, F., Van Damme, M., Clerbaux, C., and
access to the IASI data in this study. This research has been sup- Coheur, P.-F.: Satellite monitoring of ammonia: A case study
ported by the Belgian State Federal Office for Scientific, Technical of the San Joaquin Valley, J. Geophys. Res., 115, D13302,
and Cultural Affairs (Prodex arrangement IASI.FLOW). This work https://doi.org/10.1029/2009JD013291, 2010.
was granted access to the HPC resources of TGCC under the allo- Clerbaux, C., Boynard, A., Clarisse, L., George, M., Hadji-Lazaro,
cation A0070107232 made by GENCI. J., Herbin, H., Hurtmans, D., Pommier, M., Razavi, A., Turquety,
S., Wespes, C., and Coheur, P.-F.: Monitoring of atmospheric
composition using the thermal infrared IASI/MetOp sounder, At-
Financial support. For this study, Audrey Fortems-Cheiney and mos. Chem. Phys., 9, 6041–6054, https://doi.org/10.5194/acp-9-
Karine Dufossé were funded by the Amp’Air and the PolQA Prime- 6041-2009, 2009.
qual projects, respectively, under agreement numbers ADEME Dammers, E., Shephard, M. W., Palm, M., Cady-Pereira, K., Capps,
1660C0013 and 1662C0023. S., Lutsch, E., Strong, K., Hannigan, J. W., Ortega, I., Toon, G.
C., Stremme, W., Grutter, M., Jones, N., Smale, D., Siemons,
J., Hrpcek, K., Tremblay, D., Schaap, M., Notholt, J., and Eris-
Review statement. This paper was edited by Drew Gentner and re- man, J. W.: Validation of the CrIS fast physical NH3 retrieval
viewed by three anonymous referees. with ground-based FTIR, Atmos. Meas. Tech., 10, 2645–2667,
https://doi.org/10.5194/amt-10-2645-2017, 2017.
Dammers, E., McLinden, C. A., Griffin, D., Shephard, M. W., Van
Der Graaf, S., Lutsch, E., Schaap, M., Gainairu-Matz, Y., Fi-
oletov, V., Van Damme, M., Whitburn, S., Clarisse, L., Cady-
References Pereira, K., Clerbaux, C., Coheur, P. F., and Erisman, J. W.: NH3
emissions from large point sources derived from CrIS and IASI
Adams, C., McLinden, C. A., Shephard, M. W., Dickson, N., satellite observations, Atmos. Chem. Phys., 19, 12261–12293,
Dammers, E., Chen, J., Makar, P., Cady-Pereira, K. E., Tam, https://doi.org/10.5194/acp-19-12261-2019, 2019.
N., Kharol, S. K., Lamsal, L. N., and Krotkov, N. A.: Satellite- Ebel, A., Friedrich, R., and Rodhe, H. (Eds.): Tropospheric Mod-
derived emissions of carbon monoxide, ammonia, and ni- elling and Emission Estimation. Transport and Chemical Trans-
trogen dioxide from the 2016 Horse River wildfire in the formation of Pollutants in the Troposphere, chap. GENEMIS:
Fort McMurray area, Atmos. Chem. Phys., 19, 2577–2599, Assessment, Improvement, and Temporal and Spatial Disaggre-
https://doi.org/10.5194/acp-19-2577-2019, 2019. gation of European Emission Data, Springer, Berlin, Germany,
AERIS: IASI ANNI-NH3-v2.2R data, available through the AERIS 1997.
database: https://iasi.aeris-data.fr/nh3/, last access: September EEA European Environment Agency: Effects of air pollution on
2018. European ecosystems – Past and future exposure of European
AGRESTE: Pratiques culturales 2006, in: “Agreste Les Dossiers”, freshwater and terrestrial habitats to acidifying and eutrophying
no 8 July 2010, Ministère de l’alimentation, de l’agriculture et de air pollutants, Technical Report, available at: https://www.eea.
la pêche, pp. 86, 2010. europa.eu/publications/effects-of-air-pollution-on (last access:
AGRESTE: Enquête Pratiques culturales 2011, in: Agreste Les September 2020), 2014.
Dossiers, no 21 July 2014, Ministère de l’alimentation, de EMEP European Monitoring and Evaluation Program/EEA Eu-
l’agriculture et de la pêche, pp. 70, 2014. ropean Environment Agency: Air pollutant emission inventory
Azouz, N., Drouet, J.-L., Beekmann, M., Siour, G., Kruit, R. guidebook Uncertainties, 2016.
W., and Cellier, P.: Comparison of spatial patterns of am- Erisman, J. W. and Schaap, M.: The need for am-
monia concentration and dry deposition flux between a re- monia abatement with respect to secondary PM re-
gional Eulerian chemistry-transport model and a local Gaus- ductions in Europe, Environ. Pollut., 129, 159–163,
sian plume model, Air Qual. Atmos. Hlth., 12, 719–729 https://doi.org/10.1016/j.envpol.2003.08.042, 2004.
https://doi.org/10.1007/s11869-019-00691-y, 2019.
https://doi.org/10.5194/acp-20-13481-2020 Atmos. Chem. Phys., 20, 13481–13495, 2020You can also read