Long-term water stress and drought assessment of Mediterranean oak savanna vegetation using thermal remote sensing - HESS
←
→
Page content transcription
If your browser does not render page correctly, please read the page content below
Hydrol. Earth Syst. Sci., 25, 755–768, 2021
https://doi.org/10.5194/hess-25-755-2021
© Author(s) 2021. This work is distributed under
the Creative Commons Attribution 4.0 License.

Long-term water stress and drought assessment of Mediterranean
oak savanna vegetation using thermal remote sensing
María P. González-Dugo1 , Xuelong Chen2,3 , Ana Andreu1 , Elisabet Carpintero1 , Pedro J. Gómez-Giraldez1 ,
Arnaud Carrara4 , and Zhongbo Su5
1 IFAPA,  Consejería de Agricultura, Ganadería, Pesca y Desarrollo Sostenible, Apdo. 3048, 14071, Córdoba, Spain
2 Key Laboratory of Tibetan Environment Changes and Land Surface Processes, Institute of Tibetan Plateau Research,
Chinese Academy of Sciences, Beijing, China
3 CAS Center for Excellence in Tibetan Plateau Earth Sciences, Chinese Academy of Sciences, Beijing, China
4 Fundación CEAM. Parque Tecnológico, Calle Charles Darwin 14, 46980 Paterna, Valencia, Spain
5 Faculty of Geo-Information Science and Earth Observation, University of Twente, Enschede, the Netherlands

Correspondence: María P. González-Dugo (mariap.gonzalez.d@juntadeandalucia.es)

Received: 24 April 2020 – Discussion started: 26 May 2020
Revised: 21 December 2020 – Accepted: 23 December 2020 – Published: 18 February 2021

Abstract. Drought is a devastating natural hazard that is dif-    the longest and most intense, with peak negative values in
ficult to define, detect and quantify. The increased availabil-   January–February and April–May 2005, explaining its great
ity of both meteorological and remotely sensed data provides      impact on cereal production (up to 45 % reduction). During
an opportunity to develop new methods to identify drought         the drier events, the changes in the grasslands’ and oak trees’
conditions and characterize how drought changes over space        ground cover allowed for a separate analysis of the strategies
and time. In this paper, we applied the surface energy bal-       adopted by the two strata to cope with water stress. These
ance model, SEBS (Surface Energy Balance System), for the         results indicate that the drought events characterized for the
period 2001–2018, to estimate evapotranspiration and other        period did not cause any permanent damage to the vegetation
energy fluxes over the dehesa area of the Iberian Peninsula,      of dehesa systems. The approach tested has proven useful for
with a monthly temporal resolution and 0.05◦ pixel size. A        providing insight into the characteristics of drought events
satisfactory agreement was found between the fluxes mod-          over this ecosystem and will be helpful to identify areas of
eled and the measurements obtained for 3 years by two flux        interest for future studies at finer resolutions.
towers located over representative sites (RMSD = 21 W m−2
and R 2 = 0.76, on average, for all energy fluxes and both
sites). The estimations of the convective fluxes (LE and H )
showed higher deviations, with RMSD = 26 W m−2 on aver-           1   Introduction
age, than Rn and G, with RMSD = 15 W m−2 . At both sites,
annual evapotranspiration (ET) was very close to total pre-       Drought, which is a devastating natural hazard and is globally
cipitation, with the exception of a few wet years in which        widespread, has complex consequences across spatiotempo-
intense precipitation events that produced high runoff were       ral scales and sectors. Unlike other disasters, it is still a chal-
observed. The analysis of the anomalies of the ratio of ET        lenge to define, detect and quantify droughts (Sheffield and
to reference ET (ETo ) was used as an indicator of agricul-       Wood, 2011), impeding most prevention and mitigation ac-
tural drought on monthly and annual scales. The hydrologi-        tions. When droughts affect savannas, the two canopies of
cal years 2004/2005 and 2011/2012 stood out for their neg-        this ecosystem, grasslands and trees/shrubs, suffer from dif-
ative values. The first one was the most severe of the series,    ferent stresses: (i) the pasture production is reduced or lost,
with the highest impact observed on vegetation coverage and       with a direct economic consequence resulting from the need
grain production. On a monthly scale, this event was also         to supplement animal feeding and, in more severe situa-
                                                                  tions, the death or premature sale of animals; (ii) the decline

Published by Copernicus Publications on behalf of the European Geosciences Union.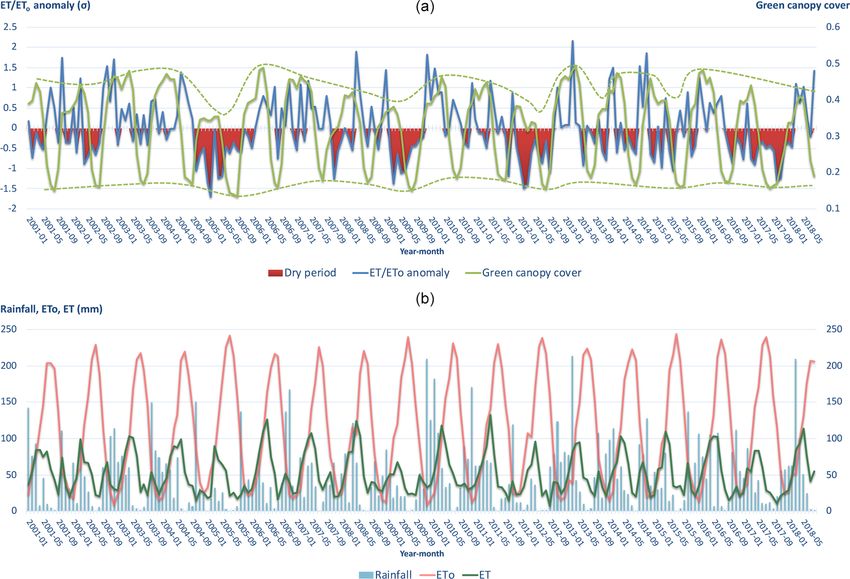
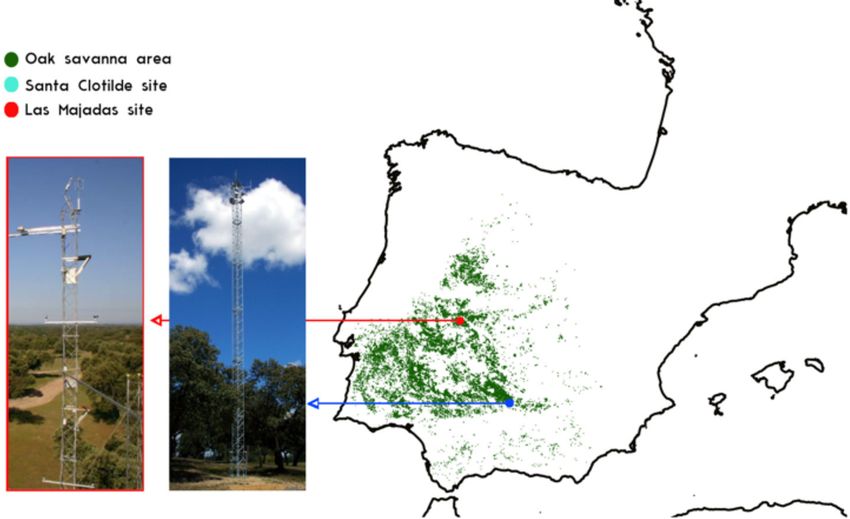
756                            M. P. González-Dugo et al.: Long-term drought assessment of Mediterranean oak savanna

and dieback of trees affect the ecosystem structure, jeopar-      balance between its multiple uses (livestock, cereal crops,
dizing the long-term conservation of the system (Fenshan          cork, hunting, etc.) and the conservation of its natural re-
and Holman, 1999). Traditional agropastoral systems in arid       sources. The dehesa’s diversity of habitats, giving refuge to
and semi-arid areas have developed strategies to cope with        a large number of species (Díaz et al., 1997), is especially
drought, such as diversifying crops and livestock, adding dif-    recognized, and it is listed as having community-wide inter-
ferent animal species and breeds or fluctuating herd sizes        est in the EU Habitats Directive (92/43/EEC). It is a water-
(Hazell et al., 2001). More recently, insurance services have     controlled system, with its productivity directly dependent
started to offer insurance for damage to pasture production       on water availability. Mediterranean oaks can minimize the
caused by water stress, providing farmers with a means to re-     effects of water scarcity through a combination of physiolog-
cover after a disaster. However, the slow onset of drought, the   ical mechanisms that occur over a range of timescales (Ram-
large extension of savanna areas and their complex canopy         bal, 1993). However, an additional problem to the recurrent
structure introduce additional difficulties to the challenge of   water scarcity is the identification of low soil water content
monitoring drought and assessing its adverse effects.             as an initiating factor involved in the severe oak decline af-
   The increasing availability of global meteorological data      fecting a large area of dehesa since the early 1980s (Sánchez
and new remote-sensing products, with advanced process-           et al., 2002). Drought events impede the growth of Quercus
ing services and free and open data, offers an opportunity        ilex seedlings and increase their susceptibility to Phytoph-
to characterize drought objectively and to extend its anal-       thora cinnamomi (Corcobado et al., 2014), the main biotic
ysis in space and time. Many indicators of drought us-            factor responsible for this decline (Sánchez et al., 2002).
ing remote-sensing inputs have been developed in the last            Similarly to other savanna ecosystems, the different com-
decades (Wardlow et al., 2012). Surface energy balance            ponents of dehesa structure (sparse tall vegetation, large ar-
models (SEBMs) provide a physically based rationale to            eas of grasses, shrubs and bare soil) contribute differently
combine the most often used remote-sensing retrievals for         to the turbulent exchange and radiative transfer, hindering
drought monitoring: vegetation indices (VIs) and land sur-        its modeling, especially when compared with more homoge-
face temperature (LST). The VIs provide information about         neous landscapes. In addition, these vegetation layers differ
the amount and condition of the vegetation (Jackson and           in phenology, physiology and function: while most trees are
Huete, 1991), while the LST describes the state of the surface    evergreen and have access to deep sources of water all year,
and the partitioning of the available energy into sensible heat   the herbaceous layer only taps water from the first centime-
(H ) and latent heat (LE) or evapotranspiration (ET) (Kustas      ters of soil and dries up during summer. The combination
and Norman, 1996). SEBMs have been used to provide ET             of the different functioning and characteristics of the system
estimations over agriculture (Anderson et al., 2015; Allen        components affects the exchange of sensible and latent heat
et al., 2011; Cammalleri et al., 2012; Andreu et al., 2015;       flux, resulting in a high spatial and temporal flux variability
Gonzalez-Dugo et al., 2009, 2012) and agroforestry systems        difficult to account for in model parametrization and algo-
(Andreu, 2018a, b; Guzinski et al., 2018; Carpintero et al.,      rithms. This structure appears to play an important role in
2016). In particular, the SEBS (Surface Energy Balance Sys-       savannas’ resilience, making the system an efficient convec-
tem) model (Su, 2002) presents a good compromise between          tor of sensible heat and keeping the canopy surface tempera-
the detailed parametrization of the turbulent heat fluxes for     ture inside the adequate range for survival (Baldocchi et al.,
different states of the land surface and the minimization of      2004).
the input requirements of the model without the need of lo-          In this work, a surface energy balance model, SEBS (Sur-
cal calibration. The evapotranspiration of a canopy is a suit-    face Energy Balance System; Chen et al., 2013; Su, 2002),
able indicator of its water status and a good measurement of      has been applied to estimate evapotranspiration and other en-
the impact of water shortage on vegetation and the function-      ergy fluxes from 2001 to 2018 over the dehesa areas of Spain
ing of the ecosystem. Evapotranspiration and soil moisture        and Portugal. The first objective was to validate the energy
anomalies have been widely used for the spatially distributed     fluxes produced by this model over the dehesa landscape.
monitoring of agricultural drought (Anderson et al., 2016;        The second was to analyze the anomalies of the ratio of ET
Cammalleri el al., 2015; Sheffield et al., 2004). These anoma-    to reference ET as an indicator of agricultural drought in this
lies underline the abnormally dry conditions when compared        environment at monthly and annual scale and use it to char-
to the usual state of an ecosystem, derived from historical       acterize the main drought events occurring in this period in
data. Evapotranspiration anomalies were used here to assess       space and time.
drought and vegetation water stress in the holm oak savanna
area of the Iberian Peninsula over a period of 17 years.
   The Mediterranean oak savanna, called dehesa in Spain          2   Data and methodology
and montado in Portugal, is the most extensive and represen-
tative agroforestry system in Europe, with an area of more        The study was conducted over the oak savanna area of the
than 3 × 10⁶ ha in the Iberian Peninsula (Moreno and Pulido,      Iberian Peninsula (Fig. 1) using data from January 2001
2009). It is a man-made ecosystem that maintains a fragile        to August 2018. This ecosystem covered 3.12 × 10⁶ ha in

Hydrol. Earth Syst. Sci., 25, 755–768, 2021                                         https://doi.org/10.5194/hess-25-755-2021
M. P. González-Dugo et al.: Long-term drought assessment of Mediterranean oak savanna                                                757

Figure 1. Distribution of oak savanna area in the Iberian Peninsula. Location of Sta.Clo (Santa Clotilde) and ES-LMa (Las Majadas) valida-
tion sites and pictures of both eddy covariance flux towers.

2006 according to the European CORINE Land Cover in-                   This ratio is assumed to be equal to 0.05 (Monteith, 1973)
ventory (CLC2006 100 m – version 12/2009; https://www.                 for surfaces with fully covered vegetation (0c ) and 0.315
eea.europa.eu/data-and-maps/data/ (last access: 5 Febru-               for bare soils (0s ) (Kustas and Daughtry, 1990). The green
ary 2021) clc-2006-raster-4). The area has remained fairly             canopy cover, fc , is determined using the normalized differ-
stable during the study period, with changes of less than              ence vegetation index (NDVI) in Eq. (7).
1.5 % between CLC2006 and the previous and posterior in-                  Using Eqs. (1) to (3) and energy balance considerations
ventories, in 2000 and 2012.                                           for limiting cases, the following reductions can be applied:
                                                                       (i) under the dry limit (Eq. 4), the evapotranspiration, λEdry ,
2.1   SEBS model description                                           is assumed to become zero due to the limitation of soil mois-
                                                                       ture and the sensible heat flux, Hdry , is at its maximum,
A revised version of the surface energy balance system
model known as SEBS (Su, 2002) was used to estimate land               λEdry = Rn − G − Hdry ≡ 0.                                     (4)
heat fluxes, integrating remote-sensing and meteorological
forcing data. A brief description of the model is presented            (ii) Under the wet limit (Eqs. 5 and 6), the evaporation takes
below (for further discussion, see Su, 2002, and Chen et al.,          place at a potential rate, λEwet , only limited by the available
2013). The latent heat flux (LE) was computed as a residual            energy at the given surface and atmospheric conditions. The
of the surface energy balance equation:                                sensible heat takes its minimum value, Hwet , with the internal
                                                                       resistance of the Penman–Monteith combination equation in
LE = Rn − G − H,                                               (1)     the form written by Menenti (1984), ri ≡ 0, by definition.
where Rn is the net radiation, G is the soil heat flux and H           λEwet = Rn − G − Hwet                                          (5)
is the turbulent sensible heat flux. The net radiation is calcu-
lated using the following equation:                                                      ρCp es − e        1
                                                                       Hwet = (Rn − G) −      ×         1+     ,                      (6)
                                                                                          rew   γ          γ
Rn = (1 − α) SWd + εLWd − εσ LST4 ,                            (2)
                                                                       where ρ is the density of air, Cp the specific heat at con-
where α is broadband albedo, SWd the downward short-                   stant pressure, e and es the actual and saturation vapor pres-
wave radiation, LWd the downward longwave radiation, ε                 sure respectively, γ the psychrometric constant, 1 the rate of
the land surface emissivity, σ the Stefan–Boltzmann constant           change of saturation vapor pressure with temperature and rew
and LST the land surface temperature.                                  the external or aerodynamic resistance. The sensible heat is
   The soil heat flux is derived from its ratio to the net radia-      computed according to the Monin–Obukhov similarity the-
tion (0) using Eq. (3):                                                ory and limited by the dry and wet conditions. A complete
                                                                     description of the model and the use of the dry and wet lim-
G = Rn 0c + (1 − fc ) (0S − 0c ) .                            (3)      its can be found in Su (2002).

https://doi.org/10.5194/hess-25-755-2021                                                Hydrol. Earth Syst. Sci., 25, 755–768, 2021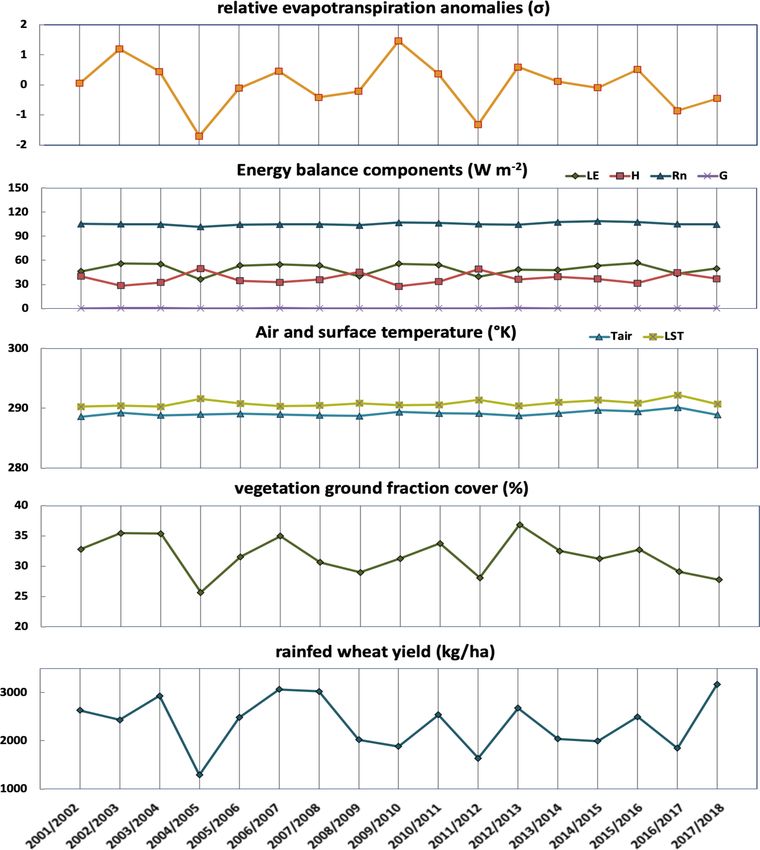
758                            M. P. González-Dugo et al.: Long-term drought assessment of Mediterranean oak savanna

2.2   Model parametrization and dataset preparation               a monthly input dataset. Satellite and meteorological input
                                                                  datasets are described in Table 1. All datasets were spatially
For the application of SEBS over the dehesa area, two sur-        averaged or subdivided to a common resolution of 0.05◦ .
face variables, fc and the height of the canopy (hc ), have          The land surface temperature (LST) was provided by the
been adapted to the specific characteristics of this ecosys-      MODIS instrument, using the monthly mean of the day and
tem. The green canopy cover (fc ) and leaf area index (L)         night LST product, which provides the most complete cover-
were calculated using the following equations (adapted from       age. The accuracy of this product, a key variable in SEBMs,
Choudhury et al., 1994):                                          was evaluated by Chen et al. (2017), supporting its applica-
                                                                  bility for climate studies and numerical model evaluation.
                                  1
                NDVImax − NDVI      ξ                                Meteorological data were provided by the ERA-Interim,
fc = 1 −                                                   (7)    a global atmospheric reanalysis dataset from the European
               NDVImax − NDVImin
     1                                                            Centre for Medium-Range Weather Forecasts (ECMWF).
L = − ln (1 − fc ) ,                                       (8)    Monthly means of daily means were produced by ECMWF
     k
                                                                  as the average of the four main synoptic monthly means at
where NDVImax and NDVImin represent a surface fully cov-          00:00, 06:00, 12:00 and 18:00 UTC. The forecast model, data
ered by vegetation (∼ 0.94) and completely bare (∼ 0.15), re-     assimilation method and input datasets used to produce ERA-
spectively. The parameter ξ represents the ratio of the canopy    Interim can be found in Dee et al. (2011) and a description
extinction coefficient (K 0 ) to a leaf angle distribution term   of the product archive in Berrisford et al. (2011).
(k). k was assumed to be equal to 0.5 for a random dis-              To analyze model results, the monthly rainfall gridded data
tribution of leaves, as the ecosystem contains erectophile        of the Climatic Research Unit (CRU) Time-Series (TS) Ver-
grasses and planophile oak tree leaves (Andreu et al., 2019).     sion 3.21 (Harris et al., 2014), provided by the Global Cli-
K 0 adopted a value of 0.8 obtained from experimental data        mate Monitor System (Camarillo-Naranjo et al., 2019), have
and within the range proposed for NDVI by Baret and Guyot         been averaged over the dehesa area of the Iberian Peninsula.
(1991). NDVI data were provided by the MODIS instrument,
averaging the 16 d original product to a monthly scale.           2.3   Validation sites and model evaluation
   The height of the canopy was computed to account for
variations in the tree component. This variable is needed for     Two experimental sites (Fig. 1) with similar flux measure-
calculating the momentum roughness length and, thus, im-          ment instrumentation have been used to validate the evap-
portant for the sensible heat calculation. The tree stratum of    otranspiration and other energy fluxes estimated using the
the dehesa is quite homogeneous in composition, dominated         SEBS model. Both eddy covariance towers, named Sta.Clo
by mature Quercus ilex sp., and the grassland canopy has a        (Santa Clotilde, Andalusia; 38◦ 120 N, 4◦ 170 W; 736 m a.s.l.)
very high variability of low-height herbaceous species. Con-      and ES-LMa (Boyal de Majadas del Tiétar, Extremadura;
sidering these reasons, the ecosystem structure has been sim-     39◦ 560 N, 5◦ 460 W; 260 m a.s.l.) are located over dehesa-type
plified to compute hc in the following way: a constant height     ecosystems under similar management and a landscape of
of 8 m has been assigned to oak trees, which is multiplied        scattered oak trees with a fractional cover of around 20 %,
by its ground coverage in each pixel. Oak fc is computed          in southern and southwestern Spain, respectively. The con-
annually using summer NDVI in Eq. (7). During the sum-            vective fluxes of the systems are measured above the tree
mer, the grasslands are dry, and the only photosynthetically      height (at 17 m in Sta.Clo and 15 m in ES-LMa), with closure
active vegetation contributing to the NDVI signal is the oak      balance errors of 20 % and 14 %, both values being within
trees. The grassland height is low (< 1 m), affecting the ef-     the range found by other authors (Foken, 2008; Franssen
fective canopy height of each pixel less than the trees, and it   et al., 2010). For ES_LMa the processing of the data cor-
is also difficult to compute based on monthly vegetation in-      responded to the procedure standardized by the FLUXNET
dices given the high species variability. For this reason, the    network (https://fluxnet.org/, last access: 5 February 2021).
grassland height has been discarded, and only the contribu-       For Sta.Clo, detailed information on the measurements and
tion of trees was considered to compute hc . Thus, a single hc    the processing of the data can be found in Andreu et
value was used for every month of a year. This simplification     al. (2018a, b). In this case, the comparison period was se-
of a complex system certainly may contribute to the error of      lected attending to the quality of the data, and some months
modeled fluxes. However, it was an operative solution con-        (3 of 36) were discarded due to missing information. Soil
sidering the scale of this study.                                 moisture, precipitation and other complementary measure-
   The SEBS model was originally designed for instanta-           ments of the vegetation (reflectance, L, green canopy cover)
neous applications. Monthly calculations using the same           were used to characterize the dynamics of the vegetation and
model were demonstrated by Chen et al. (2014). The struc-         the soil water status throughout the year.
ture of the model was not changed, and the implementation            The area contributing most to the fluxes measured was es-
differed in the input datasets. The model was applied over the    timated by using Schuepp et al. (1990) and varied between
entire Iberian Peninsula with a spatial resolution of 0.05◦ and   1 and 2 km. These footprints are lower than the pixel size

Hydrol. Earth Syst. Sci., 25, 755–768, 2021                                         https://doi.org/10.5194/hess-25-755-2021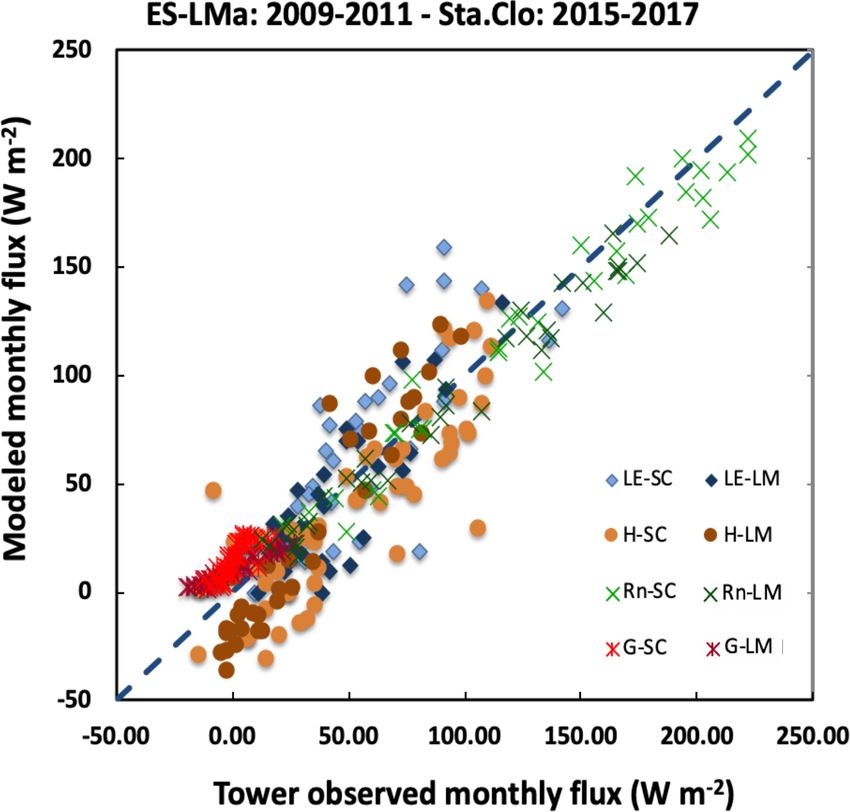
M. P. González-Dugo et al.: Long-term drought assessment of Mediterranean oak savanna                                                                                 759

Table 1. Input datasets used to calculate the surface energy fluxes over the Iberian Peninsula from 2000 to 2018.

  Variable       Full variable name                                     Data source                                              Spatial       Temporal         Method
                                                                                                                              resolution       resolution of
                                                                                                                                               input products
  SWd            downward surface shortwave radiation                   ERA Interim (ECMWF)a                                         0.7◦      1 month          Reanalysis
  LWd            downward surface longwave radiation                    ERA Interim (ECMWF)                                          0.7◦      1 month          Reanalysis
  Ta             air temperature                                        ERA Interim (ECMWF)                                          0.7◦      1 month          Reanalysis
  Q              specific humidity                                      ERA Interim (ECMWF)                                          0.7◦      1 month          Reanalysis
  u              wind speed                                             ERA Interim (ECMWF)                                          0.7◦      1 month          Reanalysis
  P              surface pressure                                       ERA Interim (ECMWF)                                          0.7◦      1 month          Reanalysis
  LST            land surface temperature                               MOD11C3 V5b                                                 0.05◦      1 month          Satellite
  α              albedo                                                 GlobAlbedoc /MODISb                                          0.1◦      1 month          Satellite
  NDVI           normalized difference vegetation index                 MOD13C1 V5/MYD13C1 V5b                                      0.01◦      16 d             Satellite
  fc             fractional canopy coverage                             Derived from NDVI using Eq. (7)                             0.01◦      16 d             Satellite
  L              leaf area index                                        Derived from fc using Eq. (8)                               0.01◦      16 d             Satellite
  hc             canopy height                                          Derived annually from summer NDVI                           0.01◦      16 d             Satellite
a http://apps.ecmwf.int/datasets/data/interim-land/type=fc/ (last access: 5 February 2021). b https://modis.gsfc.nasa.gov (last access: 5 February 2021).
c http://www.globalbedo.org/index.php (last access: 5 February 2021).

of 5 km used for the application of the SEBS model. How-                                      were anomalies in ET for most US climatic divisions, show-
ever, the homogeneity of the system, with similar tree ground                                 ing strong agreements in the southwest of the country, with
cover fraction and pasture management at several kilometers                                   a similar climate to the study area. The comparison of both
around the towers, supported the capacity of these sites to                                   variables anomalies has also been performed here.
serve as a reference for the validation of modeled fluxes.                                       Anomalous water stress conditions indicating drought
In both cases, the good correspondence between the model                                      were assessed here with the standardized values of relative
input meteorological data at the tower’s location and the                                     ET. FAO56 reference ET (Allen et al., 1998) was selected to
ground measurements was verified (data not shown).                                            estimate the atmospheric evaporative demand (AED), given
   Monthly rainfall data for the 17 years of the study were                                   the difficulties of reproducing the biological control of the
provided by the closest weather station to each site, lo-                                     transpiration, even at potential rates, of the different types of
cated 3 and 16 km from Sta.Clo and ES-LMa towers, respec-                                     vegetation conforming this ecosystem.
tively. Both of them are operated by the Spanish Meteorology                                     The vegetation water stress caused by the long dry sum-
Agency (AEMET).                                                                               mers of the Mediterranean climate can be considered to be
   Model performance was quantified via the root mean                                         the “normal” state of the system for several months of the
square difference (RMSD) and the coefficient of determina-                                    year. To identify unusually dry conditions indicating drought,
tion (R 2 ) between the modeled and observed fluxes. In ad-                                   standard (z) scores of this variable (ET / ETo ) for a given
dition, the mean bias error (MBE), computed by taking the                                     month/year have been computed. This standardization pro-
difference between predicted and observed fluxes, was used                                    cedure assumes that the data follow a normal distribution.
to assess model under- and overestimations.                                                   Some authors (Sheffield et al., 2004; Cammalleri et al., 2015)
                                                                                              have pointed out that soil moisture and the water deficit in-
2.4     Water stress calculations                                                             dex derived from it are generally characterized by a skewed
                                                                                              distribution and can be statistically better represented using
                                                                                              the beta distribution. In this case, the analysis of ET and rel-
The relative evapotranspiration is the ratio of actual to poten-
                                                                                              ative ET monthly histograms (shown in the Supplement) in-
tial or reference ET (ET / ETo ). It has been used as an indi-
                                                                                              dicated that most months presented an approximately sym-
cator of crop water stress (Anderson et al., 2015, 2016), of
                                                                                              metric distribution, with skewness between −0.5 and 0.5
drought (Anderson et al., 2011) and as a proxy for soil mois-
                                                                                              for both variables. Among the months studied, 3 months
ture (Su et al., 2003). The same approach is used worldwide
                                                                                              were moderately skewed, and only 1 month (for ET) and 2
in irrigation engineering to compute crop water requirements
                                                                                              months (for ET / ETo ) were slightly above 1, backing up the
following FAO (24 and 56) guidelines (Doorenbos and Pruitt,
                                                                                              use of z scores for the standardization of this variable. An-
1977; Allen et al., 1998). The reason for normalizing ET
                                                                                              nual drought analyses were performed by averaging monthly
by ETo is to separate the ET signal component responding
                                                                                              anomalies.
to soil moisture from variations due to the available energy.
                                                                                                 Drought intensity is defined here in terms of the maximum
Anderson et al. (2011) showed that anomalies in ET / ETo
                                                                                              negative anomaly of relative ET values reached during an
were more strongly correlated with other drought indices as

https://doi.org/10.5194/hess-25-755-2021                                                                            Hydrol. Earth Syst. Sci., 25, 755–768, 2021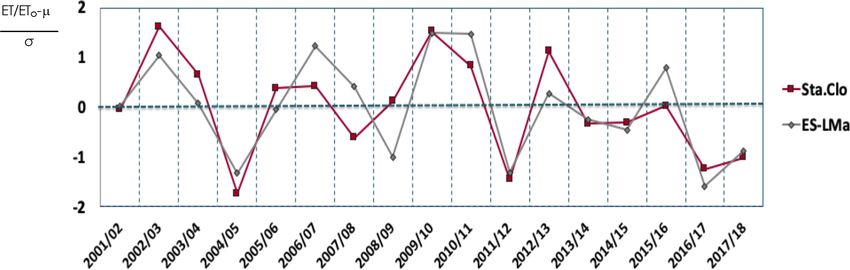
760                                M. P. González-Dugo et al.: Long-term drought assessment of Mediterranean oak savanna

                                                                           3     Results and discussion

                                                                           3.1    Model validation

                                                                           The comparison of SEBS model estimation of monthly en-
                                                                           ergy fluxes with measurements at the two eddy covariance
                                                                           (EC) towers during a total of 6 years, 2009 to 2011 for ES-
                                                                           LMa and 2015 to 2017 for Sta.Clo, displayed in Fig. 2,
                                                                           generally showed good agreement, with an average root
                                                                           mean square difference (RMSD) of 21 W m−2 and R 2 of
                                                                           0.76, for all energy fluxes and both sites. The estimations
                                                                           of the convective fluxes (LE and H ) show higher deviations,
                                                                           with RMSD = 26 W m−2 on average, than Rn and G, with
                                                                           RMSD = 15 W m−2 . Model performance at ES-LMa site
                                                                           was, in general, superior to that at Sta.Clo, with all the statis-
                                                                           tics metrics computed for the comparison (RMSD, MBE and
                                                                           R 2 ) presenting lesser dispersion and slightly lower errors.
                                                                           LE was slightly overestimated at both sites (MBE = 10.3 and
                                                                           2.8 W m−2 at Sta.Clo and ES-LMa, respectively), which is in
                                                                           agreement with previous applications of the model (Michel
Figure 2. Comparison of monthly energy fluxes of latent heat (LE),         et al., 2016). This overestimation was particularly significant
sensible heat (H ), net radiation (Rn ) and soil heat flux (G) estimated   for some springtime months at Sta.Clo, when the sensible
using the SEBS model at a monthly scale and observed fluxes at
                                                                           heat was underestimated by the SEBS model (Chen et al.,
each oak savanna site: ES-LMa (LA) for the years 2009–2011 and
                                                                           2019). It is worth noting than the model forces the closure
Sta.Clo (SC) for the years 2015–2017.
                                                                           of the energy balance, and the error in LE can be attributed
                                                                           to the propagation of errors in all the other balance compo-
                                                                           nents. However, LE estimations presented a similar or lower
event (thus using the standard deviation as a measure of its               RMSD than other applications of the SEBS model (Chen et
departure from the mean) and the drought event duration as                 al., 2014; Vinukollu et al., 2011). In particular, the work by
the successive number of months with negative anomalies.                   Chen et al. (2014) estimated energy fluxes over China at the
To classify the events occurred during the study period, the               same temporal scale and with similar input databases. The
following thresholds have been used: severe drought (anoma-                comparison with measurements at 11 Chinese flux towers
lies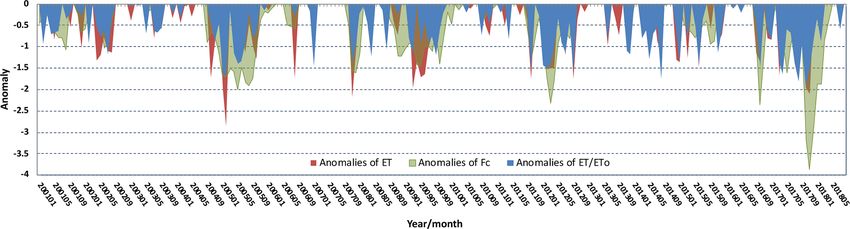
M. P. González-Dugo et al.: Long-term drought assessment of Mediterranean oak savanna                                               761

Figure 3. Evolution of annual rainfall, ET, ETo and ET / ETo at the ES-LMa site (a) and the Sta.Clo site (b) and annual runoff at Sta.Clo
watershed from the hydrological years 2001/2002 to 2017/2018.

Figure 4. Annual anomalies of relative evapotranspiration at ES-LMa and Sta.Clo experimental sites estimated using the SEBS model from
2001/2002 to 2017/2018.

tershed reservoir (Fig. 3a). The main land use of this small           firming the complementary hypothesis (Bouchet, 1963; Mor-
watershed (48.4 km2 ) is dehesa, but other uses can be found           ton, 1975; Brutsaert and Stricker, 1979).
as well, such as olive orchards and field crops.
   Annual runoff measurements followed a close relationship            3.2   Annual drought monitoring and impact assessment
(data shown in the Supplement, Fig. S2) with the annual
aridity index (Budyko, 1974) estimated at Sta.Clo following            Drought was characterized on an annual scale over the exper-
Arora (2002) as the ratio between potential evaporation and            imental sites and the whole area of the dehesa of the Iberian
annual precipitation. On average, we found aridity indices of          Peninsula using the relative evaporation anomalies. Figure 4
above 1 at both sites, indicating dry regions where the evap-          presents their evolution for the two sites throughout the study
orative demand cannot be met by precipitation. In this case,           period. A clear similarity can be observed in the main nega-
AED was computed using Penman–Monteith for comparison                  tive anomalies, which identify the most severe droughts dur-
purposes. Sta.Clo site is noticeably less arid than ES-LMa,            ing the years 2004/2005 and 2011/2012 at both sites, de-
with an aridity index equal to 2.9 and 3.75 on average for the         spite the differences in aridity and the distance (Fig. 1) be-
17 hydrological years at Sta.Clo and ES-LMa, respectively,             tween them, indicating the extended area and intensity of
with both of them falling under the category of a semi-arid            both events. Differences are more evident in the case of the
climate regime (Ponce et al., 2000). The two sites presented           mild droughts, occurring at both sites but with different in-
similar annual ETo values for the period (Fig. 3), but an-             tensities during two periods, 2007 to 2009 and 2016 to 2018.
nual precipitation was around 200 mm higher, on average, at               When the whole dehesa area is considered (Figs. 5 and 6),
Sta.Clo, with a higher and more variable ET / ETo through-             a more complete view of the general intensity, impact and
out the years. What can also be observed in Fig. 3 is the com-         spatial distribution of those dry periods can be obtained. Fig-
plementary relationship between actual and reference evap-             ure 5 aggregates, for the total dehesa area, the evolution of
otranspiration at this temporal scale, with the sum of annual          the relative ET anomalies, together with the exchanges of
ET and ETo approaching a constant value at both sites, con-            energy between the surface and the atmosphere, the green
                                                                       canopy cover and the production of rainfed wheat. The last

https://doi.org/10.5194/hess-25-755-2021                                               Hydrol. Earth Syst. Sci., 25, 755–768, 2021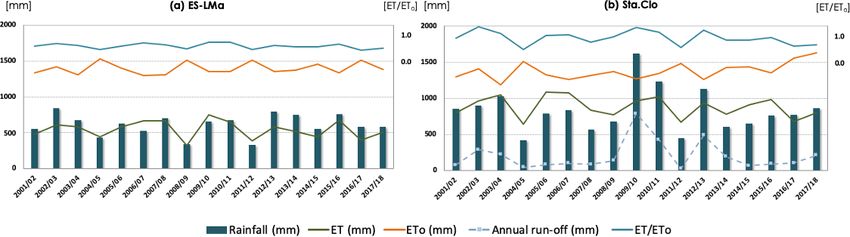
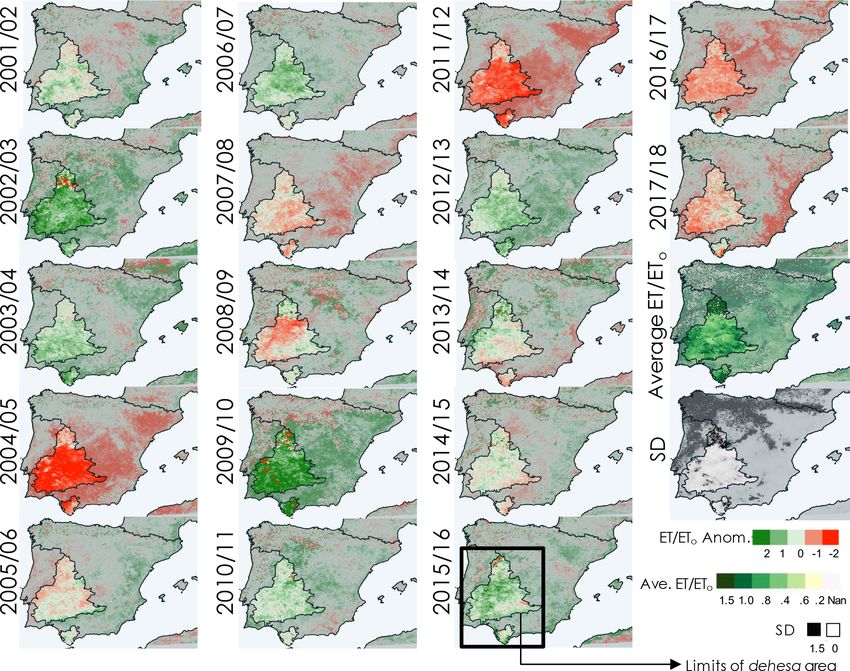
762                             M. P. González-Dugo et al.: Long-term drought assessment of Mediterranean oak savanna

Figure 5. Evolution from 2001/2002 to 2017/2018 of annual anomalies of relative evapotranspiration, energy balance components, air and
surface temperature, vegetation ground fraction cover and rainfed wheat yield, aggregated for the whole oak savanna area of the Iberian
Peninsula.

two variables were selected as indicators of the impact of wa-        by 20 % compared to the average of the same period. This
ter scarcity on the system.                                           severe drought affected the entire Iberian Peninsula, with
   The 2 severely dry years identified at the experimental            Spanish and Portuguese cereal and hydroelectricity produc-
sites were the driest ones for the entire dehesa area, with           tion decreasing by 40 % and 60 % with respect to the average
2004/2005 standing out as the most severe event of the time           (Garcia-Herrera et al., 2007) and a 10 % reduction in total EU
series. None of them lasted more than 1 year. For these 2 dry         cereal yields (UNEP, 2006). The event during 2011/2012 was
years, a reduction in the latent heat can be observed when            among the largest and most severe ones in Europe for the 18-
compared to the complete series, producing a swap with the            year simulation period analyzed by Cammalleri et al. (2015),
sensible heat in the second position in magnitude of the en-          contributing to a global decline in grain production.
ergy balance components. A rise in the surface temperature,              Figure 6 shows maps of ET / ETo anomalies in Iberia for
increasing the difference with the air temperature, is also ob-       the 17 years of the study, highlighting the dehesa area of in-
served for those dry years. The order of severity in dryness,         terest in this work. The spatial variability of these anomalies
established by the magnitude of negative values of ET / ETo           for most years is significant, although prevalently dry and
anomalies, is also observed in their impacts over the sys-            wet years can be distinguished. In 2004/2005 and 2011/2012,
tem (Fig. 6). In 2004/2005, the wheat production in the area          the drought was severe and affected most of the area of in-
was reduced by almost half of the average (45 %) for the pe-          terest, as the aggregated values of Fig. 5 also point out. In
riod analyzed, and the vegetation groundcover fraction fell           2008/2009, the water stress was milder in the western area,

Hydrol. Earth Syst. Sci., 25, 755–768, 2021                                              https://doi.org/10.5194/hess-25-755-2021
M. P. González-Dugo et al.: Long-term drought assessment of Mediterranean oak savanna                                              763

Figure 6. Spatial distribution of annual anomalies of relative evapotranspiration for the oak savanna area of the Iberian Peninsula from
2001/2002 to 2017/2018, the average ET / ETo for the period and its standard deviation (SD).

as can be observed in Fig. 6, than at the experimental site           ET although with different shape), and the minimum appears
of Sta.Clo (Fig. 4) located in this part of the region. The           during the dry summer, only endured by the oak trees. In
recovery of the vegetation water status, in most areas, was           some years, the growing season presents a bimodal shape,
achieved the year following dry ones.                                 with an initial peak produced by autumn pastures, which is
                                                                      also reflected in ET values. It can be observed mostly in wet
3.3   Monthly drought analysis                                        years (e.g., 2003, 2007, 2011), with the vegetation growth
                                                                      following a pattern that can be related to the soil water avail-
The monthly evolution of relative evapotranspiration anoma-           ability, represented here by the ET / ETo anomalies.
lies is displayed in Fig. 7a, with negative values indicating            The duration and intensity of each drought event help to
water stress conditions highlighted in red. Absolute ET and           explain the response of the vegetation during these periods.
ETo values, used to calculate these anomalies, are shown in           In this sense, the two main drought events identified on an
Fig. 7b together with monthly rainfall for the period. One can        annual scale (2004/2005 and 2011/2012) presented drier than
observe the alternation of complementary and parallel char-           normal conditions during the whole or most of the year. The
acteristics of ET and ETo throughout the year. The longest            first event was longer (16 months in the first case, prolong-
complementary period indicating water-limited ET condi-               ing the drought to the beginning of the following year) and
tions, starting in May for most of the years, is confirmed            with higher negative values than the second one, of an 11-
by the decreasing trend in rainfall starting in that month. At        month duration, explaining the greater impacts detected on
the end of the summer when the first rains arrive, the trend          the vegetation and cereal yield. Other dry periods, in 2009,
of ET and ETo changes, producing a secondary peak in ET,              2017 and 2018, presented consecutive negative anomalies for
much weaker than the one earlier in the year, that lasts un-          10 to 11 months, but, in some cases, the non-homogeneous
til the energy-limited parallel phase starts in November. Both        distribution of the drought, observed in Fig. 6, may have un-
variables follow a concurrent rise from January until the soil        dermined the impact analysis on this aggregated spatial scale.
water deficit limits ET again.                                        In terms of impact assessment, the time of the year with peak
    The annual fluctuations of the green canopy cover (thick          negative anomalies is important, with springtime events pro-
green line in Fig. 7a) followed the expected seasonality of           ducing greater impacts (e.g. in 2004/2005 the highest nega-
Mediterranean vegetation, corresponding to the dynamics of            tive values corresponded to January, February, April and May
ET and ETo changes. The maximum coverage (March and                   2005).
April) corresponds to the peak of grassland production (and

https://doi.org/10.5194/hess-25-755-2021                                               Hydrol. Earth Syst. Sci., 25, 755–768, 2021
764 M. P. González-Dugo et al.: Long-term drought assessment of Mediterranean oak savanna Figure 7. (a) Monthly evolution of evapotranspiration anomalies (blue line) of the oak savanna area of the Iberian Peninsula from January 2001 to August 2018, with negative values indicating drier than normal conditions (depicted in red) and green canopy cover (green line). The dashed green lines connect the annual maximum and minimum values of fc . (b) Monthly evolution of rainfall, ETo and ET in the same region and time interval. During the dry years, the annual vegetation growth pat- tions, such as annual rainfall (Poole and Milles, 1981). This tern varies with respect to the typical one, depending on is also supported by the variance observed in fc that can be the duration and severity of drought events. The dynamics explained by the anomalies of relative evapotranspiration of of the vegetation in this system allows for a separate anal- previous months. During the spring, the highest correlation ysis of the effect of water scarcity over trees and pastures. coefficients are obtained for the previous 2 or 3 months (e.g., The dashed green lines (Fig. 7a) show the changes in an- average fc for the peak month, April, is correlated with av- nual maximum and minimum values of fc , with the maxi- erage anomalies from February to April with an R 2 equal mum ones mostly expressing the impact on pasture, and the to 0.76 and with anomalies of the previous year with an changes in the minimum ones representing only the impact R 2 = 0.52). However, during the summer, the coverage of over the tree canopy. The decreases in pasture fc are more the vegetation can be better explained by what has happened pronounced than changes in oaks fc , as grasslands are more during the previous year (e.g., R 2 is equal to 0.39 for average abundant, and their roots are mostly located in the first cen- August fc and the anomalies of the two previous months and timeters of soil. On the contrary, the rooting system of the 0.64 for the anomalies of the year), suggesting that those val- oak tree is in fact adapted to the regular dry periods of the ues of fc might be linked to processes occurring at different Mediterranean climate, exploring a large volume of soil that timescales. can reach maximum values of around 5 m in depth and 30 m A more detailed analysis is required, but these results sup- in horizontal extension (Moreno et al., 2005). The small de- port the conclusion that the drought events characterized for creases, observed in oaks fc in Fig. 7a during dry years, this period did not cause any permanent damage to the vege- generally recovered within 1 or 2 years. This response of tation, considering both the grasslands and the oak trees. the tree leaf area is associated with low-frequency oscilla- Hydrol. Earth Syst. Sci., 25, 755–768, 2021 https://doi.org/10.5194/hess-25-755-2021
M. P. González-Dugo et al.: Long-term drought assessment of Mediterranean oak savanna                                             765

Figure 8. Comparison of monthly negative anomalies of ET, ET / ETo and fc for the entire oak savanna area of the Iberian Peninsula from
January 2001 to August 2018.

   Similar results can be derived from the analysis of ET                Drought has been characterized on an annual and monthly
anomalies. Figure 8 presents a comparison of monthly                  scale over the experimental sites and the whole area of
anomalies of ET, ET / ETo and fc . The anomalies of ET and            dehesa of the Iberian Peninsula using relative evaporation
ET / ETo showed a high similarity for the conditions of the           anomalies (ET / ETo ). At the annual scale, the negative
study, with correlations of R 2 = 0.76 at monthly scale and           anomalies of 2 years, 2004/2005 and 2011/2012, stood out
R 2 = 0.82 at seasonal scale (results presented in Figs. S3           during the study period at the experimental sites and the
and S4). It suggests that ET anomalies could be an option             entire dehesa area. However, a recovery of average values
to monitor drought in dehesa areas. Nevertheless, the com-            is observed in the years following the dry ones, indicating
putation of ETo does not require additional variables than            the absence of prolonged droughts for the period. Maps of
those already used by the energy balance models, with quite           ET / ETo anomalies showed that most of the dehesa area was
a straightforward computation. Once actual ET is estimated,           affected in those dry years. These maps complemented the
the computation of ET / ETo takes very little effort and adds         averaged data, providing spatial information about regional
some confidence to the focus on the soil moisture signal. Re-         impacts that could be useful for a more detailed analysis.
garding the evaluation of fc anomalies, it can be derived that           On the monthly scale, the drought event of 2004/05 is con-
the drought events identified using this variable would have          firmed as being the longest and the most intense event, with
been the same as using ET or ET / ETo but with different              16 consecutive months of negative anomalies (from Octo-
intensities and duration. The main differences can be found           ber 2004 to January 2006). Peak negative values in January–
during the cold winter months when the vegetation is largely          February and April–May 2005 explain the important impact
dormant. In these cases, the anomalies of fc , similar to the         on cereal production. The dynamics of the vegetation strata
performance of other indices based on vegetation, such as             on a monthly scale allows for a separate assessment of wa-
the Vegetation Condition Index (VCI; Heim, 2002) have a               ter stress impacts on oaks and pastures. The different be-
limited utility. The results are more comparable and could be         havior observed in vegetation ground cover during the drier
more useful during the growing season.                                events in months with a preponderant presence of grasslands,
                                                                      compared with months in which only oaks were active, is
                                                                      consistent with the different strategies adopted by the two
4   Conclusions                                                       strata to cope with water stress. In addition, the correlation of
                                                                      monthly vegetation fractional coverage with previous short
The SEBS model was used to estimate monthly energy fluxes             or medium-term anomalies (from 2 months to 1 year) sug-
over the dehesa area of the Iberian Peninsula from January            gest that those values might be linked to processes occurring
2001 to August 2018. There was a satisfactory agreement               on a different timescale, depending on whether the grassland
between modeled fluxes and measurements obtained for 3                or the tree is the predominant vegetation.
years over two sites that are representative of the ecosystem.           These results back up the conclusion that the drought
   At both sites annual ET was very close to total precipita-         events characterized for this period did not cause perma-
tion, with the exception of a few wet years and those in which        nent damage to the vegetation of dehesa systems, consid-
intense precipitation events producing a high runoff were ob-         ering both the grasslands and the oak trees. The approach
served. Average aridity indices for the 17 hydrological years         proved useful for providing insights into the characteristics
of 2.9 and 3.75 were computed at Sta.CLo and ES_LMa, re-              of drought events over this ecosystem and for defining and
spectively, indicating that their evaporative demand cannot           identifying areas of interest for future studies at finer resolu-
be met by annual precipitation of these sites.                        tions.

https://doi.org/10.5194/hess-25-755-2021                                              Hydrol. Earth Syst. Sci., 25, 755–768, 2021
766 M. P. González-Dugo et al.: Long-term drought assessment of Mediterranean oak savanna
Code and data availability. The SEBS code is available to down- References
load from the GitHub repository (https://github.com/TSEBS/
SEBS_Spain, last access: 5 February 2021; Chen, 2020). Val- Allen, R. G., Pereira, L. S., Raes, D., and Smith, M.: Crop evapo-
idation data of the ES-LMa site are available from the Eu- transpiration: Guidelines for computing crop requirements, Irri-
ropean Fluxes Database Cluster (http://www.europe-fluxdata.eu/ gation and Drainage Paper No. 56, 300 pp., FAO, Rome, Italy,
home/site-details?id=ES-LMa, last access: 5 February 2021; 1998.
Carrara, 2021), and data of the Sta.Clo site may be dis- Allen, R. G., Irmak, A., Trezza, R., Hendrickx, J. M. H., Basti-
tributed on request to the principal investigator of the Sta. aanssen, W., and Kjaersgaard, J.: Satellite-based ET estimation
Clotilde experimental site (María P. González-Dugo, IFAPA, in agriculture using SEBAL and METRIC, Hydrol. Proc., 25,
mariap.gonzalez.d@juntadeandalucia.es). 4011–4027, https://doi.org/10.1002/hyp.8408, 2011.
Anderson, M. C., Hain, C. R., Wardlow, B., Pimstein, A.,
Mecikalski, J. R., and Kustas, W. P.: Evaluation of Drought In-
Supplement. The supplement related to this article is available on- dices Based on Thermal Remote Sensing of Evapotranspiration
line at: https://doi.org/10.5194/hess-25-755-2021-supplement. over the Continental United States, J. Climate, 24, 2025–2044,
https://doi.org/10.1175/2010JCLI3812.1, 2011.
Anderson, M. C., Zolin, C. A., Hain, C. R., Semmens, K., Yilmaz,
M. T., and Gao, F.: Comparison of satellite-derived LAI and pre-
Author contributions. MPGD conceived the original idea, analyzed
cipitation anomalies over Brazil with a thermal infrared-based
the data and took the lead in writing the manuscript. XC and ZS de-
Evaporative Stress Index for 2003–2013, J. Hydrol., 526, 287–
signed the model and the computational framework and contributed
302, https://doi.org/10.1016/j.jhydrol.2015.01.005, 2015.
to the interpretation of the data. MPGD and XC collected the input
Anderson, M. C., Zolin, C. A., Sentelhas, P. C., Hain, C. R.,
data and performed the numerical calculations. AA, EC, PJGG and
Semmens, K., Tugrul Yilmaz, M., Gao, F., Otkin, J. A.,
AC collected and analyzed the validation data and reviewed the pa-
and Tetrault, R.: The Evaporative Stress Index as an indi-
per. All authors provided critical feedback and helped to shape the
cator of agricultural drought in Brazil: An assessment based
manuscript.
on crop yield impacts, Remote Sens. Environ., 174, 82–99,
https://doi.org/10.1016/j.rse.2015.11.034, 2016.
Andreu, A., Timmermans, W. J., Skokovic, D., and González-
Competing interests. The authors declare that they have no conflict Dugo, M. P.: Influence of component temperature derivation
of interest. from dual angle thermal infrared observations on TSEB flux esti-
mates over an irrigated vineyard, Acta Geophys., 63, 1540–1570,
https://doi.org/10.1515/acgeo-2015-0037, 2015.
Special issue statement. This article is part of the special issue Andreu, A., Kustas, W. P., Polo, M. J., Carrara, A., and González-
“Data acquisition and modelling of hydrological, hydrogeological Dugo, M. P.: Modeling Surface Energy Fluxes over a De-
and ecohydrological processes in arid and semi-arid regions”. It is hesa (Oak Savanna) Ecosystem Using a Thermal Based Two-
not associated with a conference. Source Energy Balance Model (TSEB) I., Remote Sens., 10, 567,
https://doi.org/10.3390/rs10040567, 2018a.
Andreu, A., Kustas, W. P., Polo, M. J., Carrara, A., and González-
Acknowledgements. We would like to thank the owners and work- Dugo, M. P.: Modeling Surface Energy Fluxes over a Dehesa
ers of the Santa Clotilde experimental site, as well as the group man- (Oak Savanna) Ecosystem Using a Thermal Based Two Source
aging the experimental site of Las Majadas for the eddy covariance Energy Balance Model (TSEB) II – Integration of Remote Sens-
measurements and the additional data. We also thank the anony- ing Medium and Low Spatial Resolution Satellite Images, Re-
mous reviewers, whose comments have improved the manuscript. mote Sens., 10, 558, https://doi.org/10.3390/rs10040558, 2018b.
Andreu, A., Dube, T., Nieto, H., Mudau, A. E., González-Dugo, M.
P., Guzinski, R., and Hülsmann, S.: Remote sensing of water use
Financial support. This research has been supported by the OECD and water stress in the African savanna ecosystem at local scale
Cooperative Research Programme: Biological Resource Manage- – Development and validation of a monitoring tool, Phys. Chem.
ment for Sustainable Agricultural Systems (grant no. JA00084693) Earth, 112, 154–164, https://doi.org/10.1016/j.pce.2019.02.004,
and the projects PP.PEI.IDF201601.16 and PP.PEI.IDF2019.004, 2019.
80 % cofunded by the European Regional Development Fund, AOP Arora, V. K.: The use of the aridity index to assess climate change
2014–2020. Additional support was provided by RTA2014-00063 effect on annual runoff, J. Hidrol., 265, 164–177, 2002.
C04-02 INIA-FEDER and PID2019-107693RR-C22 projects Baldocchi, D. D., Xu, L., and Kiang, N.: How plant functional-
(MCIU/AEI/FEDER, UE). XC was supported by the National Nat- type, weather, seasonal drought, and soil physical proper-
ural Science Foundation of China (41975009) and AA by EU Hori- ties alter water and energy fluxes of an oak-grass savanna
zon 2020 Marie Skłodowska-Curie Action grant agreement no. and an annual grassland, Agr. Forest Meteorol., 123, 13–39,
703978. https://doi.org/10.1016/j.agrformet.2003.11.006, 2004.
Baret, F. and Guyot, G.: Potentials and limits of vegetation in-
dices for LAI and APAR assessments, Remote Sens. Environ.,
Review statement. This paper was edited by Harrie-Jan Hendricks 35, 161–173, 1991.
Franssen and reviewed by three anonymous referees. Berrisford, P., Dee, D., Brugge, R., Fielding, K., Fuentes, M.,
Kallberg, P., Kobayashi, S., Uppala, S., and Simmons, S.:
Hydrol. Earth Syst. Sci., 25, 755–768, 2021 https://doi.org/10.5194/hess-25-755-2021M. P. González-Dugo et al.: Long-term drought assessment of Mediterranean oak savanna 767 The ERA-Interim Archive, ERA Report Series No. 1 Version and vegetation indices studied by model simulations, Remote 2.0, European Centre for Medium Range Weather Forecasts, Sens. Environ., 50, 1–17, 1994. Reading, U.K., availabe at: https://www.ecmwf.int/en/elibrary/ Corcobado, T., Cubera, E., Juárez, E., Moreno, G., and 8174-era-interim-archive-version-20 (last access: 10 Decem- Solla, A.: Drought events determine performance of Quer- ber 2019), 2011. cus ilex seedlings and increase their susceptibility to Phy- Bouchet, R. J.: Evapotranspiration reelle, evapotranspiration poten- tophthora cinnamomi, Agr. Forest Meteorol., 192, 1–8, tielle, et production agricole, Annales Agronomiques, 14, 743– https://doi.org/10.1016/j.agrformet.2014.02.007, 2014. 824, 1963. Dee, D. P., Uppala, S. M., Simmons, A. J., Berrisford, P., Poli, Brutsaert, W. and Stricker, H.: An advection-aridity approach to P., Kobayashi, S., Andrae, U., Balmaseda, M. A., Balsamo, G., estimate actual regional evapotranspiration, Water Resour. Res., Bauer, P., Bechtold, P., Beljaars, A. C. M., van de Berg, L., Bid- 15, 443–450, 1979. lot, J., Bormann, N., Delsol, C., Dragani, R., Fuentes, M., Geer, Budyko, M. I.: Climate and life, Academic Press, Orlando, FL, A. J., Haimberger, L., Healy, S. B., Hersbach, H., Hólm, E. V., 508 pp., 1974. Isaksen, L., Kållberg, P., Köhler, M., Matricardi, M., McNally, Camarillo-Naranjo, J. M., Álvarez-Francoso, J. I., Limones- A. P., Monge-Sanz, B. M., Morcrette, J.-J., Park, B.-K., Peubey, Rodríguez, N., Pita-López, M. F., and Aguilar-Alba, M.: The C., de Rosnay, P., Tavolato, C., Thépaut, J.-N., and Vitart, F.: The Global Climate Monitor System: From Climate Data-Handling ERA-Interim reanalysis: configuration and performance of the to Knowledge Dissemination, Int. J. Digital Earth, 12, 394–414, data assimilation system, Q. J. Roy. Meteor. Soc., 137, 553–597, https://doi.org/10.1080/17538947.2018.1429502, 2019. https://doi.org/10.1002/qj.828, 2011. Cammalleri, C., Anderson, M. C., Ciraolo, G., D’Urso, G., Kus- Díaz, M., Campos, P., and Pulido, F. J.: The Spanish dehesas: a di- tas, W. P., La Loggia, G., and Minacapilli, M.: Applications versity in land-use and wildlife, in: Farming and birds in Europe: of a remote sensing-based two-source energy balance algo- The Common Agricultural Policy and its implications for bird rithm for mapping surface fluxes without in situ air tem- conservation, edited by: Pain, D. and Pienkowski, M., Academic perature observations, Remote Sens. Environ., 124, 502–515, Press, London, 178–209, 1997. https://doi.org/10.1016/j.rse.2012.06.009, 2012. Doorenbos, J. and Pruitt, W. O.: Crop water requirement, FAO Irri- Cammalleri, C., Micale, F., and Vogt, J.: A novel soil gation and Drainage, Paper N. 24, FAO, Rome, 1977, Food and moisture-based drought severity index (DSI) combining water Agriculture Organization: Guidelines: Land evaluation for Rain- deficit magnitude and frequency, Hydrol. Proc., 30, 289–301, fed Agriculture, FAO Soils Bulletin 52, Rome, 156 pp., 1983. https://doi.org/10.1002/hyp.10578, 2015. Fenshan, R. J. and Holman, J. E.: Temporal and spatial patterns Carrara, A.: Las Majadas del Tietar flux data, European Fluxes in drought-related tree dieback in Australian savanna, J. Appl. Database Cluster, available at: http://www.europe-fluxdata.eu/ Ecol., 36, 1035–1050, 1999. home/site-details?id=ES-LMa, last access: 5 February 2021. Foken, T.: The energy balance closure problem: An overview, Ecol. Carpintero, E., Gonzalez-Dugo, M. P., Hain, H., Nieto, H., Gao, Appl., 18, 1351–1367, https://doi.org/10.1890/06-0922.1, 2008. F., Andreu, A., and Kustas, W. P.: Continuous evapotranspira- Franssen, H. J. H., Stöckli, R., Lehner, I., Rotenberg, tion monitoring and water stress at watershed scale in a Mediter- E., and Seneviratne, S. I.: Energy balance closure of ranean oak savanna, Proceeding SPIE 9998, Remote Sensing eddy-covariance data: A multisite analysis for European for Agriculture, Ecosystems, and Hydrology XVIII, 99980N, FLUXNET stations, Agr. Forest Meteorol., 150, 1553–1567, Edinburg, United Kingdom, https://doi.org/10.1117/12.2241521, https://doi.org/10.1016/j.agrformet.2010.08.005, 2010. 2016. García-Herrera, R., Paredes, D., Trigo, R. M., Franco-Trigo, I., Chen, X.: SEBS_Spain, available at: https://github.com/TSEBS/ Hernández, E., Barriopedro, D., and Mendes, M.: The out- SEBS_Spain, last access: 5 February 2021, 2020. standing 2004/05 drought in the Iberian Peninsula: associ- Chen, X., Su, Z., Ma, Y., Yang, K., Wen, J., and Zhang, ated atmospheric circulation, J. Hydrometeorol., 8, 483–498, Y.: An Improvement of Roughness Height Parameteriza- https://doi.org/10.1175/JHM578.1, 2007. tion of the Surface Energy Balance System (SEBS) over Gonzalez-Dugo, M. P., Neale, C. M. U., Mateos, L., Kustas, W. the Tibetan Plateau, J. Appl. Meteorol. Clim., 52, 607–622, P., Prueger, J. H., Anderson, M. C., and Li, F.: A compari- https://doi.org/10.1175/JAMC-D-12-056.1, 2013. son of operational remote sensing-based models for estimating Chen, X., Su, Z., Ma, Y., Liu, S., Yu, Q., and Xu, Z.: Development crop evapotranspiration, Agr. Forest Meteorol., 149, 1843–1853, of a 10-year (2001–2010) 0.1◦ data set of land-surface energy https://doi.org/10.1016/j.agrformet.2009.06.012, 2009. balance for mainland China, Atmos. Chem. Phys., 14, 13097– González-Dugo, M. P., González-Piqueras, J., Campos, I., Andreu, 13117, https://doi.org/10.5194/acp-14-13097-2014, 2014. A., Balbotin, C., and Calera, A.: Evapotranspiration monitoring Chen, X., Su, Z., Ma, Y., Cleverly, J., and Liddell, M.: An accu- in vineyard using satellite-based thermal remote sensing, in: Re- rate estimate of monthly mean land surface temperatures from mote Sensing for Agriculture, Ecosystems, and Hydrology XIV, MODIS clear-sky retrievals, J. Hydrometeorol., 18, 2827–2847, edited by: Neale, C. M. U. and Maltese, A., Proc. of SPIE., 8531, 2017. 85310N-85310N-8, https://doi.org/10.1117/12.974731, 2012. Chen, X., Su, Z., Ma, Y., and Middleton, E. M.: Optimization of Guzinski, R., Nieto, H., El-Madany, T., Migliavacca, M., a remote sensing energy balance method over different canopy and Carrara, A.: Validation of Fine Resolution Land- applied at global scale, Agr. Forest Meteorol., 279, 107633, Surface Energy Fluxes Derived with Combined Sentinel-2 https://doi.org/10.1016/j.agrformet.2019.107633, 2019. and Sentinel-3 Observations, IGARSS 2018 IEEE Intl. Choudhury, B. J., Ahmed, N. U., Idso, S. B., Reginato, R. J., and Geosci. Rem. Sens. Symposium, Valencia, 8711–8714, Daughtry, C. R. S.: Relations between evaporation coefficients https://doi.org/10.1109/IGARSS.2018.8518229, 2018. https://doi.org/10.5194/hess-25-755-2021 Hydrol. Earth Syst. Sci., 25, 755–768, 2021
You can also read