Beyond Post-release Mortality: Inferences on Recovery Periods and Natural Mortality From Electronic Tagging Data for Discarded Lamnid Sharks ...
←
→
Page content transcription
If your browser does not render page correctly, please read the page content below
ORIGINAL RESEARCH
                                                                                                                                              published: 07 April 2021
                                                                                                                                     doi: 10.3389/fmars.2021.619190

                                            Beyond Post-release Mortality:
                                            Inferences on Recovery Periods and
                                            Natural Mortality From Electronic
                                            Tagging Data for Discarded Lamnid
                                            Sharks
                                            Heather D. Bowlby 1* , Hugues P. Benoît 2 , Warren Joyce 1 , James Sulikowski 3 ,
                                            Rui Coelho 4,5 , Andrés Domingo 6 , Enric Cortés 7 , Fabio Hazin 8 , David Macias 9 ,
                                            Gérard Biais 10 , Catarina Santos 4,5 and Brooke Anderson 3
                                            1
                                              Bedford Institute of Oceanography, Fisheries and Oceans Canada, Dartmouth, NS, Canada, 2 Institut
                                            Maurice-Lamontagne, Fisheries and Oceans Canada, Mont-Joli, QC, Canada, 3 School of Mathematical and Natural
                                            Sciences, Arizona State University, Glendale, AZ, United States, 4 Portuguese Institute for the Ocean and Atmosphere (IPMA,
                                            I.P.), Olhão, Portugal, 5 Centre of Marine Sciences of the Algarve (CCMAR), University of Algarve, Faro, Portugal,
                                            6
                                              Laboratorio de Recursos Pelágicos, Dirección Nacional de Recursos Acuáticos, Montevideo, Uruguay, 7 Panama City
                                            Laboratory, NOAA Fisheries, Southeast Fisheries Science Center, Panama, FL, United States, 8 Department of Fishing and
                                            Aquaculture, Universidade Federal Rural de Pernambuco, Recife, Brazil, 9 Oceanographic Center of Malaga, Spanish
                            Edited by:
                                            Institute of Oceanography, Málaga, Spain, 10 Ifremer, Laboratoire LIENSs, Université de La Rochelle, Nantes, France
         Juan Carlos Azofeifa-Solano,
  University of Costa Rica, Costa Rica
                        Reviewed by:        Accurately characterizing the biology of a pelagic shark species is critical when
                         Luis Cardona,      assessing its status and resilience to fishing pressure. Natural mortality (M) is well
        University of Barcelona, Spain
                        Tatiana Araya,      known to be a key parameter determining productivity and resilience, but also one for
  University of Costa Rica, Costa Rica      which estimates are most uncertain. While M can be inferred from life history, validated
                 *Correspondence:           direct estimates are extremely rare for sharks. Porbeagle (Lamna nasus) and shortfin
                  Heather D. Bowlby
                                            mako (Isurus oxyrinchus) are presently overfished in the North Atlantic, but there are no
      heather.bowlby@dfo-mpo.gc.ca
                                            directed fisheries and successful live release of bycatch is believed to have increased.
                   Specialty section:       Understanding M, post-release mortality (PRM), and variables that affect mortality are
         This article was submitted to
                    Marine Megafauna,
                                            necessary for management and effective bycatch mitigation. From 177 deployments of
               a section of the journal     archival satellite tags, we inferred mortality events, characterized physiological recovery
          Frontiers in Marine Science       periods following release, and applied survival mixture models to assess M and PRM.
         Received: 19 October 2020          We also evaluated covariate effects on the duration of any recovery period and PRM
          Accepted: 15 March 2021
           Published: 07 April 2021         to inform mitigation. Although large sample sizes involving extended monitoring periods
                             Citation:      (>90 days) would be optimal to directly estimate M from survival data, it was possible
     Bowlby HD, Benoît HP, Joyce W,         to constrain estimates and infer probable values for both species. Furthermore, the
  Sulikowski J, Coelho R, Domingo A,
 Cortés E, Hazin F, Macias D, Biais G,
                                            consistency of M estimates with values derived from longevity information suggests that
    Santos C and Anderson B (2021)          age determination is relatively accurate for these species. Regarding bycatch mitigation,
       Beyond Post-release Mortality:       our analyses suggest that juvenile porbeagle are more susceptible to harm during
      Inferences on Recovery Periods
 and Natural Mortality From Electronic      capture and handling, that keeping lamnid sharks in the water during release is optimal,
  Tagging Data for Discarded Lamnid         and that circle hooks are associated with longer recovery periods for shortfin mako.
   Sharks. Front. Mar. Sci. 8:619190.
    doi: 10.3389/fmars.2021.619190          Keywords: Natural mortality, recovery period, lamnid sharks, Atlantic, survival, mitigation, bycatch

Frontiers in Marine Science | www.frontiersin.org                                  1                                             April 2021 | Volume 8 | Article 619190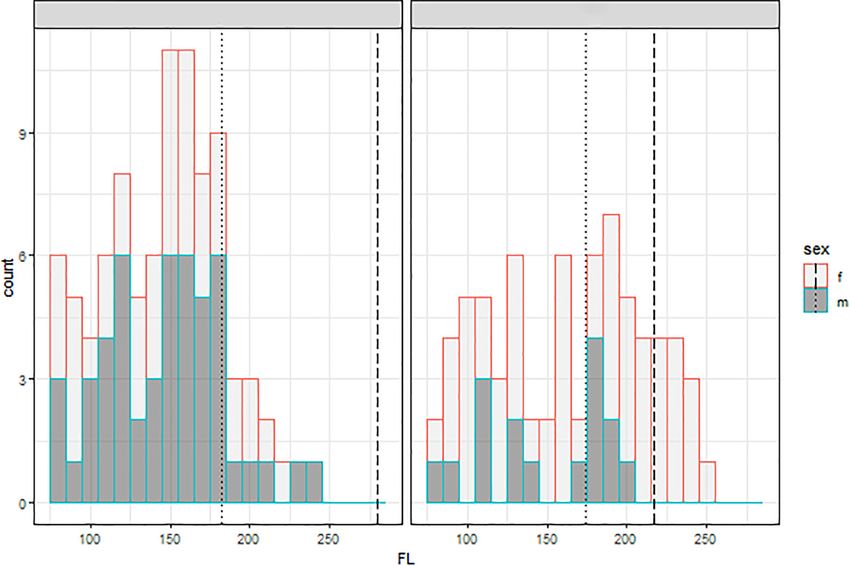
Bowlby et al.                                                                                                    Estimating M, PRM, and Covariates

INTRODUCTION                                                               on survivorship tends to consider only covariates with at-vessel
                                                                           and/or post-release mortality. In general, lamnid sharks appear to
Quantifying fishing-related (F) and natural (M) mortality                  be quite resilient to various types of capture and handling (Musyl
continues to be one of the main challenges in understanding                and Gilman, 2019). However, sublethal effects on behavior and/or
and managing marine fauna. Representative starting values                  physiology are likely even though individuals survive (Skomal,
and priors for M are needed for demographic analyses (e.g.,                2007). Several studies report changes in swimming and dive
Cortés, 2016), evaluating resilience to population decline (e.g.,          behavior upon release, indicative of a recovery period (e.g.,
Gedamke et al., 2007; Au et al., 2015), estimating extinction risk         Skomal and Chase, 2002; Sippel et al., 2011; Wilson et al., 2014;
(e.g., García et al., 2008), and stock assessment (e.g., Cortés,           Whitney et al., 2016). Any behavioral changes associated with
1998, 2002). For elasmobranchs in particular, M is typically               recovery from physiological stress may ultimately contribute
approximated from life history information, using previously               to mortality by making animals more susceptible to disease
derived functional relationships with longevity, growth or size            or predation, less able to forage, and/or more susceptible to
(Kenchington, 2014; Cortés, 2016; Pardo et al., 2016). To                  recapture (Davis, 2002; Jepsen et al., 2015). Thus, mitigation
varying extents, common methods rely on age determination,                 measures designed to reduce the duration of any recovery period
and are calculated from theoretical longevity, length-at-age               following release or to minimize capture and handling effects
and weight-at-age relationships, and/or von Bertalanffy growth             could be relevant when developing best practices to reduce shark
function parameters (reviewed in Kenchington, 2014). This                  bycatch mortality.
means all methods are sensitive to the level of uncertainty in age             For this study, we compiled data from satellite tagging on
determination for elasmobranchs, where longevity specifically              porbeagle and shortfin mako sharks in the North Atlantic.
may be systematically underestimated (Campana et al., 2002;                Deployments were conducted by Canada, the United States,
Harry, 2018; Natanson et al., 2018). Underestimation of                    Portugal, and by the International Commission for the
maximum age results in an overestimation of M from life-history            Conservation of Atlantic Tunas (ICCAT) through the Shark
based methods. There is a pressing need to move away from life-            Research and Data Collection Program. Of the shark species
history based estimates of M to more direct estimates derived              whose status is regularly assessed at ICCAT, shortfin mako and
from species-specific data. Electronic tagging is an important             porbeagle are currently considered overfished with a very high
source of information on movement, habitat associations and                probability (ANON, 2019, 2020). Recovery planning for both
survival of large pelagic fishes (Hammerschlag and Sulikowski,             species would benefit from improved mortality estimates for
2011; Hazen et al., 2012), and provides an opportunity to directly         stock assessment, as well as from the development of best-
estimate natural mortality from survival data (e.g., Benoît et al.,        practices for mitigation of bycatch mortality. For these purposes,
2015, 2020a). Nonetheless the substantial cost associated with             our objectives were to infer M from survivorship data in light of
archival tags still constrains sample sizes (Hazen et al., 2012)           relatively small sample size, to characterize any recovery period
and poses a particular challenge for reliable estimation of M for          following tagging from changes in dive depths and periodicity,
long-lived species.                                                        and to evaluate covariate effects on PRM and/or the duration of
    Pelagic sharks tend to have high interaction rates with high-          any recovery period.
seas fisheries targeting swordfish and tunas, and the majority
of global shark catches represent bycatch (Lewison et al., 2004;
Oliver et al., 2015). The magnitude of shark bycatch and                   MATERIALS AND METHODS
the need for mitigation to reduce population declines (Dulvy
et al., 2014) have driven recent research on shark survivorship            This study combined data from 177 archival satellite tag
following release (Ellis et al., 2017; Miller et al., 2020). In the        deployments during 2001–2019 in the North Atlantic (Figure 1),
North Atlantic, shortfin mako (Isurus oxyrinchus) and porbeagle            73 on porbeagle and 104 on shortfin mako (Supplement 1).
(Lamna nasus) are two species for which landings have decreased            Both species were captured during regular commercial fishing
in recent years and discard rates are increasing as a result               activities by pelagic longline fleets (N = 134), scientific cruises
of national and international management measures. A large                 using pelagic longline (N = 38) or commercial trawl trips
proportion of discards have the potential to be released alive,            (N = 5) and tagged by fisheries observers, science personnel, or
given that estimated at-vessel mortality rates range from 35–56%           fishermen trained by science personnel. Tags were attached to the
for shortfin mako and 21–44% for porbeagle (reviewed in Ellis              sharks by tethering a dart anchor into the dorsal musculature,
et al., 2017). Although quantifying rates of post-release mortality        immediately beside the posterior end of the first dorsal fin
(PRM) remains a priority for future stock assessments to improve           (Campana et al., 2016; Musyl et al., 2011). Anchors consisted
estimates of total removals, additional consideration of variables         of either nylon umbrella darts (Domeier Anchor) or titanium
that affect survivorship is critical to develop effective bycatch          darts, excluding the single deployment with an experimental
mitigation measures (Davis, 2002; Ellis et al., 2017).                     fin clamp. Stainless steel wire or 400 lb test monofilament
    Capture and handling are two separate processes that can               line (∼15 cm) was used to tether the tags to the anchor and
influence survivorship of bycatch (Benoît et al., 2012). For the           the wire/line was sheathed in high temperature heat-shrink
majority of species, different handling protocols in addition to           tubing to prevent chaffing at the point of attachment and to
tagging effects are very rarely evaluated because they are assumed         protect the leader. The PSAT tags were programmed to release
to be negligible in relation to capture effects (Musyl et al., 2009;       from the sharks with the anchor and wire assembly remaining
Molina and Cooke, 2012; Jepsen et al., 2015). For sharks, research         attached to them.

Frontiers in Marine Science | www.frontiersin.org                      2                                       April 2021 | Volume 8 | Article 619190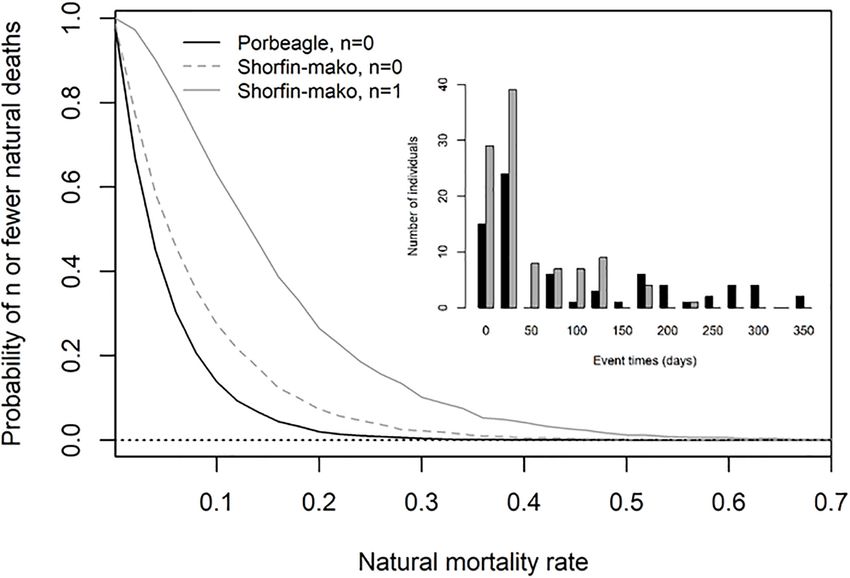
Bowlby et al.                                                                                                                     Estimating M, PRM, and Covariates

  FIGURE 1 | Tagging locations for shortfin mako (diamonds) and porbeagle (stars) in the Atlantic Oceans. Longitudes and latitudes are given in Supplement 1.

   Individuals were chosen opportunistically for tagging. Six                        Computers), and X-tags (N = 11; Microwave Telemetry). All
different types of archival satellite tag were deployed: PSATLIFE                    tags recorded depth, either directly or through pressure, which
survival tags (N = 39; Lotek Wireless), survivalPAT (N = 13;                         was used to evaluate behavior and survival following tagging
Wildlife Computers), miniPAT (N = 56; Wildlife Computers),                           (PSATLIFE tags 0.05% resolution for pressure; survivalPAT,
PAT4 (N = 1; Wildlife Computers), PAT MK10 (N = 57; Wildlife                         miniPAT, PAT 4, and PAT Mk 10: ± 0.5 m depth; and

Frontiers in Marine Science | www.frontiersin.org                                3                                             April 2021 | Volume 8 | Article 619190
Bowlby et al.                                                                                                 Estimating M, PRM, and Covariates

X-Tags: 0.34 m depth resolution). Each tag type reported                et al., 2006). It is important to note that some animals
the archived depth data at a different temporal resolution,             exhibited similarly restricted diving behavior at other times
ranging from a single daily maximum and minimum from                    during monitoring, which may have been related to geographical
survivalPAT tags to values at 5-min intervals from the                  position. However, if restricted diving behavior upon release
PSATLIFE tags. Deployments were a maximum of 28 days                    was solely a function of geographical position, it would not
for PSATLIFE tags and 30 days for survivalPAT tags. The                 be expected to be functionally related to tagging covariates.
PAT tag was deployed for 19 days with the experimental fin              Although we report the estimated duration of recovery periods
clamp. Longer-term deployments were possible from the other             for each individual (Supplement 1), our analyses of recovery
tag types and maximum deployment durations were 255 days                time is focused on comparisons of mean recovery time
for miniPATs, 204 days for X-tags, and 356 days for PAT                 between two groups.
MK10s (Supplement 1).                                                      Mortality events were inferred from continual records at a
                                                                        constant depth for multiple days (indicative of a dead animal
                                                                        on the bottom) or pop-ups following progressively increasing
Post-release Behavior and Inferring                                     depth records up to the tag crush depth (indicative of an animal
Mortalities                                                             that is sinking; e.g., Musyl et al., 2011). Thus, the tag data
Behavioral changes following tagging were assessed from                 tracked survival in continuous time (days until death) with
recorded depth (pressure) profiles. SurvivalPAT tags provided no        right-censored observations from individuals that lived until the
information on daily dive variability and were not included in          end of the observation period. The observations were censored
the behavioral analyses. Daily dive variance (σ2 ) was calculated       because the ultimate time of death of the individual is unknown,
from dive amplitudes and initially used to characterize behavior        yet the animal was known to be alive until the end of the
following tagging. For example, dive depth was calculated as            observation period (Cox and Oakes, 1984). To separate post-
the maximum minus the minimum depth recorded for each                   release mortality events (i.e., mortality associated with capture
summary interval (4, 6, 8, or 12 h summaries) for miniPAT               and handling) from natural mortality events (i.e., independent
and PAT Mk 10 tags, and then variance was calculated from               from the capture process), we evaluated patterns in dive behavior
these depths for each day. No attempt was made to impute                for animals that ultimately died. Similar to the evaluation of
missing values for days without transmitted data. Porbeagle             dive tracks from individuals that lived, we identified animals
have been shown to exhibit limited vertical movement (i.e.,             that were negatively affected by capture and handling as those
low variability in dive depths) and residency at the surface            with near-zero variability in dive depth coupled with residency
following the physiological stresses associated with capture            in the top of the water column upon release. A mortality event
and release, indicative of a recovery period (Hoolihan et al.,          that followed such a period of restricted diving behavior, with
2011). In our data, low variability in dive depths upon release         minimal evidence of re-establishment of cyclical movement, was
was always associated with residency in the top 60 m of the             considered post-release mortality and directly related to capture
water column. Thus, we identified the animals that exhibited            and handling. There was a single instance where an individual
a recovery period following capture and handling as those               abruptly died yet had not exhibited any prior behavior that
with low variability in dive depth coupled with residency in            could be attributed to capture and handling. This mortality
the top of the water column at the start of the deployment              event was sudden and preceded by dive depths and periodicity
(Supplement 2: Supplementary Figures 1C, 2B). To quantify               consistent with those observed from animals that lived until the
the duration of the recovery period, we identified the day on           end of the observation period (comparison in Supplement 2:
which dive variability markedly increased. Variance increased           Supplementary Figure 1). This mortality was suspected to
substantially once an animal started to dive more regularly             represent a natural mortality event.
and more deeply (i.e., maximum dive depths and periodicity
increased). We identified the end of the recovery period as the
day with the maximum difference between dive variance at the            Factors Influencing Recovery and
start of the deployment vs the remainder of the deployment.             Survival
This involved sequentially calculating the difference in variance       There were several characteristics of the capture and handling
among time periods throughout the track, i.e., comparing                process that could be evaluated from these tag deployments.
day 1 vs day 2 onward, days 1–2 vs 3 onward, days 1–                    The covariates that were considered included fork length, stage
3 vs 4 onward, and so on (Supplement 2: Supplementary                   (juvenile, adult), sex (male, female), gear type (longline, trawl),
Figure 2C). Compared to analyses that use eigenfunctions and            hook type (circle, J), hooking location (mouth, gut), and handling
orthogonal axes to determine irregular post-release behavior            location (in water, on-board) (Supplement 1). Note that the gut
(e.g., Hoolihan et al., 2011), using variance was computationally       category for hooking location included gut-hooked (5 shortfin
simpler and had a direct ecological interpretation in terms of          mako, 10 porbeagle) and foul-hooked individuals (0 shortfin
how behavior was changing over time. Inconsistent sampling              mako, 6 porbeagle; Supplement 1). When categorizing life stage,
frequencies among the tag types and programmed settings                 we used sex-specific length at 50% maturity to separate juveniles
prevented analyzing dive behavior using more sophisticated              from adults, with values of 182 cm and 280 cm fork length (FL)
statistical methods such as Wavelet analyses (e.g., Thorburn            for male and female shortfin mako (Natanson et al., 2020) and
et al., 2019) or the fast Fourier transform (e.g., Shepard              174 cm and 218 cm FL for male and female porbeagle (Natanson

Frontiers in Marine Science | www.frontiersin.org                   4                                       April 2021 | Volume 8 | Article 619190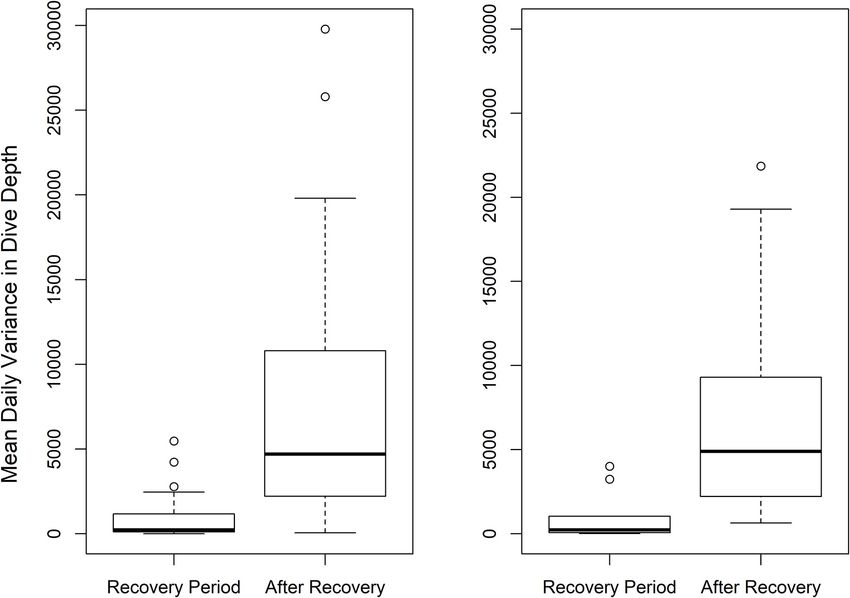
Bowlby et al.                                                                                                      Estimating M, PRM, and Covariates

et al., 2002). There were only 58 deployments on shortfin mako              to estimate separate rates of catch-related post-release mortality
and 57 on porbeagle that had information for the entire suite of            (PRM) and natural mortality (M). Specifically, the survivorship
covariates (Supplement 1).                                                  to time t, S(t), was modeled as:
    The properties of the data on recovery times (e.g., sparse, zero-
inflated) made typical parametric regression analyses unsuitable,                    S(t) = (πexp[−(αt)γ ] + (1 − π)) · exp(−Mt)                   (1)
so we used a randomization test to evaluate relationships with
covariates. The main assumption underlying this approach is that            where α and γ are parameters of a Weibull survival function
the observed sample is representative of the larger population.             that describes the attrition of fish that will die after release due
We ran 10,000 samples to characterize the distribution for the              to the capture and release event, π is the post-release mortality
mean difference in recovery times between factor levels of each             rate, and M is the instantaneous annual rate of natural mortality
covariate, implemented in the “simpleboot” package in R (Peng,              (for a derivation see Benoît et al., 2015). Model parameters were
2019). The distribution of differences would be centered on                 estimated using maximum likelihood (details in Benoît et al.,
zero if there was no effect of the covariate on recovery time               2015, 2020b). The non-parametric Kaplan-Meier (KM) estimator
and the proportion of samples with means that fell below zero               (Cox and Oakes, 1984) was used to visualize the survivorship of
represented the p-value for the comparison. To evaluate any                 the two species, providing a basis for visually assessing model fit.
association between recovery time and the continuous covariate                 The model in Equation 1 effectively parses out mortality into
FL, we used a Spearman Rank Correlation test. Relationships with            capture-related (PRM) and natural (M) components based on
hooking location and gear type could not be examined because                their assumed time course. Post-release mortality is considered
there were insufficient data in one of the categories.                      to asymptote over a finite timespan, typically within hours
    The influence of covariates on survivorship for each species            or days (reviewed in Musyl and Gilman, 2019). Meanwhile,
was assessed using Cox proportional hazards models (CPHM;                   released individuals are continuously at risk of dying from natural
Cox, 1972; Therneau and Grambsch, 2000). CPHM are a                         causes such as disease or predation, and an exponential function
well-established semi-parametric approach that estimates the                is commonly assumed in population modeling. The model
multiplicative effect of covariates on a common hazard function,            can freely and reliably estimate the two mortality components
which describes the time-specific instantaneous probability of              provided that sufficient observations are available for both early
dying at a given time t, conditional on having survived to                  rapid mortality and the later time periods (Benoît et al., 2015).
t. For each CPHM, the proportional hazards assumption was                   Alternatively, the estimation can be aided by specifying the cause
tested based on trends in the Schoenfeld residuals and was                  of mortality for some or all observations (Benoît et al., 2020a).
assessed visually by plotting the log of the negative log survivor          In this study, patterns in dive depths and periodicity suggested
function vs the log of event time. To provide the best inferences           that 33 of the mortalities of shortfin mako were catch-related,
possible in light of missing covariate data, we undertook two               and only one had the potential to be natural. All mortalities
series of analyses of the influence of covariates using CPHM.               of porbeagle appeared to be catch-related. Therefore, we fit
In the first, each covariate was modeled individually using                 the parametric model above with three variations: (1) fixing
all available observations, with no attempt to impute missing               M = 0, which attributes all observed mortality events to PRM,
values. In the second series, we limited the data to observations           (2) estimating M using the full model above, and (3) using the
for which values were available for all covariates (N = 58 for              full model with cause-specific classifications of mortality (shortfin
shortfin mako and N = 57 for porbeagle). This second series                 mako only). The cause-specific estimation for shortfin mako
of analyses was intended to identify the suite of covariates                was accomplished by specifying different likelihood equations
associated with survivorship. A forward-selection scheme based              for the different classes of event observations (Benoît et al.,
on Akaike’s Information Criterion (AIC) was employed, For                   2020a; Kneebone et al., 2020). Specifically, observations for which
shortfin mako, a model with hook-related injury resulted in a               the cause of death was inferred to be catch-related employed a
decrease in AIC of 10.5 compared to an intercept only model,                likelihood in which M was fixed at 0, those for which the cause
but no other single or multiple covariate models were found                 was assumed to be natural employed a likelihood in which π
to be comparable or superior based on AIC. For porbeagle,                   was fixed at zero, and those of uncertain cause employed the
there were no models including a single covariate that resulted             full likelihood for Equation 1. Similarly all censored observations
in a reduction in AIC of at least two units compared to an                  employed the full likelihood as these individuals were at risk of
intercept-only model. Therefore, models incorporating multiple              dying from both catch-related and natural causes.
covariates were not pursued further and we report the results
for individual covariates only, using all available observations. As        Simulation Modeling to Further Infer
in the behavioral analyses, statistical significance was accepted at        Natural Mortality Rates
p < 0.05.                                                                   Life history-based estimates of M for pelagic sharks are very low
                                                                            relative to other fish species (Cortés, 2002), suggesting natural
                                                                            mortality events are rare. The probability of observing natural
Estimating Post-release and Natural                                         deaths during the course of a tagging experiment should be
Mortality                                                                   correspondingly low, particularly when the median deployment
A CPHM does not distinguish between components of mortality,                duration from all tag types was 28 days for both porbeagle and
so we used the parametric mixture model of Benoît et al. (2015)             shortfin mako. This likely explained why a natural mortality event

Frontiers in Marine Science | www.frontiersin.org                       5                                        April 2021 | Volume 8 | Article 619190
Bowlby et al. Estimating M, PRM, and Covariates
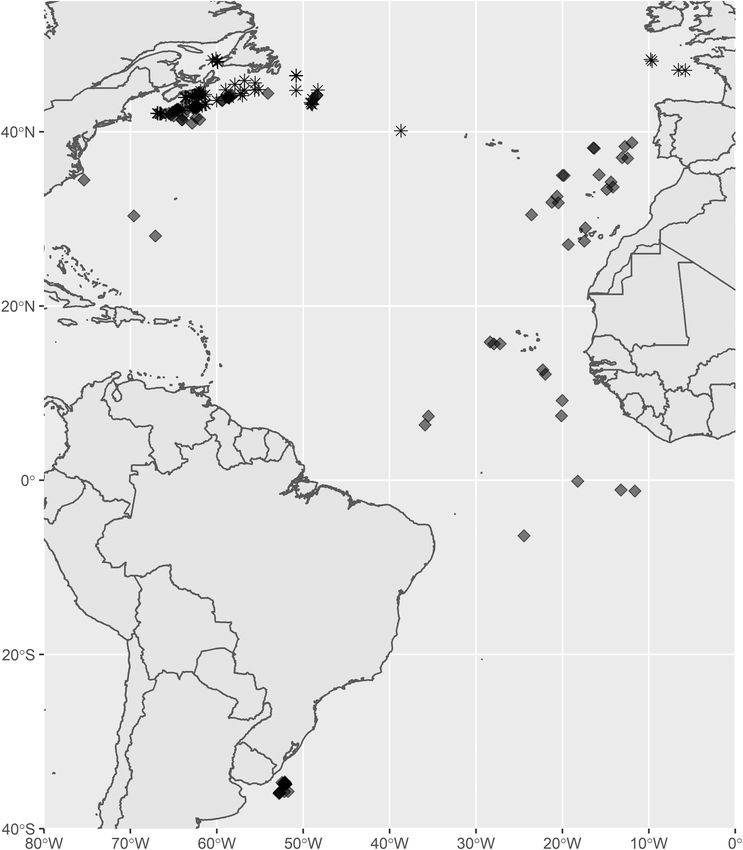
FIGURE 2 | Size distribution of tagged male (dark gray) and female (light gray) shortfin mako (A) and porbeagle (B). Sizes at 50% maturity for males (dotted) and
females (dashed) of both species are shown by the vertical lines.
was only observed once in these data. We used a simulation likely to observe no natural mortality events over the duration of
model to allow for inferences on the probable magnitude of the study as the magnitude of M increases. We also simulated the
M for each species given the observations made in this study. probability of observing no natural deaths for shortfin mako to
Our approach determined the probability of observing no illustrate the extent to which a single observation can change the
natural deaths during the experiments for porbeagle and the probabilities associated with different natural mortality rates. Ten
probability of one or fewer for shortfin mako, as a function of thousand iterations were undertaken for each Ms value, which
the natural mortality rate. ranged from 0.02 to 0.70, with increments of 0.02.
Following the method by Bender et al. (2005), each iteration
of the simulation proceeded as follows. Vectors of mortality
probabilities, Z(t), with lengths corresponding to the total RESULTS
number of mortality event observations for each species
were generated by randomly selecting values from a uniform The opportunistic tagging resulted in a range of sizes of
distribution over the interval [0,1]. Assuming exponential natural both species and sexes, with slight oversampling of shortfin
mortality, mortality event times from each individual, tM,i , in mako < 100 cm FL and fewer than expected porbeagle between
days, associated with each value of Z(t)i for a given simulated 150 and 170 cm FL (Figure 2) relative to typical length-frequency
annual natural mortality rate Ms were calculated as: distributions from landings data (Coelho et al., 2018; Santos
et al., 2020). The vast majority of tagging occurred on juvenile
tM,i = −365 log(Z(t)i )/Ms (2) animals, consistent with the selectivity patterns in longline
fisheries (ANON, 2019, 2020). Animals ranged in size from 78
A censoring time, tC,i , was simulated for each individual by to 249 cm FL (mean = 163 cm FL) for porbeagle and 66–240 cm
sampling with replacement from among the mortality event times FL (mean = 144 cm FL) for shortfin mako. The sex ratio of
for each species in the tagging experiments. Instances in which tagged animals was skewed in both species, with more females for
tM,i ≤ tC,i reflect a simulated instance in which an individual porbeagle and more males for shortfin mako. Sample sizes varied
died from natural causes while or before dying from catch-related substantially across the different tagging covariates (Table 1), as
causes or having its tag detach. The proportion of iterations was expected from opportunistic tag deployments.
for which no individuals (porbeagle) or one or no individuals Given the tag types used, we could determine the recovery
(shortfin mako) died from natural causes for a given value of Ms period following tagging for 59 shortfin mako and 53 porbeagle.
is the estimated probability that the observed number of natural We distinguished pre- and post-recovery periods using a sharp
deaths occurred at that rate of natural mortality. It becomes less change in variance (Supplement 2: Supplementary Figure 2C),
Frontiers in Marine Science | www.frontiersin.org 6 April 2021 | Volume 8 | Article 619190Bowlby et al. Estimating M, PRM, and Covariates
0.076
0.657
0.382
0.892
0.851
0.063
0.001
0.445
Pval
and a comparison of mean daily dive variance during and
TABLE 1 | Summary of the covariate analyses showing the number of animals that lived (L), died (D) and total (T) for each comparison, plus the coefficients (coef), standard error (se), and p-values (pval) for differences
following the recovery period showcases the substantial increase
Mortality in dive depths and periodicity following recovery. During the
0.006
0.678
0.776
1.045
1.049
0.920
0.713
0.677
SE
inferred recovery period, the median variance was near-zero for
both species, while it increased to ∼5,000 following the recovery
−0.01 period (Figure 3). For individuals that remained in the top of the
−0.14
−0.20
Coef
0.30
0.68
1.71
2.33
0.52
water column following tagging, there were no instances where
dive variance was greater immediately following tagging than in
the remainder of the deployment. The majority of sharks that
0.217
0.470
0.008
0.190
0.015
Pval
–
–
–
died after tagging did so relatively quickly, many within hours.
Recovery time
All mortalities of porbeagle occurred within 45 days of release
Porbeagle
2.214
1.925
1.501
1.830
and there were many long-term survivors, some with monitoring
SE
–
–
–
–
for up to a year (Figure 4A and Supplement 1). Similarly, all
mortalities of shortfin mako shark occurred within 50 days of
−0.11∧
−3.63
release, and there were many long-term survivors, including
Coef
0.35
4.35
1.38
–
–
–
some with monitoring times in excess of 200 days (Figure 4B
and Supplement 1).
73
16
55
53
19
68
63
10
37
14
59
T
5
5
6
Tag summary
Factors Influencing Recovery and
Survival
12
10
11
10
D
3
8
2
1
1
2
6
3
3
9
The estimated durations of recovery for porbeagle
(mean = 9.1 days) were similar to previous evaluations of
61
13
47
43
17
57
53
34
11
50
L
4
4
4
4
recovery periods based on dive behavior for multiple species
of pelagic teleosts (mean = 7.1 days) and pelagic sharks
0.083
0.724
0.968
0.266
0.043
0.048
Pval
(mean = 10.8 days) (Hoolihan et al., 2011; Musyl et al.,
–
2015). The estimated durations of recovery for shortfin mako
Mortality
(mean = 3.8 days) tended to be lower. For the animals that
0.005
0.880
0.971
0.683
0.616
0.549
SE
–
survived, there were no differences in mean recovery time
between the sexes of either species, between different hooking
injury types for both species, or between juvenile and adult
−0.01
−0.38
−1.08
Coef
0.13
0.03
1.24
–
shortfin mako (Table 1). There was a negative relationship
between recovery time and fork length for both species, whichBowlby et al. Estimating M, PRM, and Covariates
FIGURE 3 | Boxplots of mean daily variance in dive depths during the recovery period following tagging and throughout the remainder of the tag deployment for
shortfin mako (A) and porbeagle (B).
foul-hooked. Combining the latter two categories to increase identical PRM estimate and an estimate of the M parameter that
sample size, the hazard ratio for fish hooked elsewhere than was essentially zero, with an exceedingly wide confidence interval
in the mouth was 8.49 (95% CI: 2.21–32.46), constituting an (results not shown). In contrast, the cause-specific estimation
important reduction in survival (Supplement 2: Supplementary (i.e., when one natural death event was identified in the data,
Figure 7). For both species, risk of mortality was negatively see Figure 4E) produced an estimate of post-release mortality of
associated with increased fork length, though the effect was not 0.339 (0.246–0.453) and an estimate of natural mortality of 0.101
statistically significant. (0.016–0.659) (Table 2). This model also provided a good fit to the
survivorship trend, although the uncertainty around survivorship
Estimating Post-release and Natural at later times was greater and increasing in time compared to
Mortality the model excluding natural mortality. This pattern reflected the
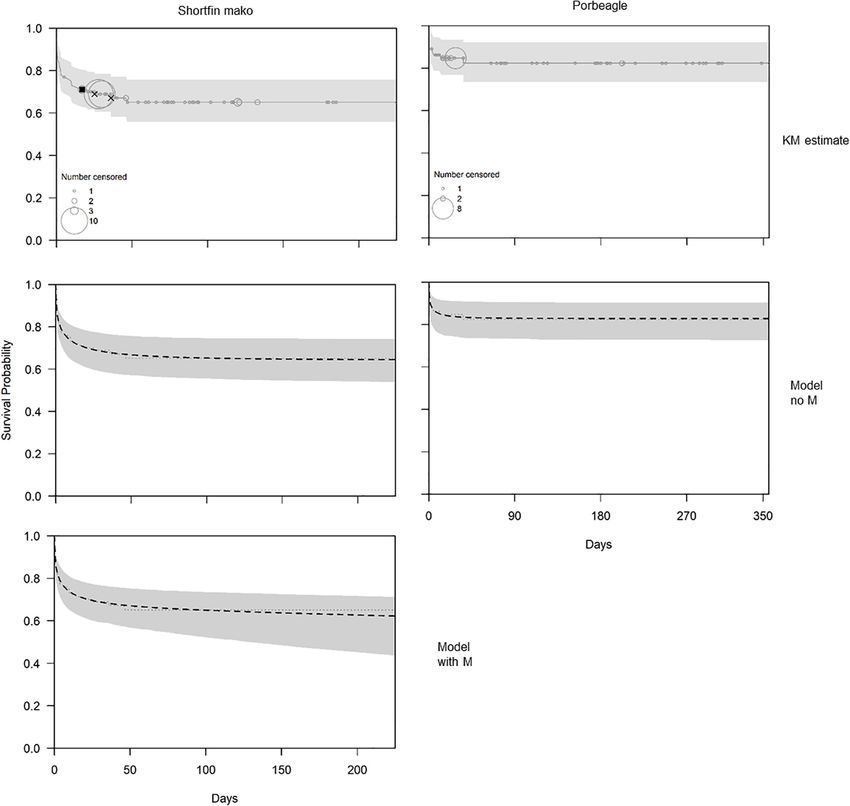
Visual evaluation suggested fits from the parametric survival uncertainty associated with the additional and ongoing natural
model were comparable to those from the non-parametric mortality component (Figure 4E).
Kaplan-Meier (KM) estimator (c.f. Figures 4A–D). For porbeagle
shark, the parametric model with only post-release mortality Simulation Modeling
(i.e., M = 0) fit the trends in survivorship very well, producing The absence of observations of natural deaths for porbeagle
an estimate of PRM of 0.171 (95% confidence interval: 0.099– during the tagging experiments is consistent with the species’
0.277) (Table 2 and Figure 4D). An identical estimate of PRM having low natural mortality. The simulation model suggests
was obtained when M was estimated in the model because probabilities of ≤0.10 associated with each natural mortality
the estimate of the M parameter was essentially zero, with an rate above 0.15 (Figure 5). In contrast, the observation of a
exceedingly wide confidence interval (results not shown). It single natural death for shortfin mako resulted in substantially
is therefore not possible to directly estimate natural mortality higher probabilities for the same natural mortality rates. The
for porbeagle using data from these tagging experiments. For probability of observing one or no natural deaths only dropped
shortfin mako, the parametric model with only post-release below 0.10 when M was greater than 0.3. We also ran the
mortality fit the trends in survivorship very well, producing simulations for a scenario assuming no natural deaths had been
an estimate of PRM of 0.358 (95% confidence interval: 0.259– observed for shortfin mako, to evaluate how assigning cause to
0.479) (Table 2 and Figure 4C). As with porbeagle, the model mortality events affects predicted PRM rates as well as how overall
that attempted to freely estimate natural mortality produced an monitoring duration affects the simulations. In that scenario, the
Frontiers in Marine Science | www.frontiersin.org 8 April 2021 | Volume 8 | Article 619190Bowlby et al. Estimating M, PRM, and Covariates FIGURE 4 | Estimates (solid or dashed lines) and 95% confidence intervals (shaded bands) for the survivorship of shortfin mako [left column; panels (A,C,E)] and porbeagle [right column; panels (B,D)], based on the non-parametric Kaplan-Meier (KM) estimator [top row; panels (A,B)], the parametric model with M = 0 [middle row; panels (C,D)] and the parametric model that included natural mortality (M) using cause-specific estimation [panel (E); shortfin mako only]. In panels (A,B) the circles represent right-censoring times, where the size of the circle indicates the number of censored observations, and the filled squares and crosses, respectively, indicate an inferred natural death event and death events with uncertain cause. All other mortality events were inferred to be related to capture and handling. In panels (C–E) the dotted line is the KM estimate, plotted as a reference. simulated probability for shortfin mako was essentially double DISCUSSION that of porbeagle at 0.2 when M = 0.15 (Figure 5). There were 27 porbeagle that were monitored for > 90 days (∼3 months) as Large sample sizes involving extended monitoring periods would compared to only 15 shortfin mako (Supplement 1). Extended be optimal to directly estimate M from satellite tagging data monitoring periods using archival tags increases the chances of for lamnid sharks. Yet it remains possible to infer probable observing mortality from natural causes. If such mortality events values or to constrain estimates, even in the absence of direct are not observed despite longer monitoring, there is greater observations. For porbeagle, there was less than a 10% probability certainty that the rate of natural mortality is low, as was the associated with values of M higher than 0.15 based on the case for porbeagle. simulation modeling. From the survival mixture model and a Frontiers in Marine Science | www.frontiersin.org 9 April 2021 | Volume 8 | Article 619190
Bowlby et al.                                                                                                                          Estimating M, PRM, and Covariates

TABLE 2 | Estimates of post-release mortality (PRM) and natural mortality (M) for            of estimators based on longevity and growth data, M ranged
porbeagle and shortfin mako sharks based on a model that excluded natural
                                                                                             from 0.081 to 0.267 for porbeagle and from 0.068 to 0.318 for
mortality (M = 0) and a model in which M was estimated using cause-specific
parameter estimation (shortfin mako only).
                                                                                             shortfin mako for males and females combined. Our estimates
                                                                                             of M from survival data fell within these ranges, which lends
                          Shortfin mako                          Porbeagle                   credence to the natural mortality values currently being used in
                                                                                             stock assessment (ANON, 2019, 2020) and gives independent
Model              PRM                      M                     PRM            M
                                                                                             support that our current understanding of these species’ biology
1. No M     0.358 (0.259, 0.479)             0            0.171 (0.099, 0.277)    0          is largely representative.
2. With M 0.339 (0.246, 0.453) 0.101 (0.016, 0.659)                 –               –            Our results highlighted the types of information on
                                                                                             survivorship that can be gained from long-term vs short-
                                                                                             term tag deployments. Estimating post-release mortality and
single suspected natural mortality event, the maximum likelihood                             evaluating the influence of covariates with survivorship was
estimate of M was 0.101 for shortfin mako. To put these rates in                             the original goal for the majority of the tagging contributing
perspective, approximately 1.5% of a population is expected to                               to this study. This explains the predominance of satellite tag
live to maximum age (Hewitt and Hoenig, 2005). Under a simple                                types optimized for ≤30 days; chosen to reduce cost and
exponential model for mortality, 1.5% of the population would                                increase sample size, given that shorter monitoring periods
live to be ∼28 years (M = 0.150) for porbeagle and ∼41 years                                 are generally sufficient for estimating post-release mortality
(M = 0.101) for shortfin mako. This would be on the lower end                                in large pelagic fish (e.g., Musyl and Gilman, 2019; Benoît
of longevity estimates for porbeagle in the Northwest Atlantic                               et al., 2020b). Although our PRM rates were similar to those of
(24–43 years; Natanson et al., 2002), as might be expected from                              previous studies on these species, there were still limited and
an upper limit of M. Our estimate of longevity for shortfin                                  unbalanced data relative to covariates, which reduced statistical
mako in the North Atlantic also falls within the expected range                              power and thus detectability of relationships (Sippel et al.,
of longevity of 20–52 years (Natanson et al., 2006; Rosa et al.,                             2015). Mortality related to capture and handling apparently
2017). In all, there was fair correspondence with rates derived                              extended beyond a 30-day monitoring period, which suggests
from life history for both species, even though our data came                                PRM rates for porbeagle and shortfin mako could have been
primarily from juvenile animals. Estimates of M based on age                                 slightly underestimated if derived exclusively from short-term
and growth parameters, maturity, and longevity most often yield                              deployments (e.g., Marçalo et al., 2018). Finally, short-term
a single value, and variability is generated by applying different                           deployments reduced the potential for natural mortality events
types of estimators (e.g., Cortés, 2002, 2016) or by allowing                                to be observed over the duration of the experiment, making
for variability in longevity when using a single estimator (e.g.,                            them suboptimal for species characterized by low M. Our
Bowlby and Gibson, 2020). Using the Then et al. (2015) suite                                 results support several of the discussion points from a recent

  FIGURE 5 | Simulated probability of observing n or fewer mortality events resulting from natural causes during the tagging experiments, as a function of the annual
  natural mortality rate for porbeagle (n = 0, black solid line) and shortfin mako (n = 0, dashed gray line; n = 1, solid gray line). The inset histogram summarizes the
  observed mortality event times for the tagged porbeagle (black) and shortfin mako (gray).

Frontiers in Marine Science | www.frontiersin.org                                       10                                           April 2021 | Volume 8 | Article 619190
Bowlby et al. Estimating M, PRM, and Covariates meta-analysis of post-release mortality in pelagic sharks (Musyl that capture and handling was more detrimental to smaller and Gilman, 2019), demonstrating that a substantial number juveniles of both species, although it is important to recognize of tag deployments is required to tease apart fishing-related that decreased swimming performance caused by carrying the mortality from M, that long-term deployments are necessary tag would also be affecting these smaller animals (Todd Jones to increase precision of M estimates, and that a minimum et al., 2013). Although enhanced international cooperation and 3-month pop-up period (>90 days) would be useful when trying additional tagging would be optimal to bolster sample sizes (Ellis to separate post-release from natural mortality as opposed to et al., 2017; Harcourt et al., 2019), we suggest that quantifying relying on short-term archival tags. recovery periods from surviving individuals is an additional There is some debate on whether delayed mortality for avenue to explore the effect of covariates with capture and pelagic sharks can be linked to capture and handling or whether handling. Ideally, better standardization among tag types and PRM would be expected to asymptote relatively quickly. Several programmed settings would support more complex statistical survivorship studies in addition to ours have reported delayed analyses of behavior (e.g., Shepard et al., 2006; Thorburn et al., mortality, up to 50 days following release (summarized in Musyl 2019), and would be useful to give more precise estimates of and Gilman, 2019). Although mortalities that occur within hours the duration of recovery periods. In the absence of this, our of the tagging event are readily ascribed as PRM (Sulikowski comparisons provide meaningful information on sublethal effects et al., 2020), it is less clear if longer-term mortalities should be that arise from specific characteristics of the capture and handling attributed to capture and handling (Hutchinson et al., 2015). process for porbeagle and shortfin mako. Sublethal effects, such as reduced activity levels upon release (e.g., Revealing covariates with injury and mortality is important for Raoult et al., 2019), reflex impairment and physiological damage developing mitigation options for non-retained bycatch (Molina (e.g., Jerome et al., 2018), or measureable changes in distribution and Cooke, 2012; Ellis et al., 2017). One of the most consistent (e.g., Bullock et al., 2015) could ultimately result in delayed relationships in our study was related to handling, specifically mortality due to increased susceptibility to disease and predation, onboard vs in-water tagging. The > 3 day difference in recovery or cessation of feeding (Davis, 2002; Campana et al., 2016). Also, time for both species in addition to the significant reduction in M is continuous and can occur at any time, irrespective of the shortfin mako survivorship suggests that physiological stresses length of time since the capture event. Instead of categorizing associated with removal from the water significantly outweigh mortality as PRM and M based on a subjective timeframe, we any benefit of gear removal following capture. Although trailing used dive behavior to indicate whether mortality was likely gear is commonly thought to contribute to PRM (Gilman et al., related to capture and handling. We felt this was appropriate 2016), all animals that were tagged in the water for this study given the definitive contrast in dive variability that characterized were released by cutting the gangion, thus retaining the hook recovery, and the correspondence between our estimates of the plus an unquantified amount of monofilament leader (no weights duration of recovery and previous evaluations of dive behavior or steel leaders). When tagged onboard, the shark remained from archival satellite tagging data (e.g., Campana et al., 2009; under duress for a longer period and may have been subject to Hoolihan et al., 2011). Interestingly, the only likely natural physiological damage when lifted out of the water and/or from death was recorded from a mouth-hooked male shortfin mako the animal’s inability to support its own weight while onboard (157 cm FL) within 17 days of tagging. This individual’s dive track (Musyl et al., 2009). Studies that directly evaluate handling effects exhibited variability equivalent to recovered individuals until the (in isolation from capture effects) are rare, but longer handling mortality event. Given that this was one observation, it would be times and increased exposure to air have also shown a significant beneficial to explore the utility and robustness of behavior-based negative effect on activity levels upon release for Squaliform and classifications of mortality in future research. Carcharhiniform species (Raoult et al., 2019). Scientific work Evaluating capture and handling covariates relative to benefits from deep and precise insertion of the tag anchor to recovery time as well as survivorship allowed for a more fulsome reduce the probability of pre-mature tag loss, which is easier use of the tagging data and strengthened the inferences that to accomplish when the animal is onboard (Biais et al., 2017). could be made. As in other PRM studies, the majority of In our study, in-water tagging of porbeagle used PSATLIFE tagged animals survived, giving relatively few observations of tags only (28 day maximum deployment) and it was difficult mortality events from which to infer the effect of covariates to determine if pre-mature pop-ups were related to anchor (Sippel et al., 2015). Incorporating behavioral analyses of dive placement. This batch of tags had a 40% non-transmission rate patterns from surviving individuals was an inexpensive and (Bowlby et al., 2019) indicating other tag construction and/or straightforward way to increase the amount of information software issues. Shortfin mako that were tagged in the water gained, with some of the differences in recovery period being had a longer median monitoring duration as compared to those significant even when differences in survivorship were not. For tagged onboard (c.f. 60 days vs 57.5 days). Although it was not example, the estimated coefficients from the CPHM suggested a possible to determine the specific characteristics of boarding non-significant increase in survivorship of porbeagle with fork that increased recovery time for both species and decreased length. There was a corresponding significant increase in mean shortfin mako survival (e.g., the method of lifting the animal recovery time following release for juveniles as compared to out of the water, the duration the animal was onboard, the adults (i.e., juveniles took longer to recover from capture and method of gear removal), in-water release from commercial handling) as well as a significant decrease in recovery time captures and in-water tagging for scientific work appears optimal with fork length for shortfin mako. Taken together, we conclude for lamnid sharks. Frontiers in Marine Science | www.frontiersin.org 11 April 2021 | Volume 8 | Article 619190
Bowlby et al.                                                                                                                               Estimating M, PRM, and Covariates

    In terms of best-practices for the release of bycatch                                   AUTHOR CONTRIBUTIONS
from commercial interactions, our results support the
recommendation to release sharks immediately upon capture,                                  HDB conceived research, undertook data collection and
leaving embedded hooks and as little trailing line as possible                              fieldwork, developed analyses, wrote manuscript, and
(Musyl and Gilman, 2019). Contrary to earlier suggestions that                              contributed in funding. HPB developed models, undertook
handling practices have little influence on the condition of sharks                         analyses, and reviewed manuscript. WJ, CS, and BA undertook
upon release (Campana et al., 2009; Musyl and Gilman, 2019),                                data collection and fieldwork and reviewed manuscript. JS,
handling in and of itself was associated with substantial sublethal                         RC, AD, EC, FH, DM, and GB undertook data collection and
effects. Our results also support the general recommendation                                fieldwork, reviewed manuscript, and contributed in funding.
to increase protection of the juvenile life stages of bycaught                              All authors contributed to the article and approved the
species (Ellis et al., 2017), optimally by minimizing the potential                         submitted version.
for interaction through spatial management. However, they
are less clear relative to optimal hook type. On one hand,
increased gut hooking is expected from capture on J hooks                                   FUNDING
(Epperly et al., 2012; Gilman et al., 2016), where gut and foul
hooking were associated with significantly higher post-release                              Tagging in Canadian waters was done in collaboration with the
mortality for both species. However, shortfin mako exhibited                                Nova Scotia Swordfish Association, Atlantic Shark Association,
longer recovery times following release when caught on circle as                            Javitech Atlantic Ltd., and Karlsen Shipping Company Ltd., with
opposed to J hooks, possibly because circle hooks are harder                                funding provided under the International Governance Strategy
to remove (Cooke and Suski, 2004) or may not be expelled                                    of Fisheries and Oceans, Canada. Tagging on Portuguese vessels
from the jaw as quickly (Poisson et al., 2019). Such apparently                             was carried out by onboard observers under the PNAB/EU-
contradictory results underscore the multi-facetted nature of                               DCF (National Program for Biological Sampling, integrated
bycatch mitigation, where it is often unclear if benefits relative                          in the EU Data Collection Framework), with additional tags
to one component of the capture process are outweighed by                                   coming from Project SAFEWATERS (Ref: EU/MARE/2012/21)
detriments to another (Reinhardt et al., 2017). Ultimately, taking                          and Project MAKO-WIDE (Ref: FAPESP/19740/2014), funded
a holistic approach to bycatch mitigation is necessary, particularly                        by FCT, the Portuguese Science and Technology Foundation.
to make any trade-offs explicit in the overall management                                   Tagging by Ifremer (France) was done during a scientific
approach (Gilman et al., 2019).                                                             survey in collaboration with the regional professional fishing
                                                                                            organization of Pays de Loire and funded by the European Union.
                                                                                            Deployments by ICCAT were funded by the European Union
DATA AVAILABILITY STATEMENT                                                                 (EU Grant Agreements—Strengthening the scientific basis for
                                                                                            decision-making in ICCAT) and by the Commission as part of
The original contributions presented in the study are included                              the ICCAT regular budget. C. C. Santos is supported by a FCT
in the article/Supplementary Material, further inquiries can be                             Doctoral grant (Ref: SFRH/BD/139187/2018).
directed to the corresponding author/s.

                                                                                            SUPPLEMENTARY MATERIAL
ETHICS STATEMENT
                                                                                            The Supplementary Material for this article can be found
The animal study was reviewed and approved by Fisheries and                                 online at: https://www.frontiersin.org/articles/10.3389/fmars.
Oceans regional Animal Care Committee.                                                      2021.619190/full#supplementary-material

REFERENCES                                                                                  Benoît, H. P., Hurlbut, T., Chassé, J., and Jonsen, I. D. (2012). Estimating fishery-
                                                                                               scale rates of discard mortality using conditional reasoning. Fish. Res. 125,
ANON (2019). Report of the 2019 shortfin mako shark stock assessment update                    318–330. doi: 10.1016/j.fishres.2011.12.004
   meeting (Madrid, Spain, 20-24 May 2019). ICCAT Col. Vol. Sci. Pap. 76, 1–77.             Benoît, H. P., Kneebone, J., Tracey, S., Golet, W., and Bernal, D. (2020a).
ANON (2020). Report of the 2020 Porbeagle shark stock assessment meeting                       Distinguishing discard mortality from natural mortality in field experiments
   (online, June 15-22). ICCAT Col. Vol. Sci. Pap. [Epub ahead of print]. (accessed            based on electronic tagging. Fish. Res. 230:105642. doi: 10.1016/j.fishres.2020.
   March 24, 2021).                                                                            105642
Au, D. W., Smith, S. E., and Show, C. (2015). New abbreviated calculation for               Benoît, H. P., Morfin, M., and Capizzano, C. W. (2020b). Improved estimation
   measuring intrinsic rebound potential in exploited fish populations – example               of discard mortality rates with in situ experiments involving electronic and
   for sharks. Can. J. Fish. Aquat. Sci. 72, 767–773. doi: 10.1139/cjfas-20140360              traditional tagging. Fish. Res. 221:105398. doi: 10.1016/j.fishres.2019.105398
Bender, R., Augustin, T., and Blettner, M. (2005). Generating survival times to             Biais, G., Coupeau, Y., Séret, B., Calmettes, B., Lopez, R., Hetherington, S., et al.
   simulate cox proportional hazard models. Stat. Med. 24, 1713–1723. doi: 10.                 (2017). Return migration patterns of porbeagle shark (Lamna nasus) in the
   1002/sim.2059                                                                               Northeast Atlantic: implications for stock range and structure. ICES J. Mar. Sci.
Benoît, H. P., Capizzano, C. W., Knotek, R. J., Rudders, R. B., Sulikowski, J. A.,             74, 1268–1276. doi: 10.1093/icesjms/fsw233
   Dean, M. J., et al. (2015). A generalized model for longitudinal short- and long-        Bowlby, H. D., and Gibson, A. J. F. (2020). Implications of life history uncertainty
   term mortality data for commercial fishery discards and recreational fishery                when evaluating status in the Northwest Atlantic population of white shark
   catch-and-releases. ICES J. Mar. Sci. 72, 1834–1847. doi: 10.1093/icesjms/fsv039            (Carcharodon carcharias). Ecol. Evol. 10, 4990–5000. doi: 10.1002/ece3.6252

Frontiers in Marine Science | www.frontiersin.org                                      12                                                April 2021 | Volume 8 | Article 619190
Bowlby et al. Estimating M, PRM, and Covariates
Bowlby, H. D., Joyce, W., Benoît, H. P., and Sulikowski, J. (2019). Evaluation Harry, A. V. (2018). Evidence for systemic age underestimation in shark and ray
of post-release mortality for porbeagle and shortfin mako sharks from the ageing studies. Fish Fish. 19, 185–200. doi: 10.1111/ FAF.12243
Canadian pelagic longline fishery. ICCAT Col. Vol. Sci. Pap. 76, 365–373. Hazen, E. L., Maxwell, S. M., Bailey, H., Bograd, S. J., Hamann, M., and Gaspar, P.
Bullock, R., Guttridge, T., Cowx, I., Elliott, M., and Gruber, S. (2015). The (2012). Ontogeny in marine tagging and tracking science: technologies and data
behaviour and recovery of juvenile lemon sharks Negaprion brevirostris in gaps. Mar. Ecol. Prog. Ser. 457, 221–240. doi: 10.3354/meps09857
response to external accelerometer tag attachment. J. Fish Biol. 87, 1342–1354. Hewitt, D. A., and Hoenig, J. M. (2005). Comparison Of Two Approaches For
doi: 10.1111/jfb.12808 Estimating Natural Mortality Based On Longevity. VIMS Articles. 566. Available
Campana, S. E., Joyce, W., Fowler, M., and Showell, M. (2016). Discards, hooking, online at: https://scholarworks.wm.edu/vimsarticles/566 (accessed March 24,
and post-release mortality of porbeagle (Lamna nasus), shortfin mako (Isurus 2021).
oxyrinchus), and blue shark (Prionace glauca) in the Canadian pelagic longline Hoolihan, J. P., Luo, J., Abascal, F. J., Campana, S. E., De Metrio, G., Deway,
fishery. ICES J. Mar. Sci. 73, 520–528. doi: 10.1093/icesjms/fsv234 H., et al. (2011). Evaluating post-release behavior modification in large pelagic
Campana, S. E., Joyce, W., and Manning, M. J. (2009). Bycatch and discard fish deployed with pop-up satellite archival tags. ICES J. Mar. Sci. 68, 880–889.
mortality in commercially caught blue sharks Prionace glauca assessed using doi: 10.1093/icesjms/fsr024
archival satellite popup tags. Mar. Ecol. Prog. Ser. 387, 241–253. doi: 10.3354/ Hutchinson, M. R., Itano, D. G., Muir, J. A., and Holland, K. N. (2015). Post-release
meps08109 survival of juvenile silky sharks captured in a tropical tuna purse seine fishery.
Campana, S. E., Natanson, L. J., and Myklevoll, S. (2002). Bomb dating and age Mar. Ecol. Prog. Ser. 521, 143–154. doi: 10.3354/meps11073
determination of large pelagic sharks. Can. J. Fish. Aquat. Sci. 59, 450–455. Jepsen, N., Thorstad, E. B., Havn, T., and Lucas, M. C. (2015). The use of external
doi: 10.1139/F02-027 electronic tags on fish: an evaluation of tag retention and tagging effects. Anim.
Coelho, R., Domingo, A., Courtney, D., Cortés, E., Arocha, F., Liu, K.-M., et al. Biotelem. 3:49. doi: 10.1186/s40317-015-0086-z
(2018). An updated revision of shortfin mako size distributions in the Atlantic. Jerome, J., Gallagher, A., Cooke, S., and Hammerschlag, N. (2018). Integrating
Collect. Vol. Sci. Pap. ICCAT 75, 476–492. reflexes with physiological measures to evaluate coastal shark stress response
Cooke, S. J., and Suski, C. D. (2004). Are circle hooks an effective tool for to capture. ICES J. Mar. Sci. 75, 796–804. doi: 10.1093/icesjms/fsx191
conserving marine and freshwater recreational catch-and-release fisheries? Kenchington, T. J. (2014). Natural mortality estimators for information-limited
Aquat. Conserv. Mar. Freshw. Ecosyst. 14, 299–326. doi: 10.1002/aqc.614 fisheries. Fish Fish. 15, 533–562. doi: 10.1111/faf.12027
Cortés, E. (1998). Demographic analysis as an aid in shark stock assessment and Kneebone, J., Benoît, H. P., Bernal, D., and Golet, W. (2020). Application of
management. Fish. Res. 39, 199–208. doi: 10.1016/s0165-7836(98)00183-0 a parametric survival model to understand capture-related mortality and
Cortés, E. (2002). Incorporating uncertainty into demographic modeling: predation of yellowfin tuna (Thunnus albacares) released in a recreational
application to shark population and their conservation. Conserv. Biol. 16, fishery. Can. J. Fish. Aquat. Sci. (in press). doi: 10.1139/cjfas-2020-0266
1048–1062. doi: 10.1046/J.1523-1739.2002.00423.X Lewison, R. L., Crowder, L. B., Read, A. J., and Freeman, S. A. (2004).
Cortés, E. (2016). Perspectives on the intrinsic rate of population growth. Methods Understanding impacts of fisheries bycatch on marine megafauna. Trends Ecol.
Ecol. Evol. 7, 1136–1145. doi: 10.1111/2041-210X.12592 Evol. 19, 598–604. doi: 10.1016/j.tree.2004.09.004
Cox, D. R. (1972). Regression models and life tables. J. R. Stat. Soc. 34, 187–200. Marçalo, A., Guerreiro, P. M., Bentes, L., Rangel, M., Monteiro, P., Oliveira, F.,
Cox, D. R., and Oakes, D. (1984). Analysis of Survival Data. London: Chapman and et al. (2018). Effects of different slipping methods on the mortality of sardine,
Hall Ltd. Sardina pilchardus, after purse-seine capture off the Portuguese Southern coast
Davis, M. W. (2002). Key principles for understanding fish bycatch discard (Algarve). PLoS One 13:e0195433. doi: 10.1371/journal.pone.0195433
mortality. Can. J. Fish. Aquat. Sci. 59, 1834–1843. doi: 10.1139/F02-139 Miller, P., Santos, C. C., Carlson, J., Natanson, N., Cortés, E., Mas, F., et al. (2020).
Dulvy, N. K., Fowler, S. L., Musick, J. A., Cavanagh, R. D., Kyne, P. M., Harrison, Updates on post-release mortality of shortfin mako in the Atlantic using satellite
L. R., et al. (2014). Extinction risk and conservation of the world’s sharks and telemetry. SCRS/2019/096. Collect. Vol. Sci. Pap. ICCAT 76, 298–315.
rays. eLife 3, 1–34. doi: 10.7554/eLife.00590 Molina, J. M., and Cooke, S. J. (2012). Trends in shark bycatch research: current
Ellis, J. R., McCully, S. R., and Poisson, F. (2017). A review of capture and post- status and research needs. Rev. Fish Biol. Fish. 22, 719–737. doi: 10.1007/s11160-
release mortality of elasmobranchs. J. Fish Biol. 90, 653–722. doi: 10.1111/jfb. 012-9269-3
13197 Musyl, M. K., Domeier, M. L., Nasby-Lucas, N., Brill, R. W., McNaughton, L. M.,
Epperly, S. P., Watson, J. W., Foster, D. G., and Shah, A. K. (2012). Anatomical Swimmer, J. Y., et al. (2011). Performance of pop-up satellite archival tags. Mar.
hooking location and condition of animals captured with pelagic longlines: the Ecol. Prog. Ser. 433, 1–28. doi: 10.3354/meps09202
grand banks experiments 2002-2003. Bull. Mar. Sci. 88, 513–527. doi: 10.5343/ Musyl, M. K., and Gilman, E. L. (2019). Meta-analysis of post-release fishing
bms.2011.1083 mortality in apex predatory pelagic sharks and white marlin. Fish Fish. 20,
García, V. B., Lucifora, L. O., and Myers, R. A. (2008). The importance of habitat 466–500. doi: 10.1111/faf.12358
and life history to extinction risk in sharks, skates, rays and chimaeras. Proc. R. Musyl, M. K., Moyes, C. D., Brill, R. W., and Fragoso, N. (2009). Factors influencing
Soc. B. 275, 83–89. doi: 10.1098/rspb.2007.1295 mortality estimates in post-release survival studies. Mar. Ecol. Prog. Ser. 396,
Gedamke, T., Hoenig, J. M., Musick, J. A., DuPaul, W. D., and Gruber, S. H. 157–159. doi: 10.3354/meps08432
(2007). Using demographic models to determine intrinsic rate of increase Musyl, M. K., Moyes, C. D., Brill, R. W., Mourato, B. L., West, A., McNaughton,
and sustainable fishing for elasmobranchs: pitfalls, advances and applications. L. M., et al. (2015). Postrelease mortality in istiophorid billfish. Can. J. Fish.
N. Am. J. Fish. Manage. 27, 605–618. doi: 10.1577/M05-157.1 Aquat. Sci. 72, 1–19. doi: 10.1002/9780470935095.ch2
Gilman, E., Chaloupka, M., Dagorn, L., Hall, M., Hobday, A., Musyl, M., et al. Natanson, L. J., Kohler, N. E., Ardizzone, D., Cailliet, G. M., Wintner, S. P., and
(2019). Robbing Peter to pay Paul: replacing unintended cross-taxa conflicts Mollet, H. F. (2006). Validated age and growth estimates for the shortfin mako,
with intentional tradeoffs by moving from piecemeal to integrated fisheries Isurus oxyrinchus, in the North Atlantic Ocean. Environ. Biol. Fish. 77, 367–383.
bycatch management. Rev. Fish. Biol. Fish. 29, 93–123. doi: 10.1007/s11160- doi: 10.1007/978-1-4020-5570-6_16
019-09547-1 Natanson, L. J., Mello, J. J., and Campana, S. E. (2002). Validated age and growth of
Gilman, E., Chaloupka, M., Swimmer, Y., and Piovano, S. (2016). A cross-taxa the porbeagle shark (Lamna nasus) in the western North Atlantic Ocean. Fish
assessment of pelagic longline by-catch mitigation measures: conflicts and Bull. 100, 266–278.
mutual benefits to elasmobranchs. Fish Fish. 17, 748–784. doi: 10.1111/faf.12143 Natanson, L. J., Skomal, G. B., Hoffmann, S. L., Porter, M. E., Goldman, K. J., and
Hammerschlag, N., and Sulikowski, J. (2011). Killing for conservation: the need for Serra, D. (2018). Age and growth of sharks: do vertebral band pairs record age?
alternatives to lethal sampling of apex predatory sharks. Endanger. Species Res. Mar. Freshwater Res. 69, 1440–1452. doi: 10.1071/MF17279
14, 135–140. doi: 10.3354/esr00354 Natanson, L. J., Winton, M., Bowlby, H. D., Joyce, W., Deacy, B., Coelho, R.,
Harcourt, R., Sequeira, A. M. M., Zhang, X., Roquet, F., Komatsu, K., Heupel, M., et al. (2020). Updated reproductive parameters for the shortfin mako (Isurus
et al. (2019). Animal-borne telemetry : an integral component of the ocean oxyrinchus) in the North Atlantic Ocean with inferences of distribution by sex
observing toolkit. Front. Mar. Sci. 6:326. doi: 10.3389/fmars.2019.00326 and reproductive stage. Fish Bull. 118, 21–36. doi: 10.7755/FB.118.1.3
Frontiers in Marine Science | www.frontiersin.org 13 April 2021 | Volume 8 | Article 619190You can also read