Neapolitan volcanic area Tide Gauge Network (Southern Italy): Ground Displacements and Sea-Level Oscillations - ADGEO
←
→
Page content transcription
If your browser does not render page correctly, please read the page content below
Adv. Geosci., 52, 105–118, 2021
https://doi.org/10.5194/adgeo-52-105-2021
© Author(s) 2021. This work is distributed under
the Creative Commons Attribution 4.0 License.

Neapolitan volcanic area Tide Gauge Network (Southern Italy):
Ground Displacements and Sea-Level Oscillations
Umberto Tammaro1 , Francesco Obrizzo1 , Umberto Riccardi2,4 , Adriano La Rocca1 , Salvatore Pinto1 ,
Giuseppe Brandi1 , Enrico Vertechi1 , and Paolo Capuano3
1 Istituto
         Nazionale di Geofisica e Vulcanologia, Osservatorio Vesuviano, via Diocleziano 328, Napoli, Italy
2 Dipartimentodi Scienze della Terra, dell’ambiente e delle Risorse (DiSTAR),
University “Federico II” of Naples, Napoli, Italy
3 Department of Physics “E.R. Caianiello”, University of Salerno, Fisciano, Salerno, Italy
4 Research Group “Geodesia”, Universidad Complutense de Madrid, 28040 Madrid, Spain

Correspondence: Umberto Tammaro (umberto.tammaro@ingv.it)

Received: 28 May 2020 – Revised: 12 November 2020 – Accepted: 17 November 2020 – Published: 2 February 2021

Abstract. In this study, we investigate the oscillations of rel-   the Gulfs of Napoli and Pozzuoli (southern Italy), respec-
ative sea level through the analysis of tide gauge records         tively.
about 10-year long collected in the Gulfs of Pozzuoli and             Somma-Vesuvius is a strato-volcano located east of
Napoli (Southern Italy). The main goal of this study is to         Naples. It is composed of an older edifice Mt. Somma trun-
provide a suitable resolution model of the sea tides including     cated by a summit caldera, and a more recent cone, called
low frequency (seiches), tidal bands and non-linear tides. The     Vesuvius, grown within the caldera. It covers an area of
spectral analyses of the tide gauge records lead us to iden-       165 km2 (Principe et al., 1987). Nearly 600 thousand peo-
tify a number of seiche periods some of them already known         ple live on its slopes and surroundings. Therefore, Somma-
from the literature and some other unknown. Furthermore,           Vesuvius may be considered a relatively small volcano with
we target a non-conventional purpose of the tidal analysis,        an associated high level of risk (Auger et al., 2001). Since the
namely extracting from the tide gauge records the volcano-         last eruption, occurred in March 1944, the Somma-Vesuvius
tectonic signal (vertical ground displacement) in the resur-       volcano is in a quiescent phase. Hundreds of low energy
gent Campi Flegrei caldera. We suggest a method to filter          earthquakes per year, land subsidence (Pingue et al., 2013;
out the volcano-tectonic signal (bradyseism) from the tide         Tammaro et al., 2013) and low temperature fumaroles char-
gauge records by deconvolving it from two records, one col-        acterize its activity. The largest earthquake (Md = 3.6) was
lected in the active volcanic area (Pozzuoli) and the other one    recorded in October 1999 (Del Pezzo et al., 2004; De Na-
collected in a tectonically stable station (Napoli), located be-   tale et al., 2004; Galluzzo et al., 2004; Cubellis et al., 2007).
yond the caldera rim. Finally, we retrieve the relative mean       Campi Flegrei caldera (CFc) consists of a continental and
sea level change in the Gulf of Naples and compare it with         submerged part. It formed during two major caldera collapses
the trend found in five tide gauges spread along the Italian       related to the eruptions of the Campanian Ignimbrite (39 ka,
coast.                                                             Fedele et al., 2003; Marianelli et al., 2006) and the Neapoli-
                                                                   tan Yellow Tuff (15 ka, Deino et al., 2004), respectively (Orsi
                                                                   et al., 1996). The CFc last eruption, occurred in 1538, and
                                                                   gave rise to Mt. Nuovo. With more than 300 000 people liv-
                                                                   ing within the caldera, the volcanic risk at CF is consid-
1   Introduction                                                   ered to be substantial (Bevilacqua et al., 2015). CFc is one
                                                                   of the most interesting examples of resurgent caldera, it is
Neapolitan volcanic district is among the areas with the high-     renowned worldwide for bradyseism phenomenon (literally
est volcanic risk due to the intense urbanization. Two volca-      “slow seism”, from Greek), a slow ground uplift/subsidence
noes, Somma-Vesuvius and Campi Flegrei caldera, overlook

Published by Copernicus Publications on behalf of the European Geosciences Union.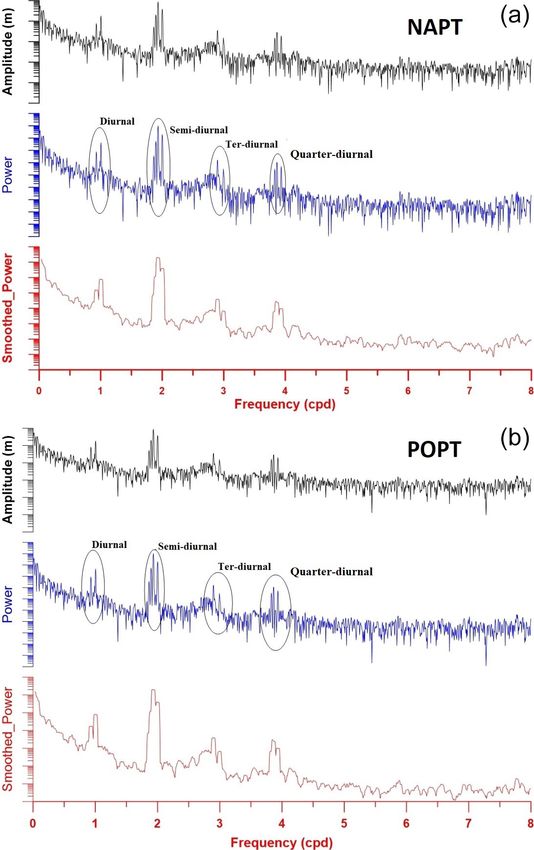
106 U. Tammaro et al.: Neapolitan volcanic area Tide Gauge Network
movement which characterises the dynamics of several vol- gauge sensor and data taker system was installed in all the
canic areas and was firstly recognised and studied at this sites. This system (sampling rate ranging 1–5 min) is able to
caldera (e.g. Amoruso et al., 2014; Capuano et al., 2013; De allow a local data management and a quasi-real time GSM
Martino et al., 2014; Macedonio et al., 2014; Petrillo et al., transmission to the acquisition centre located at Osservatorio
2013; Romano et al., 2012, 2018; Trasatti et al., 2015; Troise Vesuviano headquarter. The headquarter assures the display
et al., 2019). In recent times CFc has been affected by intense of the collected data, checking for the functionality of the
episodes of uplift (Barberi et al., 1984; Rosi and Sbrana, acquisition systems and a first and draft data analysis. The
1987; Isaia et al., 2009). The last two largest uplift episodes quality control relies on detecting and, if possible, correct-
occurred from 1969 to 1972 and from mid-1982 to Decem- ing tares, in order to minimise the related loss of informa-
ber 1984 with net uplifts, in the Pozzuoli town, of about 1.7 tion. “Good quality research depends on good quality data
and 1.8 m respectively (Corrado et al., 1977; Berrino et al., and good quality data depends on good quality control meth-
1984; Luongo et al., 1991; Berrino, 1998). During 1982– ods” (SeaDataNet, Data Quality Control Procedures, 2010).
1984 uplift episode more than 15 000 earthquake occurred In particular, the following key points are checked: timing
with magnitude between 0.4 and 4.2. (agreement between data and recording date), outlier detec-
In March 1970, during the bradyseismic crisis of 1969– tion, gap filling, de-spiking, and drift control.
1972, the first systematic observation of the sea level in the Bearing in mind that a TG is not able to distinguish be-
Gulf of Pozzuoli began with the aim of assessing the verti- tween sea level variations and the relative movement of the
cal movements of the ground. Four stations were installed, TG (subsidence or lifting of the ground), each station is con-
constituting the starting point of the current Neapolitan Tide nected to the levelling network. Periodically, the differences
Gauge Network (NTGN), operated by Osservatorio Vesu- in height between the benchmark closest to the TG and those
viano (OV), which is a branch of the Istituto Nazionale di of the levelling network are measured with a high-precision
Geofisica e Vulcanologia (INGV). geodetic levelling. Since October 2015, the station called
The main goal of this paper, beyond the study of the NAMM, replacing NAPT, has become the reference station.
ground displacements, is to characterize the tidal response of However, throughout the paper we will always refer to the
the two basins, Gulf of Napoli and Gulf of Pozzuoli, through NAPT station, meaning that until September 2015 we have
a spectral analysis of the tide gauge records to extract both used the data of the NAPT tide gauge and from October 2015
the main tidal components and seiches at each station of those of the NAMM station. As NAPT, it is located in the har-
the network. Moreover, despite the shortness of the available bour of Napoli and it is the first TG co-located with a perma-
time series, the relative mean sea level in both the Gulfs is nent GNSS station. It is well known that a GNSS permanent
eventually estimated. station can be used to measure the 3D motion of land points
The paper is organized as follows. The Sect. 2 illustrates in WGS84 coordinate system. This is a useful approach to
the evolution of the Neapolitan Tide Gauge network, since distinguish between relative and absolute sea level change:
its birth up to now. In Sect. 3, we briefly describe the data if a trend of land subsidence is measured by GNSS stations,
set and the data analysis method. Section 4 shows harmonic this can be subtracted from the relative sea level variation
tidal and non-tidal analysis. Section 5 reports on the attempt turning out an estimate of “absolute” sea level change. In
to retrieve the volcano tectonic signal from the tide gauge fact, according to Wöppelmann and Marcos (2016), while
record, while Sect. 6 deals with the assessment of the relative tide gauges can provide an estimate for the rate of relative
mean sea level change. The Sect. 7 contains the conclusions. sea level change (S) with respect to the nearby land repre-
sented by the grounded tide gauge benchmarks, the rate of
geocentric vertical land motion (U ) of these benchmarks can
2 Neapolitan Tide Gauge Network be estimated using GNSS. Hence, a basic expression for the
absolute (geocentric) sea level change (N) is the following
In March 1970, in the Gulf of Pozzuoli, a permanent tide U + S = N.
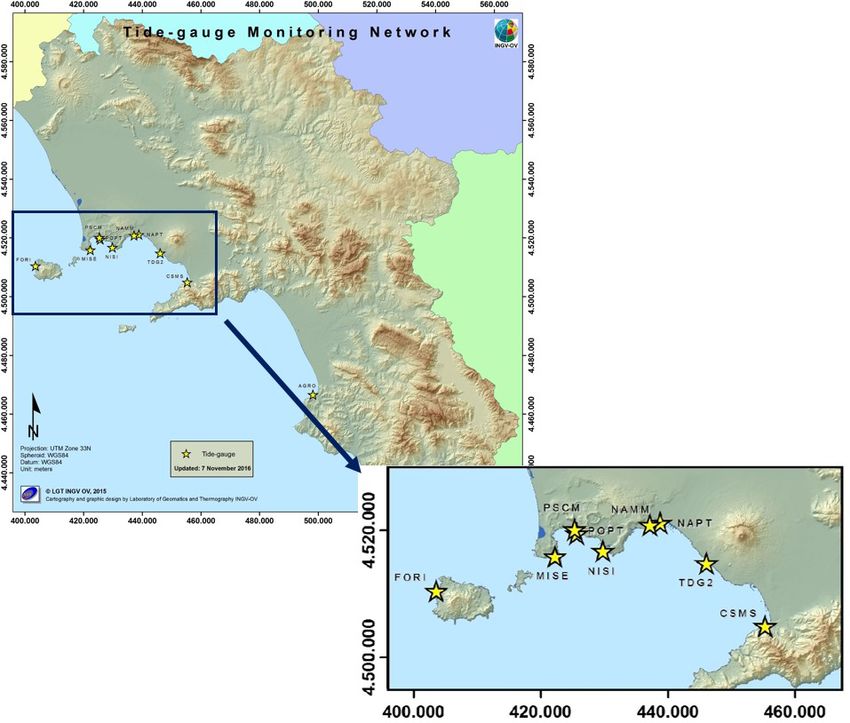
gauge (TG) network consisting of four stations (Miseno, NTGN records water-level oscillations at ten sites (Table 1
Pozzuoli harbour, Pozzuoli Ansaldo and Nisida) was set up and Fig. 1), four stations are located in the Gulf of Napoli
(Corrado et al., 1977), “as part of the geophysical surveil- (NAMM, NAPT, TRDG, CSMS), 4 in the Gulf of Pozzuoli
lance system promoted by Ministry of Public works and (POPT, NISI, MISE, PSCM), one at Ischia island (FORI) and
Italian National Research Council” (Corrado and Luongo, one in the Gulf of Salerno (AGRO).
1981). The Tide Gauge Network was completely modernised
starting from 2002, when the gauges were converted from
analogue to digital with automatic and remote data transfer to 3 Data set and Methodology
the observatory acquisition centre. Until then the tide gauge
stations were equipped with mechanical sensors based on a A database encompassing over 19 years have been orga-
floating body system and a local recording on a hardcopy he- nized and validated using, where necessary, statistical gap
licorder. Starting in October 2002, a completely new digital filling technique. We investigate the oscillations of relative
Adv. Geosci., 52, 105–118, 2021 https://doi.org/10.5194/adgeo-52-105-2021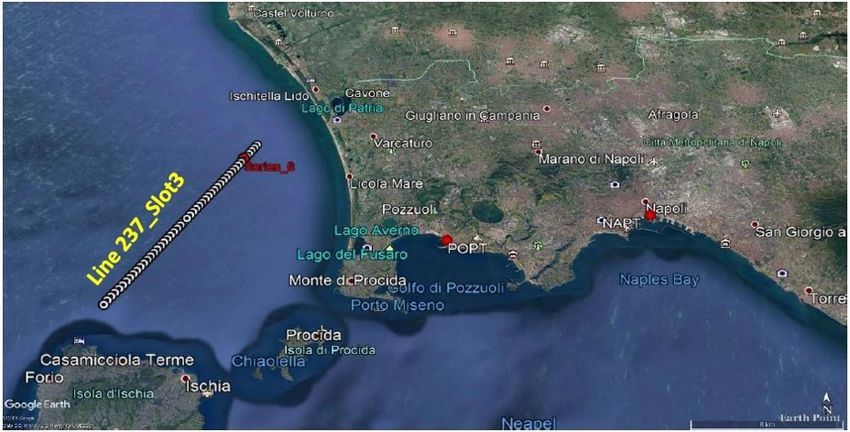
U. Tammaro et al.: Neapolitan volcanic area Tide Gauge Network                                                                  107

Table 1. NTGN network stations.

                    Name     Coordinates      Location       Name    Coordinates      Location
                    NAPT     40◦ 500 2800 N   Napoli         FORI    40◦ 440 2300 N   Forio
                             14◦ 160 1100 E   (Harbour)              13◦ 510 2800 E   (Harbour)
                    NISI     40◦ 470 5800 N   Nisida         TDG2    40◦ 460 5900 N   Torre del Greco
                             14◦ 100 0400 E   (Harbour)              14◦ 210 4100 E   (Harbour)
                    POPT     40◦ 490 2400 N   Pozzuoli       CSMS    40◦ 410 2800 N   Castellammare di Stabia
                             14◦ 070 0600 E   (Harbour)              14◦ 280 2700 E   (Harbour)
                    PSCM     40◦ 490 4500 N   Pozzuoli       AGRO    40◦ 210 1200 N   Agropoli
                             14◦ 060 5300 E   (South Pier)           14◦ 580 4200 E   (Harbour)
                    MISE     40◦ 470 2600 N   Miseno         NAMM    40◦ 500 1100 N   Napoli
                             14◦ 040 4200 E   (Harbour)              14◦ 150 1700 E   (San Vincenzo Pier)
                              Recording and Transmission             Recording sensor: shaft encoder thalimedes
                                                                     Trasmission via GSM, Sampling rate: 1 min

sea level collected at the tide gauges located in Gulf of Poz-      sea level, that generally are analysed in linear (e.g. Munk
zuoli (POPT, MISE, NISI, PSCM) and Napoli (NAPT and                 and Cartwright, 1966) and non-linear (e.g. Capuano et al.,
TDG2) spanning May 1999–December 2018 time interval                 2011) frameworks. Continental blocks motion and melting
(Fig. 2). In other words, we study the oscillations of the          of icecaps can cause, at lower frequency, apparent changes
heights of sea level expressed with respect to an arbitrary and     of the sea level. In active volcanic areas near to the coastline,
local datum, hence relative to the land upon which the tide         local apparent changes of sea level can be due to uplift or
gauge is grounded. Furthermore, we consider the GNSS data           subsidence associate with volcano dynamics, being therefore
of the permanent station called RITE to compare the ground          an important indicator for the surveillance system. Gravita-
displacement measured by it with that detected by the tide          tional forces in the Earth-Moon-Sun system cause the rhyth-
gauge.                                                              mic rising and lowering of ocean waters resulting in Tide
   To achieve this purpose, we use the classical harmonic           Waves (Melchior, 1978). Because of its much closer position
analysis, which models the tidal signal as sum of sinusoids         to the Earth, the Moon exerts more than twice a larger force
at specific frequencies connected to astronomical parameters        than the tides as the Sun. Hence, the tide closely follows the
(Fig. 3). We perform the harmonic analysis on yearly time           moon during its rotation around the earth, creating mainly
series, with temporal sampling of 1 h, using T -Tide code           diurnal and semi-diurnal tide and ebb cycles at any particu-
(Pawlowicz et al., 2002). If the focus in the least-squares ad-     lar ocean surface. The amplitude or height of the tide wave
justment is on tidal frequencies, there is no strong argument       is very small in the open ocean (several centimetres), but,
to introducing shorter sampling intervals than 1 h to tidal and     due to the principle of conservation of the momentum, it dra-
related observations. T -Tide is a package of routines devoted      matically increases when reaching continental shelves along
to classical harmonic analysis with nodal corrections, infer-       a coastline. Tidal analysis of data collected by gauges has
ence, and a variety of user specified options. In this study, we    conventionally two purposes. First, predicting tides at future
consider only the seven major tidal constituents, four main         times as a valuable aid for shipping and harbour operations.
semidiurnal (M2, S2, N2, K2) and three diurnal (K1, O1,             Secondly, mapping and interpreting results in terms of the
P1). The Rayleigh criterion for resolution limit, of length N       hydrodynamics of the seas and their responses to tidal forc-
time series, sampled at 1t, α(N 1t)−1 (with default α = 1)          ing. Here we target a third non-conventional purpose, namely
demands a time series length of 182.6 d for the separation of       extracting from the tide gauge records the volcano-tectonic
P1 and K1 as well as S2 and K2 frequencies, therefore, the          signal (vertical ground displacement). Hence, in our study
duration of the records of this data set is suitable to resolve     precise tidal analyses solely aim at a suitable modelling of
the seven main tidal components.                                    local tides, alternatively referable as synthetic tide to be re-
                                                                    duced in the collected gauge records and hence allow to ex-
                                                                    tract ground displacement of volcanic origin.
4   Harmonic Tidal and Non-tidal Analysis                              Six month span of sea level data, recorded with a sampling
                                                                    rate of 60 s at NAPT and POPT tide gauges, was subject
Tides and interaction between atmosphere and ocean (e.g.,           to spectral analysis to assess the sources of harmonic load-
atmospheric pressure fluctuation, wind, oceanic currents,           ing to the sea floor. The two stations in the Bay of Napoli
basins shape and bathymetry) can cause time variations of

https://doi.org/10.5194/adgeo-52-105-2021                                                         Adv. Geosci., 52, 105–118, 2021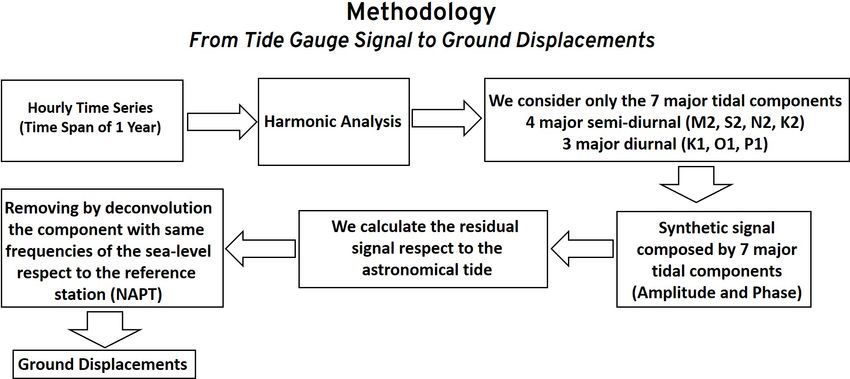
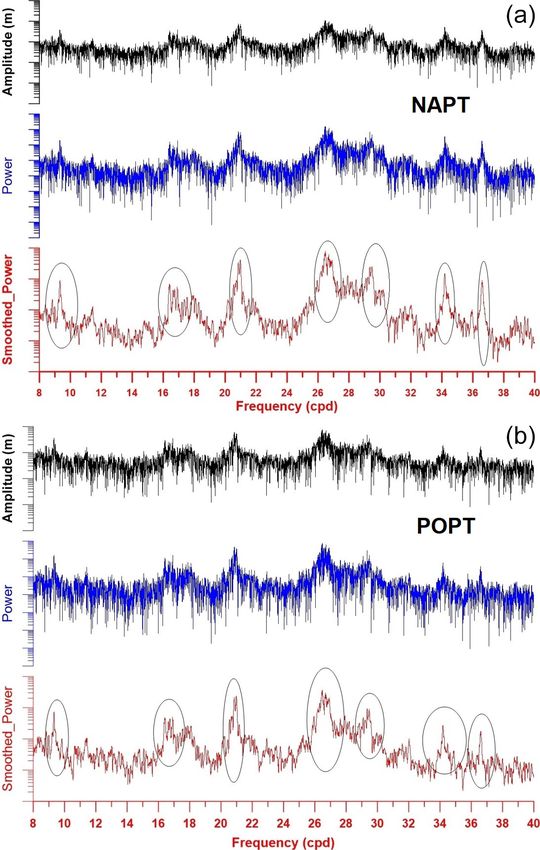
108                                                       U. Tammaro et al.: Neapolitan volcanic area Tide Gauge Network

Figure 1. Neapolitan Tide Gauge Network (NTGN) managed by Osservatorio Vesuviano, branch of INGV. For clarity, we do not show the
GNNS station called RITE, because it is very close to POPT tide gauge. The map was created by the INGV-OV Laboratory of Geomatics
and Thermography, © LGT INGV OV, 2015.

and Pozzuoli are able to record a rich spectrum of tides           period. The semi-diurnal (2 cycles per day, cpd) band hosts
and harmonic resonances of the sea surface (seiches). Other        the largest tidal forcing near Pozzuoli and Napoli. Its ampli-
than tidal signal, the observed spectra reflect the micro-tidal    tude is 5 times larger than diurnal and 10 times larger than
regime and waves, the latter dominated by a cyclonic cir-          ter-diurnal (3 cpd) and quarter-diurnal (4 cpd) harmonics.
culation dependent on both barometric fields and the ther-         Moreover, at the frequency around 2 cpd sea level oscilla-
mohaline currents. It is renowned that from interaction be-        tions are nearly identical at the POPT and NAPT tide gauges.
tween wind and sea in enclosed and/or semi-enclosed basin,         The amplitudes and phases of the main diurnal and semi-
a peculiar wave, called “seiche”, can rise. Seiches are typi-      diurnal tidal waves for NAPT and POPT are compared in Ta-
cally caused when strong winds and rapid changes in atmo-          bles 2 and 3 with the ones predicted by TPXO9_v2a model
spheric pressure push water from one end of a water body to        (Egbert and Erofeeva, 2002). TPXO9 is a barotropic model
the other. When the wind stops, the water rebounds to the          (https://www.tpxo.net/global, last access: 9 April 2020) with
other side of the enclosed area. The water then continues          a resolution of 1/30◦ , equivalent to about 4 km. Model am-
to oscillate back and forth for hours or even days. Seiches        plitudes are retrieved from harmonic analyses carried out
have a typical spectral signature and, at higher frequencies,      with ET34-ANA-v7.3 software (Schüller, 2019; Ducarme
this is strongly depending on the bathymetry and coast-to-sea      and Schüller, 2018) on synthetic signals made available at the
land mask shape. Power spectra (Figs. 4 and 5) show seven          TPXO web service (https://tpxows.azurewebsites.net/, last
tidal components that decay in agreement with decreasing           access: 10 August 2020).

Adv. Geosci., 52, 105–118, 2021                                                    https://doi.org/10.5194/adgeo-52-105-2021
U. Tammaro et al.: Neapolitan volcanic area Tide Gauge Network                                                                      109

Table 2. Observed and predicted by TPX09_v2a model amplitudes of the main seven tidal components for NAPT and POPT.

                                                               Amplitude (mm)
                                   Tidal Wave             NAPT                           POPT
                                                   Observed           TPXO9       Observed           TPXO9
                                   M2            114.7 ± 2.4     117.3 ± 0.2    117.3 ± 1.9     116.9 ± 0.2
                                   S2             42.4 ± 2.7      44.3 ± 0.4     43.1 ± 1.9      44.0 ± 0.3
                                   N2             23.1 ± 2.6      24.8 ± 0.2     23.9 ± 1.8      24.7 ± 0.1
                                   K2             14.9 ± 3.2      12.1 ± 0.2     14.3 ± 1.9      11.9 ± 0.1
                                   O1             10.4 ± 1.4      10.9 ± 0.1     10.6 ± 1.4      11.0 ± 0.1
                                   K1             29.6 ± 1.5      30.1 ± 0.2     28.1 ± 1.5      30.0 ± 0.1
                                   P1              8.3 ± 1.5       9.4 ± 0.1      9.2 ± 1.4       9.4 ± 0.2

Table 3. Observed and predicted by TPXO9_v2a model phases of the main seven tidal components for NAPT and POPT.

                                                            Phase (◦ , GMT)
                              Tidal Wave                 NAPT                                 POPT
                                                 Observed             TPXO9         Observed           TPXO9
                              M2              239.52 ± 4.4      230.96 ± 0.1    237.41 ± 0.77     230.85 ± 0.1
                              S2              259.76 ± 9.2      252.57 ± 0.2    260.16 ± 2.34     252.53 ± 0.3
                              N2             226.86 ± 23.6      219.05 ± 0.6     224.30 ± 3.9     218.90 ± 0.6
                              K2             237.86 ± 24.0      253.41 ± 0.9    245.95 ± 6.81     253.33 ± 0.8
                              O1              116.97 ± 8.7      123.93 ± 1.3     119.38 ± 9.5     123.16 ± 1.2
                              K1              199.97 ± 3.0      192.42 ± 0.4     194.75 ± 3.1     192.01 ± 0.3
                              P1             181.51 ± 10.1      183.01 ± 5.0     196.23 ± 9.7     182.56 ± 4.7

                                                                         waves, so they are characterized by nodes and antinodes. As-
                                                                         suming that inside the gulf there are antinodes, which, being
                                                                         points of maximum amplitude, they make the ratio R devi-
                                                                         ates from the unity.

                                                                                1HPOPT   H(POPT)i − H(POPT)i−1
                                                                         R=            =                                            (1)
                                                                                1HNAPT   H(NAPT)i − H(NAPT)i−1

                                                                         For periods shorter than 40 min some coherences are quietly
                                                                         evident, but the spectral power varies significantly between
                                                                         POPT and NAPT gauges, allegedly indicating short wave-
                                                                         length resonances near harbours (Fig. 7).
                                                                             Previous studies of seiches in the Bay of Napoli have iden-
                                                                         tified two characteristic periods of 5.7 h and 55 min respec-
Figure 2. Consistency of the available data set. Red and blue lines
indicate GNSS and tide gauges stations respectively. For clarity,        tively attributable to the Tyrrenian Sea (Speich and Mosetti,
the time interval covered by the two reference stations, NAPT and        1988). Caloi and Marcelli (1949) have observed periods of
NAMM, is indicated only by name NAPT.                                    58, 48, 22 and 17.8 min. The spectral outcomes lead us to
                                                                         identify the aforementioned seiche periods and numerous
                                                                         other ones.
   Coherent sea level variations occur at eight frequencies for
seiches between 8 cpd (3 h) and 40 cpd (0.6 h). For NAPT                 5     Retrieval of Ground Displacement
and POPT tide gauges, seiche periods at 2.5, 2.1, 1.4, 1.1,
0.9, 0.8, 0.7 h (Fig. 5) show good coherence. But the ratio              A tide gauge record can capture a variety of local and
R (1) between the sea levels recorded at POPT and those                  regional phenomena related to decadal climate variabil-
measured at NAPT tide gauge in about 30 % of cases departs               ity, tides, storm surges, volcano-tectonic driven process,
from unity for more than 10 % (Fig. 6). Seiches are standing             tsunamis, swells, and other coastal processes. When the ex-

https://doi.org/10.5194/adgeo-52-105-2021                                                               Adv. Geosci., 52, 105–118, 2021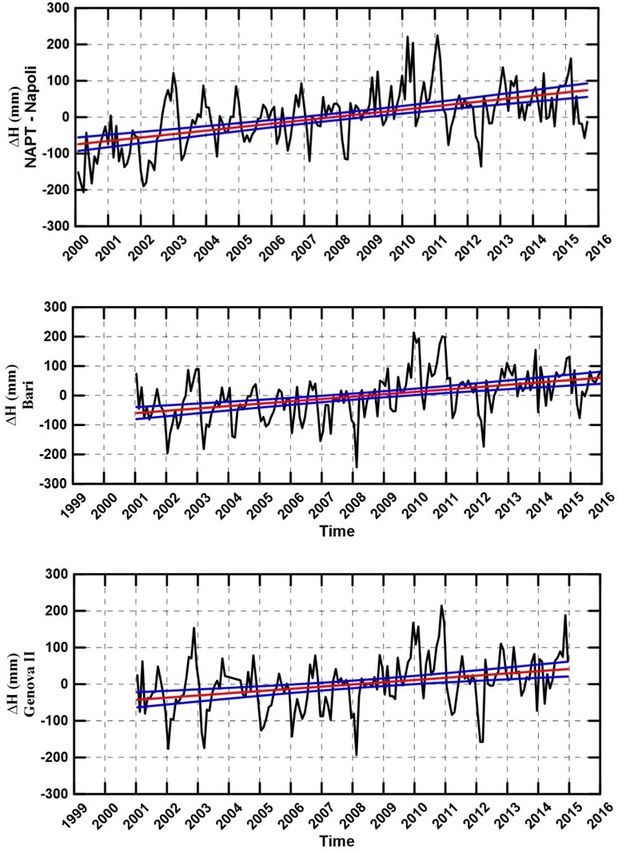
110                                                          U. Tammaro et al.: Neapolitan volcanic area Tide Gauge Network

Figure 3. Flowchart of the methodology used in this paper to retrieve ground displacements from the tide gauge signal.

Figure 4. Amplitude, power and smoothed power spectra in the
range 0–8 cpd. The black ellipses contain the frequency range of
the four tidal species for NAPT (a) and POPT (b) tide gauge sta-       Figure 5. Amplitude, power and smoothed power spectra. The
tion; frequency is expressed in cycle per day (cpd).                   black ellipses contain the frequency range of the seven seiches be-
                                                                       tween 8 and 40 cpd for NAPT (a) and POPT (b) tide gauge station.

Adv. Geosci., 52, 105–118, 2021                                                          https://doi.org/10.5194/adgeo-52-105-2021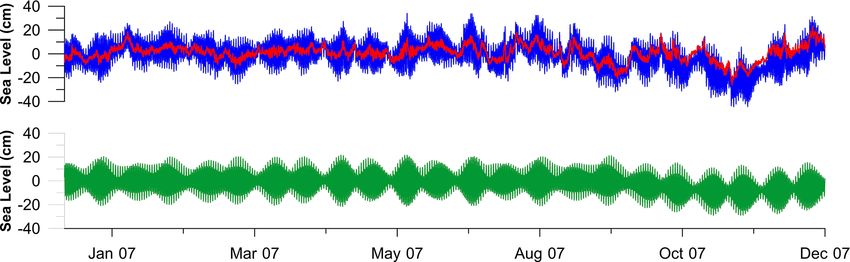
U. Tammaro et al.: Neapolitan volcanic area Tide Gauge Network                                                                           111

                                                                     the relative sea level Sl (t):
                                                                                                            L
                                                                                                            X
                                                                     Sl (t) = Sl (0) + ST(t) + SM (t) +           Sdl θ (tl − t0 ) + ε   (2)
                                                                                                            l=1

                                                                     where, Sl (0) is the relative sea level height at time t0 , ST
                                                                     represent the periodic tidal sea level change due to diurnal
                                                                     and semi-diurnal tides, which is parametrized through the as-
                                                                     sessment of the parameters (amplitude and phase) for the 7
                                                                     main tidal components, SM is the contribution due to meteo-
                                                                     marine signal (e.g., atmospheric pressure fluctuation, wind,
                                                                     oceanic currents, storm surge), Sdl is the ground vertical dis-
                                                                     placement due to volcano-tectonic process at epoch tl , θ is
                                                                     the Heaviside function, ε is the stochastic noise term.
                                                                        As mentioned before, through the harmonic analysis we
                                                                     infer amplitude and phase for the main diurnal and semi-
                                                                     diurnal tide components. Then, we calculate the synthetic
                                                                     tide (Fig. 8) by “relying on” amplitude and phase of the seven
                                                                     components (K1, O1, P1, M2, S2, N2, K2), which are the
                                                                     most relevant around the Neapolitan volcanic area. In princi-
                                                                     ple, the first residual signal, after removing the astronomical
                                                                     tide from the records, should contain information about me-
                                                                     teorological component, eustatic, steric changes, ground de-
                                                                     formation and noise (Eq. 2). In other words, the signal results
Figure 6. Frequency distribution of the R ratio between sea level    from the convolution of many signal components. Therefore,
daily variations at POPT station and NAPT tide gauge. Positive and   under the assumption of very similar meteo-marine condi-
negative values indicate that the signals are in phase or in phase   tions in two gauges few kilometers apart, removing by de-
opposition respectively.                                             convolution the components with same frequencies of the
                                                                     sea-level respect to a reference tide gauge (NAPT) provides
                                                                     the final residual signal. That final residual (Eq. 2) will con-
                                                                     tain the uncorrelated noise (ε), plus hopefully small site-
                                                                     dependent effects and, last but not least, it should allow an
                                                                     estimation of the ground level variation.
                                                                        We suggest a method to filter out the volcano-tectonic sig-
pected magnitude of the target signal (volcano-tectonic pro-
                                                                     nal from tide gauge records. The idea behind this method is
cess) is small and the related geodetic signals are elusive,
                                                                     to extract the target signal (bradyseism) by deconvolving it
extracting ground displacement from tide gauge records,
                                                                     from two records, one collected in the active area (Pozzuoli)
requires a realistic estimate of uncertainties in geodetic
                                                                     and the other in a reference stable station (Napoli).
records. Very accurate observations are needed to enhance
                                                                        As aforementioned, we assume that the volcano-tectonic
the signal to noise ratio in two or more tide gauges to dis-
                                                                     signal is “enwrapped” in POPT residual sea level record
criminate between apparent and effective sea level variation
                                                                     [p(t)], which is composed of two components: (1) a resid-
produced by local ground movements.
                                                                     ual meteo-marine signal being at some extent similar or even
   One can look at tide gauge record as a multi-component
                                                                     equal to the one collected at NAPT station [n(t)] and (2) the
signal resulting from the overlapping of different compo-
                                                                     volcano tectonic vertical ground motion [B(t)].
nents, whose independence often is physically not easy to
fulfill, due to a number of different physical sources working                                 P (ω)
                                                                     B (t) = f (t) − iDFT                                         (3)
with a periodic and/or transient time behavior.                                                N (ω) n
   Each gauge record is made of a deterministic (functional)
                                                                     where, P (ω) and N (ω) are the discrete Fourier transforms
and stochastic part. Accounting for the fact that correla-
                                                                     (DFT) of p(t) and n(t) respectively.
tions between the local ground displacement components
                                                                                                                       P (ω)

are small, then analysis of gauge records can be performed              We first compute the cross-spectrum DFT N(ω)             with
                                                                                                                               n
component by component. Indeed, modelling and extraction             the aim to extract the common mode between Pozzuoli and
of the different components, contributing to the collected           Napoli tide gauges having hopefully meto-marine origin that
record, can be a challenging task. It can be done by means           will be subtracted from the signal in the next step.
of a least-squares fitting independently applied to each site           The last term of the equation represents a deconvolution
through the following conceptual equation, which represents          in the frequency domain, while iDFT is the inverse discrete

https://doi.org/10.5194/adgeo-52-105-2021                                                             Adv. Geosci., 52, 105–118, 2021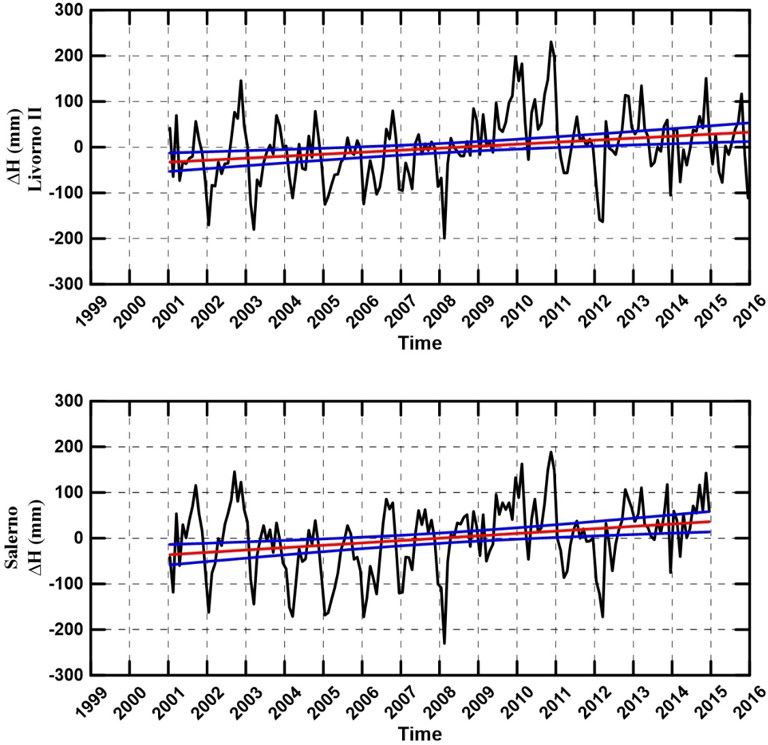
112                                                            U. Tammaro et al.: Neapolitan volcanic area Tide Gauge Network

Figure 7. Spectrum of the smoothed power for POPT and NAPT tide gauges in the frequency range 40–720 cpd.

Figure 8. Example of recording collected during the year 2007 at NAPT tide gauge, located in the port of Naples: recorded sea level change
(blue line), synthetic signal (green line) retrieved from the assessed tidal constants (amplitude and phase) of the seven main components, and
residual signal (red line) with respect to the synthetic one.

Fourier transform to reverse back the signal into time do-
main; the subscript n indicates that the deconvolution ratio
has to be normalized before inversely Fourier transforming
it.
    This fit-remove-deconvolutive approach has been applied
to all the stations in the coastal areas of the CFc.
    The ground deformations, in Neapolitan volcanic area,
are routinely monitored by means of classical technique
(like optical leveling and tiltmetry) and satellite technique
(like GNSS, SAR and InSAR). For this reason, the vertical
ground displacements inferred from the tide gauges are com-
pared with the results of leveling and continuous GNSS data.
For an easier comparison with the weekly solutions from
RITE GNSS permanent station, the POPT deconvolved sig-
nal has been smoothed through a moving average. The re-                  Figure 9. Final tide gauge residual signal (green), namely the
sults (Fig. 9) show that, in the CFc, the final residual tide            ground vertical displacement inferred byfit-remove-deconvolution
gauge signal has a signal-to-noise ratio suitable to detect the          (see text) at Pozzuoli (POPT). The residual signal is compared to
so-called mini-uplift episodes occurred in the last years in             the continuous GNSS data (red line) from RITE, the station closest
                                                                         to the tide gauges. The blue arrows indicate the mini-uplift episode
the caldera. Moreover, the reconstruction of vertical move-
                                                                         at CFc.
ments retrieved from tide gauge matches the deformation
patterns “seen” by the RITE station, the GNSS station closest
to POPT tide gauge. We focus on RITE GNSS site (located                  and 2014). In particular, the well known uplift episode that
in Pozzuoli), because of its key location in the point of the            during 2000 interrupted CFc’s trend of subsidence, which
maximum uplift in the caldera, the most suitable for study-              has been studied by Lanari et al. (2004) using InSAR and
ing ground deformation at Campi Flegrei.                                 classical geodetic techniques. They have shown that, start-
    From the visual inspection of the residual POPT signal and           ing from March 2000, the continuous GPS stations show the
RITE GNSS time series some clear episodes of uplift can                  beginning of an uplift episode. With regard to the optical
be identified, (Fig. 9), some (namely, as in the 2000, 2006              levelling, the measurements from September/October 1999

Adv. Geosci., 52, 105–118, 2021                                                            https://doi.org/10.5194/adgeo-52-105-2021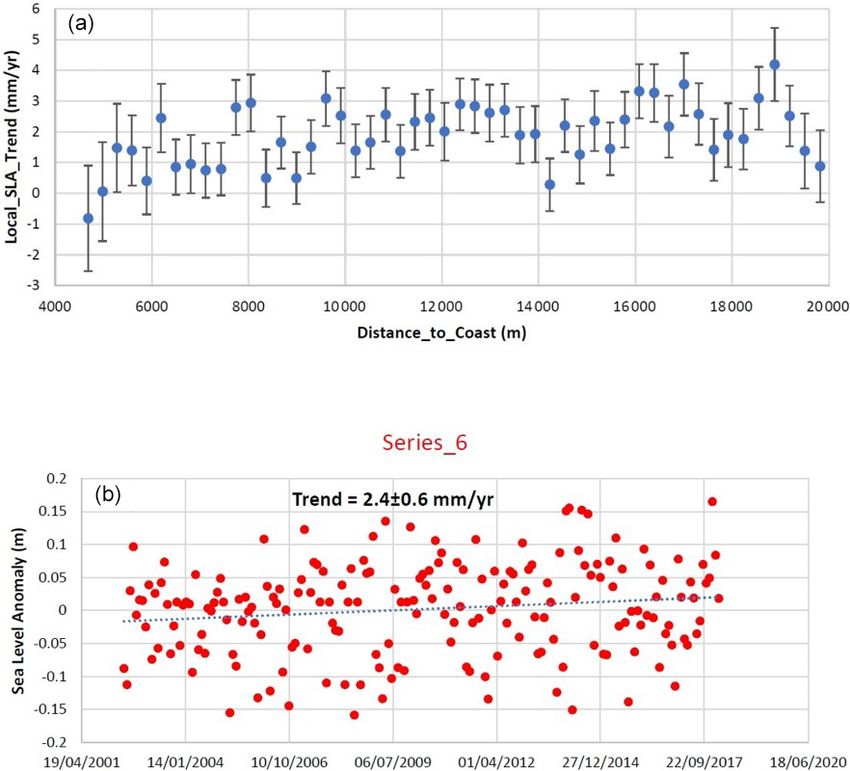
U. Tammaro et al.: Neapolitan volcanic area Tide Gauge Network                                                                 113

to May/August 2000 reveal nearly 4 cm of uplift. More-             sea level signals associated with climate change and their as-
over, as regards InSAR, a point close to the ACAE GPS sta-         sociated spatial variations.
tion, located in the area with maximum displacements mea-              The mean sea level relative to the global oceans is called
sured, shows “the inversion of the deformation, from subsi-        the global mean sea level (GMSL). Instead, as already men-
dence to uplift, after the end of 1999 with a significant uplift   tioned, the one relative to a particular place is called mean sea
from March to August 2000” (Lanari et al., 2004). Before           level (MSL). The MSL variations usually differ from GMSL
March 2000, the Neapolitan Tide Gauge Network was the              ones, because there are phenomena that are present only on a
only continuous network operating in the area, therefore, it       regional and local scale. In addition to climate change, there
was able to detect, in January, the actual beginning of the        are long and short term causes that affect the mean sea level,
uplift (Fig. 9). Furthermore, the TG network has allowed to        as great fluctuation due to the alternation of glacial and in-
more accurately describe the entire uplift episode in terms of     terglacial periods in the last centuries in the Holocene and
amplitude of the vertical displacement. In fact, the vertical      variations, such as tides, waves and tsunamis.
displacement observed at POPT tide gauge is 6 cm, which is             Several tentative studies have been done to correct tide
larger than the under estimated value (4 cm) provided by the       gauge data for the effects of vertical land motion either
optical levelling.                                                 through modelling local tectonics or glacial isostatic adjust-
                                                                   ment (GIA) or by means of direct GPS measurements of the
                                                                   vertical land motion by using geodetically monitored tide
                                                                   gauges (Wöppelmann and Marcos, 2016). To address such
6   Retrieval of the Relative Mean Sea Level                       kind of problems the availability of co-located tide gauge and
                                                                   GNSS permanent stations is of fundamental importance.
As the effects of climate change become more evident, the              In this study, we evaluate the relative mean sea level
problem of the sea level rise went worldwide under the spot-       (RMSL) in the Gulf of Naples and we compare the trend
lights. Sea level change is of great interest for two funda-       found in NAPT with that evaluated at four tide gauges. Three
mental reasons. First, changes in the rate of sea level rise       located in the Tyrrhenian Sea (Salerno, Livorno II, Genova
are tightly related to changes in the Earth’s climate. Second,     II) and one station in the Adriatic Sea (Bari). In particular,
sea level change has important socioeconomic consequences          along the coasts of the Adriatic there are many tide gauges,
for populations living in the coastal areas. As clearly the re-    but we chose the BARI station, located in southern part of the
cent news testify reporting on the flooding inundated Venice       Adriatic sea, because it is outside the northern area affected
in November 2019. Thanks to the advent of satellite altime-        by a phenomenon of natural and anthropogenic subsidence
try, nowadays we have unprecedentedly more information on          (Zerbini et al., 2007; Vitaliano et al., 2020).
sea level change than ever before. From satellite altimetry,           The stations are managed by ISPRA (Istituto Superi-
we know for instance that the geocentric rate of global mean       ore per la Protezione e la Ricerca Ambientale). Data have
sea level rise over the last decade, corrected for glacial iso-    been retrieved online from the Permanent Service for Mean
static adjustment (GIA), is nearly 3 mm/yr. This rate is signif-   Sea Level at http://www.psmsl.org/ (last access: 19 Novem-
icantly larger than the historical rate of sea level change mea-   ber 2019) (Holgate et al., 2013; PSMSL, 2020).
sured by tide gauges during the same period (in the range of           The four tide gauge stations, in the period considered
1–2 mm/yr) (Meyssignac and Cazenave, 2012). Hence, there           (2000–2016), have their time series at least 97 % complete.
is a need to distinguish between absolute and relative sea         In order not to have artificial signals in the records, the gaps
level change. Tide gauges provide valuable observations of         and errors of the data (false zeros and peaks) have been iden-
relative sea level change (relative to the Earth’s crust), but     tified and eliminated.
determining absolute sea level change, which is a clue for cli-        To evaluate the RMSL recorded at NAPT tide gauge, we
mate studies, from tide gauge measurements is not straight-        use the monthly RMSL, and then we subtract the average
forward. In fact, observations of absolute sea level change        value. The sea-level time series, with trends and rates as ob-
from tide gauge are hampered by two main limitations: (a)          tained from a linear fit regression of the available data, are
tide gauge have poor spatial distribution, being located only      reported in the Figs. 10, 11 and Table 4. Due to the short
on the coasts and ocean islands and therefore do not ade-          duration of the time series, values are not representative of
quately represent the global oceans; (b) they are tied to the      the long-term trends due to sea level variability. The trend
land, which can move vertically, as in the tectonically ac-        values oscillate between +4.38 and +9.54 mm/yr and the
tive areas, thus creating an apparent sea level change that is     highest value is found in the Naples tide gauge, but in any
unrelated to climate variations. Depending on local uplift or      case of the same order of magnitude as others stations. All
subsidence, the change in sea level relative to land observed      time series are affected by large positive sea level anoma-
using tide gauges can vary considerably from place to place        lies in 2010 and 2011. This is in agreement with Bonaduce
and deviates from the rate of global mean sea level (Church et     et al. (2016) and Landerer and Volkov (2013). In particular,
al., 2013). Furthermore, vertical land motion, as in the pecu-     Bonaduce et al. (2016) have highlighted that, in the Mediter-
liar volcano-tectonic context of a resurgent caldera, can mask     ranean Sea from 1993 to 2012, there were in all stations anal-

https://doi.org/10.5194/adgeo-52-105-2021                                                       Adv. Geosci., 52, 105–118, 2021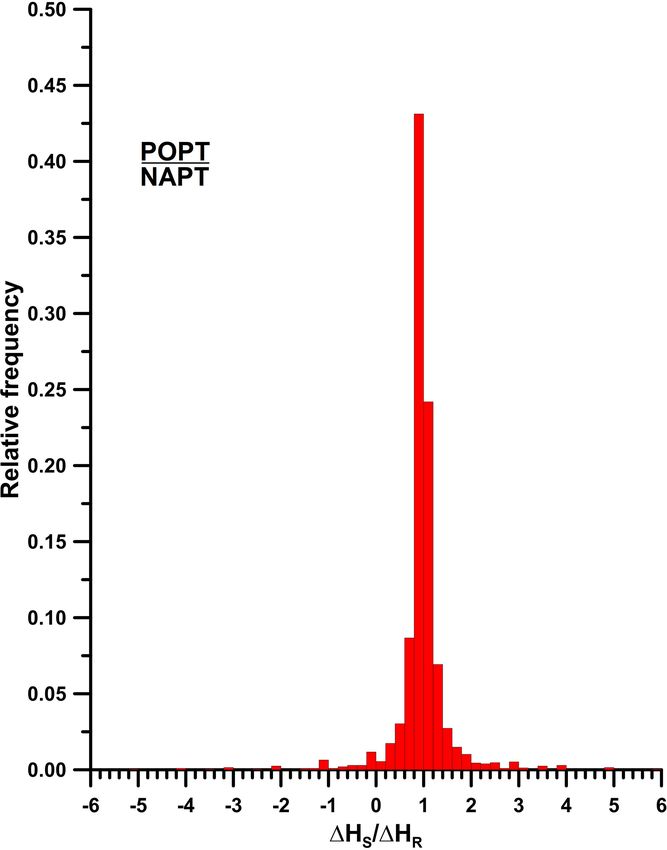
114                                                             U. Tammaro et al.: Neapolitan volcanic area Tide Gauge Network

                                                                        Figure 11. Black line indicates the monthly water level oscillations
                                                                        recorded at ISPRA tide gauges set in Livorno and Salerno. Red line
                                                                        indicates the linear fit curve of the sea level and blues lines the two
                                                                        95 % confidence intervals.

Figure 10. Monthly water level oscillations recorded at ISPRA tide
gauges set in Napoli, Bari and Genova (black line); linear fit curve
of the sea level (red line) and the two 95 % confidence intervals          The coastal sea level products we use are open access
(blue lines).                                                           data, derived from the regional coastal along-track product
                                                                        (The Climate Change Coastal Sea Level Team, 2020). We
Table 4. Rates of rise of the MSL evaluated in Adriatic and Tyrrhe-     have collected and analysed the Line 237_slot 3, which is
nian Sea.                                                               the closest to the tide gauges used in our study (Fig. 12). The
                                                                        time series is a 16-year-long (June 2002 to May 2018), high-
      Sea          Tide Gauge site     Time lapse       Rate            resolution (20 Hz), along-track sea level dataset in coastal
                                                      (mm/yr)           zone of Mediterranean Sea from the Jason-1, Jason-2 and
      Tyrrhenian   Napoli              2000–2016        9.54            Jason-3 missions. Such products are specifically aimed to de-
      Adriatic     Bari                2001–2016        8.04            rive satellite sea surface ranges as close as possible to the
      Tyrrhenian   Genova II           2001–2015        6.02            coast. Ad hoc optimization of the geophysical corrections is
      Tyrrhenian   Livorno II          2001–2016        4.38            applied to the satellite range measurements. At each point of
      Tyrrhenian   Salerno             2001–2015        5.17            measurements along the tracks, the 10 d data are further aver-
                                                                        aged on a monthly basis, annual and semi-annual signals are
                                                                        removed and a data editing is applied (based on a 2σ elimi-
ysed large positive sea-level anomalies in 2010 and 2011.               nation of Jason cycles). Finally, the 20 Hz so called sea level
Landerer and Volkov (2013) during the same period in the                anomaly time series is retrieved up to 20 km offshore; de-
Mediterranean Sea by means of an EEMD (ensemble empir-                  tails on the processing can be found in The Climate Change
ical mode decomposition) approach showed that these events              Coastal Sea Level Team (2020).
were related to the processes that have dominant periodicities             The outcomes (Fig. 13) are quite coherent with the geo-
of ∼ 10 years, and positive residual sea-level trend were gen-          centric rate of global mean sea level rise over the last decade,
erally observed.                                                        after correction for GIA, that is to say 3 mm/yr (Cazenave et
   Notwithstanding the limitations hampering the quality of             al., 2014). It is even worth to note the typical inverse correla-
the coastal products of radar altimetry, we have attempted a            tion of the error in radar altimetry ranges with respect to the
comparison of tide gauge records with Jason radar altimetry.            distance to the coast, due to the above quoted limitations.

Adv. Geosci., 52, 105–118, 2021                                                           https://doi.org/10.5194/adgeo-52-105-2021
U. Tammaro et al.: Neapolitan volcanic area Tide Gauge Network 115 Figure 12. Location of the Line 237_Slot 3 of Jason radar altimetry. Map from Google Earth © Google Earth 2000. Figure 13. (a) shows the monthly local sea level anomaly trend with respect to distance to the coast. (b) shows the monthly time series of one point (Series_6) selected as an example, with indication of least square trend. https://doi.org/10.5194/adgeo-52-105-2021 Adv. Geosci., 52, 105–118, 2021
116                                                           U. Tammaro et al.: Neapolitan volcanic area Tide Gauge Network

7   Conclusions                                                       the data analysis. ALR, SP, GB and EV acquired tide gauge data.
                                                                      ALR prepared the tide gauge dataset.

Mean sea level have been measured throughout the 20th cen-
tury by means of tide gauges located along shorelines in sev-         Competing interests. The authors declare that they have no conflict
eral countries. Due to a high impact on coastal population,           of interest.
sea level is a very critical variable to study the environment
and its changes. Beyond the evaluation of mean sea level
trends, tide gauges are a relevant tool for a tidal computation,      Special issue statement. This article is part of the special issue
harbour and navigation operations, sea level hazards warning          “Understanding volcanic processes through geophysical and vol-
systems, to estimate extreme weather and climate conditions,          canological data investigations: some case studies from Italian sites
as well as, when active volcanoes dominate coastal areas, to          (EGU2019 GMPV5.11 session, COV10 S01.11session)”. It is not
assess ground deformation related to the volcano activity.            associated with a conference.
   This study reports on a full spectral analysis, ranging from
very long period of relative mean sea level change to high
resolution tidal analysis, including seiches, tidal bands and         Acknowledgements. Authors are strongly indebted to two review-
non-linear tides. The spectral analysis has shown that the            ers, who contributed to improve the manuscript.We are grateful IS-
                                                                      PRA for providing data from RMN, the Italian Mareographic Net-
Gulfs of Napoli and Pozzuoli have a different behaviour and
                                                                      work, and for hosting the NAPT station, for several decades, on
that lead us to identify the seiches periods mentioned in Caloi
                                                                      their site in the harbour of Naples. We thank the directors and staff
and Marcelli (1949) and numerous other ones.                          who, since the seventies, have guaranteed the functioning of the tide
   As regards the ground displacements, tide gauge signal al-         gauge network. This paper funded by the DPC do not represent its
lows a different sampling of the 1H with respect to other             official opinions and policies.
geodetic techniques, such as GNSS, levelling and SAR.
We have applied a fit-remove-deconvolutive approach to the
records collected at the tide gauges in the coastal areas of          Financial support. This research has been partially supported
the CFc with respect to Napoli gauge. This has enabled us             by the Dipartimento della Protezione Civile Italiana (DPC –
to extract a clear ground vertical deformation trend in POPT          Italian Civil Protection Department) and the MUR (Ministero
station closely matching the geodetic time series from RITE           dell’Università e della Ricerca, INGV Pianeta Dinamico project
station, the GNSS station closest to POPT tide gauge. This            (code INGV 1020.010), Task V1 – 2020).
is a critical sector of the CFC resurgent caldera where the
largest uplifts and deformations have been and are still being
observed. Our outcomes clearly demonstrate that tide gauges           Review statement. This paper was edited by Paola Cusano and re-
                                                                      viewed by two anonymous referees.
have potentiality to continuously monitoring ground defor-
mations with enough accuracy and resolution and could turn
very useful in monitoring rapidly evolving deformation sce-
narios. Moreover, tide gauge measurements can be used eas-
ily in near real time. The tide gauge recordings show that            References
the 2000 uplift episode at Campi Flegrei caldera started al-
ready in January and not in March 2000, as mentioned in               Amoruso, A., Crescentini, L., Sabbetta, I., De Martino, P.,
literature (Lanari et al., 2004). Finally, even though the avail-       Obrizzo, F., and Tammaro, U.: Clues to the cause of the
able TG records are still short and thus non representative of          2011–2013 Campi Flegrei caldera unrest, Italy, from con-
the long-term trends, we preliminarily evaluate the mean sea            tinuous GPS data, Geophys. Res. Lett., 41, 3081–3088,
level trend in Napoli compared with other tide gauge located            https://doi.org/10.1002/2014GL059539, 2014.
                                                                      Auger, E., Gasparini, P., Virieux, J., and Zollo, A.: Seismic evidence
in the Tyrrhenian and Adriatic sea. Despite their shortness,
                                                                        of an extended magmatic sill under Mt. Vesuvius, Science, 294,
the sea level time series highlight, in 2010 and 2011, the pos-         1510–1512, https://doi.org/10.1126/science.1064893, 2001.
itive anomalies due to ten-year periodicity.                          Barberi, F., Corrado, G., Innocenti, F., and Luongo, G.: Phle-
                                                                        graean Fields 1982–1984: brief chronicle of a volcano emer-
                                                                        gency in a densely populated area, B. Volcanol., 47, 175–185,
Data availability. All data are available from the authors upon re-     https://doi.org/10.1007/BF01961547, 1984.
quest.                                                                Berrino, G.: Detection of vertical ground movements by sea-level
                                                                        changes in the Neapolitan volcanoes, Tectonophysics, 294, 323–
                                                                        332, https://doi.org/10.1016/S0040-1951(98)00109-7, 1998.
Author contributions. UT, PC and FO designed and developed this       Berrino, G., Corrado, G., Luongo, G., and Toro, B.:
study. UT and UR, with contributions from all co-authors, prepared      Ground deformation and gravity change accompany-
the manuscript writing the text and preparing the figures. UT and       ing the 1982 Pozzuoli uplift, B. Volcanol., 47, 187–200,
UR, with contributions from PC and FO, designed and implemented         https://doi.org/10.1007/BF01961548, 1984.

Adv. Geosci., 52, 105–118, 2021                                                         https://doi.org/10.5194/adgeo-52-105-2021
U. Tammaro et al.: Neapolitan volcanic area Tide Gauge Network 117
Bevilacqua, A., Isaia, R., Neri, A., Vitale, S., Aspinall, W. P., Bis- De Natale, G., Troise, C., Trigila, R., Dolfi, D., and Chiarabba, C.:
son, M., Flandoli, F., Baxter, P. J., Bertagnini, A., Esposti On- Seismicity and 3-D substructure at Somma-Vesuvius volcano:
garo, T., Iannuzzi, E., Pistolesi, M., and Rosi, M.: Quantifying evidence for magma quenching, Earth Planet Sc. Lett., 221, 181–
volcanic hazard at Campi Flegrei caldera (Italy) with uncertainty 196, https://doi.org/10.1016/S0012-821X(04)00093-7, 2004.
assessment: 1. Vent opening maps, J. Geophys. Res.-Sol. Ea., Ducarme, B. and Schüller, K.: Canonical wave grouping as the
120, 2309–2329, https://doi.org/10.1002/2014JB011775, 2015. key to optimal tidal analysis, Bulletin d’Informations Marees
Bonaduce, A., Pinardi, N., Oddo, P., Spada, G., and Larni- Terrestres (BIM), 150, 12131–12244, available at: http://www.
col, G.: Sea-level variability in the Mediterranean Sea from bim-icet.org/ (last access: 20 August 2020), ISSN: 0542–6766,
altimetry and tide gauges, Clim. Dynam., 47, 2851–2866, 2018.
https://doi.org/10.1007/s00382-016-3001-2, 2016. Egbert, G. D. and Erofeeva, S. Y.: Efficient inverse
Caloi, P. and Marcelli, L.: Oscillazioni libere del Golfo di Napoli, modeling of barotropic ocean tides, J. Atmos. Tech-
Annals of Geophysics, 2, 222–242, https://doi.org/10.4401/ag- nol., 19, 183–204, https://doi.org/10.1175/1520-
5957, 1949. 0426(2002)0192.0.CO;2, 2002.
Capuano, P., De Lauro, E., De Martino, S., and Falanga, M.: Water- Fedele, F. G., Giaccio, B., Isaia, R., and Orsi, G.: The Campa-
level oscillations in Adriatic sea as coherent self-oscillations in- nian Ignimbrite eruption, Heinrich Event 4, and the Palaeolithic
ferred by Independent Component analysis, Prog. Oceanogr., 91, change in Europe: A high-resolution investigation, in Volcanism
441–460, https://doi.org/10.1016/j.pocean.2011.06.001, 2011. and the Earth’s Atmosphere, edited by Robock, A. and Oppen-
Capuano, P., Russo, G., Civetta, L., Orsi, G., D’Antonio, heimer, C., AGU, Washington D. C., USA, Geophys. Monogr.
M., and Moretti, R.: The active portion of the Campi Ser., 139, 301–325, 2003.
Flegrei caldera structure imaged by 3-D inversion of Galluzzo, D., Del Pezzo, E., La Rocca, M., and Petrosino, S.: Peak
gravity data, Geochem. Geophy. Geosy., 14, 4681–4697, Ground Acceleration produced by local earthquakes in volcanic
https://doi.org/10.1002/ggge.20276, 2013. areas of Campi Flegrei and Mt. Vesuvius, Annals of Geophysics,
Cazenave, A., Dieng, H. B., Meyssignac, B., von Schuckmann, 47, 1377–1389, 2004.
K., and Decharme, B.: The rate of sea-level rise, Nature Clim. Holgate, S. J., Matthews, A., Woodworth, P. L., Rickards, L. J.,
Change, 4, 358–361, https://doi.org/10.1038/nclimate2159, Tamisiea, M. E., Bradshaw, E., Foden, P. R., Gordon, K. M.,
2014. Jevrejeva, S., and Pugh, J.: New Data Systems and Products at the
Church, J. A., Clark, P.U., Cazenave, A., Gregory, J. M., Jevrejeva, Permanent Service for Mean Sea Level, J. Coastal Res., 29, 493–
S., Levermann, A., Merrifield, M. A., Milne, G. A., Nerem, R. S., 504, https://doi.org/10.2112/JCOASTRES-D-12-00175.1, 2013.
Nunn, P. D., Payne, A. J., Pfeffer, W. T., Stammer D., and Un- Isaia, R., Marianelli, P., and Sbrana, A.: Caldera unrest
nikrishnan, A. S.: Sea Level Change, in: Climate Change 2013: prior to intense volcanism in Campi Flegrei (Italy) at
The Physical Science Basis. Contribution of Working Group I to 4.0 ka B.P.: implications for caldera dynamics and fu-
the Fifth Assessment Report of the Intergovernmental Panel on ture eruptive scenarios, Geophys. Res. Lett., 36, L21303,
Climate Change, edited by: Stocker, T. F., Qin, D., Plattner, G.- https://doi.org/10.1029/2009GL040513, 2009.
K., Tignor, M., Allen, S. K., Boschung, J., Nauels, A., Xia, Y., Lanari, R., Berardino, P., Borgstrom, S., Del Gaudio, C., De Mar-
Bex V., and Midgley, P. M., Cambridge University Press, Cam- tino, P., Fornaro, G., Guarino, S., Ricciardi, G. P., Sansosti, E.,
bridge, United Kingdom and New York, NY, USA, 2013. and Lundgren, P.: The use of IFSAR and classical geodetic tech-
Corrado, G. and Luongo, G.: Ground Deformation measurements niques for caldera unrest episodes: application to the Campi Fle-
in Active Volcanoes Areas using tide gauges, B. Volcanol., 44, grei uplift event of 2000, J. Volcanol. Geoth. Res., 133, 247–260,
505–511, https://doi.org/10.1007/BF02600581, 1981. https://doi.org/10.1016/S0377-0273(03)00401-3, 2004.
Corrado, G., Guerra, I., Lo Bascio, A., Luongo, G., and Landerer, F. W. and Volkov, D. L.: The anatomy of recent large sea
Rampoldi, F.: Inflation and microearthquake activity level fluctuations in the Mediterranean Sea, Geophys. Res. Lett.,
of Phegraean Fields, Italy, B. Volcanol., 40, 169–188, 40, 553–557, https://doi.org/10.1002/grl.50140, 2013.
https://doi.org/10.1007/BF02596998, 1977. Luongo, G., Cubellis, E., Obrizzo, F., and Petrazzuoli,
Cubellis, E., Luongo, G., and Marturano, A.: Seismic haz- S. M.: The mechanics of the Campi Flegrei resurgent
ard assessment at Mt. Vesuvius: the maximum magni- caldera – a model, J. Volcanol. Geoth. Res., 45, 161–172,
tude expected, J. Volcanol. Geoth. Res., 162, 139–149, https://doi.org/10.1016/0377-0273(91)90056-6, 1991.
https://doi.org/10.1016/j.jvolgeores.2007.03.003, 2007. Macedonio, G., Giudicepietro, F., D’Auria, L., and Martini,
Deino, A. L., Orsi, G., de Vita, S., and Piochi, M.: The age of the M.: Sill intrusion as a source mechanism of unrest at vol-
Neapolitan Yellow Tuff caldera-forming eruption (Campi Flegrei canic calderas, J. Geophys. Res.-Sol. Ea., 119, 3986–4000,
caldera-Italy) assessed by 40 Ar/39 Ar dating method, J. Volcanol. https://doi.org/10.1002/2013JB010868, 2014.
Geoth. Res., 133, 157–170, https://doi.org/10.1016/S0377- Marianelli, P., Sbrana, A., and Proto, M.: Magma chamber
0273(03)00396-2, 2004. of the Campi Flegrei supervolcano at the time of erup-
Del Pezzo, E., Bianco F., and Saccorotti G.: Seismic Source Dy- tion of the Campanian Ignimbrite, Geology, 34, 937–940,
namics at Vesuvius Volcano, Italy, J. Volcanol. Geoth. Res., 133, https://doi.org/10.1130/G22807A.1, 2006.
23–39, https://doi.org/10.1016/S0377-0273(03)00389-5, 2004. Melchior, P.: The Tides of the Planet Earth, Pergamon Press, Paris,
De Martino, P., Tammaro, U., and Obrizzo, F.: GPS time series at France, p. 609, 1978.
Campi Flegrei caldera (2000–2013), Annals of Geophysics, 57, Meyssignac, B. and Cazenave, A.: Sea level: A review of present-
S0213, https://doi.org/10.4401/ag-6431, 2014. day and recent-past changes and variability, J. Geodyn., 58, 96–
109, https://doi.org/10.1016/j.jog.2012.03.005, 2012.
https://doi.org/10.5194/adgeo-52-105-2021 Adv. Geosci., 52, 105–118, 2021118 U. Tammaro et al.: Neapolitan volcanic area Tide Gauge Network Munk, W. H. and Cartwright, D. E.: Tidal spectroscopy and pred- SeaDataNet: Data Quality Control Procedures, version 2.0, avail- ication, Philosophical Transactions of the Roy. Soc. of London, able at: http://www.seadatanet.org (last access: 22 Novem- 259, 533–581, 1966. ber 2016), 2010. Orsi, G., de Vita, S., and Di Vito, M.: The restless, resurgent Speich, S. and Mosetti, F.: On the eigenperiods in the Tyrrhe- Campi Flegrei nested caldera (Italy): constraints on its evolu- nian sea level oscillations, Il Nuovo Cimento C, 11, 219–228, tion and configuration, J. Volcanol. Geoth. Res., 74, 179–214, https://doi.org/10.1007/BF02561734, 1988. https://doi.org/10.1016/S0377-0273(96)00063-7, 1996. Tammaro, U., De Martino, P., Obrizzo, F., Brandi, G., Pawlowicz, R., Beardsley, B., and Lentz, S.: Classical tidal D’Alessandro, A., Dolce, M., Malaspina, S., Serio, C., and harmonic analysis including error estimates in MAT- Pingue, F.: Somma Vesuvius volcano: ground deformations from LAB using T_TIDE, Comput. Geosci., 28, 929–937, CGPS observations (2001–2012), Annals of Geophysics, 56, https://doi.org/10.1016/S0098-3004(02)00013-4, 2002. S0456, https://doi.org/10.4401/ag-6462, 2013. Permanent Service for Mean Sea Level (PSMSL): Obtaining Tide The Climate Change Coastal Sea Level Team: A database Gauge Data, available at: http://www.psmsl.org/data/obtaining/ of coastal sea level anomalies and associated trends from (last access: 19 November 2019), 2020. Jason satellite altimetry from 2002 to 2018, SEANOE, Petrillo, Z., Chiodini, G., Mangiacapra, A., Caliro, S., Capuano, https://doi.org/10.17882/74354, 2020. P., Russo, G., Cardellini, C., and Avino, R.: Defining a 3D Trasatti, E., Polcari, M., Bonafede, M., and Stramondo, S.: Geode- physical model for the hydrothermal circulation at Campi Fle- tic constraints to the source mechanism of the 2011–2013 unrest grei Caldera (Italy), J. Volcanol. Geoth. Res., 264, 172–182, at Campi Flegrei (Italy) caldera, Geophys. Res. Lett., 42, 3837– https://doi.org/10.1016/j.jvolgeores.2013.08.008, 2013. 3854, https://doi.org/10.1002/2015GL063621, 2015. Pingue, F., Bottiglieri, M., Godano, C., Obrizzo, F., Tammaro, U., Troise, C., De Natale, G., Schiavone, R., Somma, R., and Esposito, T., and Serio, C.: Spatial and temporal distribution of Moretti, R.: The Campi Flegrei caldera unrest: Discriminat- vertical ground movements at mount Vesuvius (Sothern Italy) ing magma intrusions from hydrothermal effects and impli- in the period 1973–2009, Annals of Geophysics, 56, S0451, cations for possible evolution, Earth-Sci. Rev., 188, 108–122, https://doi.org/10.4401/ag-6457, 2013. https://doi.org/10.1016/j.earscirev.2018.11.007, 2019. Principe, C., Rosi, M., Santacroce, R., and Sbrana, A.: Explanatory Vitagliano, E., Riccardi, U., Piegari, E., Boy, J. P., and Di notes to the geological map, in: Somma-Vesuvius, Quaderni de Maio, R.: Multi-Component and Multi-Source Approach for “La Ricerca Scientifica”, edited by: Santacroce, R., CNR, 114, Studying Land Subsidence in Deltas, Remote Sens., 12, 1465, Progetto finalizzato Geodinamica, Monografie finali, 8, 11–52, https://doi.org/10.3390/rs12091465, 2020. ISSN: 0556-9664, 1987. Wöppelmann, G. and Marcos, M.: Vertical land motion as a key to Romano, V., Tammaro, U., and Capuano, P.: A 2-D FEM thermal understanding sea level change and variability, Rev. Geophys., model to simulate water flow in a porous media: Campi Flegrei 54, 64–92, https://doi.org/10.1002/2015RG000502, 2016. caldera case study, Nonlin. Processes Geophys., 19, 323–333, Zerbini, S., Richter, B., Rocca, F., van Dam, T., and Matonti, https://doi.org/10.5194/npg-19-323-2012, 2012. F.: A combination of space and terrestrial geodetic tech- Romano, V., Tammaro, U., Riccardi, U., and Capuano, P.: Non- niques to monitor land subsidence, Case study, the South isothermal momentum transfer and ground displacements rate at Eastern Po Plain, Italy, J. Geophys. Res., 112, B05401, Campi Flegrei caldera (Southern Italy), Phys. Earth Planet. In., https://doi.org/10.1029/2006JB004338, 2007. 283, 131–139, https://doi.org/10.1016/j.pepi.2018.08.010, 2018. Rosi, M. and Sbrana, A.: Phlegraean Fields, Quaderni de “La Ricerca Scientifica”, CNR, Roma, 114, 114–175, 1987. Schüller, K.: Theoretical basis for Earth tide analysis and prediction, Manual-01-ET34-X-V73, Surin, 2019. Adv. Geosci., 52, 105–118, 2021 https://doi.org/10.5194/adgeo-52-105-2021
You can also read