REDUCING VEHICLE EMISSIONS IN TURKEY - POLICY MEASURES TO ADDRESS GREENHOUSE GAS AND AIR POLLUTANT EMISSIONS FROM THE ROAD TRANSPORT SECTOR ...
←
→
Page content transcription
If your browser does not render page correctly, please read the page content below
WHITE PAPER                                                               AUGUST 2016

 REDUCING VEHICLE EMISSIONS
 IN TURKEY
 POLICY MEASURES TO ADDRESS GREENHOUSE GAS
 AND AIR POLLUTANT EMISSIONS FROM THE ROAD
 TRANSPORT SECTOR

 Peter Mock

                                                               www.theicct.org

                                                  communications@theicct.org

 BEIJING   |   BERLIN   |   BRUSSELS   |   SAN FRANCISCO   |   WA S H I N G TO N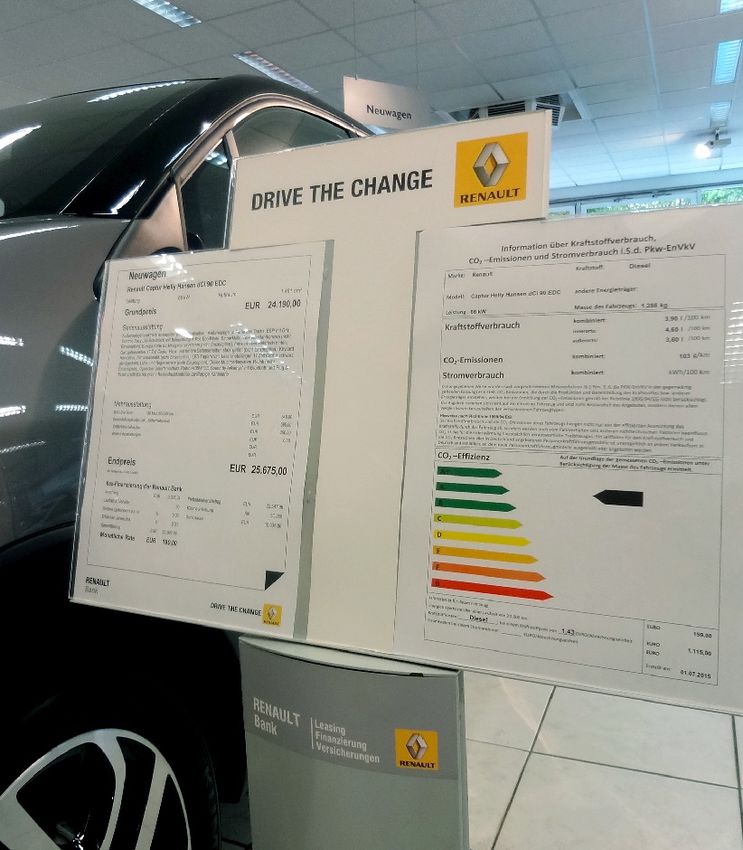
ACKNOWLEDGEMENTS
Peter Mock is managing director of ICCT Europe and a 2015/16 fellow at the Istanbul
Policy Center (IPC). IPC is an independent policy research institute with global outreach
and the mission to foster academic research in social sciences and its application
to policy making. The Mercator-IPC Fellowship Program is a joint initiative among
IPC, Sabancı University, and Stiftung Mercator. Funding for this work was generously
provided through the Mercator-IPC Fellowship Program (http://ipc.sabanciuniv.edu/en/
about_fellowship/).

The author thanks the reviewers of this report for their constructive comments, as well
as the following individuals for their particular contribution to the development of this
report: Gülcihan Çiğdem (IPC), Egemen Can Erçelik (IPC), Megan Gisclon (IPC), Daniel
Grütjen (Stiftung Mercator), Fuat Keyman (IPC), Wolfram Knörr (IFEU), Pınar Köse
(EMBARQ Turkiye), Joshua Miller (ICCT), Doruk Özdemir (DLR), Ümit Şahin (IPC), Jan
Taşçı (Stiftung Mercator), Uwe Tietge (ICCT), Çiğdem Tongal (IPC), Ethemcan Turhan
(IPC), Alper Ünal (Istanbul Technical University), Zifei Yang (ICCT).

International Council on Clean Transportation Europe
Neue Promenade 6, 10178 Berlin
+49 (30) 847129-102

communications@theicct.org | www.theicct.org | @TheICCT

© 2016 International Council on Clean Transportation
EXECUTIVE SUMMARY
Vehicle sales and vehicle emissions are steeply rising in Turkey. This rise is important not
only from an environmental and health protection perspective, but also from an economic
and international competitiveness point of view that new vehicles coming into the market
in Turkey in future years should be equipped with the best available technology and have
the lowest possible emissions. A set of distinct policy measures can help increase the
efficiency and reduce the emission levels of the vehicle fleet in Turkey.

Mandatory CO2 emission standards for new vehicles are successfully applied in other
markets but are not yet introduced in Turkey. For the analysis within this report, two
scenarios were assessed in more detail, allowing for an annual CO2 reduction rate of 4%
and 6% for newly registered cars and resulting in an average new car fleet CO2 level of
84 g/km and 69 g/km by 2023, respectively. The required additional investment in new
vehicle technologies to meet these future CO2 targets was found to be reasonably low
and to result in a consumer payback period as short as four to five years, thanks to the
fuel cost savings associated with lower CO2 emission levels.

Vehicle CO2 labeling as a measure for consumer information was implemented in Turkey
in 2009. Comparing the current Turkish labeling scheme to those in other markets
revealed areas of potential further development, such as revising the current website to
allow customers a better overview of available vehicle models and their CO2 emission
labels and adding information on vehicle taxation levels and on-road driving emission
levels to the label.

Taxes on the purchase and ownership of passenger cars in Turkey have a strong effect on
the sales structure of the vehicle market. However, these taxes currently do not take into
account the CO2 emission levels of new vehicles. Revising the current vehicle taxation
scheme in Turkey to be based partly on vehicle CO2 emissions, ideally in the form of a
feebate system, would directly pay manufacturers to install their latest low-emission
vehicle technologies and would provide a strong financial incentive for customers to
choose more efficient cars that emit less CO2.

Reliable data on vehicle emission levels is key for all of the discussed policy measures.
In order to address the increasing discrepancy between official and real-world emission
data, Turkey should introduce the new Worldwide Harmonized Light Vehicles Test
Procedure (WLTP) as soon as possible and introduce mandatory on-road emission
tests for new vehicle models, both for CO2 and other air pollutants. As a third pillar of a
comprehensive low-emissions policy, regular retesting of the emission levels of in-use
vehicles, carried out by the authorities or independent third parties, is strongly advised.

A rough estimate of the expected effect of introducing mandatory CO2 standards,
CO2-based vehicle taxation, and enhanced vehicle emission testing for new passenger
cars in Turkey is provided in Figure 1 and Figure 2. The total CO2 emissions of the
light-duty vehicle fleet in Turkey would increase from about 16 million metric tons in
2015 to 22 million metric tons by 2030 if no further policy measures are taken. With
only a mandatory CO2 standard in place, the emission level would be lower, at 17–19
million metric tons by 2030. Complementing CO2 standards by also introducing a
CO2-based vehicle taxation scheme and enhanced vehicle emission testing would
help to further reduce the emission level to about 14–16 million metric tons by 2030.
This level is as much as 36% lower than in a business-as-usual scenario. Similarly, the
amount of fuel consumption in the light-duty vehicle sector could be reduced by
about the same extent.

                                                                                          i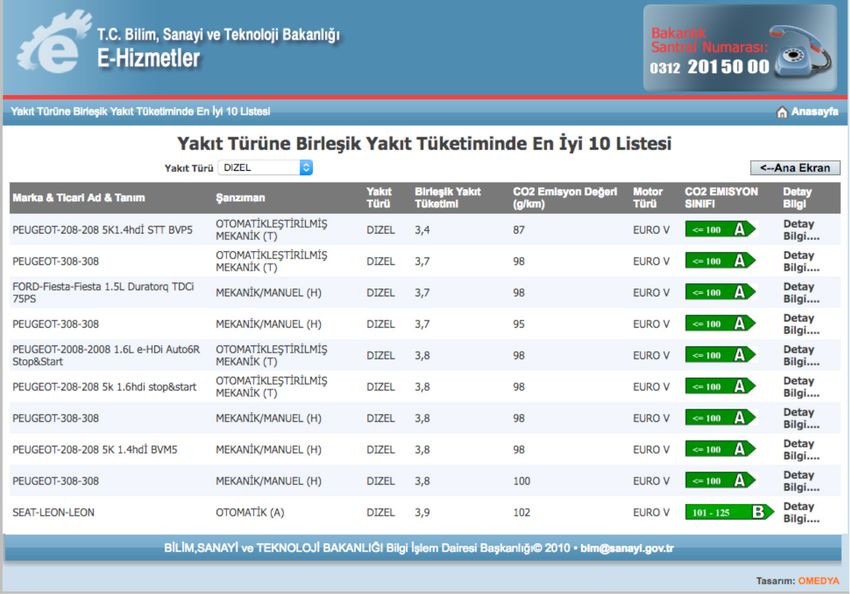
125                                                                                                               25

                                                                                                                CO 2 emissions (tank-to-wheel in million metric tons per year)
Fuel consumption (thousand barrels of oil equivalent p. day)
                                                                          LIGHT-DUTY VEHICLES                                                                                         LIGHT-DUTY VEHICLES

                                                                                                                                                                                                                        without additional policy measures

                                                               100                                                                                                               20
                                                                                                                                                                                                                        CO2 standard only (-4% p.a.)
                                                                                                                                                                                                                        CO2 standard (-4% p.a.) + taxation
                                                                                                                                                                                                                        CO2 standard only (-6% p.a.)
                                                                                                                                                                                                                        CO2 standard (-4% p.a.) + taxation + testing
                                                                75                                                                                                               15                                     CO2 standard (-6% p.a.) + taxation
                                                                                                                                                                                                                        CO2 standard (-6% p.a.) + taxation + testing

                                                               50                                                                                                                10

                                                               25                                                                                                                 5
                                                                          vehicle kilometers travelled                                                                                vehicle kilometers travelled
                                                                          (going from 75 (2010)                                                                                       (going from 75 (2010) to
                                                                          to 165 (2030) billion km/a,                                                                                 165 (2030) billion km/a,
                                                                          axis not shown)                                                                                             axis not shown)
                                                                0                                                                                                                0
                                                                2010                 2020                2030                                                                    2010            2020                2030

       Figure 1. Estimated fuel demand from                                                                                              Figure 2. Estimated CO2 emissions from light-duty
       light-duty vehicles in Turkey (2010-2030).                                                                                        vehicles in Turkey (2010-2030).

                                                                 In summary, the policy measures discussed are expected to result in higher investments
                                                                 in vehicle technologies and less spending on fuel and oil imports, thereby providing
                                                                 benefits for all stakeholders in Turkey, including consumers and the vehicle and vehicle
                                                                 parts manufacturing industry.

                                                                     ii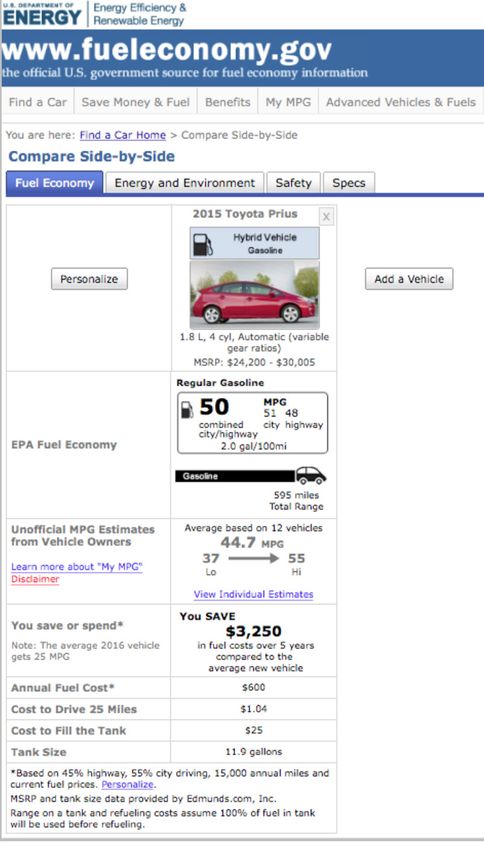
REDUCING VEHICLE EMISSIONS IN TURKEY: POLICY MEASURES

TABLE OF CONTENTS

Executive summary..................................................................................................................... i

Abbreviations............................................................................................................................. iv

1 Introduction.............................................................................................................................1

2 Vehicle CO2 standards........................................................................................................... 2
    2.1 Turkey in comparison to world markets................................................................................... 2
    2.2 Introducing a CO2 standard for new vehicles in Turkey..................................................... 5

3 Vehicle CO2 labeling.............................................................................................................12
    3.1 The current situation in Turkey...................................................................................................12
    3.2 Best-practice examples from world markets.........................................................................15

4 CO2-based vehicle taxation............................................................................................... 20
    4.1 The current situation in Turkey................................................................................................. 20
    4.2 Potential alternative approaches..............................................................................................22
    4.3 Assessing a redesign of Turkey’s vehicle taxation scheme.............................................25

5 Enhanced vehicle emission testing...................................................................................33
    5.1 The current situation in Turkey, the EU and the U.S..........................................................33
    5.2 Required changes for a robust emission testing scheme................................................35

6 Conclusions and outlook....................................................................................................38

7 References............................................................................................................................. 41

                                                                                                                                         iii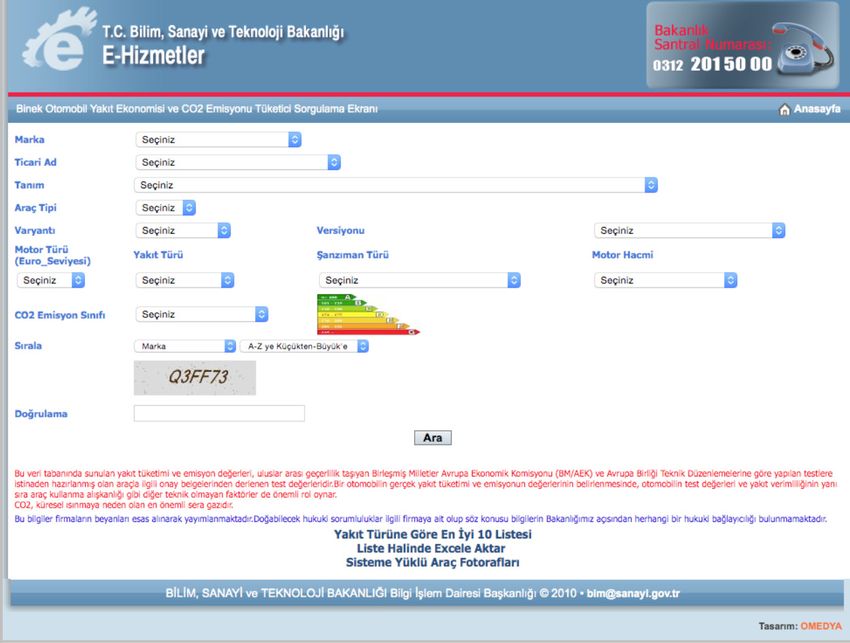
ICCT WHITE PAPER

ABBREVIATIONS
ACEA	Association des Constructeurs Européens d’Automobiles
      (European Automotive Manufacturers’ Association)
APEC     Asia-Pacific Economic Cooperation
CO2      Carbon dioxide
EU       European Union
EUR      Euro
g/km     Grams per kilometer
GFEI     Global Fuel Economy Initiative
GHG      Greenhouse gas
ICCT     International Council on Clean Transportation
IPC      Istanbul Policy Center
KDV      Katma Değer Vergisi (Turkish VAT)
l/100km Liters per 100 kilometers
LPG      Liquefied petroleum gas
MTV      Motorlu Taşıtlar Vergisi
MPG      Miles per gallon
NEDC     New European Driving Cycle
NOx      Nitrogen oxides
NTE      Not-to-exceed
OSD	Otomotiv Sanayi Dernegi
     (Turkish Automotive Manufacturers Association)
ÖTV      Motorlu Taşıt Araçlarına İlişkin Özel Tüketim Vergisi (SCT)
p.a.     per year
PSA      Groupe PSA (formerly PSA Peugeot Citroën)
TL       Turkish Lira (approximately 0.3 euros)
UK	United Kingdom
UNECE    United Nations Economic Commission for Europe
U.S.     United States
RDE      Real-driving emissions
SCT      Special consumption tax
VAT      Value-added tax
WLTP     Worldwide Harmonized Light Vehicles Test Procedure

 iv
REDUCING VEHICLE EMISSIONS IN TURKEY: POLICY MEASURES

1 INTRODUCTION
Turkey is among the most important vehicle manufacturing countries in the world. Of
the more than 1.1 million vehicles produced in Turkey every year, about three-quarters are
currently being exported abroad (OSD, 2014). At the same time, the volume of vehicle
sales in Turkey itself is growing quickly—recently at a rate of about 8% per year (TUIK,
2015). As a result, the automotive sector in Turkey is a vital part of the national economy,
with numerous production plants and employees in the vehicle and vehicle parts
manufacturing industry.

Given the strong dependence of the Turkish economy on the automotive industry, it
is of particular importance to ensure that this industry sector is ready to meet current
and future challenges, such as local air pollution, climate change, and energy security,
by offering innovative vehicles that can compete in the global and national markets. An
extensive set of policy measures can help drive forward the necessary innovations.

An assessment of the current vehicle market in Turkey was provided in an earlier report,
as well as a comparison of other key automotive markets worldwide (Mock, 2016).
As part of the findings it was shown that the level of efficiency for new cars and light
commercial vehicles in Turkey is similar to the efficiency of comparable vehicles in the
European Union (EU). Furthermore, it was estimated that in a business-as-usual scenario,
oil consumption and carbon dioxide (CO2) emissions from road transport in Turkey
would approximately double by 2030.

It is the objective of this report to build on the previous baseline analysis of the Turkish
automotive sector by assessing a set of concrete policy measures that could help drive
down fuel consumption and emissions from the road transport sector in Turkey in
future years.

Sections 2 through 5 of this report examine specific policy options in more detail,
including a qualitative description of the context in general and specifically in Turkey,
as well as providing a quantitative assessment whenever possible. The scope of policy
options selected for the discussion within this report includes vehicle CO2 standards,
CO2 labeling, CO2-based taxation, and enhanced vehicle emission testing but is by
no means to be seen as complete. Instead, it is meant to cover measures that are
commonly applied in other automotive markets worldwide and that were identified as
also potentially relevant for Turkey during discussions with stakeholders throughout the
duration of this research project. Section 6 summarizes the key findings for the specific
policy options and provides an outlook on potential next steps.

                                                                                         1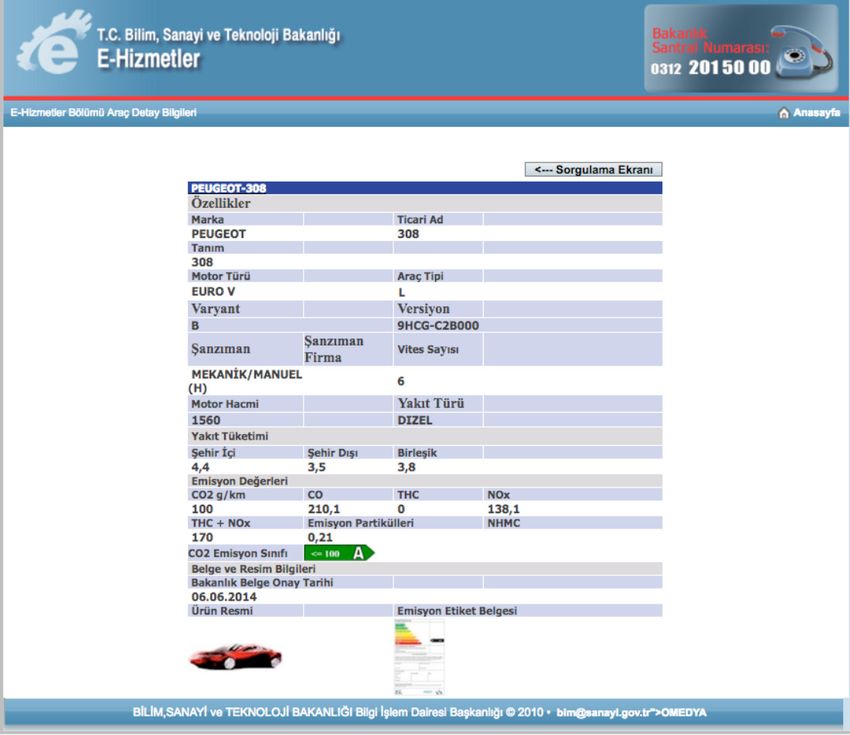
ICCT WHITE PAPER

                     2 VEHICLE CO2 STANDARDS
                     A CO2 standard requires vehicle manufacturers to ensure that the emissions of their new
                     vehicles sold are below a certain target value by a certain target year. CO2 standards
                     typically are applied at the fleet level, which is to say a manufacturer can continue selling
                     some vehicles with emissions above the target value as long as the sales-weighted
                     average for the new vehicle fleet remains below the corresponding target level.

                     2.1 TURKEY IN COMPARISON TO WORLD MARKETS
                     Altogether the G20 countries account for more than 80 million new vehicle sales
                     per year, more than 90% of global annual vehicle sales. Half the G20 countries have
                     implemented mandatory CO2 reduction standards for new passenger cars and light
                     commercial vehicles (Table 1) as of mid-2016.1

Table 1. Overview of mandatory CO2 emission standards for new passenger cars and light commercial vehicles in G20 countries.1
Data sources: ICCT, 2016; Kodjak, 2015; OICA, 2015.
                                                                    Passenger cars                                         Light-commercial vehicles

                                                   CO2 standard, years implemented     CO2 reduction           CO2 standard, years implemented         CO2 reduction
                    Total vehicle sales
        Region            in 2015           2015             2020            2025      Total   Annual   2015             2020             2025         Total   Annual

China               24,597,583        28%                                              42%     5.3%                                                    12%     2.5%

U.S.                17,470,659        20%                                              39%     4.8%                                                    34%     4.0%

EU                  15,786,092        18%                                              21%     3.8%                                                    13%     2.8%

Japan                 5,046,511        6%                                              0%      0.0%                                                    13%      2.7%

India                3,425,336         4%                                              13%     2.8%

Brazil               2,568,976         3%                                               5%     2.8%

Canada               1,939,949         2%                                              35%     4.2%                                                    31%     3.6%

South Korea          1,833,786         2%                                              34%     8.0%                                                    16%     3.3%

Russia               1,437,930         2%

Mexico                1,351,648        2%                                               5%     4.6%                                                     5%     4.9%

Australia             1,155,408        1%

Indonesia             1,031,422        1%

Turkey                   1,011,194     1%

Saudi Arabia             830,100       1%                                              18%     4.8%                                                    15%     3.9%

South Africa             617,749       1%

Argentina                605,933       1%

All G20 countries   80,710,276        91%

All countries       88,677,983       100%

                     The U.S. and Canada currently have the furthest reaching standard in terms of target
                     year. Both markets have set a mandatory CO2 target for 2025 in which passenger cars
                     require a 35%-39% reduction compared to 2015 levels, which equals an annual reduction
                     rate of 4.2%-4.8%. China requires a 42% reduction, which is 5.3% per year, to meet its
                     proposed 2025 target. South Korea is the market that currently has the most stringent
                     standard in terms of annual CO2 reduction, having set a mandatory standard for 2020
                     that will lower new car CO2 emissions by 34% compared to 2015 at a rate of 8.0% per
                     year. The EU requires new cars to emit on average not more than 95 g/km of CO2 by
                     2021, which is equivalent to a reduction of 21% compared to 2015 at an annual rate of
                     3.8%.2 Japan also has set a mandatory CO2 target of 122 g/km for 2020, but it already
                     has been met well in advance; therefore, the current regulation does not require any

                     1        Although Germany, France, UK, and Italy are members of the G20, for this overview table the EU-28 was
                              included instead.
                     2        All CO2 emission targets and reduction rates given are expressed as being measured in the New European
                              Driving Cycle (NEDC) vehicles test procedure. The conversion factors for non-NEDC test procedures can
                              be found in Global passenger vehicle standards (ICCT, 2016). For EU and Japan the actual new vehicle fleet
                              averages for CO2 emissions were used rather than the original 2015 regulatory target values.

                          2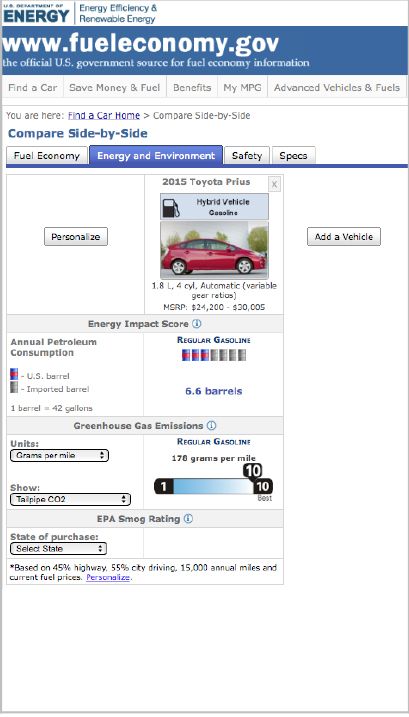
REDUCING VEHICLE EMISSIONS IN TURKEY: POLICY MEASURES
further vehicle improvements. India, Brazil, Mexico, and Saudi Arabia are other G20
countries with mandatory CO2 emission standards for new passenger cars in place. Most
markets with CO2 emission standards for passenger cars also have similar standards for
light commercial vehicles in place.
Turkey is one of the few G20 countries not having implemented mandatory CO2
standards for new cars or light commercial vehicles at this point. For passenger cars,
the average CO2 emission level in Turkey (121 g/km in 2014) is only slightly below the
EU-28 average (123 g/km), despite vehicles in Turkey being on average lighter and less
powerful than in the EU (Figure 3). For the years 2012 through 2014, in which data on
new car CO2 emissions is available, the annual rate of reduction is similar to that of the
EU average. For comparison, in the Netherlands, where the vehicle fleet structure and
taxation levels tend to be more similar to those in Turkey, the new car fleet CO2 level
is significantly lower than in Turkey, and the annual CO2 reduction rate is significantly
higher than in Turkey. Other markets, like the U.S., China, and South Korea, come from a
higher baseline CO2 emission level and require a steeper reduction rate than Turkey and
the EU in order to meet their respective 2020-2025 emission targets for new cars.
200 9 300
8 12
Grams CO2 per kilometer, normalized to NEDC
Grams CO2 per kilometer, normalized to NEDC
Liters per 100 kilometers (gasoline equivalent)
Liters per 100 kilometers (gasoline equivalent)
250
7
150 China 2020:117
10
US 2025:141
S. Korea 2020:174
6 200 China 2020:162
Turkey: US 2025:97
no standard 8
for comparison: 5 Turkey:
Netherlands no standard
100 150
S. Korea 2020:97 EU 2020:147
EU 2021:95 4 6
3 100
4
50
2
50
2
1
0 0 0 0
2005 2010 2015 2020 2025 2005 2010 2015 2020 2025
Figure 3. Average new passenger car CO2 emission levels Figure 4. Average new light commercial vehicle CO2
for selected countries/regions, normalized to NEDC. emission levels for selected countries/regions, normalized
Data source: ICCT, 2016. to NEDC. Data source: ICCT, 2016.
For light commercial vehicles, the average new vehicle CO2 emission level for Turkey in
2014 was 157 g/km, below the EU average of 171 g/km (Figure 4). Historical data were
not available for the analysis within this report. The annual CO2 reduction rate in the EU,
China, and South Korea is at a similar level, with a somewhat steeper reduction pathway
for the U.S. market.
Comparing the annual CO2 reduction rates for new passenger cars, it can be seen
that the current estimated reduction rate for countries with mandatory CO2 standards
varies between 2.8% and 8.0%. This is illustrated in Figure 5. For Turkey, despite not
having introduced any mandatory CO2 regulation for new cars at this point, the annual
reduction rate of 3.0% is at the lower bound of this range. This is most likely due to the
fact that the market in Turkey is indirectly affected by the CO2 regulations in the EU
and other markets, given that about 79% of Turkey’s car production is exported abroad
3
ICCT WHITE PAPER

                                          and about 73% of new cars sold in Turkey are imported from abroad (OSD, 2014). As a
                                          result, spillover effects from vehicle regulations abroad have an influence on the vehicle
                                          market, and also on CO2 emission levels, in Turkey. Likely more important, though, is the
                                          fact that fuel and vehicle taxation levels in Turkey tend to be among the highest in the
                                          world, thereby driving the new car market toward models with smaller engine size, lower
                                          engine power, and—indirectly—also lower CO2 emission levels (Mock, 2016). With this in
                                          mind, the current annual CO2 reduction in Turkey appears rather low, for example, when
                                          compared with markets such as the Netherlands that are more similar to Turkey in terms
                                          of vehicle fleet structure and taxation levels.

                                    10%
                                                                         MANDATORY CO2 STANDARDS IN PLACE
Annual average CO2 reduction rate

                                                                                                                                               NO CO2
                                            ~8.0%
                                                                                                                                             STANDARD
                                    8%

                                    6%                 ~5.3%
                                                                 ~4.8%       ~4.8%     ~4.6%
                                                                                                  ~4.2%
                                                                                                             ~3.8%
                                    4%
                                                                                                                       ~2.8%                  ~3.0%
                                                                                                                                  ~2.8%

                                    2%

                                    0%
                                           South      China      Saudi       U.S.     Mexico    Canada        EU       Brazil     India       Turkey
                                           Korea                Arabia

                                          Figure 5. Comparison of estimated average annual new passenger car CO2 emission reduction rates.
                                          Data sources: ICCT, 2015a; ICCT, 2016; Kodjak, 2015.

                                          For the future, it is expected that if Turkey were to introduce mandatory CO2 emission
                                          standards, the annual CO2 emission reduction rate could be increased significantly.
                                          Simply applying the existing EU CO2 regulation to the Turkish market, however, would
                                          not result in significant additional CO2 reductions as the EU’s 95 g/km CO2 target
                                          for passenger cars for 2021 would translate into an approximately 3.4% annual CO2
                                          reduction for Turkey—not much higher than the current business-as-usual rate without
                                          any CO2 regulation. The same is true for the light commercial vehicle market.

                                          Two scenarios for the implementation of new vehicle CO2 standards for Turkey are
                                          assessed in more detail in the following. Scenario 1 assumes an annual CO2 reduction rate
                                          of 4.0%, similar to the reduction requirements in the U.S., Canada, Saudi Arabia, and the
                                          EU. At this rate of reduction, the average new vehicle CO2 emission level in Turkey would
                                          drop to 94 g/km by 2020 for cars and to 123 g/km for light commercial vehicles.

                                           4
REDUCING VEHICLE EMISSIONS IN TURKEY: POLICY MEASURES
Table 2. New vehicle fleet average CO2 emission levels in Turkey assuming reduction rates of 4.0%
and 6.0%.
New vehicle average CO2 emission level
Passenger cars Light commercial vehicles
Annual CO2 Scenario 1 Scenario 2 Scenario 1 Scenario 2
reduction: 4.0% 6.0% 4.0% 6.0%
2014 121 121 157 157
2015 116 113 151 148
2016 111 107 145 139
2017 107 100 139 130
2018 102 94 133 123
2019 98 89 128 115
2020 94 83 123 108
2021 91 78 118 102
2022 87 74 113 96
2023 84 69 109 90
2024 80 65 104 85
2025 77 61 100 79
In Scenario 2, an annual reduction rate of 6.0% is assumed, which falls between the current
requirements in South Korea and China. Under this scenario, the new vehicle fleet average
would decrease to 83 g/km by 2020 for cars and 108 g/km for light commercial vehicles.
The corresponding CO2 targets for other years can be found in Table 2.
2.2 INTRODUCING A CO2 STANDARD FOR NEW VEHICLES IN TURKEY
For a quantitative assessment of the implementation of a new vehicle CO2 standard
in Turkey, 2023 is purposefully selected as the target year to coincide with the 100th
anniversary of the Republic of Turkey. Reducing fuel consumption and CO2 emissions
of motorized vehicles is mentioned as one objective in the “Energy Efficiency Strategy
Paper 2012-2023,” which falls under the umbrella of the “Turkey 2023 Vision.” (EIE, 2012;
Foreign Affairs, 2013). With 2023 as the target year, the two scenarios described above
translate into a new car fleet CO2 target value of 84 g/km when assuming a 4.0% per
year CO2 reduction rate and 69 g/km when assuming a 6.0% per year reduction rate.
Figure 6 illustrates the current situation of the new passenger car market in Turkey by
including all vehicle model variants of which more than 100 vehicles were registered in
2014. Nine selected vehicle model variants were specifically highlighted. These models
include some of the top-selling models within their segment, all of them being diesel
powered except the Toyota Yaris, which was chosen as an example of a hybrid vehicle
that is available on the Turkish market.
5ICCT WHITE PAPER
200
Porsche Cayenne (D) EU 2015 target
(130 g/km)
175
CO2 emission level (g/km in NEDC)
150
EU 2021 target
BMW 525 (D) -4.0% p.a.,
(95 g/km)
125
VW Passat (D) Turkey 2023
Renault Fluence (D) -4.0% p.a.,
Fiat Egea (D) (84 g/km)
100 Turkey 2023
Renault Clio (D)
Peugeot 208 (D)
-6.0% p.a.,
Renault (69 g/km)
Mégane (D)
75 Toyota Yaris
(H)
50
AVERAGE VEHICLE
WEIGHT TURKEY
25
ALL VEHICLE MODELS WITH MORE THAN
100 REGISTRATIONS PER YEAR ARE SHOWN
0
500 1,000 1,500 2,000 2,500
Vehicle weight (kg)
Figure 6. New passenger car registrations in Turkey in 2014, differentiated by vehicle weight and
CO2 emission levels. Some selected vehicle models are highlighted.3 D indicates diesel power; H
indicates hybrid vehicle. Data source: ICCT, 2015a.
The 2015 and 2021 CO2 emission targets that apply to new passenger cars in the EU are
also shown. It can be seen that the majority of vehicle models registered in Turkey already
over-comply with the EU 2015 target line.4 Furthermore, some models already comply with
the CO2 emission target that will apply in the EU in 2021. Specific examples include the
Toyota Yaris hybrid, as well as variants of the Peugeot 208 and Renault Mégane.
Looking at the hypothetical target lines for a 2023 new car CO2 standard in Turkey, it
can be seen how these go one step beyond the current EU 2021 regulation, with an
underlying annual reduction rate of 4.0% or 6.0% compared to a 3.8% reduction rate in
the EU. At the same time it is noteworthy that already in 2014—nearly 10 years before
the standard would apply—some vehicle models, such as the Toyota Yaris hybrid,
already complied or nearly complied with the corresponding CO2 emission targets.
This observation is in line with the expectation that either 2023 CO2 standard proposed
for Turkey could largely be met by further improving conventional combustion engine
vehicles and also making use of the mild- and full-hybrid electric vehicle technology. The
introduction of a significant market share of fully electrified vehicles is not expected to
be required for meeting the assumed CO2 emission levels.
Figure 7 again illustrates the new car market situation in Turkey in 2014 but uses vehicle
size, expressed in terms of vehicle footprint, instead of vehicle weight as the underlying
parameter. This is in line with the CO2 target system in markets like the U.S. A key
benefit of a footprint-based CO2 target system is that it continues to encourage vehicle
lightweighting and thereby is more technology neutral than a weight-based CO2 target
3 The 2014 vehicle database was partially updated to reflect the technical specifications of some vehicle models
that were introduced more recently, such as the Fiat Linea.
4 The current vehicle CO2 emission standards in the EU for 2015 and 2021 use vehicle weight as the underlying
utility parameter. This means that the heavier a vehicle, the higher the CO2 emission level allowed.
6REDUCING VEHICLE EMISSIONS IN TURKEY: POLICY MEASURES
system. As a result, a footprint-based system increases the flexibility for manufacturers
and thereby reduces the cost for regulatory compliance (Mock, 2011).
200
Porsche Cayenne (D)
175
CO2 emission level (g/km in NEDC)
150
BMW 525 (D)
125 EU 2015 target
VW Passat (D)
-4.0% p.a.,
Renault Fluence (D) (95 g/km)
Fiat Egea (D)
Turkey 2023
100 Renault Clio (D) -4.0% p.a.,
Renault Mégane (D)
(84 g/km)
Peugeot 208 (D)
Turkey 2023
75 -6.0% p.a.,
Toyota Yaris (H) (69 g/km)
50
AVERAGE VEHICLE
SIZE TURKEY
25
ALL VEHICLE MODELS WITH MORE THAN
100 REGISTRATIONS PER YEAR ARE SHOWN
0
3.50 3.75 4.00 4.25 4.50 4.75 5.00
Vehicle footprint (m ) 2
Figure 7. New passenger car registrations in Turkey in 2014 differentiated by vehicle size (footprint)
and CO2 emission levels. Some selected vehicle models are highlighted. Data source: (ICCT, 2015a).
It can be seen that if the EU had set a footprint-based CO2 target for 2021, most of the
new car models in Turkey would have already over-complied with this target in 2014.
Similar to the graphical illustration for the weight-based target scheme, it can be seen
how a footprint-based CO2 standard for Turkey for 2023 would go beyond the current
EU regulation. At the same time some vehicle models, such as the Toyota Yaris hybrid,
would already today be in line or close to being in line with such a 2023 standard.
In a next step, the additional costs associated with the required technological
improvements to meet a 2023 CO2 standard in Turkey are estimated. The basis of
this assessment is a detailed analysis of the technology CO2 reduction potential and
manufacturing cost increase for a variety of vehicle technologies and technology
packages carried out by the engineering consulting providers Ricardo and FEV on behalf
of ICCT in 2011-2013, as well as an updated assessment carried out in 2015-2016.5 Figure
8 shows the simplified overall technology cost curve, derived as a high-level result from
the detailed technology assessments.
It can be seen that with a decreasing CO2 emission level the estimated additional
manufacturing cost increases disproportionately. For an average new car fleet CO2 target
of 84 g/km by 2023, which is equivalent to a 4% annual reduction rate, the additional
direct manufacturing cost is estimated to be around 2,400 Turkish Lira (TL) (720 euros).
For a target of 69 g/km, based on a 6.0% annual reduction rate, the additional cost is
around 3,800 TL (1,150 euros).
5 For the 2011-2013 work a summary document (Mock, 2013) and a library of detailed project reports
(http://www.theicct.org/cost-curves-resources) are available online. The detailed documentation of the
2015-2016 work is forthcoming.
7ICCT WHITE PAPER
It should be mentioned that the estimated cost levels are likely to be overly conservative
as previous studies indicate that technology cost levels tend to be overestimated, due in
part to unexpected advancements in the development and production of CO2 reduction
technologies over time (Mock, 2015a). Furthermore, for this technology cost curve
assessment it is assumed that all technologies are manufactured in Germany, implying
higher labor and overhead rates than if manufacturing the same technologies in Eastern
European countries or Turkey (Meszler et al., 2014).
5 years
Estimated additional total cost incl. SCT and VAT [TL]
8,000 10,000
(8,000 TL ≈ 2,400 EUR) (10,000 TL ≈ 3,000 EUR) 4 years
Estimated additional manufacturing cost [TL]
ANNUAL DRIVING: 15,000 KM -6.0% p.a.
FUEL PRICE: 4.95 TL/L (69 g/km)
8,000
6,000 3 years
6,000
-6.0% p.a. -4.0% p.a.
(69 g/km) (84 g/km)
4,000
4,000
-4.0% p.a.
(84 g/km)
2,000
2,000
0 0
0 20 40 60 80 0 20 40 60 80
g/km CO2 reduction in NEDC compared to 2010 baseline g/km CO2 reduction in NEDC compared to 2010 baseline
Figure 8. Summary curve of the CO2 reduction Figure 9. Summary curve of the CO2 reduction potential
potential and additional manufacturing cost for and additional total cost, including indirect cost and taxes,
passenger car technologies. for passenger car technologies as well as payback periods.
Figure 9 shows the same technology cost curve when it includes all indirect costs for
applying the technologies into the vehicle as well as a 45% special consumption tax
(SCT) and 19% value added tax (VAT). Comparing the estimated necessary investments
in improved technologies to the expected savings in fuel costs, it is found that for a 84
g/km CO2 standard in 2023 the payback period for the first owner of the vehicle would
be about four years.6 For a 69 g/km CO2 standard, the required technology level would
be higher, as would be the associated cost. Nevertheless, the expected payback period
would still be around five years. This means that after five years of driving, the total fuel
costs saved would be larger than the initial investment in advanced technologies. Over
the lifetime of the vehicle, for the second or third owner, the cumulative fuel cost savings
would greatly offset any initial technology investment.
Using the ICCT Global Transportation Roadmap Model (ICCT, 2015b) to assess the effect
of introducing a mandatory CO2 emission standard for new cars in Turkey on estimated
6 This is assuming an average annual mileage of 15,000 km as a best-guess estimate. Statistically robust data
on the average annual mileage of new cars in Turkey was not found to be available. Based on personal
communication (Jan. 19, 2016) with a representative of the Turkish automotive industry, the average annual
driving distance for new car owners in Turkey is around 17,000 km. Based on personal communication (April 6,
2016) with a representative of the Turkish government, the average annual driving distance for new car owners
in Turkey is around 10,000 km for gasoline, 12,000 km for diesel, and 20,000 km for liquefied petroleum gas
(LPG) vehicles. A preliminary assessment of secondhand cars’ data for Turkey within the scope of this study
indicates that the average annual mileage for gasoline cars of three to five years of age is around 13,000 km
and for diesel cars around 23,000 km. Furthermore, an average fuel price level of 4.95 TL (1.50 euros) per
liter is assumed. This is slightly higher than current levels in Turkey and a best-guess estimate for the further
development of fuel price levels in the ~2020 timeframe. Furthermore, estimates make use of a simplified
payback calculation approach, defined as the incremental additional vehicle cost divided by the undiscounted
annual fuel savings.
8REDUCING VEHICLE EMISSIONS IN TURKEY: POLICY MEASURES
fuel consumption yields predictable results. In a business-as-usual scenario, without a
CO2 standard and assuming a 1.0% annual new vehicle average emission reduction, the
daily fuel consumption for light-duty vehicles is expected to rise from about 83,000
barrels of oil equivalent per day in 2010 to 116,000 barrels per day by 2030 (Mock, 2016).
This is illustrated in Figure 10. Introducing a CO2 standard equivalent to 84 g/km for the
average new vehicle by 2023 would reduce the 2030 level to 98,000 barrels per day,
a 15% decrease compared to the business-as-usual scenario. With a 69 g/km standard
in place, the daily fuel consumption level would drop to about 87,000 barrels of oil
equivalent by 2030—25% lower than in the business-as-usual scenario.
125 25
LIGHT-DUTY VEHICLES LIGHT-DUTY VEHICLES
without
CO2 standard
CO2 emissions (tank-to-wheel in million metric tons per year)
Fuel consumption(thousand barrels of oil equivalent p. day)
100 20
-4% p.a.
(84 g/km by 2023)
-6% p.a.
(69 g/km by 2023)
75 15
50 10
25 5
vehicle kilometers travelled vehicle kilometers travelled
(going from 75 (2010) to (going from 75 (2010) to
165 (2030) billion km/a, 165 (2030) billion km/a,
axis not shown) axis not shown)
0 0
2010 2020 2030 2010 2020 2030
Figure 10. Estimated fuel demand from light-duty Figure 11. Estimated CO2 emissions from light-duty
vehicles in Turkey (2010-2030). vehicles in Turkey (2010-2030).
For CO2 emissions, the expected impacts are similar, with an increase from 15 million
metric tons per year in 2010 to 22 million metric tons per year by 2030 in a business-
as-usual scenario, as shown in Figure 11. Introducing an 84 g/km CO2 standard by 2023
would reduce the annual emission level to 19 million metric tons, down 15% relative to the
business-as-usual scenario, while a 69 g/km standard would bring emissions down 25%
to 17 million metric tons per year.
Figures 12 and 13 summarize the key impacts of introducing a mandatory new car
CO2 standard in Turkey. In a scenario with a 2023 target equivalent to 4% per year
CO2 reduction, the expected increase in total manufacturing costs of the vehicle is
approximately 4,500 TL (1,360 euros). This represents about 7% of the average new car
price in Turkey. It should be noted that given the experience with previous CO2 standards
it is unlikely that the full cost increase would be passed on to the end customer, thereby
resulting in vehicle price increases less than 7%. In comparison, fuel cost savings are
estimated to be around 1,570 TL (470 euros) per year. This is about 44% less than
current fuel costs for an average car driver in Turkey. Fuel consumption, and thereby oil
9ICCT WHITE PAPER
consumption, would decrease by around 19,000 barrels of oil equivalent per day in 2030.
The level of CO2 emissions per year would decrease by around 3 million metric tons, a
15% decrease compared to a business-as-usual scenario.
-4.0% p.a.
without CO2 standards
-3 million metric tons (15%) Annual CO2 emission reduction in 2030
-19,000 barrels (16%) Daily oil consumption equivalent savings in 2030
-1,574 TL (44%) Annual fuel cost savings per car
Added total manufacturing cost per car +4,495 TL (7%)
25% 50% 75% 100% 125% 150% 175%
Figure 12. Key impacts of introducing a 2023 CO2 standard equivalent to an annual CO2 reduction of
4.0% for new passenger cars in Turkey.
In a scenario with a 2023 CO2 standard in line with a 6% reduction per year, the expected
additional manufacturing costs would increase to about 10% of the average new car
price in Turkey while the expected fuel cost savings of 55% at the vehicle level and 25%
reductions in oil consumption and CO2 emissions at the fleet level of 25% would be even
more evident than in the previous scenario.
-6.0% p.a.
without CO2 standards
-5 million metric tons (24%) Annual CO2 emission reduction in 2030
-29,000 barrels (25%) Daily oil consumption equivalent savings in 2030
-1,960 TL (55%) Annual fuel cost savings per car
Added total manufacturing cost per car +7,116 TL (10%)
25% 50% 75% 100% 125% 150% 175%
Figure 13. Key impacts of introducing a 2023 CO2 standard equivalent to an annual CO2 reduction of
6.0% for new passenger cars in Turkey.
It should be noted that the benefits of a new car CO2 standard can be significantly
enhanced when combining the standard with other policy elements, such as vehicle CO2
labeling and CO2-based vehicle taxation (see Sections 3 and 4 for details).
Furthermore, it should be noted that while the analysis here was carried out for
passenger cars only, vehicle CO2 standards also can be introduced for light and heavy
commercial vehicles. In fact, given that light commercial vehicles account for about
15% of all new vehicle registrations in Turkey, it is important that these vehicles are not
10REDUCING VEHICLE EMISSIONS IN TURKEY: POLICY MEASURES
disregarded. Even more so, heavy-duty vehicles are responsible for more than half of
CO2 emissions from the transport sector in Turkey, with a strong expected increase in
future years. This is why the introduction of a mandatory CO2 standard for new heavy-
duty vehicles is a key pillar of transport policy in Turkey. However, an assessment of a
heavy-duty vehicle CO2 standard is outside the scope of this analysis.7
7 More information on the topic of CO2 emissions from heavy-duty vehicles and how mandatory CO2 standards
for new trucks and buses can help to reduce emission levels can be found, for example, in Muncrief and Sharpe
(2015).
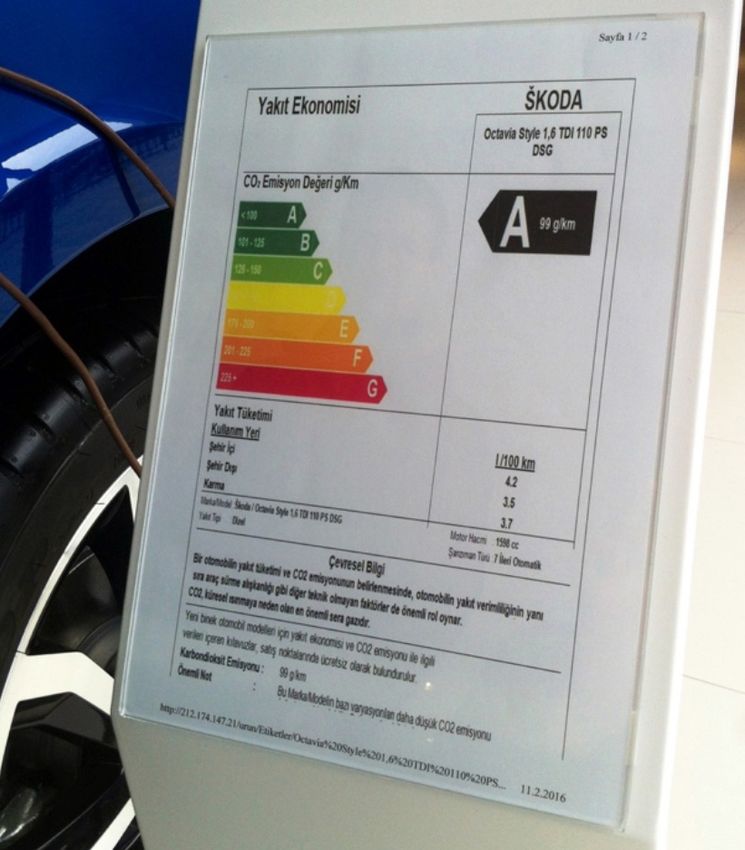
11ICCT WHITE PAPER 3 VEHICLE CO2 LABELING Vehicle CO2 labeling helps customers and informs their purchase behavior by providing data on the CO2 emission level of a vehicle in a more accessible and easier to understand format than would otherwise be the case. Furthermore, a standardized format allows for an easier comparison between different vehicles and ideally results in a situation where the customer chooses a vehicle with a lower CO2 emission level. 3.1 THE CURRENT SITUATION IN TURKEY Many countries worldwide have introduced vehicle labels showing CO2 emissions, equivalent fuel consumption or fuel efficiency, as a mandatory policy measure. In the U.S. and also in the United Kingdom (UK), vehicle labels were introduced as early as 1978. In the EU, vehicle CO2 labels have been required since 2001. In Turkey, a regulation similar to the one in the EU was published in December 2003, mandating CO2 labeling for new passenger cars from January 2009 onward (Mevzuat Bilgi Sistemi, 2003). Figure 14 shows the vehicle CO2 label that is currently in place in Turkey. In addition to basic technical information about the vehicle (make and model, fuel type, engine displacement, transmission type), the label includes data on the vehicle’s fuel consumption, in liters per 100 kilometers, when driven in inner-urban and extra-urban areas, as well as a weighted average of the different driving conditions. This information is provided according to the New European Driving Cycle (NEDC) test procedure. The average CO2 emission value of the vehicle is given in the form of an absolute number as well as a color rating. Every vehicle with a CO2 emission level of 100 g/km or below receives a dark green “A” rating; vehicles with CO2 emissions between 101 and 125 g/km get a light green “B” rating, and so on. The vehicle CO2 label in Turkey thereby applies a so-called “absolute” CO2 rating scheme, not normalizing for parameters such as vehicle weight, and allows customers to directly compare CO2 emission levels among all offered vehicles. Figure 14. New car CO2 label currently applied in Turkey. Source: Mevzuat Bilgi Sistemi, 2003. The CO2 label for new cars in Turkey must be clearly visible within the vicinity of the vehicle on sale. During a number of visits to new car showrooms of different brands in Istanbul in October 2015 and April 2016, all vehicles on sale had CO2 labels attached to them or placed close to the vehicle (for an example, see Figure 15). Similarly, when 12
REDUCING VEHICLE EMISSIONS IN TURKEY: POLICY MEASURES

visiting a number of new car showrooms in Berlin in September 2015, all vehicles for
sale had CO2 labels placed on or near them (for an example, see Figure 16). While
these random observations on a number of new car showrooms do not provide a
representative overview, they indicate that the CO2 labeling requirements are applied
in practice at least to some extent in Turkey as well as in the EU. In both markets the
respective regulations authorize appointed inspectors to regularly carry out spot checks
to supervise the enforcement of the CO2 labeling regulation. A more representative
overview of enforcement practices for the vehicle CO2 label in the EU can be found in a
2011 report for the European Commission (AEA, 2011).

Figure 15. Vehicle CO2 label in a showroom in   Figure 16. Vehicle CO2 label in a showroom in
Istanbul, Turkey. Photograph taken by author.   Berlin, Germany. Photograph taken by author.

In addition to the CO2 label itself at the point of purchase, the regulations in both Turkey
and the EU foresee additional ways of informing customers about the CO2 emission
levels of vehicles on offer. One way is providing data on vehicle CO2 emissions online
in the form of a website. In Turkey, the respective website is hosted by the Ministry for
Science, Industry and Technology (Bilim, Sanayi ve Teknoloji Bakanlığı). As Figure 17
shows, the website offers users the ability to filter for certain vehicles. However, when
accessing the website in February 2015 and in April 2016, this filtering function did not
work. A function to download a list of available vehicle models with their respective CO2
emission levels also did not work. The only function working properly was a list of the
top 10 vehicle models with the lowest CO2 emission levels by fuel type (Figure 18).

                                                                                            13
ICCT WHITE PAPER Figure 17. Welcome screen of a website hosted by the Turkish Ministry for Science, Industry and Technology to inform consumers about the CO2 emission levels of new passenger car models. Source: https://bim.sanayi.gov.tr/temp/ARAC_HALK_YENI. Figure 18. List of top 10 passenger car models with the lowest CO2 emission levels by fuel type (diesel fuel in this case). Source: https://bim.sanayi.gov.tr/temp/ARAC_HALK_YENI. When selecting one of the vehicle models, additional data on engine and transmission characteristics could be displayed, as well as the emissions data according to the NEDC test procedure, not only for CO2 but also for other pollutants (Figure 19). 14
REDUCING VEHICLE EMISSIONS IN TURKEY: POLICY MEASURES
Figure 19. Example of the information provided for a specific selected vehicle model to an interested
customer in Turkey. Source: https://bim.sanayi.gov.tr/temp/ARAC_HALK_YENI.
Given the technical problems with accessing the website itself as well as the design
layout, which was perceived as difficult to interpret by an average customer, it is
questionable if the current version of the website in Turkey is indeed successful in
providing useful information to potential customers and thereby allowing them to make
better informed purchase decisions.
3.2 BEST-PRACTICE EXAMPLES FROM WORLD MARKETS
The vehicle CO2 label and the information complementing it are not harmonized among
countries. Even within the EU, at this point the CO2 labeling directive provides only a
general framework, leaving the EU member states a significant level of freedom in terms
of how to design the layout of the label, the customer website, and so on.
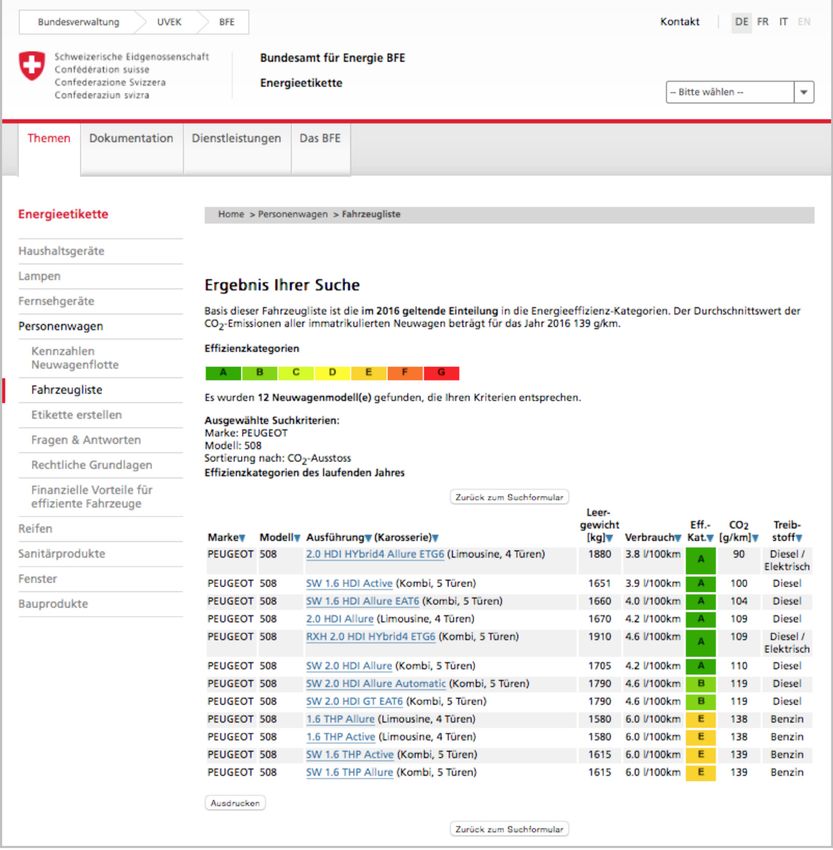
As a best-practice example of a website for consumer information, Figure 20 shows the
corresponding website in Switzerland, hosted by that country’s National Energy Agency
(Bundesamt für Energie). Here, the user has the possibility to filter for certain vehicles
using a number of available filter criteria. On the results page, all vehicles that fit within
the filter criteria are then shown in an easy-to-compare way, including their color code
ratings. For more information the customer can click on a specific vehicle to learn about
the full set of data available. All information is provided in a way that is clearly structured
and easy for the average consumer to understand.
15ICCT WHITE PAPER Figure 20. Best-practice example of a consumer information website on new car CO2 emission levels, hosted by the Swiss National Energy Agency. Source: http://www.bfe.admin.ch/ energieetikette/00962/00964/index.html?lang=de With respect to the CO2 label itself, the label being used in the UK is often referred to as a best-practice example. In comparison to labels in Turkey, a main difference is the fact that the UK label provides information on the estimated yearly running costs, expressed as the fuel costs over a vehicle mileage of 12,000 miles (Figure 21). In addition, the level of applicable vehicle registration and annual vehicle tax also is provided on the label. All of this financial information is prominently placed toward the center of the label, close to the color-coded ranking. Previous studies have found that consumers value this kind of quantitative information on running costs and taxation levels and that it can have a measureable impact on customer purchase behavior (LowCVP, 2010). 16
REDUCING VEHICLE EMISSIONS IN TURKEY: POLICY MEASURES

Figure 21. New car CO2 label in the UK, including explanation of key features.
Source: http://www.unep.org/transport/gfei/autotool/approaches/information/labeling.asp.

Similarly, the vehicle fuel economy label in the U.S. and the corresponding website of
the U.S. Department of Energy prominently feature information on the running cost of
a vehicle (Figure 22 and Figure 23). The information is compared to statistics on the
average new vehicle (e.g., “You save $[...] in fuel costs over 5 years compared to the
average new vehicle”). In addition to information on the official laboratory test fuel
efficiency of a vehicle, the U.S. website features unofficial estimates on the real-world
behavior of the vehicle.

In the example of the Toyota Prius below, the official fuel economy rating is 50 miles per
gallon (MPG), equivalent to about 4.7 l/100 km or 110 g/km of CO2. In comparison, based
on the reporting of 12 consumers who drive this specific Toyota Prius vehicle version, the
real-world fuel economy is 44.7 MPG (5.3 l/100 km, 123 g/km CO2). The data underlying
these real-world driving estimates are derived from input of more than 40,000 drivers
who regularly report about their everyday experience on the “My MPG” website,8 thereby
allowing other consumers to take into account these real-world figures for their own
vehicle purchases.

8   https://www.fueleconomy.gov/mpg/MPG.do

                                                                                           17
ICCT WHITE PAPER
Figure 22. Consumer website on new vehicle Figure 23. Consumer website on new vehicle
fuel economy levels, hosted by the U.S. energy consumption and air pollutant emission
Department of Energy. Source: http://www. levels, hosted by the U.S. Department of
fueleconomy.gov/feg/findacar.shtml. Energy. Source: http://www.fueleconomy.gov/
feg/findacar.shtml.
The most recent overview of vehicle CO2 labeling schemes across a number of countries
can be found in a November 2015 report for the Asia-Pacific Economic Cooperation
(APEC) (Yang et al., 2015). In addition, the Global Fuel Economy Initiative (GFEI) maintains
a website summarizing vehicle CO2 policy measures, including CO2 labeling schemes.9
Table 3 shows a comparative assessment of vehicle CO2 labeling schemes in selected
vehicle markets, taken from the 2015 APEC report. For this report, Turkey was added
to the original table to allow for a direct comparison with other markets worldwide. An
explanation of the rating system applied can be found in Table 19 of the APEC report
(Yang et al., 2015).
9 http://www.unep.org/transport/gfei/autotool/approaches/information/labeling.asp
18REDUCING VEHICLE EMISSIONS IN TURKEY: POLICY MEASURES
Table 3. Comparative evaluation of vehicle CO2 labeling schemes in selected markets.
Based on Yang et al., 2015.10
3-1. Understandable fuel efficiency/CO2
2-4. Accurate information that reflects
3-3. Comparable information for AFVs
5-1. Audits of vehicle fuel efficiency/
4-3. Direct communication channels
4-1. User-friendly website providing
1-1. Legislative/regulatory support
2-1. Mandatory VFEL requirement
3-2. Indication of running cost or
2-2. Broad coverage of the VFEL
5-2. Encourage and ensure label
1-2. Other fuel efficiency related
6-1. Periodic VFEL effectiveness
3-4. Specialized information for
vehicle real-world performance
2-3. Understanding the market
4-2. Mandatory fuel efficiency
financial penalties/rewards
information in other media
requirement compliance
advanced technologies
emissions information
CO2 emissions test
VFEL information
with consumers
assessment
program
policies
Turkey
Turkey
Other selected vehicle markets
Australia
Austria
Brazil
Canada
Chile
China
Germany
Japan
South Korea
Netherlands
New Zealand
United Kingdom
United States
Follows best practice, or Meets some best practices, Follows few or none of the best
Note
follows most best practices some room for improvement practices, with room for improvement
When comparing the current vehicle CO2 labeling scheme in Turkey to corresponding
schemes in other markets in Table 3, it is notable that the labeling scheme is not linked
to other fuel efficiency related policies, identified here as best practice 1-2. In particular,
there is no mandatory CO2 regulation for new cars in place in Turkey for which the CO2
label could help to leverage any effects on customer purchase behavior. Similarly, there
is no CO2-based vehicle taxation scheme in place in Turkey for which the CO2 label could
help to raise consumer awareness.
Ideally, all three elements—CO2 vehicle standards, CO2 vehicle labeling, and CO2-based
vehicle taxation—together would help to create a market “push” and “pull” situation
wherein low-CO2 vehicles would be produced and offered by vehicle manufacturers
(“push”) and those vehicles would be demanded and purchased by consumers (“pull”),
thereby leveraging the CO2 reduction effects of each of these individual policy measures.
An additional element missing from the CO2 labeling scheme in Turkey, compared to
other markets, is the indication of running costs or other financial parameters to the
customer, identified as best practice 3-2. This information would help consumers better
understand the financial implications of their purchase decisions and how low-CO2
emission vehicles help reduce their spending on fuel over the lifetime of the vehicle.
Improving the vehicle CO2 information website to be more user-friendly, best practice
4-1; providing an indication of real-world fuel consumption and CO2 emission data to
consumers, best practice 2-4; and providing special consideration of the efficiency of
advanced technologies, such as electric vehicles, best practice 3-4, are other important
elements where the CO2 labeling scheme in Turkey could be strengthened.
10 VFEL = Vehicle Fuel Efficiency Labeling; AFVs = Alternative Fuel Vehicles
19ICCT WHITE PAPER
4 CO2-BASED VEHICLE TAXATION
Most countries have implemented taxes on vehicle purchase and/or vehicle ownership.
Using a vehicle’s CO2 emissions as the basis for its taxation level results in a situation
where the customer pays less tax if the vehicle emits less CO2. As a result, there is an
incentive for customers to choose vehicles with lower CO2 emissions, thereby helping
to reduce the average CO2 emission level of the new vehicle fleet and also supporting
vehicle manufacturers in their attempt to sell vehicles with lower CO2 emissions.
4.1 THE CURRENT SITUATION IN TURKEY
New passenger cars in Turkey are subject to the general VAT (Katma Değer Vergisi—
KDV—in Turkish), which is 18% and applies to all goods. In addition, a special sales tax is
levied, the Motorlu Taşıt Araçlarına İlişkin Özel Tüketim Vergisi (ÖTV), also called Special
Consumption Tax (SCT). In addition to cars, ÖTV is levied upon some other goods
categories, such as petroleum products, tobacco, alcohol, and luxury products.
The amount of ÖTV to be collected depends on the vehicle’s engine displacement and
ranges from 45% to 145% of the net sales price, without taxes, as shown in Table 4. VAT
is then added to the sum of the net price and ÖTV, resulting in the gross sales price of
the vehicle. In addition to these taxes, which are applied once at vehicle purchase, all
passenger cars in Turkey are subject to an annual ownership tax, the Motorlu Taşıtlar
Vergisi (MTV). This annual tax is again linked to the engine displacement of the vehicle,
and it decreases with the age of the vehicle.
Table 4. Overview of passenger car vehicle taxes in Turkey in 2015. Data source: ACEA, 2015.
Ownership tax (“MTV”), annual (in TL),
Special sales Value-added
based on age of vehicle
Engine tax (“OTV”), tax (“KDV”),
displacement (l) one-time one-time year 1-3 year 4-6 year 7-11 year 12-15 more than 16
≤ 1.3 45% 591 412 231 175 63
of net sales
> 1.3 and ≤1.6 price 945 709 412 291 112
> 1.6 and ≤1.8 90% 1,667 1,304 786 469 182
of net sales 18%
> 1.8 and ≤2.0 price of net sales 2,626 2,024 1,189 709 280
price +
> 2.0 and ≤2.5 3,939 2,860 1,787 1,068 423
special sales
> 2.5 and ≤3.0 tax 5,491 4,777 2,985 1,607 591
145%
> 3.0 and ≤3.5 of net sales 8,362 7,524 4,553 2,263 831
price
> 3.5 and ≤4.0 13,147 11,352 6,686 2,985 1,189
> 4.0 21,516 16,135 9,556 4,296 1,667
The ÖTV in particular strongly influences customer purchase behavior. One indication is
the fact that 95% of all new cars in Turkey have an engine displacement of 1.6l or less. By
comparison, in the EU only about 70% of all new cars have 1.6l or smaller engines. In fact,
40% of cars in Turkey are right at the tax threshold of 1.6l, indicating the importance of
this step in the tax rate.
Figure 24 illustrates the current situation, using the example of a new car with a net
sales price of 66,000 TL (20,000 euros). The tax difference between a vehicle with a
1.6l engine and one with a 1.7l engine then is 29,700 TL (9,000 euros) if considering only
ÖTV and 31,866 TL (9,700 euros) if also taking into account MTV for the first three years
of ownership. This significant difference in taxation levels provides a strong incentive
for consumers to pick a vehicle with an engine displacement of 1.6l or less. A similar tax
threshold can be found at the 2.0l engine size. Again using the example of a 66,000
TL vehicle, the tax difference between a 2.0l and a 2.1l engine size amounts to 40,239
TL (12,200 euros). As a result, another clustering of new car sales around the 2.0l tax
20REDUCING VEHICLE EMISSIONS IN TURKEY: POLICY MEASURES
threshold is observed, accounting for nearly 5% of vehicle sales. Vehicles above the 2.0l
engine size are very rarely found in the Turkish new car fleet.
50% Registration + annual tax 120,000
Turkish Lira (20,000 TL ≈ 6,200 EUR) (for 3-years time period)
45% tax
threshold
1.6l 100,000
40%
fleet average 1.5l
Share of new car registrations
35%
Estimated tax level [TL]
80,000
30%
25% 60,000
20%
40,000
15%
10%
tax
20,000
threshold
2.0l
5%
0% 0
1 1.1 1.2 1.3 1.4 1.5 1.6 1.7 1.8 1.9 2 2.1 2.2 2.3 2.4 2.5 2.6 2.7 2.8 2.9 3
Engine displacement (liters)
Figure 24. Taxation levels for a 66,000 TL (20,000 euros) new car in Turkey and distribution of new
car sales by engine displacement. Data source: ICCT, 2015a; ACEA, 2015.
In order to assess the effect of the current vehicle taxation scheme in Turkey on
consumer prices, five vehicle models were selected and compared to the same vehicle
models in Germany, France, and the Netherlands. Each of the selected vehicle models is
the most popular model within its respective vehicle size segment.
The first three models—the VW Polo, Golf, and Passat—fall below the 2.0l threshold and,
therefore, in Turkey are subject to 45% ÖTV. It can be seen in Figure 25 how the impact
of ÖTV increases with vehicle value, which is highest for the Passat. In Germany, there
is no vehicle sales tax equivalent to the ÖTV in Turkey. In France, a vehicle sales tax is in
place but applies only to vehicles above 130 g/km of CO2. As all of the vehicle models
examined are below this CO2 threshold, they are not subject to a sales tax in France. In
the Netherlands, vehicle sales tax is linked to the vehicle’s CO2 emissions. CO2 emission,
and thus sales tax, is lowest for the VW Polo but increases significantly with the other
vehicle models examined. An annual vehicle ownership tax does not exist in France
and ownership tax rates are very low in Turkey, Germany, and the Netherlands when
compared to the sales price of the vehicle. VAT rates are similar in all four markets.
The fourth vehicle, again a VW Passat, falls above the 2.0l engine displacement tax
threshold in Turkey and, therefore, is subject to 90% ÖTV. The impact of the ÖTV is
even stronger in the case of the fifth vehicle, a 3.0l engine Mercedes-Benz E350. In
comparison, these two vehicles in France are neither subject to a sales tax nor a high
annual tax, only to a minimal annual ownership tax. In the Netherlands, the sales tax
increases notably for the 2.0l VW Passat and the E350. It is, however, still only about half
of the tax level in Turkey for the Passat and about one-fifth for the E350.
Overall, it can be seen that gross vehicle prices, which include taxes, for the vehicles
below 1.6l engine size are relatively similar for Turkey, Germany, and France, with the
prices in the Netherlands being notably higher than in the other three markets. For
21You can also read