Study on the Economic Contribution of the Motion Picture and Television Industry in Australia - Report presented to the MPA and ANZSA by Olsberg SPI
←
→
Page content transcription
If your browser does not render page correctly, please read the page content below
Study on the Economic
  Contribution of the Motion
  Picture and Television
  Industry in Australia

 Report presented to the MPA
 and ANZSA by Olsberg•SPI

13th November, 2019
Economic Contribution of the Motion Picture and Television Industry in Australia

CONTENTS

1.     Executive Summary .................................................................................................................. 4
     1.1.   Purpose of the Report ......................................................................................................... 4
     1.2.   Summary of Key Findings ................................................................................................... 5
     1.3.   Current Economic Impacts (2017-18)...................................................................................6
     1.4.   A Recent Period of Intense Change in the Screen Sector ..................................................... 7
     1.5.   Expectation of Continued Growth Across the Sector........................................................... 8
     1.6.   Measures to Enhance Future Potential................................................................................ 8
2.     Methodology of the Study ...................................................................................................... 10
     2.1.   Note on Terminology........................................................................................................ 10
3.     Summary of Quantitative Findings ......................................................................................... 11
     3.1.   Output .............................................................................................................................. 11
     3.2.   GVA .................................................................................................................................. 12
     3.3.   FTE Jobs ........................................................................................................................... 13
     3.4.   Wages .............................................................................................................................. 14
     3.5.   Taxation ........................................................................................................................... 15
4.     Production .............................................................................................................................. 17
     4.1.   Introduction ...................................................................................................................... 17
     4.2.   Film Production ................................................................................................................ 17
     4.3.   TV Production................................................................................................................... 23
     4.4.   Online Drama Production ................................................................................................. 26
5.     Distribution ............................................................................................................................ 31
     5.1.   Introduction ...................................................................................................................... 31
     5.2.   Film Distribution ............................................................................................................... 31
     5.3.   TV Distribution ................................................................................................................. 34
     5.4.   Online Distribution ........................................................................................................... 37
6.     Exhibition ............................................................................................................................... 41
     6.1.   Introduction ...................................................................................................................... 41
     6.2.   Film Exhibition .................................................................................................................. 41
7.     Television Broadcast ............................................................................................................... 45
     7.1.   Introduction ...................................................................................................................... 45
     7.2.   Television Broadcast ......................................................................................................... 45
8.     Home Entertainment and VOD ............................................................................................... 49
     8.1.   Introduction ...................................................................................................................... 49
     8.2.   Film Home Entertainment ................................................................................................ 49
     8.3.   TV Home Entertainment................................................................................................... 52
     8.4.   VOD Platforms ................................................................................................................. 54

© Olsberg•SPI 2019                                         13th November, 2019                                                                     ii
Economic Contribution of the Motion Picture and Television Industry in Australia
9. UK Policy Comparison ............................................................................................................ 59
9.1. Evolution of UK Film Policy ............................................................................................... 59
9.2. Impact of UK Film Policy ................................................................................................... 60
9.3. Australian IP Policy ........................................................................................................... 61
10. Appendix 1 – Methodological Approach ................................................................................. i
10.1. Data Sources ....................................................................................................................... i
10.2. Analysis Model .................................................................................................................... i
11. Appendix 2 – Bibliography ................................................................................................... iv
12. Appendix 3 – List of Tables ................................................................................................... vi
© Olsberg•SPI 2019 13th November, 2019 iiiEconomic Contribution of the Motion Picture and Television Industry in Australia
1. EXECUTIVE SUMMARY
The Australian Screen Sector has responded well to the challenges posed by the internet,
which have resulted in a variety of changes to the sector’s production and distribution
model. The sector’s 2017-18 gross value add was up 15% compared to 2012-13, whilst
overall employment was down 6% over the same period. This was driven by a shift away
from distribution of physical discs to digital distribution, both in transactional and
subscription models. Retail jobs were lost as the sector shifted towards digital, with more
value added in production (up 31%) and digital VOD distribution, leading to a 23% overall
improvement in gross value add contribution per employee in the screen sector compared
to 2012-13.
It is notable that this transformation was achieved despite a limited contribution of
international production taking place in Australia in 2017-18. This was the result of the lack
of competitiveness of Australia’s incentive scheme due to the lack of availability of top-up
grants that year. Whilst the establishment of the Location Incentive in May 2018 has
already resulted in a significant turnaround in international investment in Australia, the
capped nature of the incentive will mean that the 2016-17 peak will not be equalled in the
next four years.
The capped nature of the Location Incentive compares unfavourably with international
comparators such as the UK’s tax reliefs, while IP enforcement in Australia continues to
limit the ability of creators to monetise their content. While this remains the case, spending
and jobs increases will continue to fall behind countries such as the UK and Canada.
1.1. Purpose of the Report
This report presents the findings of a Study of the Economic Contribution of the Motion Picture
and Television Industry in Australia (Screen Sector), conducted for the Motion Picture
Association (MPA) and Australia New Zealand Screen Association (ANZSA) by the
independent consultancy Olsberg•SPI.
The Screen Sectors have been analysed according to the following industry sub-sectors:
• Production;
• Distribution;
• Cinema exhibition;
• Television broadcast; and
• Home entertainment, including physical purchases and rentals, and Video on Demand
(VOD).
The economic measures that have been assessed for each segment are:
• Output, the total spending associated with the sector;
• Gross Value Added, a measure of goods and services provided in a geographical area,
industry, or sector of the economy;
• Full-Time Equivalent (FTE) job creation, which is used given the freelance nature of the
workforce, and standardises employment to the average annual workload of a full-
time employee;
• Wages, including Pay-as-you-Go taxation and superannuation payments, to these FTE
employees; and,
• Taxation, at federal and state level in Australia.
© Olsberg•SPI 2019 13th November, 2019 4Economic Contribution of the Motion Picture and Television Industry in Australia
The core year which has been analysed is 2017-18. To assess the extent of growth in recent
times, the report also looks back to 2012-13, analysing data from the previous point at which a
similar study was undertaken, but using our current methodology to ensure comparability.
To present a sense of the future potential of the Screen Sectors, this report makes conservative
estimates of likely activity for all segments, for each of the three years to 2021-22.
To bring additional context to the findings, we have also conducted a number of case studies
concerning a selection of businesses and related issues in Australia’s Screen Sector, which are
contained in relevant parts of the report. Finally, to provide some international context, the
report also contains a policy comparison with the highly-successful screen industries in the UK.
1.2. Summary of Key Findings
This report shows that the screen sectors in Australia generated an important economic
contribution to the Australian economy in 2017-18, showing total GVA growth of 15% from
2012-13, despite the ongoing impacts of digitisation, which have had a fundamental and
disruptive impact on how consumers access films and TV.
This is reflected in metrics for the home entertainment industry, where the 36% growth in GVA
contribution has come from the transition away from physical purchases and rentals (the latter
has almost completely disappeared) into a fast-growing VOD sector. This growth is a strong
example of the industry’s quick and efficient response to the disruption caused by the internet.
Additionally, across the screen industries, the value added per employee was up 23%,
reflecting the efficiency of the more streamlined distribution model ushered in by this digital
growth, which has economic benefits for consumers, though it has led to the loss of jobs in
some areas such as distribution and retail.
Analysis of production activity presents a more nuanced picture. While both employment and
value added were up (9% and 31% respectively) in the production sector between 2012-13 and
2017-18, production activity fell from 2016-17 – primarily a result of government policy, with
the removal of the previous, discretionary ‘top-up’ programme at the federal level for
international location shoots saw this activity dry up completely, which caused a 53% decrease
in film production spending.
The ad-hoc approach of the top-ups is being replaced from 2018-19 with a structured increase
to the Location Offset through the introduction of a new Location Incentive, that combines
with the Offset to provide a 30% grant equivalent which could incentivise a potential A$260
million of production spend per year on average.1
We estimate, this new policy could drive a projected 26% growth over the next three years in
total output associated with the production spend. But despite this anticipated future growth,
production spending will still fall short of the heights seen in 2016-17, as the capped budget for
the Location Incentive effectively caps the amount of inbound investment that can be
attracted.
Separately, we anticipate that revenues are projected to grow 13% in exhibition, in home
entertainment by 14%, and in broadcast by 4% over the same period.
1
The Location Incentive provides A$140 million of total incentive over four years, at a rate of 13.5% (on top of the
16.5% Location Offset); assuming each year sees the same production spend attracted, this funding can incentivise
a net A$260 million of production per year
© Olsberg•SPI 2019 13th November, 2019 5Economic Contribution of the Motion Picture and Television Industry in Australia
The one sector which sits apart from this is distribution, which will continue to shrink to 2021-
22, as a result of the ongoing digital transformation of the sector. While theatrical distribution
is expected to remain relatively solid, physical home entertainment is being rapidly displaced
by VOD. However, we anticipate that the distribution sector will return to growth during the
early 2020s.
Production growth compares unfavourably with the UK, where a range of uncapped incentives
have driven a 13.6% CAGR increase in incentive-supported production spend between 2013
and 2018.2 By comparison, since 2012-13, growth in production spend of feature film and TV
drama in Australia has been negative – at -0.4% CAGR – with 2016-17’s strong film production
results having been an outlier.
Aside from this consistency in incentive policy, the UK was much earlier to provide a range of
strong IP enforcement policies to support to the sector, including strong site-blocking tools, a
voluntary agreement with search engines, and a dedicated IP crime unit. Australia’s recent
reforms to the Copyright Act move domestic IP law closer to the UK’s benchmark.
1.3. Current Economic Impacts (2017-18)
In 2017-18, the Australian screen industries generated a total output of A$22.50 billion,
generating A$9.19 billion in Gross Value Added (GVA), and 84,982 total FTE jobs. A$2.59 billion
in taxation was associated with the activities of the sector.
Table 1 – Screen Sector Impacts in Australia, 2017-18
Direct Indirect Induced Total
Output (A$, m) 8,077.6 7,270.9 7,155.3 22,503.8
GVA (A$, m) 3,305.8 2,960.3 2,920.7 9,186.9
FTE Jobs 24,771 30,163 30,047 84,982
Wages (A$, m) 1,385.4 1,713.7 1,545.3 4,644.4
Taxation (A$, m) 932.2 834.8 823.6 2,590.6
Source: Olsberg•SPI analysis
NB: numbers may not sum due to rounding
The TV broadcast sector was a key driver of this success, having delivered A$10.82 billion of
the total output in the sectors, and A$4.87 billion in GVA. The production sector, however, had
a greater impact on Full-Time Equivalent (FTE) jobs, generating 26,570.
Film exhibition also had a good year, generating A$1.92 billion in total output, and 11,137 total
FTE jobs, while home entertainment showed strong growth from 2012-13 as a result of the
expansion in SVOD. Distribution, however, continues to struggle, reflecting the ongoing
impact of digitisation and changing consumer behaviour in this part of the market.
2
CAGR refers to Compound Annual Growth Rate, which represents the annualised growth rate between the first
and last points in a dataset
Source: Screen Business, Olsberg•SPI with Nordicity (October, 2018)
© Olsberg•SPI 2019 13th November, 2019 6Economic Contribution of the Motion Picture and Television Industry in Australia
Table 2 – Total Impacts in Australia by Sector, 2017-18
Produc- Distribu- Exhibi- Broad- Home Total
tion tion tion cast Enter-
tainment
Output (A$, m) 4,571.4 2,433.5 1,916.1 10,816.4 2,766.4 22,503.8
GVA (A$, m) 1,638.0 872.0 686.6 4,870.1 1,120.1 9,186.9
FTE Jobs 26,570 14,144 11,137 22,987 10,143 84,982
Wages (A$, m) 1,007.7 536.4 422.4 2,168.5 509.4 4,644.4
Taxation (A$, m) 461.8 245.9 193.6 1,373.4 315.9 2,590.6
Source: Olsberg•SPI analysis
NB: numbers may not sum due to rounding
1.4. A Recent Period of Intense Change in the Screen Sector
This change has affected the various components of the Australian screen sector in different
ways, with distribution seeing the largest decline compared to 2012-13. By contrast,
production, broadcast, and home entertainment are all increasing, the former two driven by a
growth in domestic content creation, and the latter two by the transition to digital, and the
changing audience demands which this has created.
Table 3 – Comparison of Screen Sector Output in Australia (A$, m), 2012-13 and 2017-18
Comparison
Direct Indirect Induced Total
to 2012-13
Production 1,601.1 1,515.4 1,454.9 4,571.4 17%
Distribution 852.3 806.7 774.5 2,433.5 -18%
Exhibition 671.1 635.2 609.9 1,916.1 8%
Home 1,200.1 791.3 775.0 2,766.4 9%
Entertainment
Broadcast 3,753.0 3,522.4 3,540.9 10,816.4 23%
Total 8,077.6 7,270.9 7,155.3 22,503.8 13%
Source: Olsberg•SPI analysis
NB: numbers may not sum due to rounding
Growth in the home entertainment sector reflects the changing shape of the media market in
Australia, with physical sales declining rapidly, and physical rental almost entirely
disappearing. In their place, VOD (particularly SVOD) services have proven highly popular,
providing an ever-increasing selection of content to Australian audiences, and delivering much
stronger GVA returns to the economy than the physical home media models they have
replaced.
While the production component of the sector appears strong, in reality the story is more
complex. The production of screen content in Australia saw a boom in 2016-17, driven by the
availability of a variety of selective Federal and State top-up grants which, when used, had the
effect of improving the strength of the Location Offset’s offer. This allowed Australia to exploit
its wide range of competitive advantages for screen production.
© Olsberg•SPI 2019 13th November, 2019 7Economic Contribution of the Motion Picture and Television Industry in Australia
This funding did not continue to the same extent the following year, and consequently total
production levels dropped 13% between 2016-17 and 2017-18, leading to similar falls in
economic impacts, driven predominantly by the 40% decrease in feature film and TV drama
production.
1.5. Expectation of Continued Growth Across the Sector
This top-up system has now been replaced with the Location Incentive, a 13.5% capped grant,
which provides additional funding to successful applicants fulfilling selected criteria, and can
support annualised average production spend of A$260.0 million between 2018-19 and 2021-
22. This will stimulate an increase in total production spend in Australia, which we anticipate
will reach A$3.92 billion by 2021-22, an increase of 26% from 2017-18.
Table 4 – Projected Screen Sector GVA in Australia (A$, m), 2021-22
Comparison
Direct Indirect Induced Total
to 2017-18
Production 722.4 683.8 656.5 2,062.7 26%
Distribution 300.5 284.4 273.1 858.1 -2%
Exhibition 271.3 256.8 246.6 774.7 13%
Home 618.2 355.9 341.7 1,315.8 17%
Entertainment
Broadcast 1,768.3 1,673.7 1,606.9 5,049.0 4%
Total 3,680.8 3,254.5 3,124.8 10,060.2 10%
Source: Olsberg•SPI analysis
NB: numbers may not sum due to rounding
Such increased production spend will drive strong growth in the economic impact of the
production sector, while home entertainment is also projected to grow fast, as Australian
consumers continue to benefit from the digital transition, and the introduction of new VOD
services. Cinema exhibition is also projected to grow strongly from a revenue perspective.
We anticipate that Australia’s broadcast sector will grow marginally over the period, though
exceptional events such as the 2020 Tokyo Olympics may stimulate significant expansion.
While distribution – which as we note comprises one mature segment in theatrical exhibition,
and one declining in DVD/Blu-ray – will shrink over the period in aggregate, analysis suggests
that by 2021-22, the impact of digitisation will have been fully digested, and growth should
restart shortly thereafter.
1.6. Measures to Enhance Future Potential
While this growth is positive, and welcomed by the Australian screen sectors, data from the UK
shows that with consistent policies to support and develop the industry, much more consistent
growth could be achieved. Compared with Australia, the UK operates a straightforward,
unlimited incentive system for both domestic and international productions, and this has
driven strong growth in production spend, job creation, and GVA impact over the last decade.
During the period from 2012-13 to 2017-18, total production spend in Australia has shrunk at
an average 0.4% per year, the UK has achieved 13.6% growth, with footloose production –
projects which have the choice to locate in a variety of production territories – driving this. Such
production spend has contributed to a fast-growing screen sector workforce – with FTEs
impacted by incentive-supported productions equalling Australia’s total industry – and strong
© Olsberg•SPI 2019 13th November, 2019 8Economic Contribution of the Motion Picture and Television Industry in Australia
growth in taxation income. This has led to a situation in which the film and high-end TV drama
components of screen sectors make up 0.33% of the entire UK economy, whereas Australia’s
production sector comprises just 0.09%.
This success has been protected by a world-leading Intellectual Property (IP) regime, which
comprises a mixture of legal tools (in particular site-blocking, which was in place four years
prior to its introduction in Australia in 2015), a strong and well-funded IP crime unit (PIPCU).3
As early as 2011, the UK Government urged search engines to do more to disrupt access to
infringing content. Provision of a suite of measures ensures that creative businesses of all sizes
are able to protect their IP in the UK, and safeguards investment.4
Australia is moving in this direction with recent reforms to the Copyright Act particularly
welcome, and the ACCC’s preliminary recommendation to have ACMA develop a mandatory
code clarifying what platforms are required to do under threat of being held liable an
encouraging development.
It’s not possible to estimate the full impacts which these changes would have in Australia, but
an uncapped incentive, with strong support for the IP rights of the industry, would be an
invaluable contribution to the next decade of growth in the sector. Support for IP rights, in
particular, is hard to quantify, but in other territories it has been critical in providing investors
with the confidence to invest more in screen infrastructure and production, increasing the
value of the industry, and presenting the country around the world.
3
PIPCU’s website is available at: https://www.cityoflondon.police.uk/advice-and-support/fraud-and-economic-
crime/pipcu/Pages/default.aspx
4
Although of course overall revenues for productions derive from global exploitation, and thus stronger
international enforcement remains a policy priority for the UK for example.
© Olsberg•SPI 2019 13th November, 2019 9Economic Contribution of the Motion Picture and Television Industry in Australia
2. METHODOLOGY OF THE STUDY
To deliver the analysis contained in this report, Olsberg•SPI undertook a methodological
approach which we have previously used in a variety of locations, including Ireland, the UK, the
state of Georgia (US) and Malaysia, which was adapted for the specific data available in
Australia.
We began by collecting data from a variety of sources in Australia, including:
• The Australian Bureau of Statistics (ABS);
• Screen Australia;
• Motion Picture Distributors Association of Australia (MPDAA);
• Australian Home Entertainment Distributors Association (AHEDA);
• IBIS World; and,
• Australia’s broadcasters
These data predominantly related to turnover and consumer spending in the sectors studied,
and were analysed using Input-Output (I-O) tables produced by the ABS. A full outline of our
methodology can be found in Appendix 1 of this Study.
In presenting our findings, we use one decimal place for all figures in tables, with the exception
of FTE Jobs. As these relate to employment figures, whole numbers are used. Within the text,
figures in millions are presented to one decimal place, and figures in billions to two.
The reader should also note that where projections are made on future impacts, the year 2018-
19 is not included. At the time of writing, this year had recently finished, but data were not yet
available ot the research team.
2.1. Note on Terminology
Throughout this report, we use the term ‘output’ to relate to expenditure relating to the sub-
sector of the creative economy being analysed. This is divided into direct and indirect output,
which represent the expenditures – also referred to as ‘turnover’ – by companies or projects
operating in each sector, and induced outputs, relating to the re-spending of wages.
This is demonstrated in the film and TV production sector, where production spending (i.e., the
budget of the content) is split between direct output, largely the hiring of cast and crew directly
by projects, and indirect output relating to the supply of goods and services; induced output
relates to the re-spending of wages in the wider economy by direct and indirect employees.
Our other findings are calculated by reference to these outputs.
For the purposes of this report, the term ‘VOD’ (Video on Demand) is used to refer collectively
to a range of different business activities. VOD includes a range of sub-sections – including
Transactional VOD (‘TVOD’), Subscription VOD (‘SVOD’), and Advertising-supported VOD
(‘AVOD’). Where we refer to VOD, this refers to all of these elements collectively.
TVOD can be further broken down into Electronic Sell-Through (‘EST’) and Download to Rent
(‘DTR’), but we do not use these terms in this report.
© Olsberg•SPI 2019 13th November, 2019 10Economic Contribution of the Motion Picture and Television Industry in Australia
3. SUMMARY OF QUANTITATIVE FINDINGS
This chapter summarises our economic impact findings for the Australian screen sectors in
2017-18. A comparison with 2012-13 – the previous year for which this study was produced
– is provided, together with our projections for impacts in 2021-22, the final year of the
recently-introduced Location Incentive.
3.1. Output
3.1.1. 2017-18
Total screen sector output in 2017-18 is estimated at A$22.50 billion, an increase of 13% from
2012-13. This was driven by growth in the production, broadcast, and home entertainment
sectors. Production growth was focused on increased content spending as a result of domestic
productions, while home entertainment benefitted from the transition to VOD services, which
generate more consumer spending in Australia than the physical rental they replaced.
Table 5 – Screen Sector Output in Australia (A$, m), 2017-18
Comparison
Direct Indirect Induced Total
to 2012-13
Production 1,601.1 1,515.4 1,454.9 4,571.4 17%
Distribution 852.3 806.7 774.5 2,433.5 -18%
Exhibition 671.1 635.2 609.9 1,916.1 8%
Home 1,200.1 791.3 775.0 2,766.4 9%
Entertainment
Broadcast 3,753.0 3,522.4 3,540.9 10,816.4 23%
Total 8,077.6 7,270.9 7,155.3 22,503.8 13%
Source: Olsberg•SPI analysis
NB: numbers may not sum due to rounding
Despite this strong growth, production spending was down on their outcomes for 2016-17, by
13%. This resulted from the major falls in international production spend in Australia caused by
the withdrawal of the top-up system, which made Australia’s incentive scheme internationally
uncompetitive.
3.1.2. 2021-22 Projections
The former federal top-ups have been replaced, at least in part, by the introduction of the
Location Incentive in the current fiscal year. This secondary incentive for footloose production
attracted to Australia provides an effective combined 30% incentive for up to A$260,0 million
of eligible production spend per year, and is generating greater interest in Australia as a
production destination. The recent extension of the PDV and Location Offsets to VOD services
has already resulted in announcements for several major projects, and will strongly benefit the
production sector, leading to a projected 26% growth in overall spending, with online
production growing by a projected 354%.
Together with ongoing growth in the VOD sector of Home Entertainment, the continuing
strength of the Exhibition sector in Australia, and anticipated growth in Broadcasting, we
project a 10% increase in the output of the Australian screen sectors to 2021-22. Distribution
turnover is expected to continue falling to 2021-22, but is expected to return to growth at some
© Olsberg•SPI 2019 13th November, 2019 11Economic Contribution of the Motion Picture and Television Industry in Australia
point over the next few years, as the impacts of digitisation on this part of the sector are fully
realised.
Table 6 – Screen Sector Output in Australia (A$, m), 2021-22
Comparison
Direct Indirect Induced Total
to 2017-18
Production 2,016.1 1,908.2 1,832.1 5,756.5 26%
Distribution 838.7 793.8 762.1 2,394.6 -2%
Exhibition 757.2 716.7 688.1 2,161.9 13%
Home 1,449.3 862.6 828.2 3,140.1 14%
Entertainment
Broadcast 3,927.4 3,717.2 3,569.0 11,213.6 4%
Total 8,988.8 7,998.4 7,679.5 24,666.8 10%
Source: Olsberg•SPI analysis
NB: numbers may not sum due to rounding
While this represents strong growth from the most recent year, production spending – the
largest driver – will not expand so strongly compared to 2016-17. Film production spending in
particular is projected to decrease by 18% – from A$927.0 million to A$760.1 million – inhibited
by the cap on the Offset. Sectoral growth will instead be driven by expansions in the TV
production industry (up 14%), particularly outside drama, and in online (824%).
3.2. GVA
3.2.1. 2017-18
Output related to the screen sectors in Australia resulted in strong GVA growth, with a total of
A$9.19 billion representing a 15% increase over 2012-13. This was driven by broadcast and
production, though as with output, production impacts were down on 2016-17.
Table 7 – Screen Sector GVA in Australia (A$, m), 2017-18
Comparison
Direct Indirect Induced Total
to 2012-13
Production 573.7 543.0 521.3 1,638.0 31%
Distribution 305.4 289.0 277.5 872.0 -8%
Exhibition 240.5 227.6 218.5 686.6 20%
Home 496.4 314.7 309.0 1,120.1 36%
Entertainment
Broadcast 1,689.8 1,586.0 1,594.3 4,870.1 12%
Total 3,305.8 2,960.3 2,920.7 9,186.9 15%
Source: Olsberg•SPI analysis
NB: numbers may not sum due to rounding
© Olsberg•SPI 2019 13th November, 2019 12Economic Contribution of the Motion Picture and Television Industry in Australia
3.2.2. 2021-22 Projections
We project that the introduction of the Location Incentive and the continuing growth of the
VOD sector in Australia will drive GVA growth in production and home entertainment to 2021-
22, with these elements forecast to be up 26% and 17% respectively. Combined with increasing
economic activity in the film exhibition and broadcast segments of the market, the total
economic contribution of the sector is projected to increase 10% by the final year of the
Location Incentive programme.
Table 8 – Screen Sector GVA in Australia (A$, m), 2021-22
Comparison
Direct Indirect Induced Total
to 2017-18
Production 722.4 683.8 656.5 2,062.7 26%
Distribution 300.5 284.4 273.1 858.1 -2%
Exhibition 271.3 256.8 246.6 774.7 13%
Home 618.2 355.9 341.7 1,315.8 17%
Entertainment
Broadcast 1,768.3 1,673.7 1,606.9 5,049.0 4%
Total 3,680.8 3,254.5 3,124.8 10,060.2 10%
Source: Olsberg•SPI analysis
NB: numbers may not sum due to rounding
3.3. FTE Jobs
3.3.1. 2017-18
Job creation associated with the screen sectors totalled 84,982 in 2017-18, a 6% fall from the
figures seen in 2012-13. This was predominantly driven by changes in the distribution and
exhibition sectors, which are continuing to adapt to the demands of a more digital industry,
and the home entertainment sector, where labour-intensive retail and rental operations have
been replaced by VOD services, which employ fewer, but more highly-skilled individuals.
Overall, the impact has been the generation of higher productivity jobs across the sector.
Table 9 – Screen Sector FTE Job Creation in Australia, 2017-18
Comparison
Direct Indirect Induced Total
to 2012-13
Production 7,526 9,646 9,399 26,570 9%
Distribution 4,006 5,135 5,003 14,144 -23%
Exhibition 3,155 4,043 3,940 11,137 0%
Home 2,935 3,622 3,587 10,143 -35%
Entertainment
Broadcast 7,150 7,718 8,119 22,987 10%
Total 24,771 30,163 30,047 84,982 -6%
Source: Olsberg•SPI analysis
NB: numbers may not sum due to rounding
© Olsberg•SPI 2019 13th November, 2019 13Economic Contribution of the Motion Picture and Television Industry in Australia
3.3.2. 2021-22 Projections
We project that the number of FTE jobs associated with the screen sectors will increase 10% to
2021-22, with expansions in the production, exhibition, and broadcast spaces but continued
falls in home entertainment and distribution. The marginal overall fall reflects the fact that
higher-productivity jobs in production, broadcast, and VOD are replacing lower productivity
retail positions, which predominate especially in-home entertainment.
Production-related jobs are expected to reach a higher level than 2016-17, the peak year of
spending, as a result of ongoing growth in domestic production, strong growth in the VOD
sector, and the attraction of international projects which aren’t sensitive to incentives. This
said, we anticipate that this peak is lower than it would have been in the case of an uncapped
30% incentive; the 26% projected growth rate is also much lower than the 62% increase in total
FTE jobs observed in the UK – where the incentive is uncapped – between 2013 and 2016.5
Table 10 – Screen Sector FTE Job Creation in Australia, 2021-22
Comparison
Direct Indirect Induced Total
to 2017-18
Production 9,477 12,146 11,835 33,458 26%
Distribution 3,942 5,053 4,923 13,918 -2%
Exhibition 3,559 4,562 4,445 12,566 13%
Home 2,780 3,356 3,356 9,493 -6%
Entertainment
Broadcast 7,482 8,077 8,497 24,056 5%
Total 27,241 33,193 33,056 93,490 10%
Source: Olsberg•SPI analysis
NB: numbers may not sum due to rounding
3.4. Wages
3.4.1. 2017-18
Wages associated with this labour totalled A$4.64 billion in 2017-18, a 16% increase over the
period of the previous study. Production and exhibition drove this increase, while home
entertainment stayed flat, despite the 6% reduction in FTE numbers; this reflects the change
from low- to high-productivity jobs we note above.
5
Screen Business, Olsberg•SPI with Nordicity (October 2018) p. 13
© Olsberg•SPI 2019 13th November, 2019 14Economic Contribution of the Motion Picture and Television Industry in Australia
Table 11 – Screen Sector Wages in Australia (A$, m), 2017-18
Comparison
Direct Indirect Induced Total
to 2012-13
Production 301.6 370.8 335.3 1,007.7 28%
Distribution 160.6 197.4 178.5 536.4 -10%
Exhibition 126.4 155.4 140.5 422.4 18%
Home 152.1 187.9 169.5 509.4 -2%
Entertainment
Broadcast 644.7 802.3 721.5 2,168.5 24%
Total 1,385.4 1,713.7 1,545.3 4,644.4 16%
Source: Olsberg•SPI analysis
NB: numbers may not sum due to rounding
For 2016-17, total wages related to production were 13% higher than 2017-18, having increased
48% over 2012-13 as a result of productions drawn to Australia by the top-up system.
3.4.2. 2021-22 Projections
This scale of growth is projected again to 2021-22, as the impact of the Location Incentive and
growth in VOD production is felt – the result of increased domestic and footloose production
spend in Australia is expected to be a 26% total increase in production sector wages. Together
with a 13% increase in exhibition, this will drive a 10% total increase in employee remuneration
associated with the screen sectors.
Table 12 – Screen Sector Wages in Australia (A$, m), 2021-22
Comparison
Direct Indirect Induced Total
to 2017-18
Production 379.8 466.9 422.2 1,268.9 26%
Distribution 158.0 194.2 175.6 527.8 -2%
Exhibition 142.6 175.3 158.6 476.5 13%
Home 162.8 201.5 181.6 545.9 7%
Entertainment
Broadcast 674.7 839.6 755.0 2,269.3 5%
Total 1,517.9 1,877.5 1,693.0 5,088.4 10%
Source: Olsberg•SPI analysis
NB: numbers may not sum due to rounding
3.5. Taxation
3.5.1. 2017-18
We find that total tax receipts generated by the Australian screen sectors amounted to A$2.59
billion in 2017-18, an increase of 20% from the tax estimated for 2012-13. This growth was
driven by the home entertainment (especially VOD), production, broadcast, and exhibition
sectors, with taxation associated with distribution being marginally down.
© Olsberg•SPI 2019 13th November, 2019 15Economic Contribution of the Motion Picture and Television Industry in Australia
Table 13 – Screen Sector Taxation in Australia (A$, m), 2017-18
Comparison
Direct Indirect Induced Total
to 2012-13
Production 161.7 153.1 147.0 461.8 36%
Distribution 86.1 81.5 78.3 245.9 -5%
Exhibition 67.8 64.2 61.6 193.6 25%
Home 140.0 88.7 87.1 315.9 41%
Entertainment
Broadcast 476.5 447.2 449.6 1,373.4 16%
Total 932.2 834.8 823.6 2,590.6 20%
Source: Olsberg•SPI analysis
NB: numbers may not sum due to rounding
3.5.2. 2021-22 Projections
Driven by rising production spending, and increasing consumer spend on Australian-domiciled
VOD services, we project that taxation associated with the sector will increase 8% by 2021-22,
to A$2.80 billion. The exhibition sector is also projected to provide strong increased tax
revenues as a result of its underlying growth, while minor increases are projected in broadcast.
Taxation associated with distribution is expected to decline, given the lower turnover of the
sector.
For the purposes of these taxation results, we assume no change in the overall tax burden for
Australian businesses and individuals, at a combined federal and state level.
Table 14 – Screen Sector Taxation in Australia (A$, m), 2021-22
Comparison
Direct Indirect Induced Total
to 2017-18
Production 201.1 190.3 182.7 574.1 24%
Distribution 83.6 79.2 76.0 238.8 -3%
Exhibition 75.5 71.5 68.6 215.6 11%
Home 172.1 99.1 95.1 366.2 16%
Entertainment
Broadcast 492.2 465.8 447.2 1,405.2 2%
Total 1,024.4 905.8 869.7 2,799.9 8%
Source: Olsberg•SPI analysis
NB: numbers may not sum due to rounding
© Olsberg•SPI 2019 13th November, 2019 16Economic Contribution of the Motion Picture and Television Industry in Australia
4. PRODUCTION
The production sector in Australia has undergone a period of significant change over the
last few years. As our data will show, the availability of top-up grants provided a brief but
major increase in film production spend during 2016-17, generating an unprecedented
level of economic impact. This fell equally dramatically in 2017-18, following the loss of this
investment.
The Location Incentive provides a partial replacement for this, and will drive growth of the
production sector in Australia to 2021-22, together with the ongoing rapid expansion of
demand for original content in the VOD sector – which now have access to the Location
and PDV offsets – and to a lesser degree demand in TV. However, spending on
international production in Australia will not reach the same levels seen at the height of
the top-ups, leading to a lower rate of job creation and GVA than would have occurred with
an uncapped Offset.
4.1. Introduction
Production represents the first stage in the value chain of film and television content, and for
the purposes of this report includes pre-production; principal photography; post, digital, and
visual effects (PDV); music; and audio post-production. It represents the stage at which an idea
is developed from a blank page to a completed piece of content which can then be distributed
– through the stages which follow in subsequent chapters – to the audience.
Our analysis of production spending in Australia breaks down into three categories – film
production, which is destined primarily for release in cinemas; TV production, aimed at
distribution using television services; and Online Drama production, which has its first release
on VOD services.
4.2. Film Production
4.2.1. Approach
To assess the value of film production in Australia, we use data from Screen Australia’s Drama
Report. This provides an assessment of all physical and PDV production undertaken in
Australia, broken down by financial year. The film production datasets for the relevant years –
2012-13, 2016-17, and 2017-18 – were taken from this data-set, and added to film-related PDV
spending to form a total spend figure.
Data for 2016-17 are provided as this year represents a major high point for the film production
sector in Australia. Driven by the top-ups, production spending in this year was much higher
than other years covered, and we have therefore evaluated this year in addition to those
assessed in the wider analysis to provide a complete picture of the performance of the
Australian film industry in recent years. This analysis will also provide valuable context for the
reader on the wider findings of this study.
4.2.2. 2012-13 Findings
This analysis showed that in 2012-13, total film production spend in Australia was A$485.0
million, which including induced spending, was responsible for A$708.4 million of total output.
© Olsberg•SPI 2019 13th November, 2019 17Economic Contribution of the Motion Picture and Television Industry in Australia
Table 15 – Impacts of Film Production in Australia, 2012-13
Direct Indirect Induced Total
Output (A$, m) 231.5 253.5 223.4 708.4
GVA (A$, m) 74.5 81.5 71.9 227.9
FTE Jobs 1,174 1,820 1,435 4,428
Wages (A$, m) 41.7 55.5 45.7 142.8
Taxation (A$, m) 20.2 22.1 19.5 61.8
Source: Olsberg•SPI analysis of data from Screen Australia and ABS
NB: numbers may not sum due to rounding
We find that this production spending was responsible for A$227.9 million of total GVA, 4,428
FTE jobs receiving A$142.8 million of wages, and A$61.8 million of total taxation.
During 2012-13, this production spend was predominantly domestic in origin; of the total $485
million, 67% (A$325 million) was domestic, while the remaining 33% (A$160 million) was
footloose, and split between physical production and PDV expenditure.
4.2.3. 2016-17 Findings
By 2016-17, driven by the highly-successful top-up system, which boosted the Location
Incentive and attracted a number of major productions including Aquaman and Thor: Ragnarok
to Australia, total film production spend had almost doubled to A$927.0 million. Of this, 69%
was international in origin, and 31% domestic, with the vast majority of the international
production spend being physical production.
Table 16 – Impacts of Film Production in Australia, 2016-17
Change v.
Direct Indirect Induced Total
12-13
Output (A$, m) 476.2 450.8 432.8 1,359.8 91.9%
GVA (A$, m) 170.7 161.5 155.1 487.2 113.8%
FTE Jobs 2,239 2,869 2,796 7,903 78.5%
Wages (A$, m) 89.7 110.3 99.7 299.7 109.8%
Taxation (A$, m) 48.1 45.5 43.7 137.4 122.2%
Source: Olsberg•SPI analysis of data from Screen Australia and ABS
NB: numbers may not sum due to rounding
This jump in production spend had a similarly dramatic result when we consider its impacts on
the Australian economy. Total GVA associated with film production was up 113.8% to A$487.2
million, job creation was up 78.5% to 7,903 FTEs, and wages were up 109.8% to A$299.7 million.
The tax take associated with film production was A$137.4 million across the three phases of
activity.
© Olsberg•SPI 2019 13th November, 2019 18Economic Contribution of the Motion Picture and Television Industry in Australia
4.2.4. 2017-18 Findings
The impact of these top-up grants can be seen in 2017-18, the base year for this study – total
production spending dropped 53% to A$433.0 million, as while domestic productions
continued to grow, just A$4 million of non-PDV international spending was attracted.
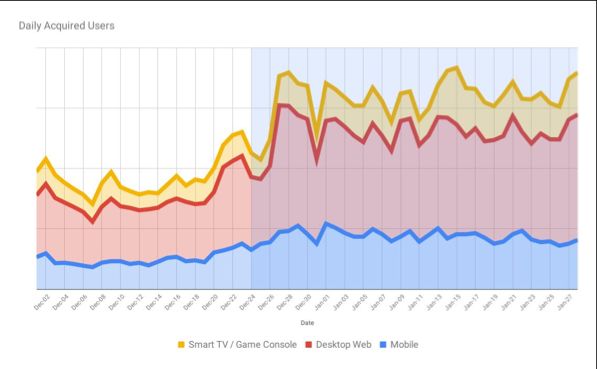
Figure 1 – Australian Film Production Spend by Kind, 2012-13, 2016-17, and 2017-18
1000
900
800
700
521
Production Spend (A$, m)
600
500
400
100 4
60 119 101
300
200
325 287 321
100
0
2012/13 2016/17 2017/18
Domestic Film PDV Footloose Film
Source: Drama Report, Screen Australia
NB: physical production spend drawn from production chapter of report, PDV from PDV services chapter
Table 17 – Impacts of Film Production in Australia, 2017-18
Change Change
Direct Indirect Induced Total
v. 12-13 v. 16-17
Output (A$, m) 222.5 210.5 202.2 635.2 -10.3% -53.3%
GVA (A$, m) 79.7 75.4 72.4 227.6 -0.1% -53.3%
FTE Jobs 1,046 1,340 1,306 3,692 -16.6% -53.3%
Wages (A$, m) 41.9 51.5 46.6 140.0 -2.0% -53.3%
Taxation (A$, m) 22.5 21.3 20.4 64.2 3.8% -53.3%
Source: Olsberg•SPI analysis of data from Screen Australia and ABS
NB: numbers may not sum due to rounding
This collapse in international production spending had a large negative impact on the scale of
economic contribution of the film production sector in Australia, with total GVA falling to
A$227.6 million. FTE job creation was down to 3,692, with over 3,000 fewer FTEs directly
supported by Australian film production. Wages and taxation also fell by 53% each.
Though dramatic, this fall in production spend is at least in part temporary in nature; this is
because 2017-18 fell between the ending of the ad-hoc top-up system which fuelled the
successes of 2016-17, and a structural reform to the system, which sees the introduction of the
Location Incentive in 2018-19.
© Olsberg•SPI 2019 13th November, 2019 19Economic Contribution of the Motion Picture and Television Industry in Australia
4.2.5. Future Projected Impacts
The Location incentive operates as a top-up grant on the current Location Offset, providing a
13.5% additional grant – providing an effective 30% when combined with the Offset – for
productions fulfilling the criteria for the scheme. These include the provision of support from
a state or territory government, and its contribution to the Australian economy, and local skills
and companies. Projects must exceed a A$15 million qualifying Australian production
expenditure threshold for film, or A$1 million per hour for TV, to qualify.
The scheme has a total budget of A$140 million for its four-year term, and given the incentive
rate, a total of A$1.04 billion of total production spend can be supported. For the purposes of
our projections, we annualise this as a spend of A$260 million per year, though it is likely that
productions will not be spread this neatly between the years covered. Indeed, a number of
projects have been announced as availing of the incentive in its early years, including Godzilla
vs. Kong, and two new Marvel films.
As 92% of foreign production spend in Australia in recent years is film, this ratio is applied to
the future projections for the Location Inventive. However, as we also assume that 50% of the
growth in online drama spend projected now these have access to the Location Offset will avail
of the Location Incentive, the total share of film in this is projected to drop from 71% in 2019-
20 to 53% in 2021-22.
Figure 2 – Film Production, Total Output in 2017-18 and projected years
1,200
1,000
Total Output (A$, m)
800
600
400
200
-
2017-18 2018-19 2019-20 2020-21 2021-22
Source: Olsberg•SPI Analysis
NB: No projection is made for 2018-19, as this year was recently completed at the time of writing
While this new 30% incentive will increase production spend during the next few years, as we
show below this will not cause the Australian film production sector to reach the highs of 2016-
17, due to the capped nature of the system. Assuming that domestic production and
international projects not limited by the Location Incentive cap grow at the current rate, we
estimate total film production spend, including PDV, of A$620.5 million in 2021-22.6
6
Projects not currently applying for the incentives include projects applying for the separate PDV Offset, or Chinese
productions which come to Australia for technical or creative reasons, and which are not sensitive to the incentive
and therefore not limited by the cap on the Location Offset
© Olsberg•SPI 2019 13th November, 2019 20Economic Contribution of the Motion Picture and Television Industry in Australia
Table 18 – Projected Impacts of Film Production in Australia, 2019-20
Direct Indirect Induced Total
Output (A$, m) 337.8 319.7 307.0 964.4
GVA (A$, m) 121.0 114.6 110.0 345.6
FTE Jobs 1,588 2,035 1,983 5,606
Wages (A$, m) 63.6 78.2 70.7 212.6
Taxation (A$, m) 33.7 31.9 30.6 96.2
Source: Olsberg•SPI analysis of data from Screen Australia and ABS
NB: numbers may not sum due to rounding
Table 19 – Projected Impacts of Film Production in Australia, 2020-21
Direct Indirect Induced Total
Output (A$, m) 329.7 312.1 299.6 941.5
GVA (A$, m) 118.2 111.8 107.4 337.3
FTE Jobs 1,550 1,986 1,936 5,472
Wages (A$, m) 62.1 76.4 69.0 207.5
Taxation (A$, m) 32.9 31.1 29.9 93.9
Source: Olsberg•SPI analysis of data from Screen Australia and ABS
NB: numbers may not sum due to rounding
Table 20 – Projected Impacts of Film Production in Australia, 2021-22
Direct Indirect Induced Total
Output (A$, m) 318.8 301.7 289.7 910.2
GVA (A$, m) 114.2 108.1 103.8 326.2
FTE Jobs 1,498 1,921 1,871 5,290
Wages (A$, m) 60.1 73.8 66.8 200.6
Taxation (A$, m) 31.8 30.1 28.9 90.8
Source: Olsberg•SPI analysis of data from Screen Australia and ABS
NB: numbers may not sum due to rounding
While this represents a significant growth on the A$433.o million production spend attracted
in 2017-18, it is nonetheless lower than the A$927.0 million in spend in 2016-17, when the top-
up grants peaked. This will be composed of A$350.9 million in estimated domestic film
expenditure, and A$269.6 million in foreign spend. Including induced spending, total output is
projected at A$910.2 million for 2021-22.
As a result of this, despite the expansion the Location Incentive will generate, we estimate a
ceiling of 5,606 FTE jobs in 2019-20, a 29% reduction on the 7,903 total FTEs seen in 2016-17,
but a 52% increase on the 3,692 FTEs supported in 2017-18. Total jobs are projected to decrease
in the film production industry to 2021-22, as a greater share of production is undertaken by
the online segment, below.
© Olsberg•SPI 2019 13th November, 2019 21Economic Contribution of the Motion Picture and Television Industry in Australia
The same trends – a 50% increase on 2017-18, but a 29% reduction on 2016-17 – are projected
in relation to the GVA and taxation elements of impact.
It is clear that the Location Incentive should stimulate major growth in the Australian film
production sector, but compared to the uncapped systems seen in countries with which
Australia competes for production, including the UK, the impact is inherently limited. As a
result of both the lower volume of production which a capped system can support, and the
lower interest of the production sector in applying for an incentive which they may not be able
to use due to the cap, the Australian production sector will not reach the heights seen in 2016-
17 under the Location Incentive.
This issue also impacts investments in the physical infrastructure required for production,
where certainty is required, not least given the mismatch between the length of physical
productions, and the time required to recoup capital expenditure. Addressing this mismatch
can unlock significant investment in new physical capacity, as the PDV Offset in Australia
demonstrates, and as the current plans for 2 million square feet of new studio space in Ontario,
Canada also indicate.7
Productions like Thor: Ragnarok entered Australia on a selective top-up basis, which by
providing a larger incentive than the current capped system, generated greater job and
economic impacts than are presently allowed for. This said, the increased investment will
undoubtedly make Australia more attractive for international productions, and attract far
greater production spend than would have been the case had the Location Incentive not been
available.
Case Study – Animal Logic
An early participant in Australia’s PDV market, Animal Logic has steadily grown to be a key
component of the PDV service sector in Australia as well as now developing its own
animated and hybrid family content. Since its foundation in 1991 as a business focused on
the design and production of high-end VFX for commercials and television content, the
firm has expanded significantly to provide services to a wide range of film producers.
This has included work on major international franchises, including The Matrix, Harry
Potter, and The Lego Movie, as well as key Australian productions such as The Great Gatsby
and Australia. Within these, the firm provided a mixture of visual effects and animation
services, building on its reputation for offering high-quality content in a globally-
competitive market.
In the last decade, the firm has expanded to produce a range of original content, beginning
with the academy-award winning Happy Feet in 2006. This expansion has seen the
generation of additional high-quality jobs in Australia, as a result of the corporate
investment put into the firm. The firm has also expanded internationally, including into the
highly competitive Canadian animation market, as a result of the skills and fiscal incentives
available there.
This process culminated recently in the production of Peter Rabbit, a film adaptation of a
classic children’s novel, which led the Australian Box Office for domestic productions in
2018 with A$26.7 million in ticket sales, with a total US$351 million (A$499 million) of
tickets sold worldwide. More than 700 people worked on the 50 day shoot for the project
in New South Wales, with the recently-announced sequel projected to generate 1,500 jobs
for the state.
7
Best Practice in Screen Sector Development, Olsberg•SPI for AFCI (September 2019) p. 44
© Olsberg•SPI 2019 13th November, 2019 22Economic Contribution of the Motion Picture and Television Industry in Australia
4.3. TV Production
4.3.1. Approach
TV drama production is also included in Screen Australia’s Drama Report. As with film, we
classify both physical and PDV production as television production spend for the purposes of
this analysis.
These data were then adjusted for 2017-18 to reflect the fact that VOD investments in drama
premiering on a TV network in Australia is counted by Screen Australia as 100% TV production.
The value of this was conservatively estimated at 5% of TV Drama spend – a number likely to
be an under-estimate – which was carried forward to our Online Drama analysis. Such co-
investment arrangements are becoming more common globally, and may require a tweak to
Screen Australia’s presentation of data in the future to be of value in policy development.
This approach would, however, only capture drama spend – which represents 15%-20% of total
TV production in Australia – and as such a further data source is required to ascertain the overall
value of TV production spend. To do this, we used the ABS 8679 dataset, a periodical database
on the film, TV, and games sectors in Australia provided by the Australian Bureau of Statistics.
This was most recently published for the fiscal year 2015-16.
All production sectors other than drama were taken from this dataset, which was then inflation
adjusted using data from the Reserve Bank of Australia to provide spend estimates for 2016-17
and 2017-18.
4.3.2. 2012-13 Findings
Our analysis found that total TV production spend in Australia during 2012-13 was A$2.18
billion, which generated a total associated output of A$3.19 billion.
Table 21 – Impacts of TV Production in Australia, 2012-13
Direct Indirect Induced Total
Output (A$, m) 1,041.6 1,140.2 1,005.1 3,186.8
GVA (A$, m) 335.0 366.7 323.3 1,025.0
FTE Jobs 5,281 8,186 6,454 19,921
Wages (A$, m) 187.5 249.6 205.5 642.6
Taxation (A$, m) 90.9 99.5 87.7 278.2
Source: Olsberg•SPI analysis of data from Screen Australia and ABS
NB: numbers may not sum due to rounding
This production generated A$1.03 billion in total additional economic activity for the Australian
economy, and supported 19,921 FTE jobs, receiving A$642.6 million in total wages. Taxation
associated with this activity is estimated at A$278.2 million.
4.3.3. 2017-18 Findings
By 2017-18, total production spending associated with the TV sector in Australia was found to
have grown by 19.7%, to A$2.62 billion. This increase in production spend was driven
predominantly by increasing spending in the production of sports content, with news and
current affairs also showing strong growth over the period.
© Olsberg•SPI 2019 13th November, 2019 23You can also read