STATE OF
DOWNTOWN
   Economic Report / 2021
←
→
Page content transcription
If your browser does not render page correctly, please read the page content below
STATE OF DOWNTOWN Economic Report / 2021
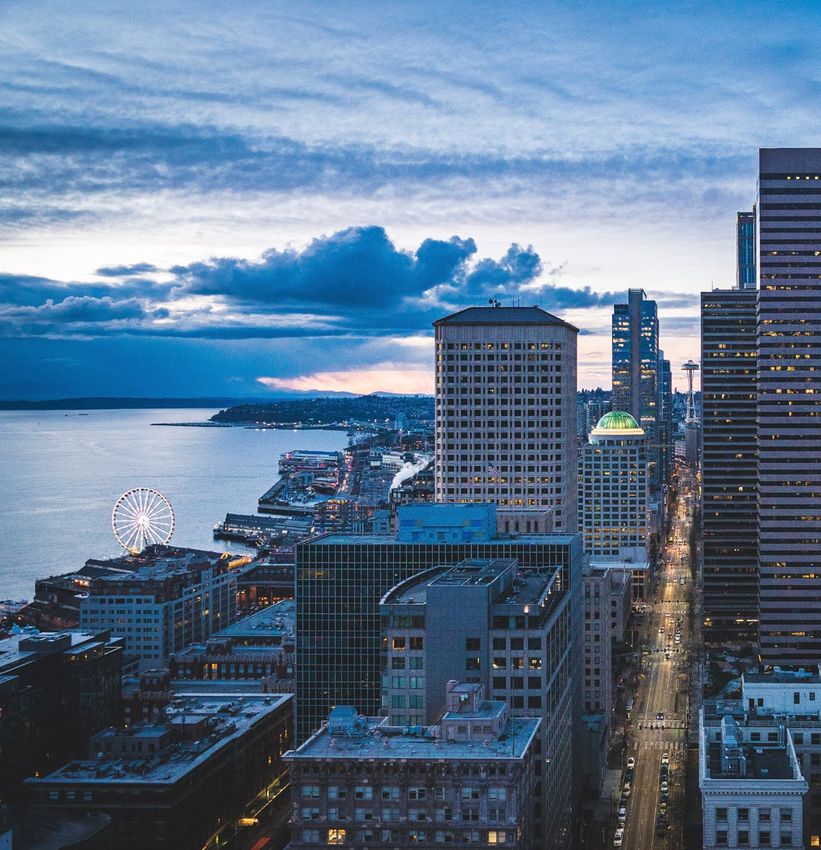
TABLE OF CONTENTS

            03     Welcome Messages

            05     Downtown Seattle
                   2020 Report Card

            08     Economic Competitiveness   Economic Report Sponsor

             25    Transportation & Access

             32    Urban Experience

                                                                  Credit: Andrew Jacob Media

STATE OF DOWNTOWN 2021 ECONOMIC REPORT                    TABLE OF CONTENTS                    /   01
STATE OF DOWNTOWN 2021 ECONOMIC REPORT ADVERTISEMENT / 02
A ME SSAGE FROM OUR PRE SIDENT & CEO

            Just a year ago, downtown Seattle was                That Seattle spirit is already at work.
            firing on all cylinders. We ended the prior          Many restaurants, retailers and nonprofits
            decade with record growth, outperforming             have creatively shifted their business
            almost every major city in the country on            models during the past year. In the first
            development, job and population growth.              week of 2021, there were roughly a dozen
                                                                 announcements of new business openings
            Since the onset of the pandemic, we’ve seen
                                                                 downtown and approximately 90 new business
            dozens of downtown businesses permanently
                                                                 announcements in 2020.
            close, and our arts, entertainment, tourism
            and hospitality sectors devastated. Indeed,          As we recover, we’re committed to
            downtowns across the world and the country           embracing a new vision for the center of
            have a unique and daunting set of challenges         our city, where everyone feels that they
            as we emerge from this historic event.               belong and everyone has an opportunity to
                                                                 participate and share in the prosperity. The
            The recovery of our downtown is critical to
                                                                 downtowns that rebuild in this way will be
            the economic future of our entire city; to
                                                                 more dynamic, desirable and resilient.
            our robust tax base and quality of life; to
            our ability to invest in infrastructure; and to      Whether you’re a longtime DSA member,
            provide opportunity for the next generation.         potential investor or exploring the benefits of
                                                                 DSA membership, we invite you to join us as
            The good news is that we are building back
                                                                 we reshape and reengerize this downtown into
            from a very strong base. We have some of the
                                                                 an even better version of the one we knew in
            most innovative private sector leaders in the
                                                                 March 2020.
            world, one of the largest downtown residential
            populations in the country, and we’re making
            generational investments in our city. We’ve
            seen hard times before. Each time downtown
                                                                                      Jon Scholes
            Seattle has faced challenges — whether it be
                                                                                      President & CEO
            the Great Fire of 1889, the 1950s-’60s flight to
                                                                                      Downtown Seattle Association
            the suburbs, or the collapse of the retail core in
            the early 1990s — we emerged stronger.

STATE OF DOWNTOWN 2021 ECONOMIC REPORT                                                                  WELCOME MESSAGES   /   03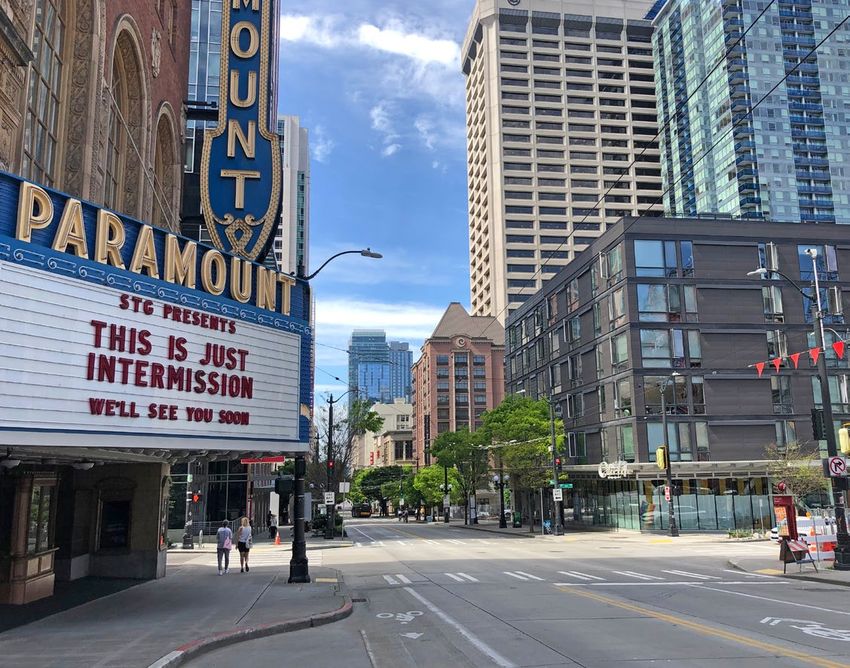
LET TER FROM THE MAYOR

                 The year 2020 was a brutal one of unprecedented and historic challenges for
                 our city: a global pandemic, a civil rights reckoning, a climate crisis and an
                 economic crisis that has had a devastating impact on our workers and our
                 local businesses, especially downtown.
                 With the lowest cases and hospitalizations of every major American city,
                 Seattle showed it could lead the way during the pandemic with our collective
                 actions. We began adapting early to respond to the COVID-19 pandemic,
                 establishing a first-in-the-nation small business support program to provide
                 grants to hundreds of struggling businesses, free citywide testing, and
                 assistance to our residents for rent, meals and child care.
                 The challenges ahead are some of the greatest in our city’s history, but 2021
                 also offers hope with a vaccine. Getting millions of our workers and residents
                 vaccinated will be key to reopening and economic recovery, and Seattle will
                 lead the nation with efforts on equitably distributing vaccines.
                 As we reopen the city, revitalizing and supporting downtown businesses,
                 nonprofits, workers and residents will be key to our long-term economic
                 recovery. I am proud to support the efforts of the Downtown Seattle
                 Association as they work to support their members, ratepayers and
                 stakeholders through the immense challenges brought on by COVID-19. I love
                 this city, and I am confident that we will come back more just and equitable.

                                   Stay healthy,
                                   Jenny A. Durkan
                                   Mayor of Seattle

STATE OF DOWNTOWN 2021 ECONOMIC REPORT                                                            WELCOME MESSAGES   /   04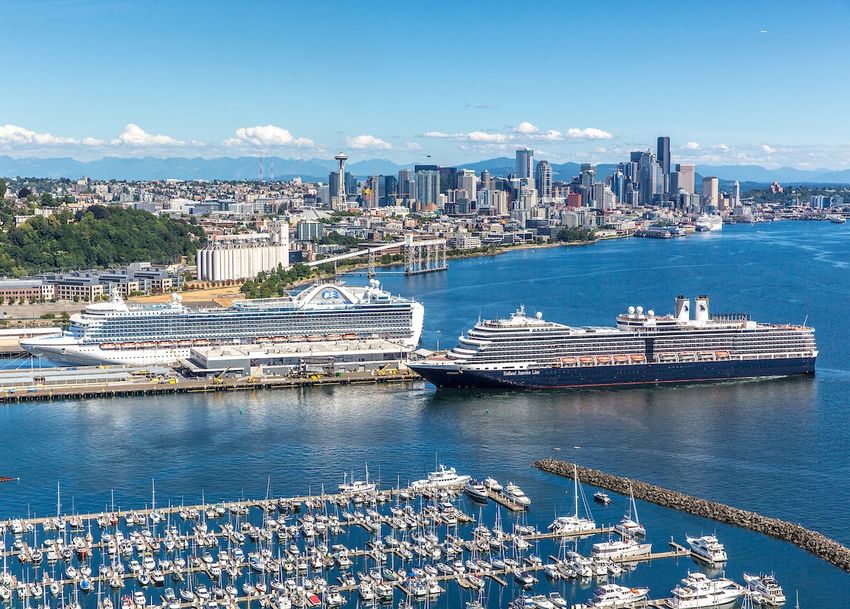
DOWNTOWN SEATTLE 2020

Report Card

LIVE                                                                             WORK
Residential Population                                                           Total Number of Jobs
37% increase since 2010 / 2020 estimate: 84,201                                  37% increase since 2010 / 2020 estimate: 300,375

60%                                                                              60%

40%                                                                              40%

20%                                                                               20%

 0%                                                                                0%
       2010     2012         2014          2016          2018          2020             2010         2012          2014          2016    2018            2020

SHOP                                                                              PLAY
Brick-and-Mortar Retail Jobs                                                     Dining, Hotel, Recreation, Arts and
31% decrease since 2010 / 2020 estimate: 6,069                                   Entertainment Jobs
                                                                                 44% decrease since 2010 / 2020 estimate: 15,282
50%                                                                               50%

25%                                                                               25%

 0%                                                                                0%

-25%                                                                             -25%

-50%                                                                             -50%

       2010     2012         2014          2016          2018          2020             2010         2012          2014          2016    2018            2020

                          Sources: data on this page were derived from multiple sources, including CoStar, Esri, Puget Sound Regional
                       Council, Opportunity Insights and the Washington State Employment Security Department. Note that while most
                         jobs data are for March, we used 2Q estimates for 2020 to better capture the impacts of COVID-19. Population
                       data are for July of each year and 2020 population was adjusted downward based on occupancy data from CoStar.

STATE OF DOWNTOWN 2021 ECONOMIC REPORT                                                                           DOWNTOWN SEATTLE 2020 REPORT CARD   /    05
5

                                                                                       N

                                                                Galer St.

                                             Mercer St.
                         El
                          l io
                           tt
                              Av

                                            UPTOWN                              SOUTH
                                 e
                                 .

                                                                              LAKE UNION

                                                                                                               WEST
                                                                                                              CAPITOL
                                                                                                               HILL

                                                                                    DENNY

                                                                                                                          Broadway
                                                          BELLTOWN                 TRIANGLE

                                                                                     RETAIL
                                                                                     CORE
                                                                            WEST
                                                                                                              FIRST
                                                                            EDGE
                                                                                                              HILL

                                                             WATERFRONT

         Downtown Is a Family                                                           PIONEER
         of Neighborhoods                                                               SQUARE                     CHINATOWN-
                                                                                                                  INTERNATIONAL
                                                                                                                     DISTRICT

      Downtown Seattle is a collection of 12
      neighborhoods that account for approximately
      half of all the economic activity in Seattle.
      Downtown is home to some of the densest
      neighborhoods in the Pacific Northwest. In
      fact, more than one in 10 Seattleites calls
      downtown home. During the COVID-induced
                                                                                               SODO
      downturn, these areas of residential density
      have been crucial to the survival of the street-
      level businesses that make downtown a vibrant
      urban center.

                                                                                              S. Lander St.

STATE OF DOWNTOWN 2021 ECONOMIC REPORT                                                                                    NEIGHBORHOOD MAP   /   06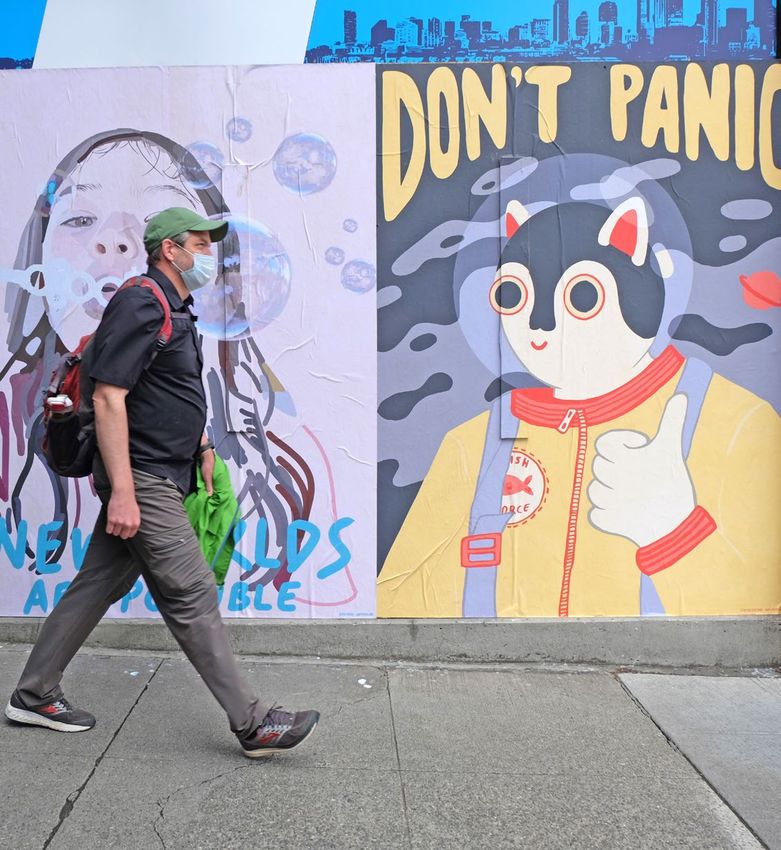
From the vibrancy of Pike Place Market to the
        blue waters of Elliott Bay, there are so many
        things to love about downtown Seattle—
        including its resilience.

        In the face of the pandemic’s harsh impact,
        DSA continues to strive to ensure the health
        of the city’s urban center, and the quality
        of life within it. The future of downtown
        remains bright, and we can’t wait to
        be reunited with it once again.

      lanepowell.com | 800.426.5801

STATE OF DOWNTOWN 2021 ECONOMIC REPORT                  ADVERTISEMENT   /   07
Economic
Competitiveness

                                                    Murals on First Avenue
STATE OF DOWNTOWN 2021 ECONOMIC REPORT   ECONOMIC COMPETITIVENESS    /   08
Seattle has been the envy of the nation, adding                                 can least afford it. Hotels, retail, restaurants, arts
                 jobs and residents faster than nearly every major                               and entertainment have been particularly affected.
                 city most years since 2010. Unfortunately, greater                              Those industries will likely take years to recover
                 Seattle was the first area in the nation to be                                  to pre-COVID-19 levels of activity. Federal aid and
                 impacted by COVID-19. Because of the growth of                                  downtown Seattle’s residential population of nearly
                 the tech sector and the area’s diverse, talented and                            90,000 have been key components in supporting
                 educated workforce, Seattle will have advantages                                small businesses that reopened. Downtown
                 over other cities in the years ahead. Still, a full                             neighborhoods saw restaurants and stores spill
                 recovery will likely take two or more years.                                    onto sidewalks and streets over the summer and
                                                                                                 innovate with tenting and heat to serve customers
                 Without intervention, the economic recovery will
                                                                                                 through the fall and winter.
                 be uneven. Many of the industries hit hardest are
                 in sectors dependent on foot traffic and visitors.                              In the section that follows, we look at the
                 With most office employees working from home                                    characteristics that have made downtown
                 and a once-thriving visitor industry decimated by                               Seattle the economic powerhouse of the region
                 the pandemic, businesses in the downtown core                                   and use these to assess the current health of the
                 face ongoing challenges. This especially impacts                                downtown economy.
                 people in lower-income job categories — those who

                                      Downtown Seattle Is the Heart
                                         of the City’s Economy

                       Downtown as a Percent of the City’s Total:                                                     Despite being less than 6% of
                                                                                                                      Seattle’s landmass, downtown
                                                                                                                      accounts for approximately
                                                                                                                      half of the economic activity
                                                                                                                      in Seattle, including more than
           81%                          78%                         55%                          54%                  half the jobs, about a third
                                                                                                                      of brick-and-mortar retail
                                                                                                                      sales, more than a third of
        Office Space                Hotel Rooms                      Jobs                     Commercial              leisure spending (including
         Inventory                                                                           Property Value
                                                                                                                      dining) and half the taxes
                                                                                                                      paid by businesses in the
                                                                                                                      city. Downtown businesses
           52%                          49%                         39%                           31%                 contribute 49% of the gross
                                                                                                                      regional product within the
                                                                                                                      city of Seattle.
       Business Taxes              Gross Regional              Leisure Spending            Brick-and-Mortar
           (2019)                  Product (2019)                   (2017)                    Sales (2017)

             Sources: CoStar, Emsi, Esri, Puget Sound Regional Council, Smith Travel Research and
            Visit Seattle. Figures are for 2020 unless otherwise specified. Leisure spending includes
                                   dining, arts, entertainment and recreation.

STATE OF DOWNTOWN 2021 ECONOMIC REPORT                                                                                     ECONOMIC COMPETITIVENESS   /   09
Working Toward Inclusive Recovery
The coronavirus pandemic brought into clear focus ensure that the economic recovery supports the most
socioeconomic disparities across our country, state and vulnerable among us and provides opportunities for more
city. People of color, the elderly, low-income individuals, people to share in future economic prosperity.
people working in service industries and those without
As we work to rebuild, we must remove unnecessary
access to health resources have proven to be at much
barriers to permitting and housing development so more
higher risk.
people who want to live here can do so. This must be
The uprising against racial injustice over the summer met with investments in infrastructure that support our
of 2020 further elevated the inequities that exist and growing communities, particularly low- and middle-
the work that lies ahead. For downtown to be healthy income families, with greater investment in public schools,
and vibrant, we must commit to an inclusive recovery, recreational amenities, and open space. We must fulfill
meaning one that welcomes everyone to the city and our promise to complete the Sound Transit 3 package,
that provides economic opportunities and social support bring back buses to our streets, and improve the transit
for marginalized communities. As the heart of city life, rider experience because we know that transit is the great
downtowns should represent and welcome residents, equalizer for accessing jobs and housing. Finally, we
employees and visitors of all incomes, races and must elevate our private sector partners who are boldly
ethnicities, genders and ages. reinventing ground-floor spaces to increase opportunities
for small businesses and entrepreneurs and then support
With the rollout of vaccines creating the potential for
them by providing a safe and welcoming place to
a further reopening of our economy, it is important to
conduct business.
Downtown’s Most Vulnerable Populations
13,895 8,664 7,853
residents are senior citizens (65+) residents work in the households include someone
service industry with a disability
6,044 5,128 4,669
households are below the households have no households receive
poverty level internet at home food stamps/SNAP
4,157 1,400 15.4%
residents have no health insurance residents do not speak English well of downtown residents who are
in the workforce are unemployed
Source: Esri Community Analyst. These data are as of July 1, 2020. Note that Esri’s models reflect
COVID-19’s estimated impacts for economic statistics but not for demographic statistics.
STATE OF DOWNTOWN 2021 ECONOMIC REPORT ECONOMIC COMPETITIVENESS / 10Myrtle Edwards Park, Waterfront
Diversity Index
+6 52 -11
change in downtown Seattle downtown’s current downtown Seattle compared
diversity index 2010–2019 diversity index score to downtowns nationwide
The diversity index represents the likelihood that two persons chosen at
random from the same area belong to different races or ethnic groups. It
also captures the racial and ethnic diversity of a geographic area in a single
number, zero to 100 (a higher score represents a more diverse population).
From 2010 to 2019, downtown Seattle’s diversity index increased 6 points
from 46 to 52. This is still 11 points lower than the 2019 average of 63 for
downtowns nationwide.
In the 2020 International Downtown Association Affordability Metrics
Vitality Index, downtown Seattle scored high marks for Downtown Seattle percent difference from
its economy and vibrancy, on par with New York City nationwide downtown average
and San Francisco. Seattle’s center city also improved
on its diversity index score over the past decade.
However, compared to other U.S. downtowns, Seattle Median Owner-occupied
Housing Value 135%
scored low on other measures of inclusion, including
residential diversity, the share of the population that is Median Rent 55%
middle income and home ownership affordability.
Area Median Income (2018) 33%
Income Spent on Housing
and Transportation 9%
Source: International Downtown Association, 2020 Downtown Vitality Index
STATE OF DOWNTOWN 2021 ECONOMIC REPORT ECONOMIC COMPETITIVENESS / 11Who Works Downtown?
51%
are male and
49% are female
44%
have a bachelor’s
degree or higher
Jobs Are Key to Downtown’s
Continued Success 60%
are between the ages
of 30 and 54
Employment peaked in the first quarter of 2020 with an
estimated 348,000 jobs based downtown. After adding
129,000 jobs between 2010 and 2020, downtown lost 45,000
jobs in the second quarter of 2020. This compares to 28,000 15%
jobs lost during the Great Recession. While some jobs are identify as Asian
coming back, we estimate downtown ended the year with (the fastest-growing
employee population
approximately 20,000 fewer jobs compared to the first quarter. downtown by race)
Most job losses are expected to be temporary. However, with
remote working becoming more common and the effects of
COVID-19 on transit service, it is uncertain how long it will
take before the daytime worker population returns to previous
levels. In a September 2020 DSA survey of businesses and
50%
travel less than 10 miles
organizations in Seattle, nearly half of respondents said that to get to work
at least 25% of their employees had already returned to their
office or worksite and most expect at least 25% to return by
mid-2021. These workers, along with residents and visitors,
support a vibrant, diverse array of urban amenities such
as restaurants, bars, brick-and-mortar retailers and a lively
nightlife scene. 6%
also live downtown
Downtown has increasingly been a place for people to gather,
share ideas and enjoy the benefits of proximity. Amid a
pandemic, however, people are cautious about unnecessary
time spent outside the home. Many workers express a desire to
Source: U.S. Census Bureau (onthemap.ces.
return to the office at least a few days per week. Downtown’s census.gov). These represent 2018 figures.
return to vibrancy is tied to getting COVID-19 under control
and providing safe spaces conducive to the return of urban life
and the downtown workforce.
STATE OF DOWNTOWN 2021 ECONOMIC REPORT ECONOMIC COMPETITIVENESS / 12Denny Triangle
COVID-19 Impacts Create Uncertainty
for Downtown’s Office Market
In 2020, downtown Seattle office rents fell by 6% and Despite the pandemic, investors continue to show
vacancy increased from 5.4% to 8.7%. Much of the new confidence in the Seattle market. Lab space is in high
vacancy was due to new construction as occupancy did not demand. In fact, the vacancy rate for Seattle lab space at
decrease. Rent growth is expected to be flat through 2021 the end of 2020 was less than 1%, according to CBRE. The
before beginning to climb again the following year. The area also saw some of the highest-priced office deals in the
amount of occupied office space downtown is expected nation since the start of the pandemic, including the $652
to continue to increase annually but at a much lower rate million sale of 2+U (Qualtrics Tower). This was the highest
than was seen over the past few years. Including new price for a single-asset property in the Puget Sound region
construction, vacancy is expected to top out at 11.5% in the and the seventh-largest in the U.S.
third quarter of 2021 and remain above 10% until 2024.
Source: CoStar
STATE OF DOWNTOWN 2021 ECONOMIC REPORT ECONOMIC COMPETITIVENESS / 13Office Vacancy Office Rent
Downtown Seattle (year-end data) Downtown Seattle (year-end data)
15% $50
$40
10%
$30
$20
5%
$10
0% $0
2010 2015 2020 2025 2010 2015 2020 2025
Actual Forecast
Peer-city Comparisons
Change in Occupied Office Space Occupied office space downtown grew only slightly in 2020,
Net change in occupied square feet yet our center city experienced one of the best performances
in downtown Seattle each year among peer downtowns. San Francisco fared the worst, with
downtown occupancy decreasing 7.2%.
2010 0.9 M
2011 1.7 M
Change in Occupied Square Feet of Office Space
2012 1.1 M Among peer downtowns, year-over-year change, 2020
2013 0.8 M
2014 0.9 M
San Francisco -7.2%
2015 3.8 M
Austin -5.5%
2016 3.1 M
2017 0.9 M Boston -3.9%
2018 3.3 M Portland -2.8%
2019 2.3 M
Denver -2.7%
2020 0.4 M
Salt Lake City -2.5%
2021* 0.5 M
2022* 1.6 M Washington, D.C. -1.6%
2023* 1.4 M Atlanta -1.3%
2024* 1.7 M
Los Angeles -0.9%
2025* 1.6 M
Vancouver, B.C. -0.6%
*2021-2025 show forecast data
Chicago -0.4%
Seattle 0.5%
Source: CoStar. The cities were selected based on similarities to Seattle that
make them competitive markets (for example, strong growth in tech talent).
For consistency, CoStar’s “multifamily” downtown boundary was used for each
city except for Seattle, where DSA’s boundary was used. Note that these are
preliminary numbers.
STATE OF DOWNTOWN 2021 ECONOMIC REPORT ECONOMIC COMPETITIVENESS / 14Downtown Office Construction
With an inventory of 79 million square feet of office
space, downtown supports a dynamic economy. This
sector has experienced a net gain of 17 million square
feet since 2010. This has expanded the downtown
office inventory by 27% over that period.
Currently, there are 3.1 million square feet of office
space under construction downtown. This is about on
par with the average over the past 10 years. Despite
this new supply, downtown occupancy rose from 86%
in 2010 to 91% by the end of 2020.
In addition to space under construction, there is more
than a half-million square feet in demolition, shoring
and excavation phases in preparation for future
development. An additional 7.7 million square feet are
in earlier stages of development (“land-use issued”
and “predevelopment” phases) and do not yet have
building permits.
Rainier Square
Office Space Square Footage by Status and Completion Year
Completed
2010 1,169,000
Under Construction
2011 1,622,000
Demolition, Shoring and Excavation
2012 534,000
Land-use Issued
2013 409,000
Predevelopment
2014 63,000
The numbers next to each bar indicate the
2015 2,593,000 total square feet of office space completed
or scheduled for completion each year.
2016 2,521,000 Please note that those in predevelopment
have uncertain timelines and do not yet
2017 3,621,000
have land-use or building permits.
2018 500,000
2019 4,511,000
2020 1,198,500
2021 2,543,500
2022 2,022,000
2023+ or TBD 6,868,757
Source: DSA 2020 Year-end Development Guide
STATE OF DOWNTOWN 2021 ECONOMIC REPORT ECONOMIC COMPETITIVENESS / 15A Hot Housing
Market Cools Credit: Alex Mulyar
The Cobb Building
The past decade was one of incredible the center city had fewer occupied decreased supply and increased
growth in the residential sector. apartments at year-end than at the demand and prices.
Approximately 45% of apartment start. Downtown lost 1,594 apartment
One outcome of lower rents and
units downtown were built since households in 2020, with vacancy
condo prices downtown is that they
2010 and yet vacancy was at a record rising to 10.4%. Suburban markets
may become more affordable and
low of 5% by the end of 2019. High saw a modest increase in occupancy
therefore accessible to a more diverse
demand drove rent increases faster and a slight increase in vacancy,
spectrum of individuals. Younger
in Seattle than in most U.S. cities, mostly driven by new construction.
artists, middle-income families and
though this was tempered somewhat
The condo market downtown was working-class households may find
by unprecedented residential
also not immune to a downturn. downtown more affordable in the
construction bringing new supply to
Through the summer of 2020, wake of geographic shifts caused
the market.
downtown experienced increases in by COVID-19.
In downtown, there are some signs the number of listings and decreases
*2000 is as far back as this data set goes.
of residential demand slowing down. in closed sales and prices while
For the first time since at least 2000*, other areas of the Puget Sound saw
Annual Change in Occupied Apartment Units
Downtown Seattle
6,000
4,000
2,000
0
-2,000
2000 2005 2010 2015 2020 2025
Sources: Costar, Northwest
Actual Forecast Multiple Listing Service
STATE OF DOWNTOWN 2021 ECONOMIC REPORT ECONOMIC COMPETITIVENESS / 16Percentage of Units Vacant at the End of Each Year
Downtown Seattle
20%
15%
10%
5%
0%
2000 2005 2010 2015 2020 2025
Actual Forecast Source: CoStar
Residential Units by Current Status and Delivery Year
Completed
2010 829
Under Construction
2011 202
Demolition, Shoring and Excavation
2012 1,875
Land-use Issued
2013 2,446
Predevelopment
2014 3,292
The numbers next to each bar indicate
2015 3,600 the total units completed or scheduled
for completion that year. Please note that
2016 2,199 those in predevelopment have uncertain
timelines and do not yet have land-use or
2017 5,723
building permits.
2018 3,780
2019 3,195
2020 2,020
2021 7,262
2022 4,104
2023+ or TBD 20,024
Source: DSA 2020 Year-end Development Guide
STATE OF DOWNTOWN 2021 ECONOMIC REPORT ECONOMIC COMPETITIVENESS / 17Peer-city Comparisons
In 2020, downtown Seattle’s apartment rents
decreased more than all of our peer downtowns
except for Boston. All but Atlanta and Vancouver,
British Columbia saw decreasing rents.
In terms of the change in the number of occupied
units, roughly half of the downtowns saw decreases
and half increases. The number of occupied units
in downtown Seattle decreased 3.1%. Downtown
San Francisco fared the worst, with a 5.4% decrease
in occupied units.
Onni South Lake Union
Year-over-year Change in Year-over-year Change in Apartment
Apartment Rents 2019-2020 Occupancy 2019-2020
Percentage change in rent among Percentage change in number of units
peer downtowns occupied among peer downtowns
Boston -13.3% San Francisco -5.4%
Seattle -11.1% Washington, D.C. -4.5%
Chicago -10.2% Boston -4.2%
Los Angeles -9.4% Seattle -3.1%
Washington, D.C. -9.4% Chicago -2.1%
Portland -6.6% Los Angeles 0.3%
San Francisco -5.7% Vancouver, B.C. 1.7%
Denver -4.5% Denver 1.8%
Austin -2.9% Austin 2.0%
Salt Lake City -1.0% Salt Lake City 2.2%
Atlanta 0.6% Portland 2.4%
Vancouver, B.C. 7.3% Atlanta 4.6%
Source: CoStar. The cities were selected based on similarities to Seattle that make them competitive markets (for
example, strong growth in tech talent). For consistency, CoStar’s “multifamily” downtown boundary was used for
each city except for Seattle, where DSA’s boundary was used. Note that these are preliminary numbers.
STATE OF DOWNTOWN 2021 ECONOMIC REPORT ECONOMIC COMPETITIVENESS / 18Ben Paris, The State Hotel
A Visitor Industry
Devastated by COVID-19 Hotels
Downtown is the center of the visitor industry
for Seattle, with 37% of the Airbnb listings
With an incredible natural backdrop, outstanding
in the city, 78% of the hotel rooms and more
visitor amenities and an array of things to see and
than 80% of the hotel revenue. However, due
do, Seattle has long been the Northwest’s leading
to COVID-19 impacts, hotel revenue was down
destination for tourists and conventioneers. The
more than 90% nearly every day through the
loss of this business due to COVID-19 has had a
spring and summer of 2020. As many as 29
devastating economic impact. Before the pandemic,
hotels closed at least temporarily. By June, the
15 million people visited Pike Place Market each year
number of units listed on Airbnb in Seattle had
and 12 million visited the Seattle Center, where more
decreased by 26% year-over-year.
than 5,000 events were held annually. Locals, along
with visitors, have enjoyed downtown’s unmatched The hotel sector is expected to take a long time
entertainment options, including art galleries, to recover from the downturn, not returning to
performances, museums, professional sporting events 2019 levels until 2023 or later.
and myriad dining options.
Sources: Airbnb, Pike Place Market, Seattle Center,
Visit Seattle and Smith Travel Research
STATE OF DOWNTOWN 2021 ECONOMIC REPORT ECONOMIC COMPETITIVENESS / 19Hotel Demand (Nights Sold) Hotel Revenue
Downtown Seattle Downtown Seattle
5M $1B
4M
$750M
3M
$500M
2M
$250M
1M
0M $0M
2012 2014 2016 2018 2020 2012 2014 2016 2018 2020
Actual Forecast Sources: Visit Seattle and Smith Travel Research
Thompson Seattle, West Edge
Downtown Hotel Occupancy Compared to Peer Cities
July 2019 vs. 2020
90% 91% 89% 89% 89%
87% 86%
84%
81%
74% 74%
34% 36%
31% 31%
26% 28% 28%
23%
20%
15% 17%
Seattle Vancouver, B.C. Austin Boston Portland Nashville Denver San Francisco San Diego Atlanta Los Angeles
2019 2020 Sources: Visit Seattle and Smith Travel Research. Cities selected from those that Visit Seattle considers Seattle’s peer downtowns.
STATE OF DOWNTOWN 2021 ECONOMIC REPORT ECONOMIC COMPETITIVENESS / 20Hotel Jobs
Downtown Seattle
Jobs at downtown hotels decreased 8,000
by approximately 4,000 in the second
quarter of 2020 due to furloughs
and layoffs. This represents a 6,000
loss equivalent to almost half the
estimated 2019 hotel employment
4,000
downtown.
2,000
Source: Puget Sound Regional Council. Note that
the 2020 figure was estimated using data from
PSRC and the Washington State Employment
Security Department. While PSRC figures are for 0
March of each year, we estimated 2020 using
2010 2012 2014 2016 2018 2020
data from April to better capture the effects of
COVID-19. The 2013 jobs data were unavailable
and were therefore interpolated.
citizenM, South Lake Union
STATE OF DOWNTOWN 2021 ECONOMIC REPORT ECONOMIC COMPETITIVENESS / 21Credit: Port of Seattle
The 2020 Seattle cruise season was canceled with a loss
of roughly $900 million in economic impact and 5,500 jobs.
Smith Cove Cruise Terminal at Pier 91
Cruise Ships
Cruise Passengers
Seattle serves as the leading U.S. Port of Seattle
West Coast port for Alaska cruises.
The Port of Seattle has hosted more
2010 961,698
than 1 million passengers annually
since 2017* and is homeport to 2011 885,949
the largest ships on the West 2012 934,900
Coast, including Norwegian Bliss,
2013 870,994
Norwegian Encore and Ovation of the
Seas. The major cruise lines serving 2014 823,780
Seattle include Carnival, Celebrity, 2015 898,032
Holland America, Norwegian
2016 983,539
Cruise Line, Oceania, Princess and
Royal Caribbean. 2017 1,071,594
2018 1,114,888
*Due to the COVID-19 pandemic, all 2020 sailings 2019 1,210,722
were canceled.
2020 0
Source: Port of Seattle
STATE OF DOWNTOWN 2021 ECONOMIC REPORT ECONOMIC COMPETITIVENESS / 22Washington State Convention Center Addition, Summit building
Looking Ahead: The Washington State
Convention Center Addition
The Washington State Convention Center has been a Opening in 2022, WSCC’s Summit building will be
powerful economic driver for our community. Since its transformative, adding an estimated $260 million in annual
opening in 1988, people from outside Washington have visitor spending and 3,900 direct and indirect jobs when
spent over $6.9 billion locally when coming to WSCC fully operational. The Addition is also supporting as many
events. In 2019, this spending added an average of as 6,000 union jobs during construction, including an
$986,062 per day to Washington’s economy and directly estimated 900 apprentices. Located just one block northeast
generated some 3,616 jobs (full-time equivalent). of the existing Arch building, Summit will double the
capacity of the center’s offerings.
Convention Attendance
Washington State Convention Center
At least 76 future citywide
2010 390,000
conventions previously booked at the
2011 420,000 Washington State Convention Center
2012 422,000 have canceled, resulting in a loss of at
least $512 million in economic impact.
2013 404,000
Cancellations represent a definite loss
2014 420,000 to the region because of Seattle’s lack
2015 380,000 of available future dates and the fact
that we have a smaller convention
2016 380,000
center compared to other major cities.
2017 383,000
2018 400,000
2019 390,000
2020* 95,000
*2020 figure is an unofficial estimate. Sources: Pine Street Group, Washington State Convention Center
STATE OF DOWNTOWN 2021 ECONOMIC REPORT ECONOMIC COMPETITIVENESS / 23Credit: Urban Villages
RailSpur, Pioneer Square
Downtown Development
In conjunction with the State of Downtown Economic new projects announced in 2020 and some were canceled
Report, the Downtown Seattle Association publishes a or put on hold. Safety measures also delayed some projects
development guide each year to summarize construction underway. However, Seattle remains one of the top
and investment activity downtown. These statistics are a markets in the nation for new construction, once again
measure of optimism and confidence in the future of the outpacing all other U.S. cities in Rider Levett Bucknall’s
downtown economy. crane index (July 2020).
COVID-19 has so far affected downtown construction
activity less than many other industries. There were fewer
Data Snapshot
new residential units new hotel rooms square feet of new
office space
In 2020, downtown developers
completed 21 projects, including:
2,020 560 1.2M
As of December 2020, 54 projects
were under construction, including: 8,840 369 3.1M
For the most up-to-date information, please visit:
downtownseattle.org/development
Source: DSA 2020 Year-end Development Guide
STATE OF DOWNTOWN 2021 ECONOMIC REPORT ECONOMIC COMPETITIVENESS / 24Transportation
& Access
Credit: @transit_culturalism
South Jackson Street
STATE OF DOWNTOWN 2021 ECONOMIC REPORT TR ANSPORTATION & ACCESS / 25As the employment center of the region, it is essential Credit: Sound Transit
to have a variety of options to get to, through and
around downtown. Safe and reliable transportation is
a priority for DSA. Before COVID-19, Seattle had some
of the highest transit demand in the nation. COVID-19,
however, has impacted how people move about the
city. Preferences for transit and shared mobility
options have given way to a desire for personal space.
Between diminished transit service, social-distancing
requirements limiting capacity, and a large share of
the population expressing apprehension about riding
transit, bringing the downtown workforce back to
2019 levels of ridership will be a challenge. Shifting to
driving is simply not an option and is not consistent
with Seattle’s climate goals. What is needed for
continued economic prosperity for downtown and
the region is a smart, forward-looking, multi-pronged
mobility strategy.
In the section that follows, we look at how
transportation to and around downtown has changed
over the past year and explore some of the challenges
and opportunities ahead.
LINK Light Rail
COVID-19 Had a Profound Impact
on Transportation in 2020
Seattle was the first major metro area in
Apple Mobility Index
the nation impacted by COVID-19. On
Average percent change from Jan. 13, 2020
March 5, King County recommended that
anyone who could work from home do
48%
2020 Q2 so until at least the end of that month.
This led to a massive contraction in the
number of people moving around the city.
2020 Q3
19%
14% 2020 Q4 When Washington Gov. Jay Inslee issued
1%
a statewide “Stay Home, Stay Healthy”
-7%
Source: Apple Mobility Index.
order on March 23, Seattleites were already
Data indexed to where
Jan. 13 = 100. Based on phone driving 45% less, taking transit 81% less
-27% searches for directions by frequently and walking 41% less, according
mode of travel. Note that this
data is particular to users of to the Apple Mobility Index (which uses a
-63% Apple products and therefore Jan. 13, 2020 baseline). When Seattleites
-67% may not be representative of
the entire population.
emerged from their homes again, driving
-77%
was the dominant mode of travel. By
December 2020, transit ridership remained
DRIVING TRANSIT WALKING down nearly 70% compared to the
baseline, while driving and walking were
near pre-pandemic levels.
STATE OF DOWNTOWN 2021 ECONOMIC REPORT TR ANSPORTATION & ACCESS / 26Washington State Ferry, downtown Seattle
Transportation Changes Year-over-year
Average daily percent change (2019–2020)
I-5 (Downtown) King County Metro Highway 99 Tunnel Washington State Ferries Amtrak (Cascades)
(Systemwide) (Downtown)
-16% -16%
-34%
-54%
-57%
-62%
-65% -68% -65%
-71%
-76%
-81%
-89%
-92%
Q2 Q3 Q4 -95%
In 2020, transit ridership, including ferries and long-distance rail, dropped 50% or more Sources: Seattle Department
according to each agency’s data, but has started to increase again. Driving showed the of Transportation, Washington
State Department of
fastest return to normal by the end of the year, with vehicular traffic on I-5 just north and Transportation COVID-19
south of downtown down only 16%. According to the Seattle Department of Transportation, Multimodal Transportation System
Performance Dashboard
vehicle traffic counts on downtown surface streets are starting to tick up again as well.
Having been down approximately two-thirds from pre-COVID-19 levels in April and May,
surface traffic was down roughly a third from 2019 levels toward the end of 2020.
STATE OF DOWNTOWN 2021 ECONOMIC REPORT TR ANSPORTATION & ACCESS / 27A Shift Toward More Remote Work
Many employees based downtown are currently working the office after the pandemic is over. In addition to worker
from home due to COVID-19. Cell phone data aggregated preferences and a shift in office culture, COVID-19-related
by Placer.ai showed that weekday daytime visits to school closures and lack of daycare options could keep
the neighborhood by those who work downtown have employees from returning to their offices in the near term.
consistently been down about 80% compared to pre-
The current work-from-home period has some clear
pandemic levels. In a Commute Seattle survey, 89% of
downsides and a mix of in-office and remote work is likely
employers said that some portion of their employees are
in the future. A study published by Cushman & Wakefield
working remotely, with nearly three-quarters saying that
shows that not all people want to work from home and
between 81% and 100% of their employees were doing so
among those that do, most prefer a hybrid model. Working
as of May 2020. In that same survey, 50% of employers
exclusively from home, office workers feel disconnected,
anticipated a post-COVID-19 work culture where their
and there are fewer opportunities, particularly among new
employees would work from home at least a few times
hires who benefit from in-person mentoring when working
per week.
in an office setting. Cushman & Wakefield’s research also
This is in line with national surveys of employers as well showed that work-from-home scenarios are likely to have
as employees. In a meta-analysis of several national office only a slight impact on office absorption as offices increase
employee preference surveys, CoStar found that 21% of space per employee and utilize more square footage for
employees favor a fully remote work environment, 55% flexible meeting spaces.
prefer partially remote and 25% prefer to work entirely at
Remote Work Culture
Among Seattle companies
1%
Every day
9%
A few times 9%
a week
41%
About once 15%
REMOTE WORK FREQUENCY
a week
7%
Pre-COVID-19
A few times 27%
a month Post-COVID-19
9%
Questions asked:
About once 17%
a month Which best describes your organization’s
remote work culture prior to COVID-19?
5%
After COVID-19, what do you anticipate your
organization’s remote work culture to be?
27%
Never
6%
4%
Unsure
23% Source: Commute Seattle
STATE OF DOWNTOWN 2021 ECONOMIC REPORT TR ANSPORTATION & ACCESS / 28How Workers Commuted
Before COVID-19
In 2019, 74% of workers came downtown by some other means
than driving alone. That number had been steadily rising for more
than a decade. The largest share (46%) came by transit.
Pre-COVID-19 Commute Choices
Downtown Seattle workers
3%
3%
6%
7%
Transit
Drive Alone
Carpool & Vanpool
9%
46% Walk
Telework
Bike
Other
26%
Source: Commute Seattle 2019 Commuter Mode
Split Survey. Note that this data does not include
workers who live downtown but commute to
locations outside downtown; nor does it include the
SoDo neighborhood. Figures are based on those who
begin work between 6–9 a.m. on weekdays.
Credit: Urban Villages
Streetcar, Pioneer Square
STATE OF DOWNTOWN 2021 ECONOMIC REPORT TR ANSPORTATION & ACCESS / 29Credit: Sound Transit
U District Light Rail Station
The Need to Invest in a Variety
of Transportation Options
In the face of the pandemic and beyond, Seattle and are approximately $200 million less than the pre-COVID-19
the region are still actively investing in a world-class forecast. Sound Transit projects a revenue gap of $6.1
transportation system to meet the future needs of the billion from 2020 through 2041.
city. As workers return to their offices, there must be
There is some positive news. Light-rail stations opening
viable options other than driving alone. Before COVID-19,
in the University District, Roosevelt and Northgate will
nearly half of downtown employees took transit to work.
connect these neighborhoods to downtown as early
Shifting even a quarter of these trips to cars is not a viable
as fall 2021. New stations in Bellevue will allow for a
solution. Downtown has a limited supply of parking and
24-minute ride from downtown Bellevue to Westlake
roadways were already at capacity pre-COVID-19. The
Station by 2023 and commuters from Lynnwood will be
closure of the West Seattle Bridge due to structural issues
able to access downtown by light rail starting in 2024.
has decreased road capacity further. Some city projects are
Also, while funding issues could cause some delay, the
getting pushed out into the future, such as the Center City
implementation of Sound Transit 3 is still on the horizon,
Connector streetcar along First Avenue. Without additional
with opportunities to create greater, long-term access
resources to increase service levels and ensure riders have
across the region. Passed in 2016, ST3 is the region’s
enough personal space, the system cannot sufficiently
largest investment in our transportation future. It will
bring back downtown’s workforce.
dramatically increase connectivity to, through and within
When we move to a post-COVID-19 world, there may downtown. The levy will fund an additional 62 miles of
initially be trepidation around transit use. Other light-rail lines, expand bus rapid transit, increase Sounder
commuting options such as biking and walking can help train capacity and add a second downtown transit tunnel
fill the gaps. to serve six new stations. In addition, 88% of Seattleites
recently voted to fund 150,000 hours of transit service
Budget constraints may also limit the ability of transit
over the next six years through the Seattle Transportation
agencies to provide adequate service as workers begin to
Benefit District.
return downtown. The 2021-22 King County budget noted
that projected sales-tax revenues for Metro in 2021-2022
STATE OF DOWNTOWN 2021 ECONOMIC REPORT TR ANSPORTATION & ACCESS / 30It is important to provide a variety of safe, reliable ways to travel. Long-term trends favor high transit usage. However, in the wake of the pandemic and with restricted road and transit capacity, other options must also be explored. This could include flexible remote-work options. Encouraging walking and biking by providing ample welcoming safe public spaces would also encourage the adoption of these alternatives. Spreading out the workday with Help your business get ready for the future of staggered start times or compressed workweeks is commuting. DSA partner Commute Seattle another potential way of bringing workers back safely provides free consultations and resources in the short term while transportation capacity is to businesses on topics like transportation limited. In the long term, robust transit funding to benefits, telework policies, carpool and vanpool sustain and grow Seattle’s transit service will help programs and supporting active commutes. ensure a downtown and a region that are poised for Visit commuteseattle.com to learn more and recovery and continued investment. connect with their transportation specialists. STATE OF DOWNTOWN 2021 ECONOMIC REPORT TR ANSPORTATION & ACCESS / 31
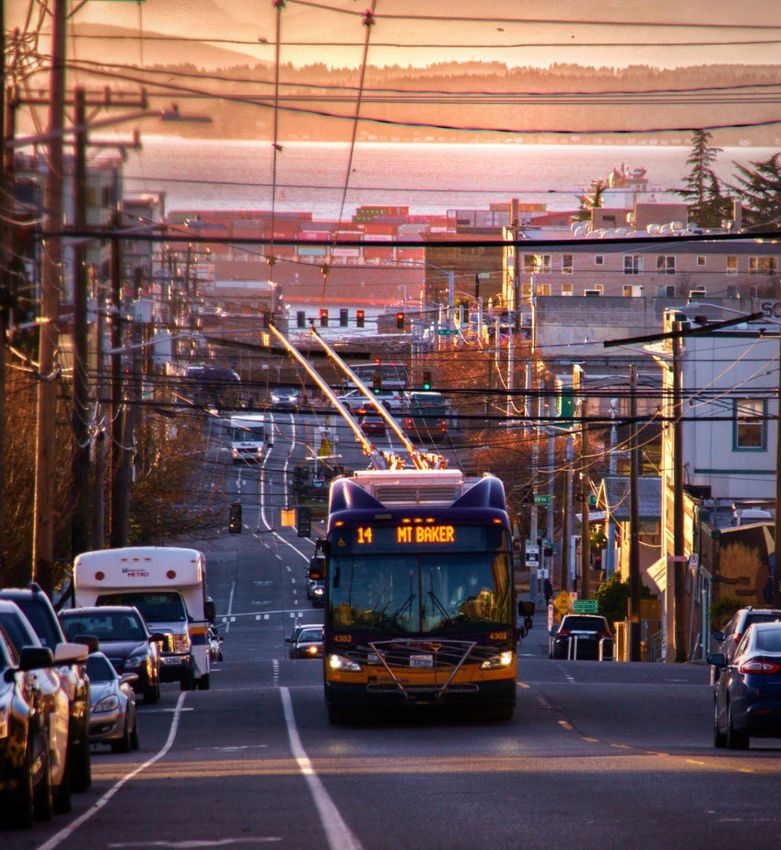
Urban Experience

                                                Pike Place Market
STATE OF DOWNTOWN 2021 ECONOMIC REPORT   URBAN EXPERIENCE   /   32
Holidays at Westlake Park
Downtown has a strong economic foundation. Downtown is the center of Seattle’s cultural
In recent years, the center city has seen life. Before COVID-19, downtown saw more
growth and investments that position Seattle foot traffic, more park users and more tourists
for resiliency. Downtowns are strong due than anywhere else in the city. While the
to their density, access to public spaces and pandemic created a major economic setback,
diversity of residents compared to car- we are confident that downtown will remain
centered neighborhoods. Downtown Seattle’s an attractive place to visit, shop, live, work,
walkability and accessibility make it a place play and invest.
that a large cross-section of society can
In the section that follows, we look at what
access and enjoy. To ensure the resilience
makes a vibrant urban experience and how
of downtown and the region, these assets
downtown Seattle is performing against
should be protected and built upon. Ongoing
these metrics.
attention to affordability, public amenities
and safety are critical.
STATE OF DOWNTOWN 2021 ECONOMIC REPORT URBAN EXPERIENCE / 33Pier 62, Seattle waterfront
Who Lives Downtown? Downtown Demographics
Downtown Seattle has evolved into one of the most
dynamic urban centers in the country. During the
past decade, a prospering job market, a beautiful 84,201* 37
natural environment and vibrant shopping, arts, population median age
restaurant and cultural scenes attracted record
numbers of new residents. While growth slowed in
2020 due to COVID-19-related factors, the downtown
core is expected to remain an attractive place to
1.4 $82,586
average household size median household income
live in the years to come. Today more than one in 10
Seattleites — 84,000 people — live in the center city.
The following is a snapshot of who makes downtown
*Our downtown total population estimate from Esri was
their home. Please note that all statistics on adjusted using residential occupancy data from CoStar to
downtown population and households are estimates account for changes due to COVID-19.
for July 1 of each year. Given the speed and severity
Source: Esri Community Analyst
of the COVID-19 crisis, the data inputs used for these
estimates may not yet capture the full impact of
the pandemic.
STATE OF DOWNTOWN 2021 ECONOMIC REPORT URBAN EXPERIENCE / 34Educational Achievement While the city of Seattle ranks the
Among downtown Seattle residents, age 25+ highest in the nation for educational
attainment, according to U.S.
Census Bureau data, the downtown
population scores even higher on
education than the city or county.
No High School Diploma 5%
High School Graduate 8%
Some College 19%
Bachelor’s Degree 37%
Advanced Degree 31%
Credit: Seattle University
Children Under 18
Downtown Seattle
2,022
2010 More than 5,500 children under 18 live
downtown. In the past decade, school-
1,637
2020 aged children (ages 5-17) increased by
168%. Downtown has the densest and
fastest-growing child population in
1,252
the city but, is the only neighborhood
966
without its own public school.
673
543
422 362
Source: Esri Community Analyst
AGE 0–4 5–9 10–14 15–17
STATE OF DOWNTOWN 2021 ECONOMIC REPORT URBAN EXPERIENCE / 35Households by Income
Downtown SeattleFifth & Pine
COVID-19 Had a Profound Impact
on the Urban Environment
Loss of Foot Traffic Means the Loss of Business Business Closures
COVID-19 led to the closure of many businesses downtown • According to a study by Yelp, more than 4,500 businesses
and across the region. In DSA’s Business Outlook Survey in the Seattle Metro area had closed between March and
conducted in May and September, restaurants and retail April. By the end of August, that number was still over
were hit particularly hard and were more likely than those 3,000, with 59% being permanent.
in most other industries to express concern about having
• DSA has tracked more than 220 permanent street-level
to close locations or pay rent. These industries, along with
business location closures in Seattle in 2020, including
arts, entertainment and hotels, also said it would take
more than 160 downtown alone.*
longer to bring employees back and become profitable than
those in other industries represented in the survey. • Despite a decline in foot traffic downtown, roughly 90
businesses overcame all odds to open new storefronts
in 2020.
*Note that this count refers to specific brick-and-mortar locations. Some of these businesses shifted to other models such as online and delivery
and some may still have open locations downtown or elsewhere. While it’s assumed that the majority of these locations closed due to the
pandemic, there may be other reasons for business closures. DSA’s business closure tracking is not a complete inventory. Rather, it is primarily
based on news reports, announcements by individual businesses, and listings and direct observation of spaces that have gone up for lease.
STATE OF DOWNTOWN 2021 ECONOMIC REPORT URBAN EXPERIENCE / 37Creative Solutions
in the Face of Crisis
Economic recovery could be a two- or three-year time horizon, but actions can be taken
now to sustain downtown’s treasured mix of amenities and ensure a thriving urban core.
Support for small business is essential. Creative adaptation of shared public space is key
to addressing the economic effects of the pandemic and impacts of social isolation. Also,
maintaining outreach, clean and safe services, which the DSA provides through the
Metropolitan Improvement District, are a foundation for recovery and renewal.
Below are just a few of the creative responses that emerged in 2020.
Takeout and Delivery
As COVID-19 impacted the ability
to serve large groups of patrons
with the same density, businesses
and nonprofits shifted gears. Some
restaurants enhanced delivery
services and added take-out options
and to-go windows for food and
cocktails. Some offered products
that were not previously part of their
business model. And some began
using their kitchens to make food for
those in need.
Credit: FareStart
Outdoor Seating
Many restaurants added outdoor seating. Some
brought shelters by way of tents, canopies
or plexiglass. Others experimented with
dining bubbles. In response to the impacts
of COVID-19 on local businesses, the Seattle
Department of Transportation has issued
special permits allowing for expanded use
of sidewalks and street space by restaurants.
At the start of 2021, there were 61 downtown
restaurants with these temporary outdoor
seating permits. DSA’s Park Ambassadors
spaced out tables and chairs for social
distancing and added spacing indicators for
food truck lines.
Pike Place Market
STATE OF DOWNTOWN 2021 ECONOMIC REPORT URBAN EXPERIENCE / 38Through the work of DSA and others, numerous murals
were created in downtown neighborhoods:
38+ 53+ 50+ 53+ 39+
Belltown Capitol Hill Chinatown-ID Pioneer Square Retail Core
Local artist, Carina at Sixth & Pine
Urban Art
DSA helped coordinate corporate and private funding
to hire artists and create many storefront murals on
boarded-up buildings during business shutdowns.
The murals added a touch of vibrancy, creativity and
positivity and helped to deter graffiti and damage
while stores were closed. With these shutdowns, there
was more than an acre’s worth of plywood spread
across the facades of businesses in the Pike-Pine
corridor alone.
Photo credit: Matt McDonald
Street art, downtown Seattle
STATE OF DOWNTOWN 2021 ECONOMIC REPORT URBAN EXPERIENCE / 39Tougo Coffee, First Hill
A Changing Retail Landscape
Assuming that downtown followed the trends for Downtown’s Retail Real Estate
King County, the center city lost an estimated $103
Downtown currently has 10.3 million square feet of retail
million in taxable retail sales in 2020 (a 5% drop for the
space, with nearly a half million more under construction.
year). We also estimate (based on county trends) that
After achieving a record low of 1.7% in 2019, downtown’s
approximately 4,400 brick-and-mortar retail jobs were
retail vacancy is estimated to have reached 2.5% by the end
lost downtown in the second quarter, though some
of 2020 and rent growth slowed to a halt.
of those have come back. This was after downtown
had seen a 5% increase in brick-and-mortar retail
employment in 2019.
Retail Rent Retail Rent Vacancy
Downtown Seattle Downtown Seattle
$50 4%
$40
3%
$30
2%
$20
1%
$10
$0 0%
2010 2015 2020 2025 2010 2015 2020 2025
Actual Forecast Sources: Esri, Opportunity Insights, Puget Sound Forecaster, Puget Sound Regional Council.
STATE OF DOWNTOWN 2021 ECONOMIC REPORT URBAN EXPERIENCE / 40Peer-city Comparisons Change in Occupied Square Feet
Seattle was about on par with other of Retail Space
downtowns nationally for retail Among peer-city downtowns,
performance. Retail occupancy was either year-over-year in 2020
flat or down in all of these downtowns.
Overall, they fared somewhat worse than
their metro areas but, retail struggled at
Austin -2.1%
both the downtown and metro levels. Denver -2.0%
Washington, D.C. -1.8%
Source: CoStar. The cities were selected based on similarities
to Seattle that make them competitive markets (for example, San Francisco -1.6%
strong growth in tech talent). For consistency, CoStar’s
“multifamily” downtown boundary was used for each city Salt Lake City -1.6%
except for Seattle, where DSA’s boundary was used. Note that
these are preliminary numbers. Portland -1.2%
Los Angeles -1.0%
Seattle -0.8%
Atlanta -0.4%
Chicago -0.3%
Vancouver, B.C. -0.1%
Boston 0.0%
Nordstrom flagship store, Seattle
STATE OF DOWNTOWN 2021 ECONOMIC REPORT URBAN EXPERIENCE / 41The Paramount Theatre
Arts, Entertainment and Restaurant
Industries Were Hit Hard in 2020
Parts of the economy have already started to reopen with new protocols in place
to ensure safety for workers and customers. Nevertheless, national polling and
evidence from other areas that have reopened show that — regardless of the level of
reopening — the pandemic will continue to have a depressing effect on the economy,
particularly for sectors related to travel or in places where people congregate such as
fitness centers, restaurants, hotels, sports, arts and entertainment venues.
STATE OF DOWNTOWN 2021 ECONOMIC REPORT URBAN EXPERIENCE / 42Job Impacts
Food-Service Jobs
While many of the jobs lost have already started Downtown Seattle
coming back, COVID-19 shutdowns had a profound
impact on these industries. There were approximately 25,000
13,700 job losses among downtown food-service
workers in the second quarter of 2020. This is the 20,000
equivalent of approximately 60% of the total food-
service jobs downtown in 2019. Center city jobs in arts,
15,000
entertainment and recreation industries decreased by
roughly 6,300 in the second quarter, the equivalent of
10,000
approximately three-quarters of the employment in
these industries downtown in 2019.
5,000
0
2010 2012 2014 2016 2018 2020
Economic Impacts to the Arts Arts, Entertainment and Recreation Jobs
Downtown Seattle
Nearly all arts organizations canceled programs due to
COVID-19 and a majority called off annual fundraisers, 10,000
a critical source of revenue for these organizations.
ArtsFund surveyed its members in March 2020 and
projected that Puget Sound-area arts organizations 7,500
would see the following as a direct result of COVID-19:
5,000
NEARLY AS MUCH AS
5,000 $135M
workers furloughed in lost revenue in 2020 2,500
or laid off
0
2010 2012 2014 2016 2018 2020
Source: Puget Sound Regional Council. Note that
the 2020 figure was estimated using data from
PSRC and the Washington State Employment
Security Department. While PSRC figures are for
March of each year, we estimated 2020 using
data from April to better capture the effects of
COVID-19. The 2013 jobs data were unavailable
and were therefore interpolated.
STATE OF DOWNTOWN 2021 ECONOMIC REPORT URBAN EXPERIENCE / 43COVID-19 Heightened Challenges Facing
Downtown’s Urban Environment
Before downtown can return to viability, some key
challenges must be addressed. Public spaces must
feel accessible, safe and welcoming to everyone.
Before COVID-19 and the civil unrest triggered
by the murders of George Floyd, Breonna Taylor
and others, the issue of homelessness nearly
always topped the list of concerns in downtown
stakeholder surveys, along with transportation
and housing affordability. Recently, there has
been a notable increase in the number of people
citing concerns about public safety as well.
Violent Crime in Downtown Seattle
Includes aggravated assault, homicide,
rape and robbery Looking north from Beacon Hill
1,936 1,955
1,835
A Safe Urban Environment for Everyone
1,697
Seattle’s criminal-justice and behavioral-health systems
are fractured and fail to protect all Seattleites, deter crime,
1,541 support, or help those who become trapped in a cycle of
1,486 crime, arrest and release. In the face of a public-health crisis,
this puts downtown small businesses in further jeopardy.
Concerns over personal safety are compounding concerns
about returning to the office. Citywide and downtown
polling shows that Seattleites believe there is an urgent need
to help people struggling in crisis on our streets. In this
environment, downtown is in a fragile state and without
action, this could have long-term impacts.
Without a cohesive solution, downtown has seen an increase
in reports of violence, theft, vandalism and individuals in
crisis. All of these make the neighborhood feel less safe. The
increase in violent crime is particularly disturbing. Between
2015 and 2020, these crimes increased by 23%.
As downtown reckons with the current health and economic
crisis and continued social injustice, our city leaders must
come together to forge a way that allows Seattle to be a
model for cities around the world by becoming a safe and
2015 2016 2017 2018 2019 2020 welcoming place for everyone and an attractive destination
for visitors, residents and investment.
Source: City of Seattle
STATE OF DOWNTOWN 2021 ECONOMIC REPORT URBAN EXPERIENCE / 44DSA Outreach Team near Western Avenue
Seattle Continues to Face a
Growing Homeless Crisis
A January 2020 point-in-time count conducted by All As a region, we must address our growing homelessness
Home King County tallied 11,751 individuals experiencing crisis. The city of Seattle and King County are moving
homelessness in King County — a 5% increase over 2019. forward together on plans to merge operations and policy-
Roughly half of those were sleeping outside, mostly within making for homelessness services. This is a much-needed
the city of Seattle. step toward housing the incredible number of people
experiencing homelessness in Seattle and King County.
The need has only gotten more urgent in the face of a
However, this work has only begun. We can’t lose focus
public-health crisis. As COVID-19 outbreaks created fear
on what’s happening downtown, where hundreds sleep
of sleeping in shelters and capacity was limited due to
outside on any given night. A sustainable solution requires
social-distancing requirements, the number of tents
working together on many fronts. This includes increasing
throughout downtown’s neighborhoods multiplied
coordination, diversion and prevention, state and regional
dramatically. By the end of 2020, the number of tents
investment, and increased housing supply.
downtown had increased to more than three times the
highest previous record.
STATE OF DOWNTOWN 2021 ECONOMIC REPORT URBAN EXPERIENCE / 45You can also read