Center for International Development at Harvard University
←
→
Page content transcription
If your browser does not render page correctly, please read the page content below
Who Wins in the World Economy and
English Football?
And is it possible for lower tier participants to
‘catch up’
Matt Andrews
CID Faculty Working Paper No. 345
January 2019
Copyright 2019 Andrews, Matt; and the President and Fellows
of Harvard College
Working Papers
Center for International Development
at Harvard UniversityWho Wins in the World Economy and English Football?
And is it possible for lower tier participants to ‘catch up’
Matt Andrews
Harvard Kennedy School
Abstract
Globalization has fed significant economic gains across the world. The gains lead some
policymakers in developing countries to believe in the potential of ‘catch up’—where they
leverage the gains of an open world economy to foster rapid progress and compete with more
developed nations. This belief is particularly evident in countries like Rwanda, where policymakers
aspire to turn the country into ‘Africa’s Singapore’. This paper asks if such aspiration is realistic:
Do developing countries really gain enough from globalization to catch up to more developed
countries? The paper examines the world economy as a league in which countries compete for
winnings (manifest in higher income and production). Wealthier countries are in the top tiers of
this league and poorer countries are in the lower tiers. The paper asks if gains from the last
generation of growth have been distributed in such a way to foster ‘catch up’ by lower tier
countries, and if we see these countries ‘catching up’ by moving into higher tiers. This analysis of
the world economy is compared with a study of English football, where over 90 clubs play in an
multi-tier league system. Prominent examples of ‘catch up’ in this system include Leicester City’s
rise from the third tier in 2008 to become first tier champion in 2015. The paper asks if such ‘catch
up’ is common in English football, given the way winnings are distributed, and if ‘catch up’ is more
common in this context than in the world economy more generally.
1“Proponents of globalization say that it helps developing nations ‘catch up’ to industrialized
nations … ”
Lisa Smith, Journalist 1
“We … focus on economic performance … because the ultimate goal of any nation aspiring to
develop, aspiring to catch up, is to improve the livelihoods of the people.”
Arkebe Oqubay, Minister, Prime Minister’s Office, Ethiopia 2
“…because of the Premier League’s global footprint, the economic gap between the elite and
the rest has become a chasm.”
Tim Wigmore, Journalist 3
Can lower tier participants ‘catch up’ in globalized competitions?
Economic globalization has accelerated over the last generation. This is reflected in the expansion
of world exports, which grew from about $7 trillion in 1990 to $25 trillion in 2016.4 This
acceleration is also evidenced in the increased flow of migrants over borders, which the United
Nations estimates have doubled since 1990.5 Another telling indicator is the explosion in air
travel; 6 the number of annual global air travelers grew from 1 billion in 1990 to 4 billion in 2016,
global freight transfers grew from 56,000 to 214,000 tons per year, and the number of registered
flight departures grew from 14.5 million to 35.8 million per year.
The economist Branko Milanovic notes that these and other impacts of globalization have reduced
“obstacles between people in the world” and generated historically high levels of participation in
the world economy. 7 This has led to significant economic gains, felt across the world. Countries in
Latin America and the Caribbean, for instance, more than doubled regional gross domestic product
between 1990 and 2016. Real per capita incomes have also risen; from about $2,000 in 1990 to
over $12,000 in 2016 in East Asia and the Pacific and by about 35% in Africa in the same period. 8
Some countries grew more rapidly; Rwanda, for example, doubled its average real per capita
income between 1990 and 2016.
1
Smith, L. 2007. The Good and Bad of Globalization. Forbes. May 11, 2007.
https://www.forbes.com/2007/05/11/globalization-outsourcing-nafta-pf-education-
in_ls_0511investopedia_inl.html#44539f062d08
2
Aglionby, John. 2017. Ethiopia bids to become the last development frontier. Financial Times. July 3, 2017.
https://www.ft.com/content/76968dc4-445f-11e7-8d27-59b4dd6296b8
3
Wigmore, T. 2018. The Premier League is losing its competitive balance – that should be cause for concern. iNews.
February 2, 2018. https://inews.co.uk/sport/football/premier-league-competitive-balance/
4
Exports are measured in 2010 prices to capture the real value. Data from the World Development Indicators,
available at https://data.worldbank.org/indicator/NE.EXP.GNFS.KD
5
The UN-DESA international migrant stock data show that migrants have grown in number from 150 million to 260
million in the last twenty-five years. See data at https://migrationdataportal.org/data?i=stock_abs_&t=2017
6
Air travel data comes from the World Bank. See https://data.worldbank.org/indicator/IS.AIR.PSGR
7
Bevins, V. 2016. To Understand 2016’s Politics, Look at the Winners and Losers of Globalization. An interview with
economist Branko Milanovic. New Republic. December 20, 2016.
https://newrepublic.com/article/139432/understand-2016s-politics-look-winners-losers-globalization
8
Measured in 2011 dollar values and controlling for purchasing power parity.
2This kind of evidence leads luminaries like Bill Gates to say, “On the whole, the world is getting
better.” 9 Such evidence also inspires a belief that developing countries can ‘catch up’ to more
developed nations and compete more in the world economy. Rwanda is a country that exudes this
belief, with the government regularly suggesting it will become ‘Africa’s Singapore’. 10 The belief is
also apparent in respect of countries like Georgia and Colombia, where recent growth has led to
both being called ‘economic miracles’. 11 Some East Asian countries are similarly heralded, with
observers identifying nations like Vietnam and Myanmar as the next Asian Tigers—developing
countries that can ‘catch up’ to compete with traditionally richer nations. 12
I encounter this belief in policymakers across the developing world, all trying to design policies
that leverage new global opportunities to promote economic ‘catch up’ for their nations. They
often ask about lessons from countries that seem to be examples of ‘catch up’—like Rwanda and
Georgia and Colombia and many in East Asia. The hope of such officials is captured in the words
of Arkebe Oqubay, Minister in Ethiopia’s Prime Minister’s Office, used to explain why his country
focuses on economic policies in development initiatives: “Because the ultimate goal of any nation
aspiring to develop, aspiring to catch up, is to improve the livelihoods of the people.” 13
One wonders if such hope is realistic: Do developing countries really gain enough from
globalization to catch up to more developed countries in the world economy?
I address this question here, by examining patterns of ‘winning’ in the world economy over the
last generation. I treat the world economy as a ‘league’ in which countries fall into different tiers,
with top tiers comprising wealthier countries and lower tiers housing poorer countries. I look at
how economic winnings—income and production—are distributed across these tiers in 1990 and
2016 and if there is evidence of countries improving their league position and ‘leapfrogging’ tiers
over time (to ‘catch up’ and gain more winnings).
To add a comparative angle to the paper, I augment this study of the world economy with a similar
investigation of English football. Ninety-two clubs participate in this league system each year, in
four tiers; all ostensibly competing for the financial winnings that fuel professional football. The
league system has globalized significantly since the 1990s, becoming more popular, powerful, and
9
See Gates, W. (2018). Why I decided to Edit an Issue of Time. Time Magazine, January 4, 2018. In this op-ed, Gates
notes that, “This [his views on the world getting getter] is not some naively optimistic view; it’s backed by
data. Look at the number of children who die before their fifth birthday. Since 1990, that figure has been
cut in half. That means 122 million children have been saved in a quarter- century, and countless families
have been spared the heartbreak of losing a child.”
10
Economist. 2012. Africa’s Singapore? February 25, 2012.
https://www.economist.com/business/2012/02/25/africas-singapore
11
See, for instance, Economist. 2010. Georgia’ Mental Revolution. August 19, 2010
(https://www.economist.com/europe/2010/08/19/georgias-mental-revolution); and Forero, J. 2012. ‘Colombian
Miracle’ takes off. Washington Post, April 13, 2012.
(https://www.washingtonpost.com/world/the_americas/colombian-miracle-takes-
off/2012/04/13/gIQAsnEdET_story.html?noredirect=on&utm_term=.c38e8e210f30).
12
Fuller, E. 2016. Vietnam Poised To Be Asia's Next Economic Tiger. Forbes. September 7, 2016.
(https://www.forbes.com/sites/edfuller/2016/09/07/vietnam-poised-to-be-asias-next-economic-
tiger/#505cdf8a44cf)
13
Aglionby, John. 2017. Ethiopia bids to become the last development frontier. Financial Times. July 3, 2017.
https://www.ft.com/content/76968dc4-445f-11e7-8d27-59b4dd6296b8
3wealthy in the process. 14 Similar to believing that globalization helps developing countries ‘catch
up’ with developed economies, some observers argue that a more globally connected English
football sector creates opportunities for traditionally less successful clubs to ‘catch up’ to
traditionally more successful clubs. 15 As evidence, proponents of this belief point to the fact that
unheralded Leicester City Football Club rose from the third tier of competition in 2008 to win the
top tier Premier League title in 2015. 16 ‘Lessons from Leicester’ are now regularly offered to
policymakers across the world trying to promote ‘catch up’. 17
Various observers suggest that Leicester’s story is an aberration, however, and that globalization
causes more English football clubs to ‘fall back’ instead of ‘catch up’. Pointing to growing gaps
between ‘winners’ at the “top” of the league system and “those struggling at the bottom”
since the league’s globalization, 18 these observers argue that clubs in lower tiers of the
English football league system have become less capable of competing for winnings over time.
In contrast, they suggest that a few top tier clubs have become more dominant in the
competition. In the words of journalist Tim Wigmore, “the economic gap between the elite and
the rest has become a chasm.” 19
The argument is that traditionally richer clubs have gained relatively more from the newly
globalized league than traditionally poorer clubs. This, it is suggested, has cemented a highly
exclusive competitive order in English football, increasingly excluding many smaller clubs from
competing for most of the sector’s winnings. If this argument is true, the English football
experience would cause us to be skeptical about the potential for developing country ‘catch up’ in
the world economy. In contrast, we would expect to see developing countries ‘fall back’ in the
world economic order. This paper asks if the argument is indeed true—in respect of English
football and the world economy; who does win in these globalized competitions, and is ‘catch’ up
possible for lower tier participants (developing countries and smaller football clubs)?
14
Bond, D. 2013. Has the evolution of the beautiful game been for better or worse? BBC.Com. April 29, 2013.
https://www.bbc.com/sport/football/22314015
15
This is just one of the potential gains some economists suggest globalization will bring to a sport like football. As
Binyamin Applebaum noted in a 2015 New York Times article, “Economists have long held up soccer — which has
become one of the most globalized markets for skilled labor — as a shining example of the benefits of open borders.
The Premier League now draws capital and labor from around the world, and produces a spectacle consumed
around the world … And economists say that’s good for the players, their countries — and for England.”
(Applebaum, B. 2015. Harry Kane, Globalization and the Push to Limit Foreign Players in the Premier League. New
York Times. April 1, 2015. https://www.nytimes.com/2015/04/02/upshot/globalization-under-attack-on-the-soccer-
field.html).
16
Bagehot, J. 2016. Leicester City’s success suggests globalization is strengthening, not killing, English football.
Economist. May 3, 2016. https://www.economist.com/bagehots-notebook/2016/05/03/leicester-citys-success-suggests-
globalisation-is-strengthening-not-killing-english-football
17
See, for instance, the ‘Leadership lessons from Leicester City’ by management consultants Stuart Crainer and Des
Dearlove on the ‘Thinkers50. come web site (https://thinkers50.com/blog/leadership-lessons-leicester-city/).
18
Wright, J. 2013. The Ugly Business of the Beautiful Game: How Football List its Soul. Huffington Post. June 13,
2013. https://www.huffingtonpost.co.uk/john-wight/football-lost-its-soul_b_3433753.html
19
Wigmore, T. 2018. The Premier League is losing its competitive balance – that should be cause for concern. iNews.
February 2, 2018. https://inews.co.uk/sport/football/premier-league-competitive-balance/
4Leagues, participation, and competitiveness
‘Leagues’ exist all over the world,. They fulfill two purposes, as captured in different definitions:
• One definition sees a league as ‘a collection of people, countries, or groups that combine for
a particular purpose, typically mutual protection or cooperation’.
• A second definition holds that leagues are ‘group[s] of sports clubs that play each other over
a period for championship[s].’
The English football league system demonstrates how both definitions of ‘league’ often overlap in
the same context. This league system is a collection of member clubs that combine and cooperate
to play the sport professionally; given agreed rules and structures. The member clubs also
compete with each other, in championships where some win and others do not. Winnings
manifest in more than on-field victories and trophies. Winning clubs earn more money than
others, and these financial gains are arguably the focal point of professional football.
The English football league system is large, and different clubs in the system have different
capabilities. This means that it is not possible—or desirable, perhaps—for all members to play
against all other members. 20 As a result, the 92 clubs are divided into smaller groups of 20-24 clubs
that play at similar competitive levels. These different tiers are then organized into a hierarchy.
Clubs in the top tiers—now called the Premier League and the Championship—are considered
better quality (and more competitive) than clubs in lower tiers—League One and League Two.21
The financial winnings associated with each tier are different, and clubs in higher tiers receive
greater financial benefits simply by qualifying for these higher tiers. ‘Promotion’ to higher tiers is
thus a valuable prize in itself, and a competitive mechanism allows the better performing clubs to
rise in the hierarchy, one tier at a time. Similarly, a relegation mechanism forces clubs that perform
poorly to drop to lower (and less financially rewarding) tiers.
As described, it is beneficial for all clubs wanting to play professional football to participate in the
English professional football league system (any club wanting to professionalize has a body it can
join, where others have already created the institutions needed to play professional football). The
benefits to participation are not equal for all members, however, as more competitive clubs are
likely to win more (and thus be more economically successful) than others. Clubs that become
more competitive over time can rise in the system and earn more economic success, however,
such that all participants have a hope of ‘winning’ more in future.
The analysis that follows in future sections asks questions about this league:
• How much do the economic winnings differ across and within league tiers?
• Has this pattern of winnings changed over time?
• How ‘competitive’ is this system (do the same clubs win again and again)?
• How real is the ‘hope of winning’ for lower tier participants?
20
The Football Association (FA) Cup is a championship that does include all clubs in the main leagues, but this is not
the main competition for any of the clubs.
21
Beyond these primary leagues one also finds lower leagues where less competitive clubs are members, like the
National League, Southern League, Northern League, and Isthmian League.
5I ask the same questions of countries in the global economic community. This community has
many of the hallmarks of a league system. 22 At a macro level, countries are the members of this
system, and ‘participate’ in various ways. Formal league structures include membership of global
organizations (like the United Nations, World Trade Organization, World Bank, and International
Monetary Fund (IMF)). These organizations exist to help foster processes, rules, and norms of
communication and commerce between countries (and firms in countries) so that every country
does not have to develop its own communication and commerce mechanisms. The work of these
organizations helps to smooth interaction across countries and to lessen transaction costs in the
economic ‘game’. These organizations can also provide community assistance to member
countries (with members accessing subsidized loans or assistance from the World Bank, for
instance, or ‘lender of last resort’ help from the IMF).
Beyond these participatory structures, countries actively compete against each other in this
league; for talent and production and economic growth. 23 The competition is fierce, and manifests
in governments employing all sorts of policies to try and attract new businesses that will bring jobs
and economic benefits to their shores. Many developing and emergent countries have worked
hard to improve their performance on ‘Doing Business’ indicators, for example, to show that they
are competitive destinations for globally mobile firms and talent to locate and engage. 24
As with clubs in the English football league system, countries in this competition have different
capabilities. Unlike the English football league, however, the global economic system does not
have formal league hierarchies to organize countries into different competitive tiers. The closest
one gets to this kind of organization are the various structures that group countries according to
some or other similar characteristic or for a specific economic purpose. The Organization for
Economic Cooperation and Development (OECD) is an example. This is a country grouping that
brings higher income countries together to (among other things) further their interests in learning
22
Many analysts use the league metaphor to order and analyze the world system, in areas as diverse as education,
scientific advancement, and health. See, for instance: Marginson, S. and Van der Wende, M. 2007. To rank or to be
ranked: The impact of global rankings in higher education. Journal of studies in international education, 11(3-4),
pp.306-329; King, D.A. 2004. The scientific impact of nations. Nature, 430(6997), p.311.
23
There is a large literature describing the industrial and economic policies used to foster competition between
nations in the hope of ‘catch up’. Recent examples include Hausmann et al., Nayyar, Noman and Stiglitz, Popov and
Jomo, Rodrik, and Whitfield et al. Hausmann, R. 2016. Economic Development and the Accumulation of Know-
how. Welsh Economic Review, 24, pp.13-16; Hausmann, R., Cheston, T., Santos, M. and Pietrobelli, C. 2016. Towards
a Prosperous and Productive Chiapas: Institutions, Policies, and Public-Private Dialog to Promote Inclusive Growth.
Harvard School Center for International Development Working Paper 317; Nayyar, D. 2013. Catch Up: Developing
Countries in the World Economy. New York: Oxford University Press; Noman, A. and Stiglitz, J.E. eds. 2015. Industrial
policy and economic transformation in Africa. Columbia University Press; Popov, V and Jomo, K.S. 2018. Are
developing countries catching up? Cambridge Journal of Economics, 42(1): 33– 46; Rodrik, D., 2017. Straight talk on
trade: Ideas for a sane world economy. Princeton University Press; Rodrik, D. 2018. Populism and the Economics of
Globalization. Journal of International Business Policy, pp.1-22; Whitfield, L., Therkildsen, O., Buur, L. and Kjær, A.M.
2015. The politics of African industrial policy: A comparative perspective. Cambridge University Press.
24
For a discussion of such reforms, see Besley and Oto-Peralias and Romero-Avila. Besley, T. 2015. Law, regulation,
and the business climate: The nature and influence of the World Bank Doing Business project. Journal of Economic
Perspectives, 29(3), pp.99-120; Oto-Peralías, D. and Romero-Ávila, D. 2017. Literature Review on the Effect of the
Ease of Doing Business on Economic and Financial Outcomes. In Legal Traditions, Legal Reforms and Economic
Performance (pp. 37-56). Springer.
6about addressing common challenges. Another example is the European Union, which groups
geographically proximate countries together to advance common interests related to (among
other things) trade and other issues of movement and interaction.
Beyond these particular groupings (and the many like them), there is no one formal league
hierarchy that differentiates the ‘economic competition’ different countries will participate in. All
countries, therefore, compete with each other.
There is, however, an informal understanding in the global development community that
countries are different. This is reflected in the way organizations like the World Bank have
traditionally differentiated countries based on their income levels—with high income, upper
middle income, lower middle income, and low income groupings. 25 The argument behind such
differentiation is that different countries need different support, depending on their economic
status. One could extend the argument to suggest that different countries will also be differently
competitive depending on their economic status.
Given such argument, this paper employs a version of the approach to examine the world
economy, breaking the world’s economic league system into five tiers (using real total Gross
Domestic Product (GDP) and Gross Domestic Product Per Capita (GDPPK) data drawn from the
World Development Indicators). The world’s countries are organized into a long list, and the top
20% of countries in that list—by either real GDP or real GDPPK—makes up the top (first) tier, with
the lowest 20% of countries making up the bottom (fifth) tier. This kind of arrangement allows one
to ask the same questions raised in respect of English football, in sections that follow:
• How much do the economic winnings differ across and within league tiers?
• Has this pattern of winnings distribution changed over time?
• How ‘competitive’ is this system (do the same countries win and again)?
• How real is the ‘hope of winning’ for lower tier participants?
Patterns of competitiveness in English football
This section looks into patterns of economic competitiveness in the English men’s football league
system. It does so by examining patterns of winnings distributions across clubs playing in the
various tiers of the league system over the last generation (since the Premier League was created
in 1992). Data on the financial conditions in English football were obtained from various sources,
including Deloitte’s reviews of soccer, the European Football Association (UEFA), and the media.26
The data is considered as reliable as possible (given that other academic studies routinely use
such), 27 and provides the picture needed to see where ‘economic winnings’ accrue in the league
system and how this pattern has changed in the last generation.
25
Fantom, N. and Serajuddin, U., 2016. The World Bank's classification of countries by income. The World Bank.
26
For a discussion of these sources, see Andrews, M. and Harrington, P. 2015. Off Pitch: Football's Financial
Integrity Weaknesses, and How to Strengthen Them. HKS Working Paper No. RWP16-009. Refer, also, to the Deloitte
reviews on football finance (with the 2015 report available at http://www2.deloitte.com/uk/en/pages/sports-
business-group/articles/annual-review-of-football-finance.html).
27
Studies using similar data include the following: Institute of Chartered Accountants in England and Wales (ICAEW)
study on ‘Accounting for Football Clubs’ (http://www.icaew.com/en/library/subject-
7How much do the economic winnings differ across and within league tiers?
Revenue was used to capture economic winnings; of clubs across the entire league’s tiers. This
includes money earned from matches (gate receipts), media offerings (broadcast revenue), and
sponsorships, merchandise and other marketing products (commercial revenue). This is a broad
measure of ‘economic winnings’ that obviously extends beyond the prize money obtained when a
club wins a league. 28 The broader measure shows how much a club earns through its efforts to
win fans who attend matches, viewers who watch broadcasts, broadcasters who choose to screen
one club’s match over another’s, sponsors who pay to have one club represent their product
instead of another’s, consumers who decide to buy one club’s shirt rather than another’s, and
more. These—it is argued—are the real economic winnings professional clubs vie for.
Considering proceeds from all these activities, sources estimate that the English football league
system—at least the top four tiers thereof—generated about £3 billion in ‘economic winnings’ in
the 2012/13 season (the most recent season in which data was accessible across all leagues). 29
These winnings were not equally distributed, however. As Figure 1 shows, 80% of the top four
tiers’ spoils were accumulated in the top 20 clubs in the top tier Premier League (which accounted
for only 22% of all the clubs in the top four tiers). The remaining 20% of economic winnings was
shared between 72 clubs in the other three tiers. The 24 clubs in the second tier Championship
generated 14% of the revenue, or £435 million. The 24 clubs in third tier League One generated
4% of the revenue, or £120 million. The 24 clubs in fourth tier League Two generated 3% of the
revenue, or £86 million.
Figure 1. Revenue Share Across the Top Four Tiers in the English Football League System
Premier League: 80% of total Championship: 14% of total League 1: 4% of total League 2: 3% of total league
league system winnings (22% league system winnings (26% of league system winnings system winnings (26% of
of clubs in system) clubs in system) (26% of clubs in system) clubs in system)
Top club Average club Top club Average club Average club share: Average club share:
share: 11.5% share: 4% share: 0.6% share: 0.58% 0.016% 0.0126%
Source: Data drawn from Deloitte publications on English football finances, various years.
gateways/accounting/accounting-by-industry/football-clubs). Kesenne, S. 2007. The Peculiar Economics of
Professional Football in Europe, Scottish Journal of Political Economy 54(3), pp.388-399; Morrow, S. 2003. The
People’s Game: Football, Finance and Society. London: Palgrave MacMillan; Szymanksi, S. 2012. Insolvency in English
professional football: Irrational Exuberance or Negative Shocks? International Association of Sports Economists
Working Paper No. 12-02.; Szymanski, S. 2015. Money and Football: A Soccernomics Guide. New York: Nation Books.;
Szymanski, S., and Kuypers, T. 1999. Winners and Losers: The Business Strategy of Football, London: Viking Press.
Szymanski, S., and Smith, R. 1997. The English Football Industry: Profit, Performance and Industrial Structure,
International Review of Applied Economics, 11, pp. 135-153.
28
For a thorough discussion of the economic model of football clubs—and hence the ‘winnings’ these clubs are
competing for—see Andreff and Staudohar (who have done particularly interesting work differentiating the
Spectator-Subsidies-Sponsor-Local financing model (SSSL) and the Media-Corporations-Merchandising-Markets-
Global model (MCMMG)). Andreff, W., and Staudohar, P. 2002. European and Sports Business Models. In Barros, I.,
and Szymanski, S. (Eds.). Transatlantic Sport: The Comparative Economics of North American and European Sports.
Northampton: Edward Elgar, pp.23-49.
29
For a fuller analysis of the league system’s finances in 2013, see Andrews, M. and Harrington, P. 2015. Off Pitch:
Football's Financial Integrity Weaknesses, and How to Strengthen Them. HKS Working Paper No. RWP16-009.
8This data shows that there is varied distribution of economic winnings across the English football
league system. The overall winner of the league system gets about 12% of the full economic
winnings, with the average top tier club enjoying 4% of the entire system’s winnings. The average
club in the next tier gets only 0.58% of the winnings, but this is high compared with the 0.016%
and 0.0126% flowing to the average clubs in tiers three and four of this league system. The
difference between the club at the top of all tiers and the average club sitting in the fourth tier is
huge, with Manchester United earning about 2,400 times what a League Two club like Accrington
Stanley earns (nearly £400 million compared with about £200,000).
This winnings gap is also reflected in wages earned by players in different tiers. 30 The average
player in the top paying club in the English Premier League earned £30 million in 2010, compared
with £11 million pounds for the average Premier League player, and £200,000 in the next tier
Championship, £70,000 in the next tier League One, and £38,000 in the next tier League Two. The
difference, from top-to-bottom, is huge, with ‘winners’ in the top position Manchester United
earning (on average) 1,500 times more than those playing in the fifth tier.
This evidence suggests that while there are many participants in this professional football league,
the economic winners are few. The winning clubs and players win big but most clubs are just
participants, and most of these participants (clubs or players) enjoy very little of the community’s
spoils. This confirms what political commentator John Wright identifies as “extreme disparity”
between a narrow set of ‘winners’ at the “top of football and those struggling at the
bottom.” 31 Hamish McRae, a columnist for the Independent, has a more direct view on the
matter: “the few at the top [take] much of the pot” and leave the rest with very little. 32
Has the share of economic winnings changed over time?
The economic situation in English football has changed in the last generation, and all participants
in the league system have arguably benefited from the changes. Revenues have increased across
all league tiers—with the aggregate winnings in English football growing exponentially between
1992 and the present. 33 As an indicator of this growth, wages for football players have grown at
a faster rate than the average English worker’s salary. The compound average growth rate of a
player’s wages in even the fourth tier of English football was 6.3% between 1990 and 2010,
compared with a growth rate of 4.3% for the average English wage.
30
The discussion on wages is based on Nick Harris’s analysis of wage rates in leading football leagues. (See the article
in London’s Daily Mail: http://www.dailymail.co.uk/sport/football/article-2833020/Premier-League-wages-dwarf-
Europe-flight-players-England-earning-average-2-3million-year.html). These data resonate with evidence in the 2015
SportingIntelligence Global Sports Salary Survey (http://www.globalsportssalaries.com/GSSS%202015.pdf). An
exchange rate calculation produced the dollar estimates, based on an approximate rate of £1=$1.6. For similar analysis
in other contexts, see also Papanikolaou, P. undated. The impact of the Bosman ruling on football leagues. (available
at http://easm.avito.nl/download/2006/5f98f30070fb07eb80446bb568516415.pdf).
31
Wright, J. 2013. The Ugly Business of the Beautiful Game: How Football List its Soul.
https://www.huffingtonpost.co.uk/john-wight/football-lost-its-soul_b_3433753.html
32
McRae, H. 2004. Economic View: A few winners, lots of losers. Independent. March 7, 2004.
https://www.independent.co.uk/news/business/comment/economic-view-a-few-winners-lots-of-losers-72467.html
33
As in footnote 22, the discussion on wages is based on Nick Harris’s work on the subject.
9In a sense, thus, ‘the tide has risen’ for all English football clubs. And all clubs (and players) should
be better off as a result. But the gains have not been equally distributed, and the share of winnings
has changed over time—being more concentrated at the top than it was a generation ago.
This is probably best exemplified in the differential rate of wage growth across tiers of the league
system. Top tier Premier League salaries were about four times those in the 4th tier in 1990, for
instance, but are now over 300 times larger. This is because top tier Premier League salaries grew
at a compound annual growth rate of about 20% between 1990 and 2010, whereas growth rates
were 6% in lower tiers. Wage growth in lower tiers was still higher than the growth rate in average
English wages, but much lower than growth in higher tiers. This signals lower rates of ‘winning’ (in
an economic sense) by players in lower tiers as compared with players in higher tiers. Players in
top tiers seemed to have gained more from the newly globalized sector than those in lower tiers.
The same observation can be made when looking at revenue gains across the different tiers
between 1992/93 and 2012/13 (as in Table 1). Clubs in the top tier Premier League saw a huge
increase in revenues in this period, with this tier’s revenues rising from £225 million to £2,525
million in the period. Second tier clubs increased aggregate revenues from £58 million to £435
million. The lower tiers also saw growth, but at much lower rates.
Table 1. Revenue in Top 4 Tiers of the English Football League (and Proportion of Total), £ million
Revenues (in pounds) in select years, by tier Share of league system’s revenues, select years, by tier
1992/93 2005/06 2012/13 1992/93 2005/06 2012/13
Tier 1 Premier League 225 1379 2525 70.75% 74.14% 79.75%
Tier 2 Championship 58 318 435 18.24% 17.10% 13.74%
Tier 3 League One 21 102 120 6.60% 5.48% 3.79%
Tier 4 League Two 14 61 86 4.40% 3.28% 2.72%
Total 318 1860 3166 1 1 1
Source: Various data sources, including Deloitte statistics on English football clubs
The rate of growth of revenue in the top tier Premier League has overwhelmed every other tier,
meaning that clubs at this top level now enjoy 10% more of the league system’s winnings than
they did in 1992 (with the share of revenue rising from 70% to 80% in the last generation, as shown
in Table 1). The ‘winnings’ in tiers three and four (League One and League Two) have increased in
absolute terms (from £35 million to £206 million) but are lower as a share of the total league
system winnings than in 1992/93. This share dropped from 11% of the total to 6.4%.
The summary message is simple: winnings have increased across the English football league
system (so everyone is, at least theoretically, better off) since the system globalized in the 1990s,
but the winnings have become more concentrated at the top of this system in this period. Those
clubs that prove competitive enough to make the top tier, or to win in this top tier, win relatively
more than they ever did in the past. Those clubs that just participate in lower tiers win a smaller
share of the overall pie than they did in the past. As a result, one cannot expect much ‘catch up’
in this league system. Actually, lower tier clubs seem to have ‘fallen back’ progressively; lagging
behind those clubs competing in higher tiers—given that the ‘gap’ in financial winnings should
yield ‘gaps’ in on-field competitiveness as well (where wealthier clubs perform better on the pitch).
10This relationship between off field and on field winnings is reflected in a high correlation between
the off-field economic rank order of clubs (determined by annual revenues) and the league
positions associated with on-field performance. In 2012/13, for instance, the top performing four
clubs on the field were also the top four performers in terms of economic winnings (Manchester
United, Manchester City, Chelsea, and Arsenal). Eight of the top ten on-field performers were also
in the top ten list of revenue generators. Going beyond the ‘top of the table’ clubs, one finds a
strong statistical correlation between on-field playing rankings (end of season results) and off-field
economic rankings (revenue generation) for the top 50 clubs (where data on economic
performance are accessible). This correlation was 0.88 in 2012/13.
The strong relationship between league status, playing performance, and economic winnings is
not at all surprising. A virtuous cycle connects winning of all kinds in this league. 34 Clubs win
economically when they win on the field—becoming more popular among fans, more likely to be
chosen for peak-hour and prime dollar broadcasts, and such. Clubs that win economically are also
more likely to win on the field—because they can use economic winnings to set themselves up for
playing success, especially by buying better players and managers and facilities.
This virtuous cycle has become stronger over time; as winners have taken home relatively more
of the economic winnings and other participants go home with an increasingly lower share.
How economically ‘competitive’ is the system (do the same clubs always win)?
So far, the data shows that being in the top tiers of English football yields significant ‘winnings’ to
clubs. It also shows a relationship between off-field and on-field winnings: in a virtuous cycle, clubs
with higher financial gains tend to also enjoy higher end of season league positions.
So, which clubs are in the higher tiers, and winning? Are these the same clubs, year after year?
One way to look at this is to consider which clubs started in the top tiers (the Premier and
Championship) in 1992 and were still in those leagues in 2016. The numbers are relatively high,
especially considering just the clubs that started in the Premier League in 1992: 82% of these clubs
were still in top tiers in 2016, playing in either the Premier League or the Championship, with 45%
of the clubs still in the top Premier League itself. This means that—over a generation—clubs that
started in the top tier had an 82% chance of staying in the top two tiers and a 45% chance of
staying in the top tier itself. Beyond this, 62% of the clubs competing in either the Premier League
or Championship in 1992 were still competing at this high level in 2016.
So, clubs playing in the top two tiers in 1992 were highly likely to still be there a generation later,
suggesting a concentration of winning with a limited number of clubs.
34
For a discussion of this virtuous cycle, see Andrews, M. 2015. Being Special: The Rise of Super Clubs in European
Football. Harvard Center for International Development Working Paper 299. See also Krabbenbos, T. 2013.
Commercialization strategies in football. Thesis at University of Twente, covering work on Belgium and the
Netherlands. http://essay.utwente.nl/62826/1/Masterthesis_TPKrabbenbos.pdf. See also the discussion of this issue
in Tim Wigmore’s article on the topic (Wigmore, T. 2018. The Premier League is losing its competitive balance – that
should be cause for concern. iNews. February 2, 2018. https://inews.co.uk/sport/football/premier-league-
competitive-balance/).
11This analysis does not show the movement of clubs in the years between 1992 and 2016, however.
There was quite a lot of such shifting in this period, with 47 clubs playing Premier League football
in the 25 years. Figure 2 shows which other leagues these clubs played in over the period.
Figure 2. Number of clubs playing in the top league (47), and which other leagues they played in
7 clubs played 10 clubs played in Tiers 22 clubs played in Tiers 1, 2 and 3 8 clubs played in
only in Tier 1 1 and 2 Tiers 1, 2, 3 and 4
Source: Author’s analysis of club performances across seasons.
This group of 47 Premier League contenders was drawn from the 92 league clubs in the top four
tiers in 1992. This means that 52% of all clubs playing in the four tiers in 1992 played at least one
Premier League season between 1992 and 2016. This is a high number. As the figure shows, only
7 of these clubs played in just the top tier Premier League in this period. A similar number (8 clubs)
played in all four tiers in the football league system in this period.
In all, over 80% of clubs that played in the top tier also played in lower tiers.
This evidence suggests that while many clubs that started in the Premier League or Championship
in 1992 ended up there in 2016, the set of clubs that moved in and out of the top tier during the
entire period was actually quite large. Of particular interest is the finding that 26% of clubs that
started in tiers three or four of English football in 1992/93 made it to the Premier League at some
point during the last generation. So, some clubs can rise to this top tier (which will be discussed in
more detail later). However, further data does shows that most of these clubs do not win in that
top tier. Rather, a small subset dominates the tier’s winnings.
Consider, for instance, that the top ten tier one clubs (by income) in 2016/17 accounted for 47%
of all performances in the Premier League in the last 25 years. 35 What this means is that 229 of
484 seasons played in the top league in that period were occupied by just ten clubs—that are also
the biggest economic winners—Manchester United, Arsenal, Chelsea, Liverpool, Tottenham
Hotspur, Everton, Aston Villa, Newcastle United, Manchester City, and West Ham United. Put
differently, these ten clubs participated in over 8,500 of the 18,000 matches played in the Premier
League between 1992 and 2016. These matches symbolize the opportunities to ‘win’ and earn
money in the top tier. Ten clubs benefited from nearly half of these opportunities—with the
remaining 37 clubs splitting the other half.
Further data shows that six of these clubs—Manchester United, Chelsea, Arsenal, Liverpool,
Manchester City, and Tottenham Hotspur—used these opportunities to dominate winnings, on
and off the field. These six clubs accounted for 53% of all revenue earned in the Premier League
between 2008 and 2016, for instance. They started with a 47% share of these winnings in 2008
and increased this share to 57% in 2016 (see Figure 3). These clubs also ‘won’ 80% of all the top 6
league places between 2004 and 2016, and 95% of all top 4 places in the league between 2004
35
229 of 484 seasons played in the top league in that period were occupied by ten clubs—also the biggest economic
winners—Manchester United, Arsenal, Chelsea, Liverpool, Tottenham Hotspur, Everton, Aston Villa, Newcastle
United, Manchester City, and West Ham United.
12and 2016. Three of these clubs (Chelsea, Manchester City, and Manchester United) won every
Premier League title in this period, but one—the 2015 championship that went to Leicester City.
Figure 3. Premier League Revenues, Top 6 Clubs and Other 14 Clubs (2008-2016)
2500000
2000000
1500000
1000000
2008/09 2009/10 2010/11 2011/12 2012/13 2013/14 2014/15 2015/16 2016/17
Top 6 teams Next 14 teams
Source: Authors’ analysis of various sources.
The evidence thus suggests that although 47 clubs played in the top tier of English football in the
last generation, most of these clubs were not really competing to win—on the field or off the field.
On the field, six clubs typically dominate the top positions. Off the field, those six clubs absorb over
half of the revenues in the Premier League, which itself accounts for 80% of the revenues in the
entire English football system. The six clubs in question have thus enjoyed over 40% of the total
‘winnings’ in the entire system for over the last decade (shown in Table 2).
Table 2. Shares of Premier League Revenues, Top 6 and Top 4 Places, 04/05 to 15/16 seasons
04/05 to 15/16 Average Revenue Ranking % Top 6 places % Top 4 places
Manchester United 1st 15% 23%
Chelsea 2nd 15% 23%
Arsenal 3rd 17% 25%
Liverpool 4th 10% 10%
Manchester City 5th 10% 10%
Tottenham 6th 13% 4%
Share of Premier League winnings 53% 36 80% 95%
Source: Authors’ analysis of various sources.
The finding is thus that the winnings in English football’s competition are concentrated at the top
of the pyramid, and a select—and small—set of clubs have cemented their position at this
pinnacle. They have thus monopolized the majority of economic winnings in the league system.
They are the ones who ‘win’. The other clubs just participate. Once again, this confirms what
observers have written about the league system—in the words of journalist Tim Wigmore, “the
economic gap between the elite and the rest has become a chasm.” 37 Even though a club like
36
This was calculated based on revenues between 2008 and 2016.
37
Wigmore, T. 2018. The Premier League is losing its competitive balance – that should be cause for concern. iNews.
February 2, 2018. https://inews.co.uk/sport/football/premier-league-competitive-balance/
13Leicester City might have risen to win a title in 2015, it is indeed the rarest of exception to the rule.
The rule is simply that most clubs are progessively ‘falling back’ behind a small group of winners.
How regularly do lower tier clubs rise (is the ‘hope of winning’ real for these clubs)?
So, what can be made of Leicester City’s 2015 Premier League title win? It is an example, surely,
of the potential to ‘catch up’ in the modern English football league, having risen from the third
tier of the league in 2008 to win the entire league in just seven years?
Beyond Leicester, we see that a number of clubs have made it into the top tier of English football
over the last generation—often rising from lower tiers. Table 3 illustrates this kind of movement
with a sample of end of season league positions (rank) and tiers for 20 of the 117 clubs included
in my overall database (of clubs that were in one of the top 4 tiers in both 1992/93 and 2016/17).
Table 3. A Sample of 24 English Football Clubs Showing Rank and League in 1992/93 and 2016/17
Rank Tier Rank Rank
92/93 Club 92/93 16/17 Club Tier 16/17 change Tier Change
1 Manchester United (C) 1 6 Manchester United 1 -5 0
2 Aston Villa 1 33 Aston Villa 2 -31 -1
3 Norwich City 1 28 Norwich City 2 -25 -1
4 Blackburn Rovers 1 42 Blackburn Rovers 2 -38 -1
5 Queens Park Rangers 1 38 Queens Park Rangers 2 -33 -1
6 Liverpool 1 4 Liverpool 1 2 0
7 Sheffield Wednesday 1 24 Sheffield Wednesday 2 -17 -1
8 Tottenham Hotspur 1 2 Tottenham Hotspur 1 6 0
9 Manchester City 1 3 Manchester City 1 6 0
10 Arsenal 1 5 Arsenal 1 5 0
28 Leicester City 2 12 Leicester City 1 -16 +1
47 Stoke City 3 13 Stoke City 1 34 +2
West Bromwich
50 West Bromwich Albion 3 10 Albion 1 40 +2
51 Swansea City 3 15 Swansea City 1 36 +2
52 Stockport County 3 128 Stockport County 5 -76 -2
53 Leyton Orient 3 92 Leyton Orient 4 -39 -1
61 Huddersfield Town 3 25 Huddersfield Town 2 36 1
62 Hartlepool United 3 91 Hartlepool United 4 -29 -1
63 Bournemouth 3 9 AFC Bournemouth 1 54 +2
64 Blackpool 3 75 Blackpool 4 -11 -1
65 Exeter City 3 73 Exeter City 4 -8 -1
66 Hull City 3 18 Hull City 1 48 +2
The table should be read as follows, using the first row as an example: Manchester United was
ranked 1st in 1992/93, having won tier 1 in that year; the same club was ranked 6th in 2016/17,
having finished 6th in tier 1 that year; the rank change between these periods was -5 (a drop from
1 to 6) but there was no tier change (given that the club played in the top tier in both years). Using
14another example, of Leicester City (shaded): the club was ranked 28th in 1992/93, in tier 2 of
English football (now called the Championship) and improved its ranking to 12th in 2016 (a rank
change of -16) in jumping to the tier 1 Premier League.
Reading the table through, one can see that some clubs in this sample saw significant rank and tier
shifts changes between the two years. Hull City (bolded, at the bottom of the table), for instance,
was ranked 66th in 1992/93 but rose to a rank of 18th in 2016/17, having leapfrogged two tiers
from the third tier (League One) to the first tier (Premier League). Other clubs that leapfrogged
two tiers (also shown in bold) include AFC Bournemouth, Swansea City, West Bromwich Albion,
and Stoke City. AFC Bournemouth recorded the highest ranking improvement over the period,
rising from 63rd in 1992 to 9th in 2016. In contrast, Stockport County dropped 76 places from 52nd
to 128th (plummeting from the third to fifth tier National League).
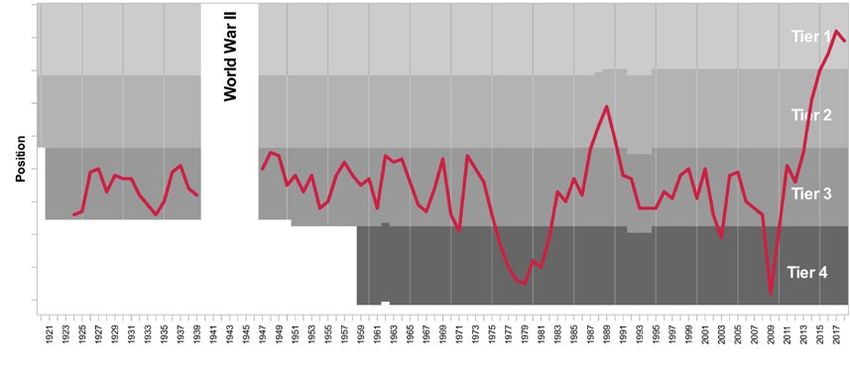
Figures 4 and 5 show the rankings (positions) of Hull City and AFC Bournemouth over time. Hull
had been in the second tier for much of the 1970s and 1980s. The club slid down two tiers in the
early 1990s but started rising again in 1998—taking ten years to reach the top tier (in 2008) and
bouncing around between the first and second tiers thereafter. AFC Bournemouth’s trajectory is
different. The club was in a regular third or fourth tier competitor until 2009—when it was
performing particularly poorly (and was also financially bankrupt). The club then started
performing significantly better, and within six years it was in the top tier (where it remains).
Fig 4. Hull City League Positions, 1906-2017 Fig 5. AFC Bournemouth League Positions, 1923-2018
Figure produced by EclecticArkie (Manually created in Notepad, CC BY- Figure produced by Srhansen1985 [CC BY-SA 4.0
SA 3.0, https://commons.wikimedia.org/w/index.php?curid=32625702) (https://creativecommons.org/licenses/by-sa/4.0)], from Wikimedia
Commons)
These two examples show that clubs can indeed rise from lower tiers to the higher tiers in English
football, leapfrogging three tiers to reach the Premier League in just 6 or 7 years. These are, surely,
examples to inspire hope that ‘catch up’ is possible—for football clubs and maybe even countries?
These ‘catch up’ did not just lead these clubs into better on-field competition. The jumps yielded
significant winnings for both clubs as well. In 2011 and 2012, for instance, AFC Bournemouth
earned four to five million pound in revenue in League 1 (the third tier) (according to Deloitte
estimates). This grew to between ten and twelve million pounds in 2013 and 2014, when
Bournemouth played in the second tier Championship. After gaining promotion to the top tier
Premier League, the club saw revenues soar to 88 million and then to 136 million. Leapfrogging
two tiers in five years thus yielded huge financial gains, with revenue being thirty three times
bigger in 2017 than in 2011.
15This kind of ‘catch up’ through league tiers is unusual, however. Only 8% of clubs playing in the
four top ties in 1992 and 2016 improved more than one tier in that period. As Figure 6 illustrates,
the vast majority of clubs (82%) were either in the same tier in 2016 as in 1992 or one tier above
or below. Given this, it seems apparent that clubs can catch up in the tiered hierarchy of English
football; but the hope of catch up should not be over-stated. Given the past generation’s
experience, 37% of all English football clubs will probably be in the same tier in twenty-five years
as they are in now. Over 80% of clubs will be within one tier of their starting position. Only 8% of
all clubs can hope to rise significantly over the period. And one club may replicate the fairy tale of
Leicester City Football Club’s 2015 Premier League title win.
In sum, therefore, we actually see little ‘catch up’ in the English football league system. Rather,
the more things change the more they stay the same; the English football competitive order is
quite stable and the real possibility of lower tier clubs rising to higher tiers is limited.
Figure 6. English league club shifts between tiers, from 1992 to 2016
40%
30%
20% 37%
10% 23% 22%
1% 7% 9% 2%
0%
Improved three Improved two tiers Improved one tier Stayed in same tier Declined one tier Declined two tiers Declined three
tiers tiers
Source: Authors’ analysis of historical performances of English clubs in the four top tiers in 1992 and in 2016.
Patterns of competitiveness in the world economy
The analysis thus far supports the argument of some observers that traditionally richer clubs have
gained relatively more from the newly globalized English football league than traditionally poorer
clubs. This, it is suggested, has cemented a highly exclusive competitive order in English football,
increasingly excluding many smaller clubs from competing for most of the sector’s winnings. Now,
I turn to the comparative study and ask, “Is the world economic order as static as the order we
see in English football?” To answer this question, the current section looks into patterns of
economic competitiveness and ‘winnings’ distribution in and across the world economic ‘league’.
How much do the economic winnings differ across and within league tiers?
Real per capita Gross Domestic Product (GDP per capita) is the first indicator used to show
‘winnings’ in the world economy. This measure captures the value of production in any country,
per person. It is representative of the economic gains of citizens in each country or maybe similar
to the wage rate data in English football (how much one could expect to earn if competing in a
specific country). As such, countries with higher levels of GDP per capita are considered more
competitive than others. These are, simply, the countries where individuals make the most money
(which should make the countries more attractive a location for talented people).
16Table 4 shows how GDP per capita ‘winnings’ were distributed in 2016, across 182 countries
organized into five tiers (with the top tier 1 being the quintile of wealthiest countries and the
lowest quintile tier 5 being the poorest countries).
Table 4. Differences in GDP per capita, by country tier, 2016
Tier 1, Tier 2, Tier 3, Tier 4, Tier 5,
2016 2016 2016 2016 2016
Average GDP per capita ($, constant 2011 values, ppp
$50,187 $21,458 $12,060 $4,677 $3,438
controlled)
Distance from top league 0 $28,729 $38,126 $45,509 $46,748
Source: Data on real 2011 per capita incomes (PPP) from World Development Indicators (WDIs)
As the table shows, average GDP per capita in tier 1 countries was $50,187 in 2016. This was over
twice the average GDP per capita in tier 2 countries (with an average of $21,458), and over four
times the average in tier 3 countries (where the average was $12,060), and more than ten times
that of average incomes in tier 4 countries (where averages were $4,677). Tier 1 countries had per
capita incomes about 15 times those in tier 5 countries, with residents in the wealthier countries
enjoying over $46,748 more income than citizens in tier 5 countries.
Given this measure, the distribution of income is not quite as severe as one finds in the English
football league in 2016. It is still very unequal, however, which suggests that countries in different
tiers are differently competitive. Tier 1 countries will be able to attract the best and brightest
talent in the world more easily than other countries (because they can promise them higher
incomes), which one expects will help these countries attract high-value-producing firms (looking
for talent), which one expects will maintain a winning edge in these countries.
Gross Domestic Product (GDP) was used as the second indicator of economic winnings in the world
economy. This measure captures the value of overall production in any country; representing how
much a country is able to attract, support, maintain, and expand business. Countries with higher
levels of GDP are considered more competitive than others. Given such rationale, the world
economy had aggregate economic production winnings of $77 trillion in 2016 (using data from
178 countries, with GDP for each measured at constant 2010 prices).
Figure 7. Global GDP Share Across the World Economic League System
1st Quintile: 88% of total league 2nd Quintile: 7% of total 3rd Quintile: 1.5% of total 4th Quintile: 0.52% of total
system winnings (20% of clubs in league system winnings (20% league system winnings league system winnings
system) of clubs in system) (20% of clubs in system) (20% of clubs in system)
Top country Average country Average country share: Average club share: 0.04% Average club share: 0.014%
share: 22% share: 2.5% 0.19%
Source: Data on real 2011 per capita incomes (PPP) from World Development Indicators (WDIs)
The United States of America (USA) was the overall winner of this league, as the top producing
country (akin to the Manchester United of the English football league) with a GDP of $17 trillion.
China (akin to Manchester City, perhaps) was second, with a GDP of about $9 trillion. As shown in
Figure 7, the top tier of countries in 2016 (in the top quintile of 178 countries) enjoyed 88% of the
system’s winnings. The remaining 80% of countries shared 12% of the spoils.
17You can also read