Regional Economic Prospects in the EBRD Regions May 2018
←
→
Page content transcription
If your browser does not render page correctly, please read the page content below
Regional Economic Prospects
                       in the EBRD Regions
                                     May 2018

                              Has growth peaked?
        2018 growth forecasts revised upwards as broad-based recovery continues

Following several years of weaker economic performance, growth in the EBRD regions
averaged 3.8 per cent year-on-year in 2017. The acceleration, now sustained for two years,
has been broad-based, with contributions from stronger investment activity and higher
exports.

Average growth in the region may now have peaked and is expected to moderate to 3.3 per
cent in 2018 and 3.2 per cent in 2019. Despite the projected deceleration, the expected
average growth in 2018-19 is higher than in 2014-16. The projections are in line with
moderate estimates of the potential medium-term growth in the EBRD regions, which, in
turn, reflect the lower levels of productivity growth compared with those seen before the
2008-09 crisis as well as adverse demographic trends.

Growth in central and south-eastern Europe and Turkey is projected to moderate in 2018
from high levels seen in 2017 as the fiscal stimulus wears off in Turkey and shortages of
skilled labour constrain medium-term growth potential in central Europe.

Growth in Russia is projected to remain around 1.5 per cent. Growth in Central Asia is
expected to moderate to around 4.5 per cent in 2018-19 in light of lower commodity price
growth and the need for fiscal consolidation. Growth in Eastern Europe and the Caucasus is
projected to increase to 3 per cent in 2018 as the recovery in Ukraine gains momentum.

Growth in the southern and eastern Mediterranean (SEMED) region is projected to increase
to around 4.4 per cent in 2018 and 4.8 per cent in 2019 on stronger external demand, a
gradual recovery in tourism amid an improved security situation, rising investment and
improved competitiveness. The projected growth corresponds to an annual increase in output
per capita of around 2.5 per cent, reflecting relatively fast population growth in the SEMED
region compared with that in emerging Europe.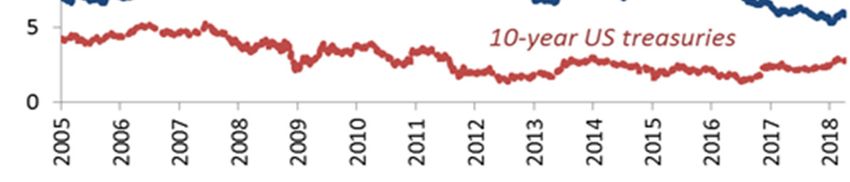
OVERVIEW
The outlook is subject to numerous risks. As companies took advantage of favourable
financing conditions, corporate debt as a percentage of GDP in the EBRD regions increased
from around 40 per cent in 2007 to more than 60 per cent in 2018, much of it external and/or
denominated in foreign currency. This presents a source of vulnerability should global
financing conditions tighten rapidly, highlighting the need to further develop local currency
and equity markets.
Strongest growth in EBRD regions since mid-2011 Population growth rates differ greatly across EBRD regions
Chart 1. Real GDP growth rate in EBRD regions Chart 2. GDP growth and population growth by region, %
Source: CEIC, national authorities, IMF and authors’ calculations.
Source: CEIC, national authorities, IMF and authors’ calculations.
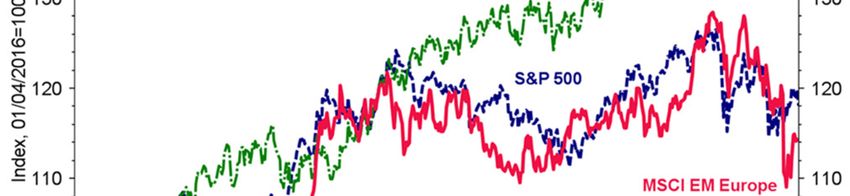
Growth may have peaked, is expected to moderate Emerging market equities up 14% in 2 years
Chart 3. Real GDP growth, %, weighted at PPP Chart 4. Stock market indices, April 2016 = 100
Source: IMF and the EBRD. Source: Thomson Reuters.
2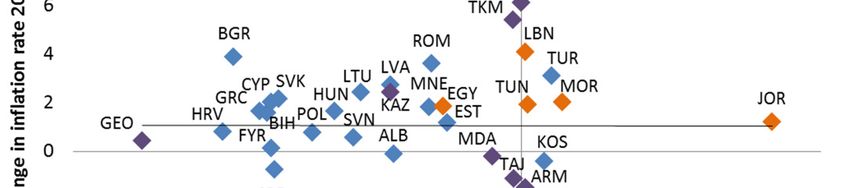
OVERVIEW

                                            Table 1. Real GDP growth
                                                              Actual                      Forecast            Change in
                                                                                     (as of 9 May 2018)        forecast
                                                       2016            2017          2018          2019          2018

EBRD region1                                            1.9            3.8            3.3          3.2            0.3
      Central Europe and the Baltic states              2.9            4.3            3.8          3.3            0.5
       Croatia                                          3.2            2.8            2.7          2.5            0.1
       Estonia                                          2.1            4.9            3.8          3.0            0.4
       Hungary                                          2.2            4.0            3.8          3.0            0.4
       Latvia                                           2.2            4.5            3.5          3.5           -0.6
       Lithuania                                        2.3            3.8            3.2          2.8           -0.3
       Poland                                           3.0            4.6            4.0          3.3            0.6
       Slovak Republic                                  3.3            3.4            3.9          4.2            0.4
       Slovenia                                         3.1            5.0            4.0          3.3            1.1
      South-eastern Europe                             3.0             4.1            3.6          3.5            0.3
       Albania                                         3.4             3.8            3.8          3.9            0.1
       Bosnia and Herzegovina                          3.1             3.0            3.3          3.5            0.3
       Bulgaria                                        3.9             3.6            3.6          3.4            0.4
       Cyprus                                          3.4             3.9            3.2          3.0            0.7
       FYR Macedonia                                   2.9             0.0            2.5          3.0            0.0
       Greece                                          -0.2            1.4            2.2          2.3            0.0
       Kosovo                                          4.1             3.7            3.7          4.0            0.2
       Montenegro                                      2.9             4.4            3.3          2.7            0.0
       Romania                                         4.8             6.9            4.6          4.2            0.4
       Serbia                                          2.8             1.9            2.9          3.5            0.0
      Eastern Europe and the Caucasus                  0.1             2.3            3.0          3.3            0.3
        Armenia                                        0.2             7.5            3.5          4.5            0.0
        Azerbaijan                                     -3.1            0.1            2.5          3.5            0.5
        Belarus                                        -2.5            2.4            3.0          3.0            1.0
        Georgia                                        2.8             5.0            4.5          4.5            0.0
        Moldova                                        4.3             4.5            3.5          4.0            0.0
        Ukraine                                        2.4             2.5            3.0          3.0            0.0
      Turkey                                            3.2            7.4            4.4          4.2            0.9
      Russia                                           -0.2            1.5            1.5          1.5           -0.2
      Central Asia                                      3.6            4.8            4.4          4.5            0.0
       Kazakhstan                                       1.1            4.0            3.9          3.8            0.4
       Kyrgyz Republic                                  3.8            4.5            3.7          4.0           -0.5
       Mongolia                                         1.0            5.1            5.2          5.9            2.2
       Tajikistan                                       6.9            7.1            5.0          5.5            0.0
       Turkmenistan                                     6.2            6.5            5.0          5.0           -0.1
       Uzbekistan                                       7.8            5.3            5.1          5.3           -1.1
      Southern and eastern Mediterranean 2              3.3            3.7            4.4          4.8            0.4
       Egypt                                            4.3            4.2            5.3          5.5            0.8
       Jordan                                           2.0            2.0            2.5          2.7            0.0
       Lebanon                                          1.0            1.2            2.0          2.5           -0.5
       Morocco                                          1.2            4.0            3.0          4.0           -0.5
       Tunisia                                          1.0            1.9            2.7          3.0            0.0

"East": EEC, CA, Russia                                 0.4            2.2            2.2          2.2           -0.1
"West": CEB, SEE, SEMED, Turkey                         3.1            5.1            4.1          4.0            0.6
1   Weighted averages, based on the countries' nominal GDP values in PPP US dollars.
2   EBRD figures and forecasts for Egypt's real GDP reflect the country's fiscal year, w hich runs from July to June.

                                                              3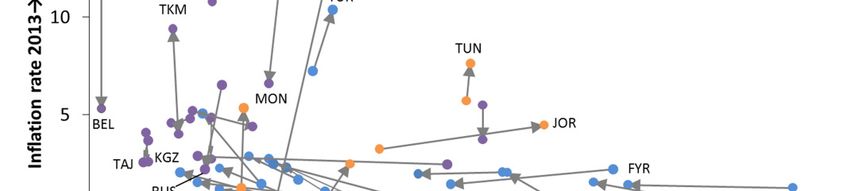
OVERVIEW

       P/E ratios have remained high in many markets                  Financing conditions have remained very favourable
               Chart 5. Price-to-earnings ratios                                      Chart 6. Bond yields

Source: Thomson Reuters, Bloomberg.

                                                                 Source: Bloomberg.

Rising oil prices supported growth in Russia, Central Asia            Corporate debt rose markedly, much of it in forex
   Chart 7. Change in annual average oil price (Brent), %            Chart 8. Non-financial sector corporate debt, % of GDP

Source: Thomson Reuters and authors’ calculations.               Source: CEIC, national authorities, IMF, World Bank, BIS, OECD.
Capital flows to the EBRD regions have remained resilient          Weaker US$ sustained favourable financing conditions
  Chart 9. Net mutual fund flows, % of assets under mng.         Chart 10. Exchange rate movements against the US dollar, %

Source: EPFR Global and authors’ calculations.                   Source: CEIC, national authorities, Thomson Reuters. PPP-weighted.

                                                             4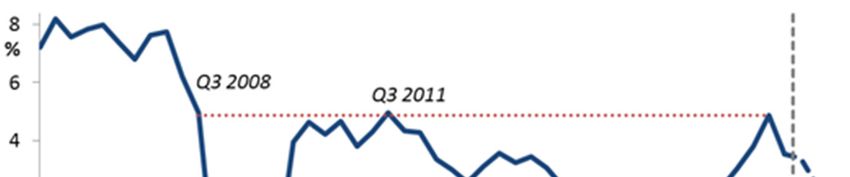
OVERVIEW

   Reserve coverage of external financing needs varies              Policies, recovery help to reduce non-performing loans
 Chart 11. External financing needs and reserves, % of GDP              Chart 12. Non-performing loans, % of total loans

Source: World Bank and authors’ calculations.                    Source: CEIC, national authorities, World Bank and Moody’s.
      Remittances recovered in local-currency terms                 Faster wage growth supported growth performance
Chart 13.Remittances from Russia to CA+EEC, Q2013 = 100          Chart 14. Wage growth and inflation, y-o-y, Feb’18 or latest

Source: Central Bank of Russia and authors’ calculations.        Source: CEIC, national authorities, ILO and authors’ calculations.

  As unemployment rates have been falling since 2013               So far, falling unemployment has not pushed up inflation
Chart 15. Changes in unemployment rates and inflation, pp                Chart 16. Inflation and unemployment rates, %

Source: Thomson Reuters and authors’ calculations.               Source: Thomson Reuters and authors’ calculations.

                                                             5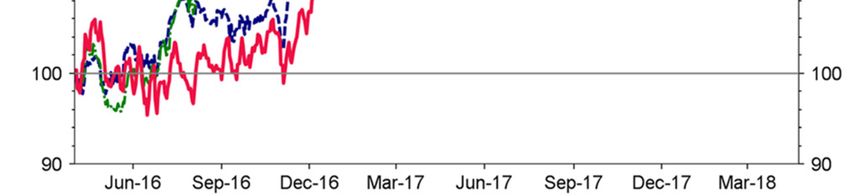
OVERVIEW

Strong growth momentum

Growth in the EBRD regions accelerated from 1.9 per cent in 2016 to 3.8 per cent in 2017
(Table 1). Growth in the third quarter of the year, estimated at 5 per cent year-on-year
(weighted using the values of countries’ gross domestic product [GDP] at purchasing power
parity [PPP]), was the strongest since the third quarter of 2011 and the second strongest
since the third quarter of 2008, albeit short of the levels seen in the middle of the previous
decade (6 to 8 per cent, Chart 1).

The growth momentum has been broadly shared across the region’s economies. In more
than a third of the region’s economies, growth in 2017 was the strongest since 2011.
Important contributions to stronger growth came from a rebound in investment activity and
robust export performance. Gross inflows of foreign direct investment amounted to around
2.3 per cent of GDP in a typical (median) economy, in line with the average value for the
preceding five years.

Growth showed signs of slight moderation in late 2017 and early 2018 but the overall
momentum remained strong. The average estimate in the fourth quarter stood at 3.7 per
cent compared with close to 5 per cent in the previous quarter. The latest economic
indicators such as industrial production and international trade point towards a further
moderation of growth in the first months of 2018, to a range of 3 to 3.5 per cent (Chart 1).
These estimates are derived using a principal-component-based nowcasting model. 1

Mirroring global trends

Strong recovery in the EBRD regions mirrored trends in the global economy, which also
grew at an average rate of 3.8 per cent in 2017 (in PPP-weighted terms). Having picked up by
0.6 percentage points last year, global growth is expected to edge up further in 2018-19 to
3.9 per cent, according to the latest projections of the International Monetary Fund (IMF). In
the EU-15, growth accelerated from 1.8 per cent in 2016 to 2.3 per cent in 2017. It is
projected to remain at this level in 2018 and moderate to 1.9 per cent in 2019 (Chart 3).

Global trade expanded at a significantly higher pace than global GDP (4.7 per cent) for the
first time since 2011 (Chart 3), aided in part by higher investment (investment goods tend to
be traded more across borders) and weakening of the US dollar (the prevailing unit of pricing
for cross-border sales).2 In the EBRD regions, exports strengthened across the board in 2017,
contributing to the recovery. At the same time, global trade tensions continued escalating,
with the United States and China imposing high tariffs on selected imports.

1
    See the November 2017 edition of the Regional Economic Prospects for a discussion of the model.
2
  See Boz, Emine, Gita Gopinath and Mikkel Plagborg-Møller (2017), “Global Trade and the Dollar”,
IMF Working Paper 17/239.

                                                   6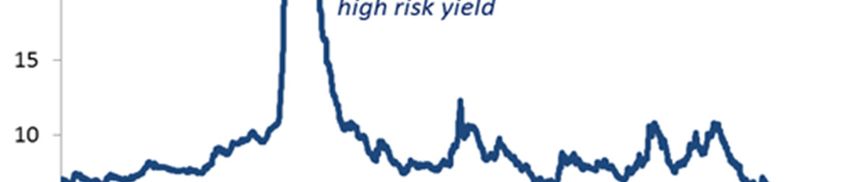
OVERVIEW

Favourable financing conditions sustained

The global search for yield sustained exceptionally favourable financing conditions in
emerging markets even as the US Federal Reserve raised its policy rate in December 2017
and March 2018 by a cumulative 0.5 percentage points to the range of 1.5 to 1.75 per cent.
The yield on 10-year US Treasuries also edged up, albeit with a delay. In contrast, the
European Central Bank (ECB) has left its quantitative easing programme in place (albeit with
a reduced amount of monthly asset purchases) as inflation in the eurozone remained below
the 2 per cent inflation target.

Global stock markets experienced a correction in February 2018, followed by a period of
somewhat higher volatility. The February correction reflected higher inflation expectations
as well as unwinding of speculative bets made on sustained low volatility itself. The
correction has been relatively limited to date. Increased stock market volatility
notwithstanding, equities in emerging Europe traded 14 per cent higher in mid-April 2018
than two years earlier (Chart 4). Russian stocks experienced a greater downward correction
upon announcement of the new round of US sanctions in April 2018, which included Rusal, a
major aluminium producer (Chart 5; see also the Regional Update section, which discusses in
more detail country-specific factors shaping the economic outlook in individual countries).

Yields on emerging market bonds were little affected by the increase in stock market
volatility, both in the EBRD regions (Chart 6) and globally.

Second year of rising oil prices

The oil price surpassed the US$ 70 per barrel of Brent mark briefly in January 2018 and
then again in April 2018 owing to stronger demand, production cuts by the members of the
Organization of Petroleum Exporting Countries (OPEC) and Russia as well as concerns about
supply disruptions. As a result, the average oil price in 2018 is up 25 per cent year-on-year,
following a 24 per cent increase in 2017 (Chart 7). In revenue terms, higher prices have so far
more than offset the impact of lower production for Russia and other exporters that
committed to production caps.

Oil price increases thus provided a sustained boost to year-on-year growth in Russia and
Central Asia in the first months of 2018. The adverse impact on commodity importers has
been limited in comparison as global consumption of oil tends to be spread fairly evenly
across countries while global production is concentrated in a relatively small number of
major oil exporters.

Analysts expect the oil price to remain around the current level in the short term as
upward price pressure is expected to prompt a significant increase in shale oil production. In
the longer term, continued technological improvements in shale oil production may further
bring down the break-even price.

                                              7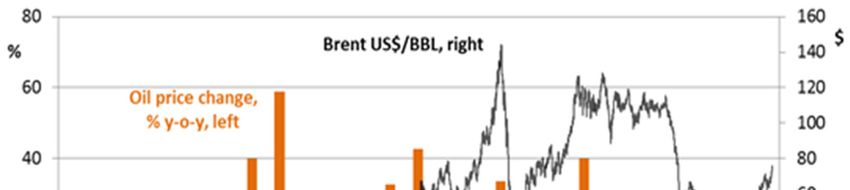
OVERVIEW

Stronger growth momentum across the EBRD regions

Growth in central Europe and the Baltic States (CEB) picked up markedly, from an average
of 2.9 per cent in 2016 to 4.3 per cent in 2017 (Chart 2), boosted by stronger investment and
higher wage growth. Growth strengthened in every economy in the region with the
exception of Croatia. In Poland, an increase in social welfare payments also contributed to
the growth momentum.

Growth followed a similar trajectory in south-eastern Europe accelerating from 3 per cent in
2016 to 4.1 per cent in 2017. In Romania, the growth rate approached 7 per cent, well above
the estimated potential long-term growth, on the back of expansionary fiscal policy and
rising wages. A number of major investment projects contributed to the growth momentum
in the Western Balkans while GDP increased modestly in Greece after two years of
marginally negative growth. In FYR Macedonia, however, growth came to a standstill as the
earlier political crisis took a toll on investor confidence.

Growth in Eastern Europe and the Caucasus rose to 2.3 per cent in 2017 from near-zero in
2016, as economic activity expanded vigorously in Armenia and Georgia while Belarus and
Azerbaijan returned to growth.

Various stimulus measures, including the establishment of the Credit Guarantee Fund for
small and medium-sized enterprises and various tax incentives, boosted Turkey’s growth to
7.4 per cent in 2017, up from 3.2 per cent in 2016.

Russia’s economy returned to growth in 2017, expanding by 1.5 per cent, following a
cumulative contraction of around 3 per cent in 2015-16. At the same time, the new round of
US economic sanctions added to economic uncertainty faced by investors.

Growth in Central Asia picked up from 3.6 per cent in 2016 to 4.8 per cent in 2017,
supported by higher average prices of oil and other commodities. Uzbekistan continued
implementing an ambitious programme of liberalisation reforms.

Growth in the southern and eastern Mediterranean picked up from 3.3 per cent in 2016 to
3.7 per cent in 2017 as agricultural output rebounded in Morocco and Tunisia and improved
competitiveness and greater investor confidence supported growth in Egypt. On the other
hand, economic activity in Jordan and Lebanon continued to be negatively impacted by the
geopolitical uncertainty in the region and the resulting refugee crisis.

Domestic credit growth in line with GDP growth

Domestic credit growth in the EBRD regions (adjusted for inflation and exchange rate
movements) has been in line with real GDP growth over the last three years, keeping the
credit-to-GDP ratio broadly constant, reflecting the already high levels of corporate and
household debt relative to incomes in a number of countries.

                                             8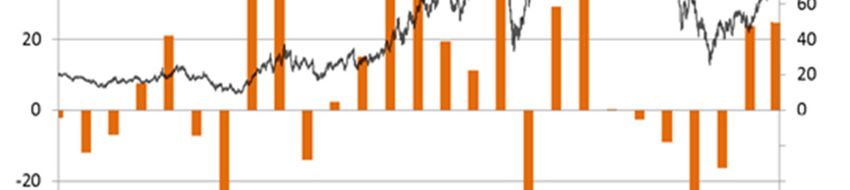
OVERVIEW

Corporate debt-to-GDP ratios up 1.5 times since the crisis owing to external
borrowing

At the same time, the overall levels of the non-financial-sector corporate debt in the EBRD
regions increased markedly over the last decade, from an average of 42 per cent of GDP in
2007 to 61 per cent of GDP in 2017, as countries took advantage of favourable financing
conditions (Chart 6). In many countries, levels of corporate debt are comparable to those in
Germany and the United States although they remain below the levels seen in many other
advanced economic and emerging markets. In this regard, the composition of debt is a
greater source of risk than the current levels.

In particular, much of the recent increase in corporate debt in the EBRD regions is
accounted for by external borrowing or domestic borrowing denominated in foreign
currency (Chart 8). This presents a potential source of vulnerability should global financing
conditions tighten rapidly and should net inflows of capital into emerging markets weaken
substantially.

Capital flows remain resilient

So far, capital inflows into emerging markets have remained resilient amidst the search for
yield. Bond and equity inflows in the EBRD regions remained strong, in line with global
trends (Chart 9).

Weak US dollar sustains favourable financing conditions for emerging markets

The relative weakness of the US dollar also contributed to easing financial conditions for
emerging markets as a weaker US dollar makes it easier to service debt obligations
denominated in US dollars and raises dollar-referenced returns for emerging market
investors. The region’s currencies have remained broadly stable, on average appreciating
somewhat against the US dollar and depreciating slightly against the euro (Chart 10).

Resilience to capital flow reversals varies from country to country

Most countries in the region have significant buffers in case of a major reversal in capital
flows of emerging markets (an episode that could have similarities with the “taper tantrum”
of 2013). In the vast majority of the region’s markets, international reserves more than fully
cover the short-term gross external refinancing needs (calculated as the current account
deficit plus short-term external debt, that is, external debt due to be repaid within the next
12 months).

The coverage ratio remains weaker, however, in several economies, including Belarus,
Georgia, Mongolia, Tajikistan, Tunisia, Turkey and Ukraine (Chart 11). Globally, reserve
coverage ratios are also on the low side in a number of economies in sub-Saharan Africa and
in selected small island economies. In contrast, most emerging markets have built up
substantial international reserves.

                                              9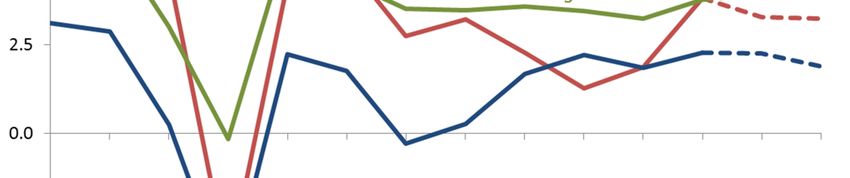
OVERVIEW

Policy actions and economic recovery led to lower non-performing loan ratios

Further progress has been made in terms of reducing the levels of non-performing loans
(NPL) in the region, as policy actions leading to NPL reductions and the economic upswing
reinforced each other in a virtuous loop. A typical (median) country saw the ratios of NPLs to
total loans decline by 5.3 percentage points from the post-2008-09 crisis peaks (Chart 12). At
the same time, NPL ratios remain in double digits in more than a third of the countries.

On the other hand, a banking scandal in Latvia in February 2018 highlighted remaining
challenges in terms of banking regulation and supervision in the region. Following
accusations of money-laundering and corruption, ABLV, Latvia’s third largest commercial
bank, submitted a voluntary liquidation plan and is expected to be wound up with the
assistance of independent international auditors. The governor of Latvia’s Central Bank was
briefly detained in connection with an anti-corruption probe but subsequently released.

Remittances are growing again, reaching new records in local currency terms

Remittances from Russia to Central Asia, Moldova and the Caucasus picked up by 28 per
cent in US dollar terms in 2017. This trend has continued in 2018. While in US dollar terms
the level of remittances was still around 40 per cent below the 2013 peak, in real local
currency terms (adjusted for local inflation), remittances have now surpassed their previous
peak levels (Chart 13).

Wage growth picks up on tighter labour markets

Faster wage growth played an important role in explaining stronger-than-expected
performance in 2017, from Romania to Turkey and from Hungary to Belarus. Faster wage
growth (Chart 14) reflected in part much tighter labour markets: the median (typical)
unemployment rate in the region declined by 3.1 percentage points since its peak in 2013 to
the still elevated level of 8.7 per cent (Chart 15).

Falling unemployment has had limited impact on inflation so far

Falling rates of unemployment in the region have not yet resulted in strong inflationary
pressures (Charts 15 and 16), mirroring trends in advanced economies. Several factors may
explain low inflationary pressures despite tighter labour market conditions. The substantial
economic slack following a prolonged period of modest economic growth since the 2008-09
financial crisis plays a role (a detailed discussion of the region’s growth performance can be
found in the EBRD Transition Report 2017-18).

                                             10
OVERVIEW
Technological change also contributed to a weakening of the Phillips curve relationship
between lower unemployment and higher inflation.3 On the one hand, technology makes it
easier for workers to be matched with job openings, reducing the structural rate of
unemployment in the economy. On the other hand, the risk of automation of a significant
number of occupations may limit workers’ ability or willingness to seek pay rises, even when
labour markets are tighter.
In several countries, however, inflation has been high and rising. In Turkey, for instance,
persistent double-digit inflation reflects expansionary fiscal and monetary policies deployed
to boost growth above its long-term potential level and resulting in overheating of the
economy. In Egypt, inflation spiked following the November 2016 depreciation of the pound
and subsequently moderated from the average rate of 29 per cent in 2017 to the still
elevated rate of 13 per cent in March 2018. Inflation in Ukraine also stood at 13 per cent in
March 2018 and the National Bank of Ukraine repeatedly increased its policy rate in recent
months to 17 per cent. In Uzbekistan, inflation is expected to be in double digits, reflecting
earlier exchange rate liberalisation.
Outlook: growth is projected to remain robust but it may now have peaked
Average growth in the region may have now peaked and is expected to moderate to 3.3
per cent in 2018 and to 3.2 per cent in 2019 (Table 1 and Chart 2). This trajectory differs
from the expected path of world GDP growth, which is expected to pick up from the same
level in 2017 (3.8 per cent) to 3.9 per cent in 2018 and 2019, according to the projections
published in the April 2018 World Economic Outlook of the International Monetary Fund.
The new 2018 projections for the EBRD regions are nonetheless higher than in November
2017 (an upward revision of 0.3 percentage points) on account of stronger expected
performance in central Europe, the Baltic states and Turkey, as well as south-eastern Europe
and Eastern Europe and the Caucasus which, in turn, reflect expectations of a stronger
external environment. And despite the projected deceleration, the expected average growth
in 2018-19 is higher than in 2014-16. The economic indicators available for the first months
of 2018 such as trade, industrial production and, for some economies, growth, are
consistent with the projected growth moderation (Chart 1).
Constraints on medium-term growth
The projected average growth in 2018-19 implies broadly unchanged views about the long-
term growth rate in the region even though the region’s economies managed to converge
to this rate faster than previously expected, helped by the cyclical recovery in the advanced
economies. In turn, the moderate estimates of potential growth reflect the lower levels of
productivity growth in advanced economies and in emerging markets compared with the
3
See http://bruegel.org/2017/11/has-the-phillips-curve-disappeared/ for a recent blog discussion by
Silvia Merler. The original paper by Phillips was published in 1958: Phillips, A. (1958), “The Relation
between Unemployment and the Rate of Change of Money Wage Rates in the United Kingdom 1861–
1957”, Economica, Vol. 25, pp. 283-299.
11OVERVIEW
levels seen before the 2008-09 crisis, as well as adverse demographic trends as discussed in
the EBRD’s forthcoming Transition Report 2018-19.
Outlook by region
Growth in central Europe and the Baltic States is projected to moderate gradually, from 4.3
per cent in 2017 to 3.8 per cent in 2018 and 3.3 per cent in 2019, as shortages of skilled
labour continue to constrain medium-term growth potential in the region.
In south-eastern Europe, growth momentum is also expected to subside but remain strong
overall, with the average growth declining from 4.1 per cent in 2017 to 3.6 per cent in 2018
and 3.5 per cent in 2019. Growth in Romania is expected to gradually moderate from close
to 7 per cent in 2017 to 4.2 per cent in 2019 as wage growth subsides. Recovery in Greece,
on the other hand, is expected to gradually take hold, with growth slightly exceeding the 2
per cent mark in 2018 and 2019. Growth is also expected to pick up this year in the Western
Balkans on the back of significant improvements in FYR Macedonia and Serbia and continued
robust growth in the remaining countries.
The economies of Eastern Europe and the Caucasus are projected to continue gaining
growth momentum in 2018 and 2019, with average growth accelerating from 2.3 per cent in
2017 to 3 per cent in 2018 and further to 3.3 per cent in 2019. This trajectory mainly reflects
the continued recovery in Ukraine following a major contraction in 2015-16. Growth in
Azerbaijan is also expected to pick up gradually as oil production stabilises.
Growth in Turkey is projected to moderate from 7.4 per cent in 2017 to 4.4 per cent in 2018
as the effect of fiscal stimulus wears off and limits to credit growth lead to a cooling down of
domestic demand. Higher exports and lower imports are likely to partly offset these effects,
as a result of the ongoing weakness of the lira and increasing demand in key export markets.
Growth is expected to moderate further in 2019.
Russia’s growth is projected to remain around 1.5 per cent in 2018 and 2019, in line with the
outcome in 2017, as investment activity remains sluggish and oil prices stabilise or decline
somewhat.
Growth is also expected to moderate in Central Asia, from 4.8 per cent in 2017 to close to
4.5 per cent in 2018-19, reflecting in part lower commodity price growth and the need for
fiscal consolidation.
Growth in the southern and eastern Mediterranean is projected to increase from 3.7 per
cent in 2017 to around 4.4 per cent in 2018 and further to 4.8 per cent in 2019 on stronger
external demand, gradual recovery of the tourism sector amid an improved security
situation, rising investment and improved competitiveness. Recovery in Jordan is expected
to gain momentum on the back of an improved outlook for the tourism sector and higher
revenues from the sale of phosphates and other mining products. The projected growth
corresponds to an annual increase in output per capita of around 2.5 per cent, reflecting
relatively fast population growth in the SEMED region compared with that in emerging
Europe (Chart 2).
12OVERVIEW
Significant risks to the outlook: indebtedness
The outlook is subject to numerous risks. A substantial rise in corporate indebtedness,
much of it in the form of either external debt or domestic debt denominated in local
currency, is a source of concern. The resilience of corporates to a significant tightening of
global financing conditions is yet to be tested.
Record-high stock market valuations
Stock markets valuations in the United States (as reflected in price-to-earnings ratios) have
climbed up to the levels seen only in 1929 (in the run-up to the Great Depression) and in
2000 at the height of the dotcom bubble. Stock markets in the EBRD regions and other
emerging markets have broadly traced the trajectory of S&P 500 on the back of sustained
capital inflows (Chart 4). The high valuations (Chart 5) reflect optimism about the current
growth momentum but also point to the risk of a sizable downward correction should the
mood change. Yet, with constrained fiscal space and very accommodative monetary policy,
governments may have limited ammunition to respond to a major dip in market confidence.
Rising populism and escalating trade tensions
The attraction of populist parties may continue to rise in an environment of moderate
growth and high and rising inequality, as discussed in the EBRD Transition Report 2016-17.
This means a challenging backdrop for deeper structural reforms. Further escalation of trade
tensions may have significant repercussions for major exporters of manufacturing goods in
central Europe and elsewhere. Other major risks to the outlook include persistent security
threats and geopolitical tensions as well as a high degree of concentration of sources of
global growth, with China accounting for up to half of the total.
13CENTRAL EUROPE AND THE BALTIC STATES
Regional updates
Central Europe and the Baltic States (CEB)
GDP growth in the CEB region accelerated to 4.3 per cent in 2017, the fastest such rate since
2007. Private consumption strengthened further but a key growth driver was the recovery in
investment, which grew by 6.3 per cent. An upswing in the utilisation of EU funds, which is
one of the powerful drivers of public investment, has been recorded in almost all CEB
economies, with the exception of the Slovak Republic. Tightening labour markets are
supporting strong wage growth but the drying labour supply pool is a key factor limiting
industrial production. Relative to advanced Europe, labour force participation rates remain
low for women, the disabled and the elderly. A greater mobilisation of those groups could
thus somewhat offset the negative consequences of the already shrinking employment pool.
Tying the retirement age to the expected average life expectancy (as implemented in Estonia
or the Slovak Republic) would also support potential growth. A short term risk to GDP
growth stems from uncertainty related to external demand in advanced Europe, including
the possibility of a potential trade war that would indirectly affect some industries in CEB,
such as the automotive sector in Hungary and the Slovak Republic.
Croatia
The Croatian economy grew by 2.8 per cent in 2017, a slight slowdown from 3.2 per cent the
previous year. The deceleration was primarily due to a pick-up in imports. Growth was
supported by another good tourist season, strong household consumption and investment.
Fiscal consolidation continued with the general government balance turning to a surplus of
0.8 per cent of GDP. Although public debt started to decrease in 2016, it is still high at 78 per
cent of GDP. Growth is expected to decelerate further in 2018 and 2019 as supportive
cyclical factors (primarily a boost from tax cuts) are running out. However, the slowdown is
expected to be rather marginal (to 2.7 and 2.5 per cent, respectively) as early indicators
point to possibly another record tourist season in 2018 and the country is expected to put
EU funds to better use. Higher productivity and long-term economic growth will require
tackling corporate over-indebtedness and improving corporate governance. Also, the
potential spill-over of Agrokor’s financial problems to its subsidiaries and suppliers still poses
a downside risk in the short term.
Estonia
GDP growth in Estonia accelerated to 4.9 per cent in 2017, fuelled by recovering investment.
After contracting by a cumulative 11 per cent since 2013, gross fixed capital formation
increased by 13.1 per cent last year, driven by substantial corporate purchases of transport
and ICT equipment. A buoyant labour market has positively stimulated private consumption,
which is expected to remain strong during the forecast horizon. In particular, a strong
positive impact on consumption is expected to be noticeable in 2019 when the recently-
introduced higher personal income tax exemptions will materialise in real cash transfers and
thus effectively increase the disposable incomes of households. Export volumes have
14CENTRAL EUROPE AND THE BALTIC STATES
continued to rise, especially to euro area countries such as the Slovak Republic and
Germany. However, thanks to the investment-driven strong imports, net export growth was
negative last year and is likely to remain so as the real effective exchange rate reaches
record levels. In 2018 we anticipate a moderation in the growth rate to 3.8 per cent,
followed by a further reduction to 3.0 per cent in 2019.
Hungary
In Hungary, GDP growth accelerated to 4 per cent in 2017, underpinned by strong private
consumption and a recovery in investment. Following a major contraction in 2016,
investment growth reached 16.8 per cent last year, which was the second highest increase in
the EU. This recovery has been largely supported by improved EU funds absorption but also
by the long-awaited revival in corporate lending. Annual credit growth to the private sector
had been negative since September 2009 and it turned positive only in April 2017,
accompanied by a successful reduction in non-performing loans to below 5 per cent of total
loans by end-2017. Private consumption has remained the key growth driver, boosted by
substantially increased disposable incomes. Minimum wages were increased by 15 and 8 per
cent in 2017 and 2018 respectively. GDP growth is expected to remain strong, at 3.8 per cent
in 2018, before it decelerates to 3 per cent in 2019. The key risks to that scenario are value
chain effects of a potential euro area slowdown and mounting labour shortages. Labour
constraints constituted a limitation for production in almost 9 out of 10 companies in the
industry in the first quarter of 2018, the highest such ratio in the EU, according to the EC’s
business and consumer survey.
Latvia
The Latvian economy grew by 4.5 per cent in 2017, strongly supported by rising investment
and solid private consumption. The strongest growth of fixed assets was largely induced by
major purchases of transport equipment, intellectual property products and higher
construction (except dwellings). This strong corporate investment happened despite
contracting credit to the private sector and still weak EU funds absorption. In 2017, internal
funds accounted for the highest share of investment finance (76 per cent). Falling
unemployment and rising disposable incomes underpin robust private consumption, though
persistent skill mismatches and rising labour costs have already started to weigh on Latvia’s
international competitiveness. Despite the expected further recovery in investment as well
as the continued solid domestic demand, we downgrade our GDP forecast for 2018 to 3.5
per cent. The key factor behind this is the ongoing restructuring of banks’ portfolios, which
may result in a substantial withdrawal of non-resident deposits from the banking system. In
2019, GDP growth will likely remain at 3.5 per cent.
Lithuania
GDP growth in Lithuania reached 3.8 per cent in 2017, the strongest rate since 2012 but
slightly below its Baltic neighbours. Robust private consumption was accompanied by
recovering investment as the key drivers of growth last year. Investment grew by 7.3 per
cent, largely supported by private sector purchases of fixed assets. Public sector investment
15CENTRAL EUROPE AND THE BALTIC STATES
is set to recover in line with the anticipated acceleration in EU funds absorption in 2018-19.
Following two consecutive years of contraction, export volumes have finally recovered,
rising by 13.6 per cent in 2017. However, we downgrade our GDP growth projections to 3.2
per cent this year. In 2019 we expect a further slowdown to 2.8 per cent, as the strong
investment-led imports will likely negatively contribute to GDP growth and domestic
demand will ease.
Poland
The 2017 GDP growth rate in Poland exceeded our previous expectations and reached 4.6
per cent. The strengthened private consumption and recovering investment were the key
growth drivers, with the latter registering a 3.4 per cent increase. At the same time,
investment as a percentage of GDP still remains subdued at only 17.7 per cent, substantially
below some of Poland’s regional peers. Following a slowdown in 2016 and the first half of
2017, EU funds absorption and public investment have finally accelerated since the second
half of 2017. Private outlays, however, remain slow due to policy uncertainty and the tight
labour market. Labour shortages are seen as the main factor limiting industry production by
nearly half of companies, according to the EC’s business and consumer survey. The flip side
for households is high wage growth, which is supporting consumption growth.
Unemployment fell to a new record low of 4.4 per cent in February 2018 but the growth of
the employment share in total population has grinded to a halt. While female employment
rates in Poland are among the lowest in the EU, recently-introduced policies (such as a
decrease of the retirement age or generous social transfers) have reduced female
employment since the second half of 2017. Unless addressed by policy-makers, labour
shortages, which are exacerbated by low participation rates of the disabled and the elderly,
will likely weigh on future growth potential. GDP growth in 2018 is expected to remain
strong, at 4.0 per cent, before it slows down to 3.3 in 2019, as the supply problems and
rapidly appreciating real exchange rate start to weigh on Poland’s competitiveness.
Slovak Republic
Economic growth in the Slovak Republic reached 3.4 per cent in 2017, supported by the EU
economic expansion, high employment and accelerating wage growth. Investment, which
was a major drag on growth in 2016, started to recover in late 2017. Unemployment and
labour participation rates have been impressive but labour shortages are limiting production
in over 20 per cent of companies (and above 30 per cent only in industry) according to
surveys. The first signs of overheating in household credit have started to appear in the
otherwise small, profitable and well-capitalised banking sector. We anticipate a growth rate
of 3.9 per cent this year and 4.2 per cent in 2019. However, the near-term growth outlook
will crucially depend on German industrial output and on progress in public investment
deployment. A particular risk is the escalation of global trade tensions, especially in the
automotive sector.
16CENTRAL EUROPE AND THE BALTIC STATES
Slovenia
The Slovenian economy expanded strongly in 2017 by 5 per cent (speeding up from 3.1 per
cent in 2016) on the back of growing investment and private consumption as well as exports.
The growth is likely to slow down in the near term but will remain relatively strong,
projected at 4.0 per cent in 2018 and 3.3 per cent in 2019. The medium-term outlook will
depend primarily on the speed of structural reforms, which have progressed but are still far
from completed. Although fiscal consolidation resulted in the budget deficit falling from 5.5
per cent of GDP in 2014 to 0 per cent in 2017, public debt remains high at 74 per cent of GDP
at end-2017, implying a need for more reforms supporting fiscal sustainability in areas such
as public wages, pensions, health and education. In addition, high corporate over-
indebtedness as well as the slow pace of business environment reforms and privatisation
could act as a drag on growth.
17SOUTH-EASTERN EUROPE
South-Eastern Europe (SEE)
Economic growth was positive in all SEE countries in 2017, with the exception of FYR
Macedonia where a sharp drop in investment contributed to a recession in the first half of
the year and an overall growth rate of zero in the whole year. However, all countries in this
region are projected to grow in 2018 and 2019, with prospects improving significantly in
Serbia and several other Western Balkans countries and continued robust performance in
Bulgaria and Romania. After a return to growth in 2017, the Greek economy is expected to
further improve this year and next, even though further austerity measures are in the
pipeline, while the Cypriot economy continues to show a strong recovery from the crisis of
several years ago.
Albania
Overall economic performance in Albania was robust in 2017 and the economy grew by 3.8
per cent. Growth was influenced equally by private consumption and investment (in terms
of contribution to growth, of 2.2 and 2.0 percentage points respectively). The construction
of two major energy sector projects is driving investment, although the direct economic
impact on GDP is expected to decelerate in the short term before the economy starts
enjoying the operational benefits of the two projects from 2020 onwards. Average inflation
in 2017 was just 2 per cent, still below the central bank’s target of 3 per cent and despite the
continuation of the historically low policy rate of the Bank of Albania, at 1.25 per cent. In
light of the strong positive dynamics in the economy, we are raising our 2018 forecast
marginally to 3.8 per cent in 2018, with a similar rate (3.9 per cent) projected for 2019. The
high level of public debt remains a significant constraint on any fiscal stimulus but credit
growth is expected to continue as the health of the banking sector improves and as the level
of non-performing loans declines further.
Bosnia and Herzegovina
The Bosnian economy grew by an estimated 3.0 per cent in 2017, following similar growth
rates in the previous two years, and has once again proved to be resilient to reform
slowdowns and political uncertainty. Services, and particularly domestic trade, were the
main growth drivers, supported by private consumption. Industry also performed well last
year, although the agriculture sector had a slight drag on growth. At the same time, there
was a significant slowdown in investments, partly due to the significant delays in
implementing reforms needed to unlock major infrastructure projects. The passing by
parliament of a law on increase of the fuel excise tax in December 2017 was therefore a
major step forward, paving the way for a resumption of infrastructure financing in the roads
sector, including for corridor Vc. We therefore expect that investment will play a more
growth-supportive role in the coming period. We also expect exports to rise further, due to
the more favourable external environment. We are thus raising our forecast for 2018 from
3.0 to 3.3 per cent in 2018 and projecting 3.5 per cent growth in 2019. Uncertainty
associated with general elections later in 2018 and possible reform paralysis remains an
important downside risk.
18SOUTH-EASTERN EUROPE
Bulgaria
The Bulgarian economy grew by 3.6 per cent in 2017. Private consumption was the main
driver of growth, as average wages increased on account of the tightness of the labour
market and a 10 per cent increase in the minimum wage. Improved absorption of EU
structural funds saw investment start to pick up in 2017, following a decline in 2016.
However, the impact of net exports on growth turned negative due to the consumption-
driven increase in imports. Following a three-year deflation, consumer prices increased in
2017, driven by growing household consumption. The government stuck to tight fiscal
policies throughout 2017, leading to a budget surplus standing at 0.9 per cent of GDP at the
end of the year. Growth is expected to remain around 3.6 per cent in 2018, declining slightly
to 3.4 per cent in 2019. Growth will continue to be driven by domestic demand, as tight
labour market conditions spur consumption and investment strengthens as work on
infrastructure projects financed under the EU’s 2014-20 budget continues.
Cyprus
Economic activity in Cyprus sped up in 2017 and GDP growth is estimated at 3.9 per cent,
the highest rate of growth since 2008. Growth in 2017 was mainly driven by investment and
private consumption. Gross fixed capital formation accounted for more than 20 per cent of
GDP for the first time after 2010 and is on an upward trend. After many years of negative
contribution to growth, government spending also provided a small growth boost. Net
exports were the only drag on growth as imports, supported by rising private consumption
and investments, grew by a higher rate than exports. Tourist arrivals in 2017 increased by
almost 15 per cent and the leading indicators in the first quarter of 2018 point to another
strong year for tourism in Cyprus, which is continuing to benefit from instability elsewhere.
Meanwhile, unemployment has dropped to single-digit levels, reaching 9.6 per cent in
February 2018, three percentage points lower than a year previously. Fiscal performance
remains strong and in 2017 the general government budget remained in surplus at 1 per
cent of GDP with the primary surplus reaching 3.5 per cent of GDP. The economic recovery is
expected to continue. In light of these trends, we are upgrading our annual GDP growth
forecast for 2018 from 2.5 to 3.2 per cent and forecasting a further 3.0 per cent growth in
2019. However, the legacies of the crisis, such as high public and private sector debt and a
large overhang of NPLs, remain important downside risks.
FYR Macedonia
The political crisis of recent years, which lasted well into the first half of 2017, had a
measurable cost on economic growth. The economy was in recession in the first half of the
year but recovered somewhat in the second half of the year, leaving growth for the year as a
whole at zero per cent. Private consumption was the only growth contributor last year, while
investment declined significantly. A recovery is under way in 2018, helped by political
stability and the impact of the rising minimum wage and other social protection measures
on private consumption. Credit to the economy is also expected to rise further as lending
conditions ease. Exports grew strongly by 18 per cent in 2017 and a further rise is expected
in the short term in light of the strengthening of economic prospects in the EU, the country’s
19SOUTH-EASTERN EUROPE
key trading partner. We are keeping our growth forecast for 2018 at 2.5 per cent and we
expect growth to accelerate to 3.0 per cent in 2019. However, downside risks remain
significant and investor sentiment could deteriorate if political uncertainty were to increase.
Greece
After two years of marginally negative growth, the Greek economy grew by 1.4 per cent in
2017. Growth was partly driven by investment, with gross fixed capital formation
contributing 1.1 percentage points to overall growth. Exports also performed well (an
increase of 6.8 per cent compared to 2016 in real terms) although the higher rate of imports
increase meant that net exports had a small drag on growth. Business confidence has risen
steadily, with the purchasing managers index (PMI) reaching a level in February 2018 not
seen since June 2000, but consumer confidence has plateaued in recent months after rising
steadily in 2017. Growth last year was also supported by another excellent tourism season,
including a 10.8 per cent increase in travel receipts (which, at € 14.6 billion, account for 8 per
cent of GDP). Employment has also been on an increasing trend and the (seasonally
adjusted) unemployment rate in January 2018 was 20.6 per cent, down from 23.2 per cent in
January 2017. Looking ahead, we expect the improving trends in investment, employment
and confidence to continue through 2018 and 2019, leading to further growth of 2.2 per
cent in 2018 and 2.3 per cent in 2019. However, the downside risks remain significant amid
uncertainty about the post-programme framework and reform programme and Greece’s
long-term debt sustainability.
Kosovo
Economic growth in Kosovo in 2017 is estimated at 3.7 per cent, a small deceleration
compared to the two previous years. Growth was mainly investment driven, although net
exports were also a positive contributor to growth. The unemployment rate continued its
declining path over the last three years and now stands at 27.5 per cent. However, the low
rate of labour force participation, especially among women, represents a key bottleneck for
further economic development. We are marginally increasing our 2018 GDP growth forecast
to 3.7 per cent, and projecting 4.0 per cent growth in 2019, due mainly to a more favourable
external environment and hence higher remittances and exports, as well as an anticipated
acceleration of investment, including in public infrastructure. Future growth may also
depend on the pace of implementation of the planned new 500MW thermal power plant,
for which a contract was signed between the government and the US firm ContourGlobal in
December 2017.
Montenegro
Economic activity in 2017 was higher than expected and growth is now estimated at 4.4 per
cent, mainly driven by private consumption which in turn was fuelled by the relatively high
rate of lending growth. However, investment was also a significant contributor. The
construction sector of the priority section of the highway connecting the Montenegrin coast
with Serbia (financed by the Chinese Exim Bank and implemented by the Chinese CRBC) is
ongoing, as well as some flagship tourism investments on the coast. Tourist arrivals were up
20SOUTH-EASTERN EUROPE
by 10.3 per cent in 2017. Risks in the financial sector have diminished as the asset quality of
the banking sector has improved and NPLs dropped to just 7.2 per cent of total loans.
However, sustainability of the public finances is still a major risk and has necessitated the
implementation of several austerity measures. We are keeping our 2018 growth forecast at
3.3 per cent in 2018, while we expect a further growth deceleration in 2019 to 2.7 per cent
as the fiscal austerity measures start to bite and the current construction cycle comes to its
end.
Romania
Romania was one of the best performing economies in the EU in 2017, with GDP growth of
6.9 per cent. Private consumption was the main driver of growth, supported by a pro-cyclical
fiscal policy, strong wage growth and low unemployment. Investment started to pick up in
the second half of the year, driven by increased absorption of EU funds. Overheating risks
are becoming apparent, however, notably in the tightening of the labour market and the
increase in inflation to 5 per cent in March 2018. The central bank has started to tighten
monetary policy, raising its main policy rate twice so far in 2018, with further rate increases
expected this year. External vulnerabilities are rising, with the current account deficit
widening to 3.4 per cent of GDP in 2017 due to rising imports, while the government’s
policies are having an adverse impact on the fiscal deficit, which is expected to exceed 3 per
cent of GDP in 2018. GDP growth is expected to slow over the next two years as it returns to
more sustainable levels, with growth of 4.6 per cent expected in 2018 and 4.2 per cent in
2019.
Serbia
After 2.8 per cent growth in 2016, the Serbian economy grew by only 1.9 per cent in 2017,
primarily due to somewhat weaker exports and fast imports growth. On the production side,
the main contributors to the growth slowdown have been the summer drought that badly
affected the agriculture sector and problems in mining and electricity generation. Fiscal
performance has continued to be better than envisaged. In recent years the budget deficit
turned from 6.6 per cent of GDP in 2014 to a surplus of 1.2 per cent of GDP in 2017, while
public debt dropped below 65 per cent of GDP by the end of 2017. Despite relatively high
FDI inflows (at 6.6 per cent of GDP in 2017), total investment remains below 20 per cent of
GDP, a level which is lower than needed for a meaningful convergence towards EU
standards. Economic growth is expected to accelerate to 2.9 per cent in 2018 and 3.5 per
cent in 2019. Faster growth should be supported by the low base as well as strengthening
consumption and investment activities, with offsetting effects from higher imports. A
possible slowdown or pause in fiscal and structural reforms represents the main downside
risk to the projection.
21TURKEY
Turkey
After a challenging year following the failed military coup attempt in 2016, the Turkish
economy grew by 7.4 per cent in 2017 as the government enacted a series of stimulus
measures, most significantly an expansion of government-backed credit guarantees to SMEs
under the TRY 250 billion Credit Guarantee Fund (CGF). However, the rapid pace of growth –
significantly in excess of potential growth of 4-4.5 per cent – has seen inflation increase to
double figures and a widening of the current account deficit to around 6 per cent of GDP.
This has led to concerns about overheating in the economy.
The large current account deficit, alongside the extensive FX-denominated corporate debt
and investor uncertainty due to domestic and geopolitical risks, has resulted in volatility of
the lira, which depreciated on average by 20 per cent against the US dollar in 2017. The
depreciation has continued in 2018.
With elections brought forward from November 2019 to June 2018, the government will
have scope to rebalance policy sooner, adjusting fiscal and macroprudential policy to
address overheating concerns and reducing domestic and external imbalances. It will also
be important to address inflation and anchor inflation expectations by tightening monetary
policy. This is key to reassuring investors at a time when the global cycle is turning. With
gross external financing needs likely to exceed 25 per cent of GDP in 2018, the country will
remain highly exposed to changing global liquidity conditions, particularly given weak FDI
inflows and limited FX reserves.
Strong public finances and a stable banking system remain the key anchors of the economy,
despite the recent loosening of fiscal policies and growing contingent liabilities. A significant
strength of Turkey is its low public debt (of around 29 per cent of GDP) and its low budget
deficit (which stood at 1.5 per cent of GDP at end 2017 notwithstanding a slight increase as a
result of the expansionary fiscal policies). The banking system remains well capitalised, with
an NPL ratio below 3 per cent, although the effects of the rapid credit growth associated
with the CGF remain to be seen.
Growth of around 4.4 per cent is expected in 2018, moderating to around 4.2 per cent in
2019, in line with potential growth, as limits to credit growth lead to a cooling down of
domestic demand. Net exports are likely to partly offset this, as a result of the ongoing
weakness of the lira and increasing demand in key export markets. Key risks to the outlook
are potential moderation in global liquidity, investor uncertainty in the context of the
domestic and geopolitical environment, and further depreciation of the lira. In the medium
term the government needs to undertake structural reforms to improve competitiveness
and achieve external rebalancing to generate sustainable growth. The early elections should
provide a window for the government to do this.
22EASTERN EUROPE AND THE CAUCASUS
Eastern Europe and the Caucasus (EEC)
All EEC economies are experiencing growth although the pace and context vary. In Ukraine,
economic growth remains relatively slow even though it is forecasted to pick up slightly in
2018. Azerbaijan exited recession in 2017 and is undergoing a gradual recovery. Belarus’s
economic recovery is gaining speed. Moldova is generating growth despite significant
downside risks. The Armenian economy has rebounded strongly after growth came almost
to a standstill. Growth momentum remains strong in Georgia. The EEC region is forecast to
grow by 3.0 per cent in 2018 and 3.3 per cent in 2019, contingent on a non-intensification of
geopolitical and political tensions, continued improvement in regional economic context and
other country-specific factors.
Armenia
Armenia’s real GDP growth rebounded strongly in 2017. The economy grew by 7.5 per cent
last year, benefiting from positive trends in major trading partners and a recovery in
domestic demand. Annual growth in exports of goods and services averaged 19.4 per cent in
2016-17 in real volume terms. In 2017, the revival of growth in household consumption was
supported by a 14.6 per cent rise in money transfers from abroad. On a sectoral level,
growth was broad-based with construction output returning to growth in 2017 after several
consecutive years of decline. Inflation gradually increased to 1 per cent in 2017 and further
to 3.3 per cent year-on-year in the first quarter of 2018 but it remains below the central
bank’s target of 4 per cent. The public debt-to-GDP ratio was estimated at close to 59 per
cent of GDP in 2017. To put it on a declining path, Armenia has pursued fiscal consolidation
and took steps to optimise planning of investment projects funded by international donor
organisations. Economic indicators remained on a positive trajectory in the first quarter of
2018. We forecast Armenia’s economy to grow by 3.5 per cent in 2018 and by 4.5 per cent in
2019. However, domestic political uncertainty might weigh on the pace of output expansion
this year. Unresolved conflict over the Nagorno-Karabakh region also poses a risk to the
growth outlook.
Azerbaijan
After the GDP decline in 2016, economic growth in Azerbaijan was almost flat in 2017.
Growth accelerated to 2.3 per cent year-on-year in the first quarter of 2018, driven by a 2.9
per cent year-on-year growth in non-oil GDP. Since April 2017, exchange rate fluctuations
have remained within a narrow band amid stringent monetary conditions and a recovery in
the oil price. Inflation fell from 12.9 per cent in 2017 to 4.0 per cent year-on-year in the first
quarter of 2018, paving the way for monetary policy relaxation. The central bank of
Azerbaijan (CBA) has recently lowered the refinancing rate two times from 15 per cent in
February 2018 to 11 per cent in April 2018. The current account switched from a deficit in
2016 to a surplus of 4.1 per cent of GDP in 2017 on the back of higher hydrocarbon
revenues. Official foreign exchange reserves of the CBA increased from US$ 4 billion in
December 2016 to US$ 5.5 billion in March 2018. As of the first quarter of 2018, the
combined assets of the State Oil Fund of Azerbaijan (SOFAZ) and of the foreign exchange
reserves of the CBA stood at US$ 43.1 billion, which is approximately equivalent to the
23You can also read