The untouchables Football Money League
←
→
Page content transcription
If your browser does not render page correctly, please read the page content below
The untouchables
Football Money League

Sports Business Group
February 2011

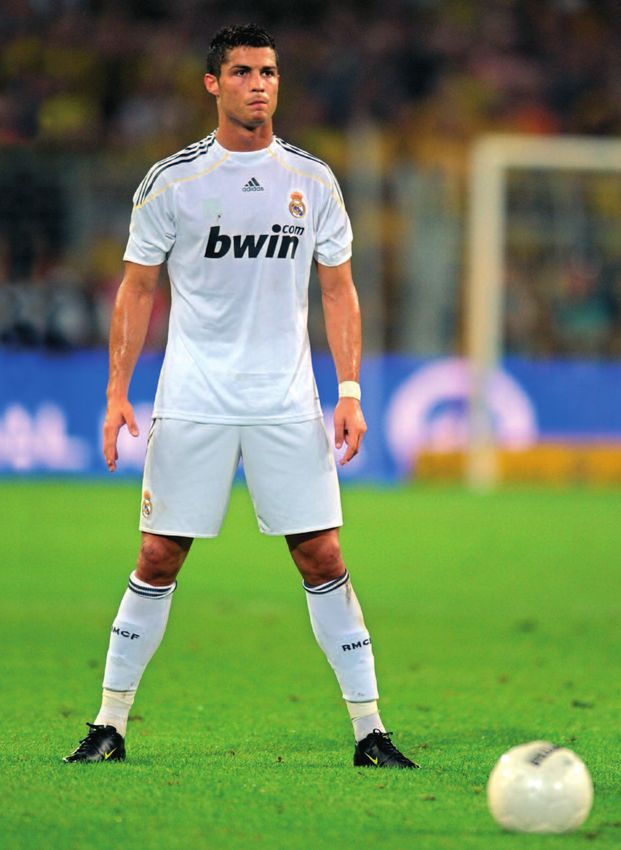
We expect a battle
between Spain’s two
superclubs for top spot
in the Money League
for the next few years
at least

Contents

2    Welcome

6    How we did it

7    Ups and downs

8    The Deloitte Football Money League

30   Three pronged attack

36   TV Times

Edited by
Dan Jones

Sub-editor
Austin Houlihan

Authors
Richard Battle, Adam Bull, Martyn Hawkins,
Simon Hearne, Rich Parkes and Alexander Thorpe

Sports Business Group at Deloitte
PO Box 500, 2 Hardman Street, Manchester, UK
M60 2AT
Telephone: +44 (0)161 455 8787
Fax: +44 (0)161 455 6013
E-mail: sportsteamuk@deloitte.co.uk
www.deloitte.co.uk/sportsbusinessgroup

February 2011

       Football Money League 2011 Sports Business Group 1
Welcome

                                                                                 The same ten clubs populate the top ten places in the
Welcome to the 14th edition of the Deloitte Football                             Money League for the second successive year, with the
Money League, in which we profile the highest earning                            top six ranking identical to last year. Six of those top ten
clubs in the world’s most popular sport. The Money League                        have been in our Money League top ten in each of the
                                                                                 last ten years. Each of this year’s top ten clubs has been
is published nine months after the end of the 2009/10                            in for at least eight of the last ten years and none has
season, and is therefore the most contemporary and reliable                      ever dropped below 13th in that period. This shows
analysis of clubs’ relative financial performance.                               both the enduring strength of these clubs and the scale
                                                                                 of the challenges to those aspiring to break into that
                                                                                 elite group. Nonetheless, we expect to see one or two
                    There are a number of methods that can be used to            clubs make that step in the next year or two.
                    determine clubs’ relative size – including measures of
                    fanbase, attendance, broadcast audience, or on-pitch
                    success. Indeed the relative wealth of certain clubs’        Spanish one-two
                    owners has filled many column inches in recent times.        Congratulations to Real Madrid who head the Money
                    However, the Money League focuses on the clubs               League for the sixth successive year. Los Blancos will
                    themselves, comparing revenue from day to day                doubtless be confident that they can match Manchester
                    football operations which we believe is the best publicly    United’s eight year hegemony enjoyed from 1996/97,
                    available financial comparison.                              the first edition of the Money League, through to
                                                                                 2003/04.
                    Whilst last year’s Money League, covering the 2008/09
                    season, showed football’s top clubs’ relative resistance     FC Barcelona is placed second in the Money League
                    during the early stages of the economic downturn,            completing a Spanish one-two for the second successive
                    it wasn’t until the 2009/10 season, which is the focus       year. Whilst the Catalan club could not quite match its
                    of this edition, that we expected to see the full impact     domestic double and UEFA Champions League winning
                    on clubs.                                                    season of 2008/09 in 2009/10, it retained the La Liga
                                                                                 title and added the FIFA World Club Cup and UEFA
                    We continued to assert that the game’s top clubs             Super Cup.
                    would be well placed to meet these challenges given
                    their large and loyal supporter bases, ability to drive      It is Barca’s on-pitch success that has underpinned its
                    broadcast audiences, and continuing attraction to            revenue growth in recent years. Conversely, Real’s recent
                    corporate partners.                                          revenue growth has been achieved despite relatively
                                                                                 modest on-pitch performance by the club’s own high
                    This was more than borne out by clubs’ revenue               standards, particularly in the Champions League.
                    performance in 2009/10. The combined revenues of the
                    top 20 Money League clubs surpassed €4 billion for the
                    first time, with a total of €4.3 billion being an 8%         The combined revenues
                    increase on the previous year. All bar three of the top 20
                    clubs achieved revenue growth in 2009/10.                    of the top 20 Money
                    The established large and loyal supporter bases and
                                                                                 League clubs surpassed
                    historic on-pitch success underpin the brand strength of     €4 billion for the first
                    football’s top clubs. These characteristics mean that a
                    handful of clubs continue to drive the highest revenues      time in 2009/10
                    and populate the top positions within the Money League.

2
Chart 1: Total revenues 2009/10 (€m)
450
Fourteen of the top 20
clubs participated in the
438.6
400 Champions League in
398.1
350
2009/10 with six clubs
349.8
participating in the
323.0
300
Europa League from the
Group phase onwards
274.1
250
255.9
235.8
225.3
224.8
200
205.0
As in last year’s edition, all of this year’s 20 clubs are
from the ‘big five’ European leagues with Germany and
141.1
124.5
150 Italy contributing four clubs each, Spain three clubs, and
152.8
Tottenham Hotspur 146.3
Olympique Lyonnais 146.1
146.2
139.8
France two clubs.
Olympique de Marseille
122.7
VfB Stuttgart 114.8
109.4
100
Manchester United
Atlético de Madrid
VfB Stuttgart and Aston Villa return to the top 20 after a
Manchester City
Bayern Munich
Hamburger SV
Internazionale
FC Barcelona
one year and five year absence respectively. Atlético de
Real Madrid
Schalke 04
Aston Villa
50
AC Milan
AS Roma
Madrid’s success in winning the reformatted and
Liverpool
Juventus
Chelsea
Arsenal
renamed UEFA Europa League, Europe’s second tier
0 clubs competition, allow it to claim 17th position, its
highest position since the 12th place secured in our first
edition of the Money League back in 1996/97.
Source: Deloitte analysis. Whilst Real held a €40m revenue advantage over Barca
in 2009/10, Barca’s revenues should exceed €400m in Two German clubs, Werder Bremen and Borussia
the next edition of the Money League, particularly given Dortmund, drop out of this year’s top 20, continuing a
the club’s new shirt sponsorship deal with the Qatar recent trend of two or three clubs being relegated from
Sports Investment Agency which will deliver revenue the top 20 each year, with on-pitch performance and
from 2010/11. Hence, we expect a battle between particularly participation, or a lack of it, in the
Spain’s two Superclubs for top spot in the Money Champions League being a key driver of a club’s
League for the next few years at least, with on-pitch promotion or relegation from the top 20. Fourteen of
performance likely to be a key driver. the top 20 clubs participated in the Champions League
in 2009/10 with six clubs participating in the Europa
League from the Group phase onwards, four of whom
Promotion and relegation parachuted in from the top-tier competition. Four clubs
Whilst Spanish clubs claim the top two spots in the – Manchester City, Tottenham Hotspur, Schalke 04, and
Money League, England retains the largest Aston Villa – didn’t participate in any European
representation from any single country, again with seven competition from the group phase onwards.
clubs. This strength in depth is driven by the scale and
relatively even distribution of the Premier League’s
centrally negotiated broadcast monies and the success
of English clubs in generating higher matchday revenues
than their continental competitors.
Football Money League 2011 Sports Business Group 3
Clubs from the ‘big five’ European leagues also occupy
Inter’s treble winning season – lifting                                  the vast majority of positions immediately below the top
                                                                         20 as the table below shows.
the Scudetto, Coppa Italia, and
Champions League – did not allow it to                                   Club                                    Reported revenue
                                                                                                                              €m
move up the Money League with the                                        ACF Fiorentina                                        106.4
                                                                         Borussia Dortmund                                     105.2
club retaining ninth position despite a                                  FC Girondins de Bordeaux                              102.8
€28m (14%) uplift in revenue                                             Sevilla CF
                                                                         Valencia
                                                                                                                                99.6
                                                                                                                                99.3
                                                                         Benfica                                                98.2
                                                                         Everton                                                96.6
             Movers and shakers                                          Werder Bremen                                          96.5
             So who are the biggest movers in this year’s list?          Napoli                                                 95.1
             Manchester City has climbed the most places, up nine to     Fulham                                                 94.2
             eleventh position, even though the club did not             West Ham United                                        87.6
             participate in European competition. Whilst its revenue
             growth in 2009/10 has been due to commercial revenue
             increases, the club’s owners will be hoping the heavy
             investment in the playing squad will translate into on-     Moving forward
             pitch success, particularly in qualifying for the           What can we expect in future years? New, bigger central
             Champions League. Should this be achieved,                  overseas broadcast deals, from 2010/11 should allow
             Manchester may join Milan and London in having two          English clubs to retain the highest representation in the
             clubs in the Money League top ten in future editions.       Money League in forthcoming years.

             Perhaps a more immediate challenger to the top ten is       Whilst Inter, AC Milan and Juventus retained top ten
             Tottenham Hotspur, who climb three places to 12th in        positions in this edition, and Serie A’s return to collective
             this edition. The club’s continued on-pitch improvement     selling from 2010/11 is an encouraging sign that Italian
             allowed it to finish fourth in the Premier League in        football is in the early stages of much needed reform,
             2009/10 and qualify for this season’s Champions             more action is necessary at an accelerated pace
             League. Whilst there is a gap of over €50m between          particularly in relation to stadia, if Italian clubs are not to
             them and tenth place Juventus, the revenue that Spurs       lose further ground against their European peers. It is
             will receive from participating in Europe’s top clubs’      only five years since two Italian clubs, Juventus and AC
             competition in 2010/11 will provide a substantial boost.    Milan, claimed top five positions in the Money League.
             Juve’s failure to qualify for the Champions League in
             2010/11 will likely mean that it drops out of the top ten   The much discussed implementation of UEFA’s Financial
             next year.                                                  Fair Play Regulations from 2013/14 will not impact on
                                                                         clubs’ revenue generation, with the key principle
             Perhaps surprisingly, Inter’s treble winning season –       underlying the regulations being that clubs do not spend
             lifting the Scudetto, Coppa Italia, and Champions           more than they earn. Indeed the regulations should help
             League – did not allow it to move up the Money League       encourage clubs to identify and realise sustainable
             with the club retaining ninth position despite a €28m       increased revenues.
             (14%) uplift in revenue. The club is close behind
             Liverpool and its Milan neighbours, but its non mover
             status emphasises the challenges it, along with most
             Italian clubs, has in addressing matchday and
             commercial revenues.

4
In any event, in principle, it is logical to expect those
clubs earning the most to be able to invest the most in
their playing squads and this to translate into on-pitch
success and hence a continued stasis amongst clubs in
terms of the Money League rankings, particularly
towards the top of the list.

In our previous publications, we have demonstrated that
there is a strong correlation between a club’s wage bill
and on-pitch success, particularly within domestic
competition. Indeed this year’s Money League clubs
have won 43 of the 50 domestic league titles available
in the ‘big five’ countries over the past ten years.
The link is less strong at European competition level
although only one club from outside the Money League
top ten – Porto in 2003/04 – has won the Champions
League in the past ten years.
                                                             Our focus this year
In the positions immediately below first place in            In addition to our usual profiles of the top 20 clubs we
domestic leagues, the all important European                 include two feature articles in this year’s publication.
qualification places, there is more variability in clubs’    The first assesses each of the three key revenue streams,
finishing position although in general those clubs further   listing the top 20 clubs for each, whilst comparing and
up the Money League have been the most consistent            contrasting these lists with the overall top 20. With the
qualifiers for the Champions League.                         return of Serie A to collective selling from 2010/11,
                                                             Spain stands alone as the only ‘big five’ league to retain
In future, we expect a continuation of the pattern of the    an individual selling regime, although discussions are
top positions in the list being relatively resistant to      currently taking place regarding the future distribution
movement of clubs, and two or three clubs dropping in        of broadcast revenues with the rights selling method
and out of the top 20 rankings each year, largely due to     potentially open for future discussion. Our second
on-pitch performance.                                        feature article therefore looks at the collective and
                                                             individual sale of broadcast rights, the relative impact of
                                                             each regime on clubs’ revenue generating ability, and
                                                             the impact on both domestic competition and the
This year’s Money League                                     Money League.

clubs have won 43 of the                                     The Deloitte Football Money League was compiled by
50 domestic league titles                                    Dan Jones, Austin Houlihan, Richard Battle, Adam Bull,
                                                             Martyn Hawkins, Simon Hearne, Rich Parkes and
available in the ‘big five’                                  Alexander Thorpe. Our thanks go to all those who have
                                                             assisted us, inside and outside the Deloitte international
countries over the past                                      network. We hope you enjoy this edition.
ten years
                                                             Dan Jones, Partner
                                                             www.deloitte.co.uk/sportsbusinessgroup

                                                                     Football Money League 2011 Sports Business Group 5
How we did it

We have used the figure for total revenue extracted               This publication contains a variety of information derived
from the annual financial statements of the company or            from publicly available or other direct sources, other
group in respect of each club, or other direct sources,           than financial statements.
for the 2009/10 season. In some cases, the annual
financial statements do not cover a whole season, but             We have not performed any verification work or audited
are for the calendar year, in which case we have used             any of the information contained in the financial
the figures for the most recent calendar year available.          statements or other sources in respect of each club for
                                                                  the purpose of this publication.
Revenue excludes player transfer fees, VAT and other sales
related taxes. In a few cases we have made adjustments            For the purpose of the international comparisons, all
to total revenue figures to enable, in our view, a more           figures for the 2009/10 season have been translated at
meaningful comparison of the football business on a club          30 June 2010 exchange rates (£1 = €1.2214).
by club basis. For instance, where information was                Comparative figures have been extracted from previous
available to us, significant non-football activities or capital   editions of the Deloitte Football Money League.
transactions have been excluded from revenue.
                                                                  There are many ways of examining the relative wealth
Each club’s financial information has been prepared on            or value of football clubs – and at Deloitte we have
the basis of national accounting practice or International        developed methodologies to help potential investors or
Financial Reporting Standards (“IFRS”). The financial             sellers do just that. However, for an exercise such as this,
results of some clubs have changed, or may in future              there is insufficient public information to do that.
change, due to the change in the basis of accounting              Here – in the Deloitte Football Money League – we use
practice. In some cases these changes may be significant.         revenue as the most easily available and comparable
                                                                  measure of financial wealth.
Based on the information made available to us in
respect of each club, to the extent possible, we have
split revenue into three categories – being revenue
derived from matchday, broadcast and commercial                   Based on the information made
sources. Clubs are not wholly consistent with each other
in the way they classify revenue. In some cases we have           available to us, we have split revenue
made reclassification adjustments to the disclosed
figures to enable, in our view, a more meaningful
                                                                  into three categories – matchday,
comparison of the financial results.                              broadcast and commercial sources
Matchday revenue is largely derived from gate receipts
(including season tickets and memberships). Broadcast
revenue includes revenue from both domestic and
international competitions. Commercial revenue includes
sponsorships and merchandising revenues. For a more
detailed analysis of the comparability of revenue
generation between clubs, it would be necessary to
obtain information not otherwise publicly available.

Some differences between clubs, or over time, will arise
due to different commercial arrangements and how the
transactions are recorded in the financial statements.
Some differences between clubs, or over time, will arise
due to different ways in which accounting practice is
applied such that the same type of transaction might be
recorded in different ways.

6
Ups and downs

2009/10 Revenue (€m)                            2008/09 Revenue (€m)

                                                                                                             Position in Football
 1         0   Real Madrid              438.6    1         0   Real Madrid                     401.4         Money League

 2         0   FC Barcelona             398.1    2         1   FC Barcelona                    365.9         Change on previous year

                                                                                                             Number of positions
 3         0   Manchester United        349.8    3         1   Manchester United               327.0         changed

 4         0   Bayern Munich            323.0    4         0   Bayern Munich                   289.5

 5         0   Arsenal                  274.1    5         1   Arsenal                         263.0

 6         0   Chelsea                  255.9    6         1   Chelsea                         242.3

 7         3   AC Milan                 235.8    7         1   Liverpool                       217.0

 8         1   Liverpool                225.3    8         3   Juventus                        203.2

 9         0   Internazionale           224.8    9         1   Internazionale                  196.5

 10        2   Juventus                 205.0    10        3   AC Milan                        196.5

 11        9   Manchester City          152.8    11        4   Hamburger SV                    146.7

 12        3   Tottenham Hotspur        146.3    12        3   AS Roma                         146.4

 13        2   Hamburger SV             146.2    13        1   Olympique Lyonnais              139.6

 14        1   Olympique Lyonnais       146.1    14        2   Olympique de Marseille          133.2

 15        1   Olympique de Marseille   141.1    15        1   Tottenham Hotspur               132.7

 16        0   Schalke 04               139.8    16        3   Schalke 04                      124.5

 17        1   Atlético de Madrid       124.5    17   n/a new Werder Bremen                    114.7

 18        6   AS Roma                  122.7    18   n/a new Atlético de Madrid               105.0

 19   n/a new VfB Stuttgart             114.8    19        1   Borussia Dortmund               103.5

 20   n/a new Aston Villa               109.4    20   n/a new Manchester City                  102.2

                                                                                   Football Money League 2011 Sports Business Group    7
8
1. Real Madrid

€438.6m            2009 Revenue €401.4m (£341.9m)           Real Madrid: Revenue sources and percentages (€m)
(£359.1m)          2009 Position (1)
                                                                                                500
                                                            34%                       30%
                                                                                                                                                439
                                                                                                400
Revenues of €438.6m (£359.1m) cement Los Blancos’                                                                                       401
position at the top of the Money League for the sixth                                                                351         366
                                                                                                300
consecutive year. Real remains the only club to surpass                                                 292
€400m in revenue, doing so for the second successive
                                                                                                200
season. Whilst the 2009/10 season saw Real Madrid
again outperformed on the pitch by Barcelona, who
                                                                                                100
beat them to the league title for a second successive                        36%

year, in revenue terms Real Madrid were over €40m              Matchday €129.1m (£105.7m)         0
(£33m) ahead of their Spanish rivals.                          Broadcasting €158.7m (£129.9m)          2006         2007         2008   2009   2010

                                                               Commercial €150.8m (£123.5m)           Five year revenue totals
Broadcasting revenue of €158.7m (£129.9m) was
consistent with the previous season (falling by only 1%),
underpinned by the club’s broadcast rights contract with    Real reported an €11.6m (8%) increase in commercial
Mediapro. This contract, combined with certain others       revenue to €150.8m (£123.5m). As a result Real and
guarantees the club more than €1.1 billion up to            Bayern Munich are the only two clubs that generated
2013/14. Exiting the UEFA Champions League at the           over €150m from this source. Real’s shirt front deal with
Round of 16 meant Real Madrid earned €26.8m                 Bwin runs until 2012/13 and reportedly generates
(£21.9m), €22m (£18m) less than the tournament              between €15m (£12.3m) and €20m (£16.4m) per
winners, Inter Milan. La Liga clubs are currently           season. Adidas will continue as kit sponsor until
discussing proposals for a more equal revenue               2011/12. Other partnerships, including with Audi,
distribution mechanism from domestic competition            Coca-Cola and Spanish beer brand Mahou also
broadcast rights, although Real and Barca will seek to at   contributed to commercial income in 2009/10, with
least protect current revenue levels which provide a key    Saudi Arabian telecoms company STC signing a three
advantage over their European peers. To put this into       year deal starting from 2010/11.
context, Real’s broadcasting revenue is higher than the
total revenue of half of the Money League clubs.            Matchday revenues grew by a remarkable €27.7m
                                                            (27%) to €129.1m (£105.7m). One driver of this growth
                                                            was the hosting of the Champions League final in 2010
                                                            at the Santiago Bernabéu in front of a crowd of 75,000.
Los Merengues will need                                     Real Madrid also achieved matchday revenue increases
                                                            at other matches owing to increased attendances,
their star player signings                                  memberships and prices. Real has reconfigured certain
of 2009 to justify their                                    areas within the Bernabéu in recent years in order to
                                                            grow corporate hospitality revenues.
transfer value on the pitch
                                                            In the coming years, particularly as UEFA’s Financial
both domestically and                                       Fair Play rules take effect, Real Madrid’s revenue
in the Champions League                                     prowess should, in theory, translate into a competitive
                                                            advantage on the pitch. In the short term, Los
in order to maximise                                        Merengues will need their star player signings of 2009
                                                            to justify their transfer value on the pitch both
its revenues                                                domestically and in the Champions League in order to
                                                            maximise its revenues and keep ahead of great rivals
                                                            Barcelona in the Money League.

                                                                                                       Football Money League 2011 Sports Business Group 9
2. FC Barcelona
€398.1m 2009 Revenue €365.9m (£311.7m) FC Barcelona: Revenue sources and percentages (€m)
(£325.9m) 2009 Position (2)
400
31% 398
25%
366
Barcelona’s unprecedented on-pitch success in 2008/09 300 309
was continued into 2009/10, a season in which the club 290
259
won La Liga and the Spanish Supercopa. This was
200
complemented by reaching the semi-final of the UEFA
Champions League and being crowned FIFA Club World
Cup champions in December 2009. 100
44%
Despite the strengthening of Sterling against the Euro Matchday €97.8m (£80.1m) 0
between 2008/09 and 2009/10, Barcelona have Broadcasting €178.1m (£145.8m) 2006 2007 2008 2009 2010
consolidated their 2nd placed position in the Football Commercial €122.2m (£100.0m) Five year revenue totals
Money League, increasing their lead over Manchester
United from €38.9m in 2008/09 to €48.3m (£39.5m).
In 2009/10, revenue grew across all three categories Foundation logo on the Blaugrana’s shirt from the start
with total revenue increasing by 9% to €398.1m. of the 2011/12 season through to the end of the
2015/16 season. Part of the new administration’s
Less successful Copa del Rey and Champions League strategy will look to build on Barca’s on-pitch success
campaigns saw the number of home matches at the and the strength of its brand in order to increase
Nou Camp reduce from 30 in 2008/09 to 27 in commercial revenue.
2009/10. Even so, matchday revenue increased slightly
by €2.3m (2%) to €97.8m, with Barcelona generating If Barcelona can sustain their remarkable on-pitch
the 4th highest matchday revenues amongst Money success of recent seasons and continue to translate
League clubs. A small increase in matchday revenue in this into revenue growth then they will challenge their
2010/11 will likely enable Barcelona to join Real Madrid great rivals for top position in the Money League in
in generating over €100m across each of the three future editions.
revenue streams. Manchester United will also potentially
achieve this in 2010/11.
Broadcast revenues increased by €19.7m (12%) to
€178.1m with a rise in Champions League central
distributions of €8.1m, particularly driven by higher
market pool payments to Spanish clubs, contributing to
this increase. The club also signed a new individual
broadcast contract with Mediapro in 2010, with
improved financial terms, which runs until 2014.
2009/10 saw a healthy increase in commercial revenue
of €10.2m (9%) to €122.2m. Following the arrival of
new President Sandro Rosell in June 2010, the club
entered into a multi-year main shirtfront sponsorship
deal for the first time in its history. The new
administration has attributed this decision to the need to
to tackle the club’s debt. The five and a half season deal
with Qatar Sports Investment worth a guaranteed
minimum of €165m (£135m) is the highest of any
reported shirt sponsorship deal and will see the Qatar
103. Manchester United
Manchester United: Revenue sources and percentages (€m)
400
28% 35%
350
300 325 327
315
243
200
100
37%
Matchday €122.4m (£100.2m) 0
Broadcasting €128.0m (£104.8m) 2006 2007 2008 2009 2010
Commercial €99.4m (£81.4m) Five year revenue totals
€349.8m 2009 Revenue €327.0m (£278.5m) The new cycle of Champions League broadcast and
(£286.4m) 2009 Position (3) commercial contracts, with improved values, meant that
despite a less successful run in the competition, the
club’s distribution actually rose by €7.5m (20%) to
Manchester United retains third place in the Money €45.8m. This was the principal driver of overall
League after a season in which the club experienced broadcasting revenue growth, which increased by
mixed fortunes on the pitch. Victory in the League Cup £5.1m (5%) in 2009/10.
for a second successive season and a second placed
Premier League finish were tempered by comparatively The club’s commercial activities saw the most significant
disappointing FA Cup and UEFA Champions League revenue growth over the year, increasing by £11.4m
campaigns. (16%) to £81.4m. United have built on the commercial
success of previous years with the addition of several
Overall revenue grew by £7.9m (3%) to £286.4m new commercial partners which boosted revenues in
(€349.8m) with the club’s fortunes on the pitch mirrored 2009/10 including deals with Turkish Airlines, Betfair and
by mixed performance across the three revenue several telecommunications companies. The increased
2
categories. A decrease in matchday revenue was more value of the club’s new shirt sponsorship deal with Aon
than offset by growth in both broadcasting and most Corporation which came into effect for the 2010/11
significantly, commercial revenues. Despite favourable season will boost United’s commercial revenue further,
fluctuations in the Sterling exchange rate, Barcelona as will additional commercial deals including those with
increased the gap between second and third spot in the Singha, Thomas Cook, Epson and Vina Concha y Toro.
Money League by €9.4m to €48.3m.
As predicted in last year’s Money League, despite a
Elimination in the Champion’s League at the quarter-final favourable move in the Sterling exchange rate, the gap
stage and an early exit from the FA Cup resulted in fewer between United and its Spanish rivals has increased.
home games (28 versus 30 in 2008/09) and a decrease Manchester United’s revenue performance this year
of £8.6m (8%) in matchday revenue to £100.2m. emphasises that only the most successful on-pitch
However, the Red Devils still generate revenues per performance, particularly in the Champions League,
home match of £3.6m (€4.4m). Despite a c.5% along with continued growth in commercial revenues
decrease in season ticket renewal ahead of the 2010/11 and a stronger Sterling will enable the club to catch the
season, average league match attendances have to date two Spanish clubs.
remained broadly consistent with previous years.
Football Money League 2011 Sports Business Group 114. Bayern Munich
Bayern Munich: Revenue sources and percentages (€m)
400
53% 21%
300 323
295 290
200 223
205
26%
100
Matchday €66.7m (£54.6m) 0
Broadcasting €83.4m (£68.3m) 2006 2007 2008 2009 2010
Commercial €172.9m (£141.6m) Five year revenue totals
€323.0m 2009 Revenue €289.5m (£246.6m) As in previous years, commercial revenue is the club’s
(£264.5m) 2009 Position (4) real strength, accounting for over half of total revenue.
The €172.9m (£141.6m) generated from commercial
activities in 2009/10, an increase of €13.6m (9%) on the
A domestic league and cup double and their first UEFA previous year, is the highest of any of the Money League
Champions League final since 2001 helped Bayern clubs and remains more than €20m higher than the next
Munich to generate total revenue of €323m (£264.5m), best, €150.8m (£123.5m), achieved by Real Madrid.
up by €33.5m (12%) on 2008/09, and secure fourth
place in the Money League for the third consecutive year. The club’s on-pitch success during 2009/10 is likely to
The Bavarians have closed the gap on Manchester United have contributed to this growth by triggering
in third spot to €26.8m, a reduction of €10.7m since performance bonuses attached to their sponsorship deals.
2008/09. However, given that Bayern’s almost perfect
season coincided with United’s worst run in the The progress of Louis van Gaal’s men to domestic and
Champions League for four years and that the Red European cup finals led to the club playing 25 home
Devils will grow broadcast and commercial revenues matches during 2009/10 as compared with 23 in
again in 2010/11 it remains a significant challenge for 2008/09. This, combined with a season of largely selling
Bayern to break into the top three for the first time since out the 69,000 capacity Allianz Arena, has seen Bayern’s
the 2001/02 season. matchday revenue increase by €6.1m (10%) in 2009/10
to €66.7m (£54.6m). These increased revenues have
Bayern’s revenue exceeded €300m for the first time in facilitated the club’s ability to pay off a large portion of
2009/10 with growth across all three revenue streams. the stadium debt; within six years of the stadium
The largest rise was in broadcast revenue which opening the club will reportedly have paid off €176m.
increased by €13.8m (20%) on the 2008/09 figure to
reach €83.4m (£68.3m) in 2009/10. Finishing runner-up Despite an indifferent first half of the 2010/11 domestic
in the Champions League to Internazionale earned season Bayern have successfully qualified for the
Bayern central UEFA distributions of €44.9m, an increase knockout stages of the Champions League, which is vital
of €10.3m on 2008/09, the third highest of all the if they are to keep clear distance between themselves
Money League clubs after Internazionale and Manchester and the chasing pack and make up further ground on
United. However, the value of these deals remains the Money League’s top three.
significantly lower than its European rivals due to the
limited development of the German Pay-TV market
compared to the other ‘big five’ European countries.
125. Arsenal
€274.1m 2009 Revenue €263.0m (£224.0m) Arsenal: Revenue sources and percentages (€m)
(£224.4m) 2009 Position (5)
400
20%
42%
Arsenal retain fifth place in the Money League, posting 300
core football revenues of £224.4m (€274.1m) to
264 264 263 274
maintain their position as the second highest ranking
200
English club in the Money League. Whilst football 192
revenues remained flat overall, the club also earned a
further £157m (€192m) from property development. 38% 100
The financial benefits derived from the Emirates stadium Matchday €114.7m (£93.9m) 0
are regularly acclaimed. In 2009/10 the club consistently Broadcasting €105.7m (£86.5m) 2006 2007 2008 2009 2010
achieved its now customary capacity attendances, Commercial €53.7m (£44.0m) Five year revenue totals
averaging 59,765 for home league games, though five
fewer home matches (27) were played than in 2008/09,
contributing to the 6% fall in matchday revenue from overall increase in value of UEFA’s new broadcasting and
£100.1m (€117.5m) to £93.9m (€114.7m). Four fewer commercial contracts for the competition.
home games were played in domestic cup ties. But on a
positive note, matchday revenue per match rose from In previous years we have noted how, in terms of
£3.1m (€3.7m) to £3.5m (€4.2m) implying that if the commercial revenues, Arsenal lagged behind other elite
club performs well in future cup competitions European clubs. This remained the case in 2009/10,
substantial matchday revenue increases will follow. when commercial revenues reduced by £4.1m (9%) to
£44.0m (€53.7m). The decrease can be attributed to a
Broadcast revenues increased by 14% in 2009/10, to mixture of the economic climate, the lower number of
£86.5m (€105.7m), up from £75.8m (€89.0m) in the home games which resulted in lower merchandising and
previous season. This uplift is partly attributed to higher catering revenues, and less successful Champions
distributions from the Premier League, which League and FA Cup campaigns meant lower revenues
contributed £51.7m (€63.1m), as the team finished third were generated from some sponsorship contracts.
in the league rather than fourth, as in 2008/09. And
whilst in 2009/10 Arsenal fell one round short of Emirates hold stadium naming rights under a long term
reaching the semi-final of the Champions League (as in deal worth a reported £90m (€110m) extending to
the previous season), distributions from UEFA rose from 2020/21, which also includes shirt front sponsorship
€26.8m (£22.8m) to €33.4m (£27.3m), driven by the rights until 2013/14. The club’s kit deal with Nike has
also been extended, and improved, to run for a further
three years to 2013/14. Bound by such long-running
partnerships, it may be that substantial increases in
commercial revenues are not achievable in the short
term, although the club renewed its secondary
sponsorship deal with Lucozade Sport and secured
Thomson Sport as its new travel agency partner in 2010.
Arsenal is committed to its mission of financial self
sufficiency and has a strong and stable business model.
Its investment in its stadium has provided the business
with a solid foundation. In the longer term, if its strategy
of pursuing international commercial development is
successful, it could provide The Gunners with a financial
strength matched by few clubs.
Football Money League 2011 Sports Business Group 136. Chelsea
Chelsea: Revenue sources and percentages (€m)
400
27%
32%
300
283
269
256
242
200 221
41% 100
Matchday €82.1m (£67.2m) 0
Broadcasting €105.0m (£86.0m) 2006 2007 2008 2009 2010
Commercial €68.8m (£56.3m) Five year revenue totals
€255.9m 2009 Revenue €242.3m (£206.4m) For the first time since Roman Abramovich’s acquisition
(£209.5m) 2009 Position (6) of the club Chelsea’s matchday revenue fell, by £7.3m
(10%), in part due to the club’s disappointing
Champions League campaign resulting in two fewer
The arrival of Carlo Ancelotti as manager in the summer home fixtures in the competition. Although average
of 2009 after a period of managerial turbulence was home league attendances remained very strong at 99%
immediately followed by significant on-pitch success. of capacity (41,422), limited stadium capacity restricted
The club won the Premier League to end Manchester Chelsea to the lower half of the top 20 in terms of
United’s three year reign as champions, with the league average attendance amongst the Money League clubs.
title complemented by retaining the FA Cup and in doing Despite this the club still generated the fifth highest
so, securing for the club its first League and Cup double. matchday revenue with £67.2m (€82.1m) at an average
However, domestic achievement contrasted with a of £2.4m per game.
disappointing UEFA Champions League campaign that
saw Chelsea eliminated in the first knockout round by Despite a less successful European campaign, the
their former manager José Mourinho’s Internazionale. increased Premier League and UEFA Champions League
distributions, up £5.1m to £52.8m (€64.5m) and
The club achieved less success in terms of revenue €1.3m (£1.1m) to €32.2m (£26.5m) respectively,
growth, with total revenue growing by only £3.1m (2%) contributed to an increase in total broadcasting
to £209.5m, preventing the club from regaining their revenues of £6.9m (9%) to £86m (€105m).
place in the top five (which was lost to Arsenal last
year). As with Manchester United, a decline in matchday Consistent on-pitch success, both domestically and in
revenue was offset by increases in broadcast and Europe, coupled with further commercial revenue gains
commercial revenue. are likely to be key to revenue growth in the short term.
However, the limited capacity of Stamford Bridge, and
Over the year, commercial revenue grew by £3.5m (7%) the limitation this places on matchday revenues will
to £56.3m (€68.8m). The long term, high value shirt make it challenging for Chelsea to return to the top five
front (Samsung) and kit (adidas) deals were in the Money League in the near future.
complemented by new partnerships, such as that with
188Bet. The security of the club’s main partner deals as
well as the continued growth of its sponsorship portfolio
through recent deals such as those with Singha and
Lucozade, provides a platform for the club to achieve
further growth in future years.
147. AC Milan
€235.8m 2009 Revenue €196.5m (£167.4m) AC Milan: Revenue sources and percentages (€m)
(£193.1m) 2009 Position (10)
13% 400
27%
The return to UEFA Champions League football in 300
2009/10 helped AC Milan climb three places to seventh
in the Money League with record revenues of €235.8m 229 236
200 220 210
(£193.1m), up €39.3m (20%) on 2008/09. This climb in 197
the rankings included overtaking city rivals Inter, despite
the Nerazzurri’s on-pitch dominance in 2009/10. 100
60%
Reaching the Champions League’s Round of 16 earned Matchday €31.3m (£25.7m) 0
the club €23.8m in UEFA central distributions, dwarfing Broadcasting €141.1m (£115.5m) 2006 2007 2008 2009 2010
the €0.4m they received during their 2008/09 UEFA Cup Commercial €63.4m (£51.9m) Five year revenue totals
run. This, combined with revenue from archive rights
and option payments, drove a €42.1m (43%) increase in
broadcast revenue in 2009/10. Milan boast the third Despite finishing third in Serie A and competing in the
highest broadcast revenue in this year’s Money League Champions League, Milan’s matchday revenue fell by
with €141.1m (£115.5m). However, the club faces a €2.1m (6%) to €31.3m (£25.7m) in 2009/10 and
struggle to maintain or increase this in the next edition accounted for only 13% of total revenue. A 16,900
of the Money League, given the introduction of decrease on 2008/09’s average league attendance of
collective selling of Serie A broadcast rights from 59,700 has left Milan’s matchday revenue, with the
2010/11 and a more equal distribution of revenues exception of Juventus, as the lowest of the top ten clubs
amongst Italian clubs. in the Money League and lower than that achieved by
some clubs who did not make it into the Money
League’s Top 20. Plans to renovate the San Siro as part
of Italy’s bid for UEFA Euro 2016 may have provided the
platform to boost matchday revenue, but since France
were chosen to host the tournament these plans are less
certain, although redevelopment is much needed.
The Rossoneri’s commercial revenue decreased by €0.7m
(1%) to €63.4m (£51.9m) in 2009/10. The club’s shirt
sponsorship deal with Bwin, reportedly worth an average
of €12m per season, expired at the end of the 2009/10
season and has been replaced by a five year deal with
Emirates worth a similar €60m (£49m). This contract,
combined with a kit deal with adidas until 2016/17 and
Champions League qualification, will help Milan to
generate strong commercial revenues in 2010/11.
As noted, the club faces long term structural challenges
in matchday and broadcast revenue. In the short-term,
the club’s performance both domestically and in the
Champions League under new manager Massimiliano
Allegri will be the key determinant of how high they
finish in next year’s Money League.
Football Money League 2011 Sports Business Group 158. Liverpool
€225.3m 2009 Revenue €217.0m (£184.8m) Liverpool: Revenue sources and percentages (€m)
(£184.5m) 2009 Position (7)
23% 400
34%
Liverpool slip one place to eighth position with revenues 300
of £184.5m (€225.3m) in 2009/10. As is the case on the
pitch, they are likely to face strong competition from
200 217 225
Manchester City, who are the highest climbers up this 207 207
176
year’s Money League under their Middle Eastern
owners, and Tottenham Hotspur who have qualified for 100
43%
the UEFA Champions League for the first time, for a top
four position among English clubs in the Money League Matchday €52.4m (£42.9m) 0
next year. The strategy of the Merseyside club’s new Broadcasting €97.1m (£79.5m) 2006 2007 2008 2009 2010
North American owners, New England Sports Ventures Commercial €75.8m (£62.1m) Five year revenue totals
(NESV), will be central to re-establishing and sustaining
the club’s on and off pitch success.
Carlsberg. Whilst adidas will continue as the club’s kit
Matchday revenue of £42.9m (€52.4m) in 2009/10 was provider until the end of the 2011/12 season, NESV will
slightly up (by £0.4m) on the previous year despite a 2% be hoping to bring their experience from baseball to
drop in average home league attendance to 42,863 help Liverpool generate further commercial revenues
following a less successful Premier League campaign. from global sources.
27 home games were played in both seasons, with
matchday revenue per match of £1.6m consistent with Since they acquired the club in October 2010, the new
the previous season (although this followed a 23% rise owners have spent time ‘taking stock’ and have yet to
from £1.3m between 2007/08 and 2008/09). appoint a new CEO, although they were active in the
January 2011 transfer window. Plans for a new stadium
Broadcasting revenue increased by £4.9m (7%) to are also being considered, which, if the business case for
£79.5m (€97.2m) from £74.6m (€87.6m) in 2008/09, construction is proven, will be the most sustainable way
driven by an uplift in UEFA distributions, as a seventh for Liverpool to achieve further significant revenue
place finish in the Premier League provided £48.0m increases in the coming years. In the meantime, an
(€58.6m), £2.3m lower than in 2008/09 when the club improvement in on-pitch performance is essential
finished second. Although Liverpool exited the for the club to remain securely in the top half of the
Champions League at the Group stage, they received Money League.
€5.7m (£4.7m) more in central distributions than in the
previous season, when they reached the quarter-final,
and a further €3m (£2.5m) as a result of parachuting
into the Europa League and reaching the semi-final.
However, not qualifying for the Champions League in
2010/11 means the club will receive significantly lower
distributions from UEFA.
The increase in broadcast revenue was offset by a £5.6m
decrease in commercial revenues, from £67.7m (€79.5m)
to £62.0m (€75.9m). This reduction is attributed to
reduced royalties and merchandising income. However
Liverpool’s 2010/11 commercial revenues will be boosted
by the new four year deal with Standard Chartered Bank,
providing a reported £20m per season – £12.5m more
per annum than under the previous agreement with
169. Internazionale
Internazionale: Revenue sources and percentages (€m)
17% 400
21%
300
200 225
188 197
177 173
100
62%
Matchday €38.6m (£31.6m) 0
Broadcasting €137.9m (£112.9m) 2006 2007 2008 2009 2010
Commercial €48.3m (£39.6m) Five year revenue totals
€224.8m 2009 Revenue €196.5m (£167.4m) Inter’s 2009/10 broadcast revenue increased by €22.2m
(£184.1m) 2009 Position (9) (19%) on 2008/09 largely owing to the victorious
Champions League campaign, which earned the club
€48.8m in UEFA central distributions, compared to
Despite growing revenue by €28.3m (14%) to €224.8m €28.3m in 2008/09. The €137.9m (£112.9m) of
(£184.1m) and winning every competition that they broadcast revenue generated in 2009/10 is the fourth
entered in 2009/10, Internazionale remain in ninth place highest amongst Money League clubs, only bettered by
in the Money League. Whilst the increase in revenue the Spanish giants, Barcelona and Real Madrid, and their
saw Inter surpass their compatriots Juventus and close city rivals AC Milan. As with their neighbours, Inter will
the gap on Liverpool in eighth position to less than €1m, face challenges in maintaining this level in 2010/11 given
the Nerrazzurri will be most disappointed in being the return to collective selling of Serie A broadcast rights.
overtaken by their city rivals AC Milan.
Commercial revenue in 2009/10 decreased by €4.3m
On the pitch, Inter, under the management of the self- (8%) to €48.3m (£39.6m) owing to a reduction in both
proclaimed ‘Special One’, created history during the revenue received from the club’s kit supplier, Nike,
2009/10 becoming the first Italian side to win the and the value received from general club sponsors,
Scudetto, the Coppa Italia and the UEFA Champions partially offset by a €3.8m increase in the club’s shirt
League in a single season. sponsorship deal with Pirelli. Despite the €13.1m and
€13.8m received from Pirelli and Nike respectively,
This success generated matchday revenue of €38.6m Inter’s 2009/10 commercial revenue was only
(£31.6m), a €10.4m (37%) increase on 2008/09, the fourteenth highest amongst Money League clubs.
highest of all the Italian clubs, yet still only the twelfth
highest overall. Matchday revenue still only accounts for In 2010/11 Inter have already added the Italian
17% of the club’s total revenue and will need to be Supercup and the FIFA World Club Cup to their bulging
grown further if Inter are to climb higher in the Money trophy cabinet, but the departure of new manager
League. Plans were announced to redevelop the San Rafael Benitez after just six months in charge and a
Siro as part of Italy’s UEFA Euro 2016 bid, however as disappointing first half of the domestic season leaves
the bid was unsuccessful it remains to be seen if the the club with plenty to do if it is to emulate its
renovation plans will still go ahead. achievements of 2009/10 and climb higher in next year’s
Money League.
Football Money League 2011 Sports Business Group 1710. Juventus
Juventus: Revenue sources and percentages (€m)
8% 400
27%
300
200 231
203 205
168
141
100
65%
Matchday €16.9m (£13.8m) 0
Broadcasting €132.5m (£108.5m) 2006 2007 2008 2009 2010
Commercial €55.6m (£45.5m) Five year revenue totals
€205.0m 2009 Revenue €203.2m (£173.1m) will sponsor the home jersey with Italian confectioner
(£167.8m) 2009 Position (8) Balocco sponsoring the second jersey. The BetClic deal is
reportedly worth at least €15m (£12.3m) in total over
the two seasons to 2011/12, whilst the kit deal with
Reporting flat revenues in 2009/10, Juventus drop two Nike extends to 2015/16, delivering at least €12.4m
places to tenth position in the Money League. Despite a (£10.2m) per season. Juve has partially funded the new
second consecutive season in the UEFA Champions stadium’s €105m (£86m) construction cost through the
League, after a two year absence, the club lost its place sale of adjacent commercial land and through a
as the highest revenue generating Italian club falling commercial partnership with Sportfive, covering the
behind both Milan based clubs. exploitation of stadium naming rights and corporate
facilities at the new facility, worth a minimum of €75m
In spite of playing two fewer home games (25) at the (£61.4m) over a 12 year period.
Stadio Olimpico in 2009/10, matchday revenues nudged
upward to €16.9m (£13.8m). Average league Juve benefitted from €22.2m (£18.2m) of UEFA central
attendances were up 4%, rising to 23,186 following distributions, finishing third in the Group stage of the
Juve’s second place league finishing position in the UEFA Champions League, before being parachuted into
previous season. Ticket price increases contributed to the Europa League. At €132.5m (£108.5m) their total
the improvement in matchday revenue per match to broadcasting income remained almost unchanged from
€0.7m, but Juventus’ matchday revenues remain the the previous season. 2009/10 was also the final year of
weakest element of their business and they still only the club’s €100m+ per annum broadcasting contract
account for only 8% of total revenue. with Mediaset before Serie A returns to a collective basis
of selling broadcast rights in 2010/11.
However, by 2011/12 Juve expect to be playing in their
new 40,000 capacity stadium, which will assist them to Finishing seventh in Serie A brought the disappointment
increase matchday revenues considerably. The new of no Champions League football in 2010/11. This is
stadium will also provide enhanced opportunities to compounded by the negative revenue impact collective
boost non matchday revenues from events. rights selling is anticipated to bring Juventus, at least in
the short term. We therefore expect Juve to be out of
Commercial revenue increased marginally by €1.3m the top ten in next year’s Money League. The club will
(2%) to €55.6m (£45.5m) in 2009/10. Following the need on-pitch success including qualification for the
expiry of its shirt front sponsorship deal with New Champions League to regain a top ten place.
Holland Group, Juventus decided on a dual shirt front
sponsorship strategy. Sports betting company BetClic
1811. Manchester City
€152.8m 2009 Revenue €102.2m (£87.0m) Manchester City: Revenue sources and percentages (€m)
(£125.1m) 2009 Position (20)
400
37% 20%
Manchester City are the biggest climbers in this year’s 300
Money League, moving up nine places from 20th to
11th. Under the ownership of the Abu Dhabi United
200
Group, significant investment in the playing squad
translated into a fifth placed finish in the Premier 153
League, the club’s highest since the league began. As a 100
43% 104 102
89 85
result, the club recorded its highest ever revenues, with
an increase of £38.1m (44%) to £125.1m (€152.8m). Matchday €29.8m (£24.4m) 0
Broadcasting €66.0m (£54.0m) 2006 2007 2008 2009 2010
Commercial revenue more than doubled to £46.7m Commercial €57.0m (£46.7m) Five year revenue totals
(€57.0m) and was the principal driver of the club’s
overall revenue growth. 2009/10 was the first year of
improved shirt sponsorship and kit supply deals with Manchester City’s matchday revenue grew in the year by
Etihad Airways and Umbro respectively. The new Umbro £3.6m (17%) to £24.4m. This was in spite of the club
deal facilitated merchandising revenue growth of 60% having missed out on European qualification and thus
to £7.9m (€9.6m). The club has focused on expanding the number of home matches decreasing from 28 to 24
its commercial partnership portfolio, revenue from which in 2009/10. The reduction in the number of European
grew five fold in 2009/10, including deals with the Abu competition home matches was partially offset by
Dhabi Tourism Authority, Etisalat, and Aabar all of which successful and lucrative domestic cup campaigns,
are based in the Middle East. Further growth in this area including reaching the semi-final of the League Cup
is anticipated in 2010/11 as a result of additional deals, and the fifth round of the FA Cup. Matchday revenue
including those with Heineken and Jaguar. was also driven by increased average league home
match attendances, with a 6% increase to 45,512
(c.95% of capacity).
Despite receiving no European broadcast revenue, the
club’s improved performance in the Premier League and
an increase in the number of live televised games,
accounted for broadcasting revenue growing by £5.8m
(12%) to £54.0m. Premier League central distributions
for the year were £49.6m, an increase of £9.5m (24%)
on 2008/09, which was supplemented by broadcast
revenues from domestic cup campaigns.
City have raced to a record 11th position in the Money
League. The seemingly substantial gap (€52.3m)
between 10th (Juventus) and 11th looks bridgeable over
the next couple of years, particularly given the issues
faced by Juventus and Liverpool, although Premier
League rivals Tottenham Hotspur will also be pushing for
a top ten position in the immediate future. Crucial to the
next step up will be whether the heavy investment in
the playing squad is matched by on-pitch success, both
domestically and, more importantly in revenue terms,
through qualification for the UEFA Champions League.
Football Money League 2011 Sports Business Group 1912. Tottenham Hotspur
Tottenham Hotspur: Revenue sources and percentages (€m)
400
26%
31%
300
200
153 145 146
100 133
107
43%
Matchday €44.9m (£36.8m) 0
Broadcasting €62.9m (£51.5m) 2006 2007 2008 2009 2010
Commercial €38.5m (£31.5m) Five year revenue totals
€146.3m 2009 Revenue €132.7m (£113.0m) Central to increasing matchday revenue are Spurs’ plans
(£119.8m) 2009 Position (15) for a new stadium, with increased capacity and
improved corporate hospitality offerings. The club are
currently pursuing two routes. The Northumberland
Tottenham Hotspur move three places up the Money Development Project would see the club remain in
League to 12th after posting record revenue, in Sterling North London and provide a 56,250 seat stadium.
terms, of £119.8m (€146.3m), an increase of £6.8m Alternatively, the club has applied to become anchor
(6%) from 2008/09. Increases in broadcast (£6.7m) and tenant of the Olympic Stadium where they propose to
commercial (£2.8m) revenue were partially offset by a build a new 60,000 seat stadium.
decrease in matchday income (£2.7m) that resulted from
the club playing two fewer home games in 2009/10 Commercial revenue increased by £2.8m (10%) to
than the previous season. £31.5m (€38.5m) with 2009/10 being the final season
of the club’s shirt front sponsorship with Mansion worth
Spurs’ strong on-pitch performance secured them a a reported average of £8.5m per season. In 2010/11
fourth place finish in the Premier League and allowed Autonomy is the club’s new shirt sponsor in the Premier
them to qualify, via a play-off, for the UEFA Champions League, and Investec has that right in all domestic cup
League for the first time. The club subsequently won its and European competition matches. The deals are
play-off and beat Internazionale, the reigning champions, reportedly worth £10m and £2.5m per season
to win its group and progress to the knockout stage. respectively. Tottenham’s kit deal with Puma runs to the
end of the 2010/11 season, and reportedly generates
Broadcast income increased by £6.7m (15%) to £51.5m approximately £5m in revenue per season.
(€62.9m), despite playing no European football in
2009/10, as a result of the club’s best ever Premier Tottenham’s participation in the Champions League
League finishing position. could provide the springboard for them to break into
the top ten of the 2012 edition of Money League, with
Tottenham’s matchday revenue is constrained by the Juventus, Liverpool and Manchester City not featuring in
capacity of its stadium (36,240), with income per home Europe’s premier club competition in 2010/11. Spurs will
game of just £1.5m. hope that its transition to the top level of club football
will be matched with a stadium that allows it to make
the most of the accompanying opportunities and secure
a top ten place in our listing for the long term.
20You can also read